My Home is My Castle - The Benefits of Working from Home During a Pandemic Crisis: Evidence from Germany - Universität Bonn
←
→
Page content transcription
If your browser does not render page correctly, please read the page content below
Discussion Paper Series – CRC TR 224

                                       Discussion Paper No. 178
                                             Project B 06

               My Home is My Castle - The Benefits of Working
                   from Home During a Pandemic Crisis:
                         Evidence from Germany

                                          Jean-Victor Alipour 1
                                            Harald Fadinger 2
                                             Jan Schymik 3

                                                 June 2020

           1
             alipour@ifo.de, University of Munich and ifo Institute for Economic Research, D-81679 Munich
2
    harald.fadinger@uni-mannheim.de, Department of Economics, University of Mannheim, D-68161 Mannheim and
                                      Centre for Economic Policy Research (CEPR)
     3
       jschymik@mail.uni-mannheim.de, Department of Economics, University of Mannheim, D-68161 Mannheim

Funding by the Deutsche Forschungsgemeinschaft (DFG, German Research Foundation)
                  through CRC TR 224 is gratefully acknowledged.

                      Collaborative Research Center Transregio 224 - www.crctr224.de
                   Rheinische Friedrich-Wilhelms-Universität Bonn - Universität Mannheim
My Home is My Castle – The Benefits of Working
                from Home During a Pandemic Crisis:
                              Evidence from Germany

                 Jean-Victor Alipour‡                           Harald Fadinger¶
               University of Munich & ifo               University of Mannheim & CEPR
                                              Jan Schymik§
                                         University of Mannheim

                                                  June 2020

                                                   Abstract

          This paper studies the relation between work and public health during the COVID-19 pan-
      demic in Germany. Combining administrative data on SARS-CoV-2 infections and short-time
      work registrations, firm- and worker-level surveys and cell phone tracking data on mobility pat-
      terns, we find that working from home (WFH) is very effective in economic and public health
      terms. WFH effectively shields workers from short-term work, firms from COVID-19 distress
      and substantially reduces infection risks. Counties whose occupation structure allows for a larger
      fraction of work to be done from home experienced (i) much fewer short-time work registrations
      and (ii) less SARS-CoV-2 cases. Health benefits of WFH appeared mostly in the early stage of
      the pandemic and became smaller once tight confinement rules were implemented. Before con-
      finement, mobility levels were lower in counties with more WFH jobs and counties experienced
      a convergence in traffic levels once confinement was in place.

Keywords: COVID-19, SARS-CoV-2, Working from Home, Labor Supply Shock, Infections, Mit-
igation, BIBB-BAuA
JEL classification: J22, H12, I18, J68, R12, R23

We thank Andreas Steinmayr and seminar participants in Mainz and at the European Investment Bank for useful
comments. We also thank Sebastian Link for sharing helpful code to compile the ifo Business Survey. Funding by the
Deutsche Forschungsgemeinschaft (DFG, German Research Foundation) through CRC TR 224 (Project B06) and by
the ifo Freundesgesellschaft e.V. is gratefully acknowledged.
‡ alipour@ifo.de, University of Munich and ifo Institute for Economic Research, D-81679 Munich
¶ harald.fadinger@uni-mannheim.de, Department of Economics, University of Mannheim, D-68161 Mannheim and
Centre for Economic Policy Research (CEPR)
§ jschymik@mail.uni-mannheim.de, Department of Economics, University of Mannheim, D-68161 Mannheim

                                                        1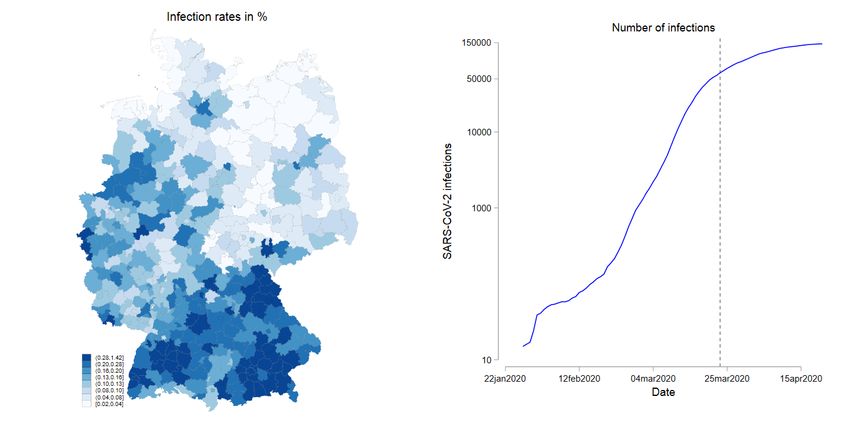
1    Introduction

The ongoing global COVID-19 pandemic is the most severe health crisis since the Spanish flue,
costing hundred thousands of lives worldwide. In parallel with the public health calamity, the
policies introduced by authorities to contain the spread of the virus have led to a harsh economic
downturn. By the first week of April 2020 over half of the global population was affected by some
type of confinement measure, resulting in a strong negative supply shock operating via a reduction
in the availability of labor. For example, during the months of March and April more than a third of
employees in Germany were put on short-time work or lost their job. Thus, finding policy measures
that allow the economy to operate smoothly while keeping infection rates low is a key challenge for
kick-starting the global economy and preventing potential future health crises.
In this paper we study the effectiveness of one specific policy, namely working from home (WFH,
telework, remote work), using data for Germany. Depending on the measure of telework employed,
between 9 and 56 percent of jobs in Germany can be done from home in the short- or medium-
run. Thus, workers’ potential for telework is quantitatively large. We show that working from
home is indeed a very effective measure to increase labor supply and to maintain a high level of
economic activity while keeping infection rates low. Our analysis implies that working from home
and confinement policies are substitutes: working from home is particularly effective in reducing
SARS-CoV-2 infections when confinement measures are absent or have already been lifted. This
has important implications for public policy: telework should be maintained as much as possible in
the reactivation phase of the economy, as long as infection risk remains non-negligible.
We first assess workers’ ability to work partially or fully from home at the occupation level using
detailed data from a pre-crisis employee survey run by the Institute for Vocational Education and
Training (BIBB) and the Institute for Occupation Safety and Health (BAuA) for around 17,000
individuals in 2018. Inspired by Autor et al. (2013) and Dauth et al. (2014), who exploit exogenous
variation in regional economic structure to assess the labor-market impact of economic shocks, we
then combine the occupation-level information with data on the regional- or industry-level employ-
ment composition to construct exogenous measures of the working from home ability for 401 German
counties and 88 NACE-2 industries. Depending on whether we focus on workers who frequently,
at least occasionally, or in principle could engage in telework, between 9 and 56 percent of workers
in the labor force can work from home, with a large variation across counties and industries. At
the individual level, WFH is mainly an option for high earners, in particular for jobs that require
frequent computer usage. At the regional level, workers’ skill composition and the employment
share in the tertiary sector are strong predictors for telework.
Using survey data on German firms collected during the COVID-19 pandemic, we then show that
our exogenous WFH measures are strongly correlated with actual take-up of telework during the
COVID-19 crisis. A one-standard-deviation larger fraction of teleworkable jobs in the industry is
associated with a 12 to 16 percentage point higher probability of firms taking up telework.
Moreover, regions, industries and firms with a higher WFH potential experienced substantially fewer

                                                  2
applications for the federal short-time work scheme. This scheme allows firms to cut labor costs by
providing wage subsidies to workers who have to reduce their working hours due to economic distress
of their employer. It has been the most important policy tool for short-run labor market adjustment
in Germany during the COVID-19 crisis, with firms filing for short-time work for more than 30
percent of total employment. The German short-time work scheme has been shown to be effective
in keeping unemployment low in previous recessions (Balleer et al., 2016). However, this comes at the
cost of generating significant allocative inefficiencies (Cooper et al., 2017). We find that an exogenous
one-standard-deviation increase in the WFH share reduces short-time work applications relative to
total employment by around 4.5 percentage points at the county level and by around 9 percentage
points at the industry level. At the firm level, we exploit survey information on short-time work
applications and take-up of telework during the COVID-19 crisis. We use our exogenous industry-
level WFH measure as an instrumental variable to provide causal evidence for the employment-
preserving effect of telework. Increased telework during the pandemic leads to a 50 to 71 percentage-
point reduction in the firm-level probability to file for short-time work. Thus, workers’ ability to
work from home is crucial to maintain economic activity during a pandemic shutdown. Furthermore,
increased telework lowers firms’ self-reported probability to be very negatively affected by COVID-
19 by up to 77 percentage points. While the productivity effects of telework in the context of the
COVID-19 crisis certainly depends on the workers’ family structure and the lack of access to child
care, this result is in line with Bloom et al. (2014) who show that workers who were exogenously
assigned to work from home actually became more productive. Overall, our results imply that the
supply-side restrictions imposed by confinement rules on firms and workers have been a key factor
for reduced economic activity and that telework strongly mitigates their negative effects.
In a next step, we investigate the impact of working from home on coronavirus infections both before
and after strict confinement rules were imposed in Germany. We exploit detailed weekly panel data
on SARS-CoV-2 infections and deaths from January 29 to April 15, 2020 for all 401 counties. Using
cross-sectional variation, we find that a one-standard-deviation exogenous increase in the WFH share
is associated with a 10 to 15 percent reduction in the infection rate and a 22 to 37 percent reduction
in the fatality rate, an arguably large effect. Moreover, the infection-reducing effect of working
from home is larger in the first weeks of the epidemic. Exploiting within-county variation, we find
an on average around 8 percent larger reduction in the infection rate before the confinement. The
effectiveness of WFH is also independent of differences in the confinement strictness across states.
These results are consistent with mobility data collected from a large German mobile phone provider.
Mobility patterns show that the level of work-related trips was systematically lower in high-WFH-
ability regions before confinement but that this differential disappeared once the lockdown was in
place and everyone stayed at home. Finally, we also show that our results on the infection-reducing
effect of telework before the confinement are robust to using a state-of-the-art dynamic spatial count
model borrowed from the epidemiology literature (Höhle, 2015, Meyer et al., 2017).
Our findings imply that working from home and confinement are substitutable policies. This has
important implications for the reactivation period of the economy: to keep infection rates low while
3maximizing the level of economic activity working from home should be a policy prescription as
long as significant infection risk remains present.
While SARS-CoV-2 infections were already present in February 2020, the pandemic started to really
pick up in Germany in early March with people returning from ski holidays in Austria and South
Tyrol (Felbermayr et al., 2020). Meanwhile, the authorities were gradually ratcheting up restrictions
on public life (see Weber, 2020 for details). On March 8, they recommended the cancellation of
all big public events. On March 16, most of Germany’s 16 states closed their schools and daycare
centers, trade fares and cultural events were prohibited, and external borders were closed. Finally,
all German federal states simultaneously imposed strict confinement measures on March 22 in a
coordinated way.1 The curfew was not equally strict in all states. Typically, it included prohibitions
of meeting people outside the same household and in some cases also limited the reasons to leave
the domicile (work, grocery shopping, medical visits and sport activities). Retails shops (with the
exemption of grocery shops and supermarkets), bars and restaurants, accommodation facilities and
businesses providing personal services had to close.2 Other businesses and manufacturing firms were
allowed to continue operation. Nevertheless, many businesses still closed down or severely restricted
their activities for various reasons, including the inability to meet prescribed hygiene and distance
measures, lack of demand, inability to source key inputs, and employees being unable to go to work
due to child-care obligations or for health reasons. Allowing workers to work from home whenever
possible was also officially recommended by authorities. Confinement was gradually lifted after May
4.
Our study relates to the literature studying telework and the effects of social distancing during the
COVID-19 pandemic. A comprehensive review of the rapidly expanding literature on the economic
effects of the COVID-19 crisis is beyond the scope of this paper. We thus mention just a few of the
most closely related studies.
First, we add to recent contributions quantifying the potential of jobs for telework. Dingel and
Neiman (2020) determine the teleworkability of occupations by assessing the importance of workers’
presence at the workplace using task information. Variants of this approach have been proposed
in other studies and extended to other countries.3 We draw instead on an administrative employee
survey that directly reports on workers’ home-working practices before the COVID-19 outbreak
(see Alipour et al., 2020). This survey approach ensures that assessments about the teleworkability
of jobs are based on workers’ own assessments and experiences. Möhring et al. (2020) and Von
Gaudecker et al. (2020) instead measure the endogenous take-up of WFH during the COVID-19
pandemic based on employee-survey data.
Second, we contribute to the literature studying the costs and benefits of social distancing. Barrero
et al. (2020) and Buchheim et al. (2020) use firm-level survey data to study how the COVID-19
1
Exceptions were Bavaria and Saxony, which started confinement already a day earlier.
2
Restaurant pick-up and online retail was still allowed.
3
See for instance Mongey et al. (2020), Yasenov (2020), Barbieri et al. (2020), Boeri et al. (2020) or Holgersen
et al. (2020).
4shock induced firms to adjust to the crisis. Papanikolaou and Schmidt (2020) show that industries
with high WFH shares experienced lower declines in employment and earnings forecasts. Based on a
survey of workers, Adams-Prassl et al. (2020) document a negative correlation between workers’ self-
reported share of teleworkable task and the probability of job loss during the COVID-19 pandemic.
In accordance with these results, we verify that our WFH proxies predict firm-level responses
in staffing (taking up WFH and short-time work registrations). Furthermore, we provide causal
evidence that an increase in WFH mitigates the negative impact of the crisis at the firm level,
both in terms of less short-time work registrations and economic distress. Barrot et al. (2020) and
Fadinger and Schymik (2020) study the output losses induced by negative labor supply shocks in
input-output models for France and Germany, respectively estimating a weekly loss of about 1%
(1.6 %) of French (German) GDP. We add to their results by providing empirical evidence that
WFH indeed mitigates negative labor supply shocks very effectively. Hartl et al. (2020) identify a
trend break in German SARS-CoV-2 infections growth subsequent to the implementation of social
distancing policies. In line with our infection-reducing effects of working from home, Chiou and
Tucker (2020) report that IT infrastructure in homes increases individuals’ ability to self-isolate.
Koren and Peto (2020) show that U.S. businesses that require face-to-face communication or close
physical proximity are particularly vulnerable to confinement. This is consistent with our finding
that those firms are also more likely to experience distress and register their workers for the German
short-time work scheme.
In the next Section, we describe the construction of regional and sectoral measures of WFH from
individual-level survey data and show that these measures strongly correlate with WFH take-up
during the COVID-19 crisis. In Section 3 we examine in detail the effect of exogenous variation in
WFH on region-, firm- and industry-level short-time work. In Section 4, we look at the relationship
between WFH and SARS-CoV-2 infections and fatalities at the county level, both before and after
confinement, and we study regional variation in mobility patterns during the COVID-19 crisis.
Finally, Section 6 presents our conclusions.
2 Measuring Working from Home in Germany
We are interested in the proportion and the geographical distribution of jobs that can be performed
at home in Germany. In the recent literature different approaches to measure working from home
(WFH) feasibility have emerged. One set of studies draw on country-specific surveys that directly
report on workers’ home-working practices before the COVID-19 outbreak (Alipour et al., 2020,
Hensvik et al., 2020, Watson, 2020, Irlacher and Koch, 2020). Alternatively, Dingel and Neiman
(2020) determine the teleworkability of occupations by assessing the importance of workers’ presence
at the workplace using task information from O*NET (Occupational Information Network).4 The
main advantage of the survey approach compared to using task information is that assessments
4
Variants of this measure have been proposed by other studies and for other countries (Mongey et al., 2020,
Yasenov, 2020 Barbieri et al., 2020 , Boeri et al., 2020, Holgersen et al., 2020, Fadinger and Schymik, 2020).
5about the teleworkability of jobs are independent of researchers’ plausibility judgments but instead
based on workers’ own assessments.
We thus follow Alipour et al. (2020) and combine worker-level information from the 2018 wave of the
BIBB/BAuA Employment Survey with employment counts from the Federal Employment Agency
(BA) to measure homeworking patterns across 401 counties (Kreise and kreisfreie Städte).5 The
employment survey contains rich information about worker characteristics and the nature of their
jobs. We restrict the sample of respondents to 17,160 employed individuals aged 18-65 (excluding
marginal and self-employment) who report about their working from home habits. Based on this
information, we compute three measures: First, an indicator variable that identifies individuals who
work from home “always” or “frequently” (WFH freq). Second, an indicator for respondents who
report working at home at least occasionally (WFH occ). And third, a dummy identifying employees
who have ever worked from home or who do not exclude the possibility of home-based work, provided
the company grants the option (WFH feas).6 The latter measure hence identifies jobs which can
(at least partly) be done from home, independently of a worker’s previous homeworking experience.
Consequently, we interpret the proportion of WFH feas in the overall workforce as an upper bound
for the share of employees who may work from home during the crisis. As switching to remote work
during the pandemic is arguably associated with transition costs, we conjecture that frequent and
occasional homeworkers will be able to use telework earlier and to a greater extent than employees
who have no previous homeworking experience. We therefore interpret WFH freq as a lower-bound
estimate for the share of employees actually working remotely during the pandemic.
2.1 Who Can Work from Home? Individual-Specific Variation
Table 1 reports conditional correlations from regressing binary indicators for WFH freq and WFH
feas at the worker level on individual characteristics and a set of occupation and sector fixed effects.7
Occupational variation alone explains 21% and 27% of the variation in WFH freq and WFH feas,
respectively (columns 1 and 4). Including individual characteristics (columns 2 and 5) and a set of
industry dummies (columns 3 and 6) does not substantially add to the overall explanatory power in
terms of R2 . In terms of workplace characteristics, having management responsibilities and using
computers at work are strongly associated with the possibility to work from home. The result is
in line with previous findings that WFH is mainly possibly in jobs requiring cognitive, non-manual
tasks (Mergener, 2020). Holding an academic degree also increases the chance of both having a
WFH feasible job and actually engaging in remote work. By contrast, marital status and having
children in the household do not significantly impact the likelihood of having a teleworkable job;
5
The survey is jointly carried out by the German Federal Institute for Vocational Education and Training (BIBB)
and the German Federal Institute for Occupation Safety and Health (BAuA). The 2018 wave contains information
about 20,012 individuals surveyed between October 2017 and April 2018; for more details see Hall et al. (2020).
6
Specifically, individuals were asked: “If your company allowed you to work at home temporarily, would you accept
this offer?” – Yes; No; Is not possible with my work.
7
Since this is a linear probability model, the coefficients on binary covariates can be interpreted as percentage-point
changes in the probability of WFH when the dummy is switched on.
6however, these factors affect the selection into actually taking up remote work. Finally, we find no
significant gender differences within occupations.
Observe that WFH is mainly an option for high earners. In the top quintile of the wage distribution
more than 80% of workers could work from home at least temporarily, and about 60% actually did so
before the pandemic. By contrast, only 45% of workers in the bottom quintile have a teleworkable
job, with less than 20% having any remote work experience. This disparity coincides with the
differences across professional qualifications (see Figure 8 in the Appendix). In terms of industry
variation in WFH, the share of teleworkable jobs is highest in the service sector, which also has the
highest share of frequent PC users (76% versus 65% in the rest of the economy).
Table 1: Conditional Correlations between WFH and Worker Characteristics
WFH frequently WFH feasible
(1) (2) (3) (4) (5) (6)
Female -0.01 -0.01 0.01 0.01
(0.01) (0.01) (0.01) (0.01)
Migrant -0.03*** -0.03*** -0.02 -0.02
(0.01) (0.01) (0.02) (0.02)
Married 0.02*** 0.02*** 0.01 0.01
(0.01) (0.01) (0.01) (0.01)
Children 0.02*** 0.02*** 0.01 0.01
(0.01) (0.01) (0.01) (0.01)
Academic degree 0.08*** 0.08*** 0.18*** 0.17***
(0.01) (0.01) (0.01) (0.01)
Part-time 0.00 0.00 -0.01 -0.01
(0.01) (0.01) (0.01) (0.01)
Manager 0.04*** 0.04*** 0.07*** 0.08***
(0.01) (0.01) (0.01) (0.01)
PC usage 0.05*** 0.05*** 0.15*** 0.15***
(0.01) (0.01) (0.02) (0.02)
Occupation F.E yes yes yes yes yes yes
Sector F.E no no yes no no yes
R2 0.21 0.23 0.24 0.27 0.31 0.31
Observations 17,130 16,065 15,938 17,112 16,046 15,920
Notes: The dependent variable in columns (1) - (3) is a binary variable identifying workers who report working
from home “frequently” or “always” (WFH freq). The dependent variable in columns (4) - (6) is an indicator
identifying workers who ever work from home or who do not exclude the possibility of doing so, provided the
employer grants the option (WFH feas.). Migrant, Children and Manager take the value 1 for employees with
migration background, children below the age of 13 living in the household, or with personnel responsibility,
respectively. PC usage and academic degree are 1 for respondents who use a PC for work or who hold a university
degree, respectively. Part-time is an indicator identifying workers with contractual working time of less than 30
hours per week. Other control variables include age, age-squared and an ordinal variable for 3 plant size categories
(outputs suppressed). Occupation fixed effects include 37 categories at the 2-digit KldB level. Sector fixed effects
include 21 NACE rev.2 categories. Regressions use population weights. Robust standard errors reported in
parentheses. Data are from the BIBB/BAuA Employment Survey 2018. *** p < 0.01, ** p < 0.05, * p < 0.1
7Table 2: Summary Statistics of WFH Measures at the County-Level
Mean Std. Dev. Min 25th Median 75th Max
WFH feasible (WFH feas) 52.69 4.18 45.55 49.73 51.50 54.82 67.47
WFH occasionally (WFH occ) 23.52 3.04 18.40 21.47 22.54 24.82 36.14
WFH frequently (WFH freq) 8.47 1.33 5.98 7.56 8.02 8.99 14.30
Notes: The table reports descriptive statistics for our three WFH measures across 401 NUTS-3 regions in Germany.
2.2 Regional Variation in Working from Home
In order to derive the geographical distribution of teleworkable jobs, we aggregate our measures
to the occupational level (based on 36 KldB-2010 2-digit occupations, excluding military services)
and combine the resulting shares with information from the Federal Employment Agency (BA)
on the composition of occupations in each county.8 County-specific WFH shares are subsequently
computed as a weighted average over occupations. Hence, by construction, regional differences in
WFH feasibility are determined exclusively by county-level differences in occupational composition.
Remember that the bulk of the individual-specific variation in telework that can be explained by
observables is due the occupational variation. Our region-specific WFH measures thus exploit most
of the individual-specific variation in telework. In the aggregate, about 9% of employees work from
home on a regular basis, 26% do so at least occasionally, and 56% have jobs which in principle can
be partly or completely performed at home. Table 2 reports detailed summary statistics of our
regional WFH measures.
The geographical distribution of pre-crisis frequent homeworkers (WFH freq) across 401 NUTS-3
regions is depicted in Figure 1. The share of teleworkable jobs measured by any metric is higher in
more urban, more affluent counties. Local GDP per capita and WFH freq are strongly correlated at
about 0.50. The association of WFH with higher education and employment in the service sector
is particularly striking at the regional level. The correlation with WFH freq is about 0.9 and 0.7,
respectively (see Figure 9 in the Appendix), indicating a high degree of co-linearity. Together these
two variables explain almost 90% of the regional variation of WFH freq.
2.3 Working from Home Measures and Adoption of Firm-Level Remote Work
During the COVID-19 Crisis
The COVID-19 crisis has forced many companies to embrace remote work within a short period
of time. Recent surveys document that the proportion of the workforce working from home has
indeed dramatically increased in Germany. For instance, in an online survey of more than 85,000
8
Employment counts by county and occupation are taken from the German Federal Employment Agency’s June
2019 regional employment report (Regionalreport über Beschäftigte). See Table 17 in the Appendix for occupation-
specific WFH shares.
8Figure 1: Geographical Distribution of Pre-Crisis Frequent Homeworkers
Notes: The map depicts the percentage share of frequent homeworkers (WFH freq) across NUTS-3 regions in
Germany. Data are from BIBB/BAuA Employment Survey 2018 and Employment Statistics of the Federal
Employment Agency (BA) 2019.
individuals across several EU states, 37% of German respondents reported to have started telework
as a result of the COVID-19 crisis (Eurofound, 2020).9
To investigate if our WFH measures are associated with actual changes in telework patterns during
the COVID-19 crisis, we test if firms in industries with a larger fraction of teleworkable jobs ac-
cording to our measures are more likely to expand WFH during the COVID-19 crisis. To this end,
we draw on the April 2020 wave of the ifo Business Survey (IBS). The IBS is a monthly representa-
tive survey of German firms which collects data on various company parameters as well as current
business conditions and business expectations (see Buchheim et al. (2020) and Sauer and Wohlrabe
(2020) for a more detailed description of the survey).10 In April 2020 roughly 6,000 firms were
questioned about the business impact of and the managerial responses to the COVID-19 pandemic.
Among a list of non-exclusive mitigation measures, the most frequently mentioned response was the
intensified use of telework.11 Overall, almost two third of the companies stated increased reliance
9
Schröder et al. (2020) find that across all employed persons, around 34% worked partly or completely from home
in April 2020. This share reaches even 60% among employees with an university degree. Kohlrausch and Zucco (2020)
surveyed 7,677 persons in April 2020 and find that the share of employees working mainly onsite dropped from 87%
to 55% for women and from 79% to 51% for men.
10
We use a harmonized version of the data following the harmonization procedure proposed by Link (2020).
11
Other answers included, e.g., “introducing short-time work”, “reduction of time accounts and leave days”, “Cut
of employment”, “application for public liquidity facilities”, “postponement of investments” and “cancellation of
investments”.
9on telework as part of their strategy to cope with the crisis. Using this information allows us to
compare firms’ responses with our WFH measures computed at the industry level. To calculate
sectoral WFH shares, we use information from the Federal Employment Agency (BA) on the sec-
toral composition of occupations and apply the same approach as for the calculation of county-level
WFH shares (see Section 2).
Table 3 reports the coefficients from regressing a firm-level indicator identifying firms who reported
intensified telework on our industry-level WFH measures. To make our WFH measures quantita-
tively comparable with each other, we normalize them to mean zero and a unit standard deviation
(z-scores). All specifications include controls for firm-size (5 size categories), the share of sales gen-
erated abroad, fixed effects for the date of survey completion, location fixed effects at the county
level and survey fixed effects, which correspond to the broad industry segments Services, Whole-
sale/Retail, Construction and Manufacturing (coefficients not reported). In the even columns we
additionally control for firms’ average state of business as well as expected business conditions for
the next six months during the forth quarter of 2019. We hence take into account firms’ pre-crisis
conditions, which are likely to affect the choice of mitigation strategies during the pandemic. Busi-
ness states and outlooks are elicited on a ordinary scale (negative, neutral, positive). Moreover, we
add a dummy for firms operating in a sector that was subject to a mandatory shutdown. To account
for demand-side effects of the crisis, we also include a dummy equal to one if a firm reports that the
crisis has adversely affected demand. As the question is not put to firms in the construction sector
we report the results separately in Table 18 in the Appendix. In all specifications standard errors
are clustered at the 2-digit NACE level.
Columns (1), (3) and (5) show that a higher industry share of WFH measured by any of our proxies
is associated with a statistically highly significant increase in the probability to expand remote
work during the crisis. In terms of magnitudes, increasing WFH freq by one standard deviation
increases the probability that a firm intensifies remote work during the COVID-19 crisis by 12.22
percentage points. The effects for WFH occ (14.88 p.p.) and WFH feas (15.72 p.p) are even larger.
The coefficient magnitudes are just slightly reduced and remain highly significant when controlling
additionally for pre-crisis conditions and the shutdown dummy in columns (2), (4) and (6). The
effect of mandatory business closures is strongly negative, which is explained by the fact that firms
operating in sectors such as accommodation, restaurants and retail trade do not rely much on
telework. Finally, firms reporting an unfavorable state of business before the crisis are less likely to
take-up of remote work relative to firms in a neutral state.
In principle, firms can expand telework both at the intensive and the extensive margin, i.e., by
increasing the number of hours that each employee works at home or by introducing employees
without previous teleworking experience to remote work. As WFH feas captures WFH feasibility
independently of previous experience, the estimates in column (5) and (6) can be interpreted as the
combined effect at both margins. Columns (7) and (8) distinguish between the share of workers with
pre-crisis WFH experience (WFH occ) and those without WFH experience but with a teleworkable
10job (WFH unexploited ).12 Both coefficients are positive and significant at the one-percent level,
indicating that firms indeed expanded remote work at both margins. The estimate associated with
WFH occ in column (7) suggests that a one-standard-deviation increase in the share of workers with
pre-crisis telework experience is associated with a 11.88 p.p. increase in the probability to intensify
remote work. By contrast, a one-standard-deviation increase in the share of unexploited WFH
potential translates in a much smaller probability increase to intensity remote work of 5.69 p.p. The
weaker extensive-margin response plausibly reflects adjustment costs from newly setting up remote
workplaces and the fact that, by our definition, not every teleworkable job is necessarily suitable for
full-time remote working. Overall, the evidence strongly supports that our WFH measures capture
actual telework expansion at the firm level during the COVID-19 crisis.
3 Working from Home and Labor Market Adjustments in Ger-
many during the COVID-19 Crisis
To contain the spread of the coronavirus, the German government enforced drastic social distanc-
ing measures. Many companies, especially in the hospitality, food services and retail sector were
subjected to mandatory shutdowns to mitigate infection risks. At the same time, a large fraction of
firms switched to remote work to minimize exposure of their workers to the virus (see Section 2.3).
The consequences of the economic shock are reflected in the employment statistics. In Germany,
filings for short-time work (STW) allowances reached a historic level. The short-time work scheme
(Kurzarbeit) enables companies in “inevitable” economic distress to cut labor costs by temporarily
reducing their employees’ regular working hours by up to 100% instead of laying them off. Up to
67% of employees’ foregone earnings are subsequently compensated by the Federal Employment
Agency through the unemployment insurance fund. Previous research indicates that short-time
work schemes can be very effective in retaining employment and avoiding mass layoff during eco-
nomic crises (see e.g. Balleer et al., 2016; Boeri and Bruecker, 2011). In March and April 2020,
STW applications for 10.7 million workers were filed, corresponding to 31% of total employment in
September 2019.13 In comparison, this number reached only 3.3 million during the Great Recession
in 2008/2009 (Bundesagentur für Arbeit, 2020). Finally, in Germany most of the short-run labor
market adjustments to the COVID-19 shock occurred in terms of short-time work expansions and
only very little happened via an increase in unemployment.14
The key question we address in this Section is whether the possibility to work remotely mitigates
the COVID-19 shock by increasing the likelihood that workers can continue to do their job instead
of being put on short-time work. We examine this relationship by estimating the impact of WFH
12
Specifically, unexploited WFH is defined as the difference between the sector-level shares of WFH feas and WFH
occ.
13
The proportion is essentially identical when measured relative to employment in June 2019, which represents our
reference period.
14
In contrast to the unemployment surge in the U.S. (see Coibion et al., 2020), the net number of unemployed in
Germany increased by less than 250,000 in March and April 2020.
11Table 3: Intensified Telework Due to COVID-19 and WFH Potential – Firm-Level Evidence
(1) (2) (3) (4) (5) (6) (7) (8)
WFH freq (z-score) 12.22*** 9.58***
(1.99) (1.00)
WFH occ (z-score) 14.88*** 11.46*** 11.88*** 9.61***
(2.70) (2.08) (1.92) (1.78)
WFH feas (z-score) 15.72*** 12.33***
(2.16) (1.52)
WFH unexploited (z-score) 5.69*** 4.13***
(1.74) (1.30)
Mandatory shutdown -25.78*** -20.85** -18.46** -18.54**
(9.62) (8.01) (7.12) (7.18)
Business outlook 2019Q4
negative -1.96 -1.65 -1.29 -1.32
(1.53) (1.52) (1.50) (1.51)
positive 4.48*** 4.50*** 4.59*** 4.57***
(1.60) (1.61) (1.62) (1.62)
State of business 2019Q4
negative -4.01*** -3.89*** -3.71*** -3.73***
(1.38) (1.38) (1.39) (1.40)
positive 1.05 0.48 0.32 0.33
(1.81) (1.68) (1.56) (1.57)
County F.E. yes yes yes yes yes yes yes yes
R2 0.29 0.33 0.31 0.34 0.32 0.34 0.32 0.34
Firms 6,580 5,649 6,580 5,649 6,580 5,649 6,580 5,649
Notes: The dependent variable is an indicator (rescaled by 100) identifying firms who report an intensified usage
of telework in response to the COVID-19 crisis in April 2020. WFH is the z-score (mean 0, standard deviation
1) of the percentage share of employees in the NACE-2 industry with jobs that are feasible for telework (WFH
feas) or who either occasionally (WFH occ) or frequently (WFH freq) work from home as defined in Subsection 2.
The variable WFH unexploited represents the share of workers with a teleworkable job but without any previous
remote working experience. Controls include a dummy variable identifying firms operating in a sector subject
to mandatory business closures, controls for pre-crisis business conditions and expected future state of business
in Q4 2019 (relative to a neutral state) and location fixed effects at the county level. Additional controls (not
reported) include firm size fixed effects (5 size categories), the share of sales generated abroad, fixed effects for the
date of survey completion and survey fixed effects (Construction, Wholesale/Retail, Service and Manufacturing).
Data are from the ifo Business Survey. Standard errors clustered at the NACE-2 level reported in parentheses.
*** p < 0.01, ** p < 0.05, * p < 0.1
on short-time work applications first at the regional and then at the industry and the firm level. To
this end, we source comprehensive administrative records on STW applications in March and April
2020, at the NUTS-3 level from the Federal Employment Agency (Bundesagentur für Arbeit).
3.1 Working from Home and Short-time Work: Regional and Industry Evidence
We start by analyzing the relationship between STW applications and WFH at the regional level.
Figure 2 plots the raw correlation between the share of employees affected by STW and the frac-
tion of frequent teleworkers (WFH freq) across 401 counties. As is apparent from the Figure, the
relationship is strongly negative, indicating that regions with a higher level of WFH freq have fewer
12STW applications relative to their workforce.
When interpreting the negative relationship between working from home and short-time work as
causal, one may be concerned about endogeneity for two reasons. First, regions hit more harshly
by the pandemic likely have a larger fraction of short-time work applicants, as more firms are
forced to shut down, and at the same time also have a larger share of workers working remotely for
safety reasons. Note that our WFH measures are completely insulated from such reverse causality
because they are based on interactions between pre-Corona occupation-level variation in telework
and regional occupational employment composition. Second, there may be omitted regional char-
acteristics that are negatively correlated with the STW application shares and positively with the
fraction of teleworkable jobs. For example, rural areas may have a lower infection risk due to low
population density and thus less short-time work and at the same time also a higher share of tele-
workers due to high commuting costs. We thus control for a wide range of region-specific covariates
that are plausibly related to STW applications and working from home. These include county-level
income, productivity and density measures (log GDP, log labor productivity, log population, log
settled area), age structure (the share of working age population, the share of residents older than
74), infrastructure (the fraction of (in- and outward) commuters in the local workforce and the
reachability of the nearest international airport). We further control for regional sector composition
by including the employment shares in the Accommodation and Food Services (NACE section I),
Manufacturing (C), Wholesale/Retail (G) and the financial sector (K), respectively. See Table 16
in the Appendix for details on variable sources and reference dates.
Table 4 reports the corresponding OLS coefficient in column (1) together with the analogous esti-
mates for our remaining WFH measures in the other odd columns. Again, to make the coefficients
for the three measures comparable, we transform them to z-scores. The even columns add county-
level controls. We weight county-level regressions with population weights to give more importance
to larger counties. This allows us to recover the conditional mean association between STW ap-
plications and telework at the individual level. The relationship between WFH capacity and STW
applications is negative and significant at the one-percent level across all specifications. A one-
standard-deviation increase in WFH freq results in a reduction of the number of STW applications
relative to the total regional work force of 2.52 percentage points, which is substantial. The magni-
tude of the coefficient slightly drops to 2.03 p.p. when controlling for county characteristics (column
2).15 Similarly, a one-standard-deviation increase in WFH occ decreases the STW share by 2.17 p.p
(2.16 p.p. when including controls) (columns 3 and 4). Finally, a one-standard-deviation increase
in WFH feas is associated with a 1.91 p.p. (1.84 p.p) drop in the STW share (columns 5 and 6).
The results hence strongly support the hypothesis that regions with a larger share of employees who
can work remotely are less affected by short-time work.
To provide further evidence that regional variation in STW applications is indeed driven by ex-
ogenous variation in the regional occupation composition, we now analyze the relationship between
15
The estimates are robust to measuring STW shares relative to employment in September or March 2019 instead
of June 2019.
13administrative STW applications and our WFH measures at the industry level. To this end, we ag-
gregate STW applications at the NACE-2 industry level and correlate them with our industry-level
WFH measures. If industries with higher WFH shares suffered a smaller reduction in labor supply
because their workers could continue to work safely from home, they would be hit less severely
by the COVID shock. Table 5 reports the results of regressing industry-level STW shares on our
WFH measures (normalized to z-scores). The negative association between WFH shares and STW
applications is even stronger at the industry level than at the region level: a one-standard-deviation
increase in WFH freq is associated with a 4.46 p.p. drop in the industry-level STW application
share. The magnitudes of this effect are even larger when using the other WFH measures (-6.68
p.p and -8.13 p.p.).
Figure 2: WFH and Short-Time Work During the COVID-19 Crisis
Notes: The figure depicts the linear fit between the share of workers affected by short-time work and the pre-crisis
share of frequent homeworkers (WFH freq) across 401 NUTS-3 regions. STW shares are defined as the ratio
of the total number of persons mentioned in short-time work applications in March and April 2020 relative to
employment in June 2019. Counties are weighted with total population. Employment and short-time work data
are from the Federal Employment Agency (BA).
3.2 Working from Home and Short-Time Work: Firm-Level Evidence
Next, we analyze the relationship between STW applications and our WFH measures at the firm
level drawing on data from the April 2020 wave of the ifo Business Survey, discussed in Section 2.3
above. The IBS not only includes the indicator for intensified use of telework, but also a question
if firms have responded to the COVID-19 crisis by filing for short-time work. Overall, about half of
the firms report using the short-time work scheme.
14Table 4: Short-Time Work and WFH During the COVID-19 Crisis – County-Level Evidence
(1) (2) (3) (4) (5) (6)
WFH freq (z-score) -2.52*** -2.03***
(0.41) (0.76)
WFH occ (z-score) -2.17*** -2.16***
(0.44) (0.77)
WFH feas (z-score) -1.91*** -1.84**
(0.48) (0.88)
Controls no yes no yes no yes
R2 0.16 0.38 0.13 0.37 0.10 0.37
Population weights yes yes yes yes yes yes
NUTS-3 regions 401 390 401 390 401 390
Notes: Dependent variable is the percentage of the total number of persons mentioned in short-time work appli-
cations in March and April 2020 relative to employment in June 2019. Control variables include log GDP, log
labor productivity, log population, log settled area, the share of working age population, the share of residents
older than 74, the fraction of (in- and outward) commuters in the local workforce, the reachability of the nearest
international airport and the share of employment in the Accommodation and Food Services, Manufacturing,
Wholesale/Retail and the financial sector, respectively. Regions are weighted with total population. Employment
and short-time work data are from the Federal Employment Agency (BA). Robust standard errors reported in
parentheses. *** p < 0.01, ** p < 0.05, * p < 0.1
Table 5: Short-Time work and WFH During COVID-19 Crisis – Industry-Level Evidence
(1) (2) (3)
WFH freq (z-score) -4.45***
(1.32)
WFH occ (z-score) -6.68***
(2.14)
WFH feas (z-score) -8.13***
(2.81)
R2 0.06 0.10 0.13
NACE-2 Industries 88 88 88
Notes: Dependent variable is the percentage of the total number of persons mentioned in short-time work ap-
plications in March and April 2020 relative to employment in June 2019. Industries are weighted with total
employment in June 2019. Industry-level information on employment and short-time work are obtained from the
Federal Employment Agency (BA). Robust standard errors reported in parentheses. *** p < 0.01, ** p < 0.05, *
p < 0.1
15Compared to using the regional- or industry-level variation, the firm-level analysis has several advan-
tages. First, we have firm-level measures of both, short-time work and telework available. However,
firms that are affected more severely by the COVID-19 crisis likely respond by filing for short-time
work, while also relying on the increased use of telework. This would lead us to underestimate
the employment preserving effect of working from home in an OLS regression. Fortunately, we can
use our exogenous measures of industry-level WFH as an instrument for take up of telework that
is orthogonal to firms’ idiosyncratic COVID-19 shocks and, as shown above, strongly correlated
with increased use of telework. Since firms expanded WFH both at the intensive and the extensive
margin (see Table 3), we useWFH feas, which measures the overall share of teleworking jobs in a
given industry, as our preferred instrument. Second, the firm-level analysis allows us to cleanly sep-
arate supply from demand shocks. On the one hand, telework may mitigate the reduction in labor
supply due to confinement and thus lead to reduced STW applications. On the other hand, firms
may experience negative demand shocks that lead to a fall in output and an increase in STW. This
would lead to a spurious positive correlation between WFH and STW if negative demand shocks
are larger in sectors with a low WFH share. This is a concern in particular for the restaurant, retail
and hospitality sectors. In some specifications we thus directly control for the self-reported impact
of the COVID-19 crisis on firms’ demand.
Table 6 presents reduced-form, OLS and IV regressions of the firm-level indicator for STW appli-
cation on the firm-level indicator of intensified telework, using WFH feas as an instrument. These
regressions include the same fixed effects and controls as those in Table 3 (see Section 2.3 above and
the table notes for details). To additionally control for demand-side effects of the crisis we further
add an indicator for firms who report that the crisis has negatively affected demand. Since this
information is not available for firms in the construction sector, we separately report the results in
columns (1) - (3) of Table 19 in the Appendix. In columns (1) and (2), we report the reduced-form
result of directly regressing the outcome variable on the instrument. WFH feas is negatively corre-
lated with the firm-level probability to file for STW and significant at the one-percent level. This is
robust to controlling for the state of business, the business outlook and a dummy for the industry
being subject to mandatory shutdown. Columns (3) and (4) report the OLS results: the firm-level
indicator for intensified telework is negatively correlated with the probability to file for STW and
significant at the one- (column 3) or ten-percent level (column 4). Using increased telework reduces
the probability of filing for STW by 11 (4) percentage points. However, as explained above, the
OLS estimate is likely to be downward biased in absolute magnitude due to unobserved idiosyn-
cratic Corona shocks. Indeed, the IV estimates presented in columns (5) and (6) are substantially
larger and significant at the one-percent level: relying on increased telework reduces the firm-level
probability to rely on short-time work by 71 (50) percentage points. Finally, controlling for the
demand-side shock of the crisis does not affect the results (Table 19). Firms experiencing a drop
in demand due to the crisis are significantly more likely to apply for short-time work. The same is
true for firms that report a bad state of business before the crisis. Overall, our results show that
working from home is extremely effective in reducing short-time work filings.
16We argued that the IV estimates of telework on STW applications correct for the fact that firms
applying for STW tend to be hit particularly hard by the COVID-19 shock. We provide direct
evidence for this by exploiting information on the self-assessed severity of the COVID-19 crisis from
the IBS. Indeed, about 30% of the firms state a “very negative” impact of the crisis to business
in April 2020. Table 7 reports OLS and IV results from regressing an indicator identifying these
firms on a dummy for companies who intensified telework during the crisis and on our instrument
WFH feas. We again control for firm size, firm location, firms’ export share and survey fixed
effects (coefficients not reported). The even columns additionally include a dummy for mandatory
shutdown and pre-crisis business state and business outlook. Again, we separately report the
results for specifications which control for the demand-side shock of the crisis, as we do not have
the information for firms in the construction sector (see columns 4 - 6 of Table 19 in the Appendix).
The OLS estimates indicate that increased telework is negatively correlated with being negatively
affected by the COVID-19 shock (a 7 to 15 percentage point reduction). However, this effect is much
smaller than the causal IV estimate, according to which the intensified use of telework reduces the
probability of the firm being very negatively affected by the COVID-19 crisis by 50 to 71 percentage
points (columns 5 and 6). The results further indicate that firms who appear weaker before the
crisis are also more strongly affected by the COVID-19 shock. A negative (positive) state of business
in Q4 of 2019 increases (reduces) the likelihood of a very negative COVID-19 impact by 9.8 (9.3)
percentage points relative to a neutral business state before the crisis (column 6). These findings
are in line with Buchheim et al. (2020) who show that the crisis has reinforced preexisting business
weaknesses. Finally, controlling for the demand side-effect of the crisis does not substantially change
the results. Firms experiencing a demand drop are more likely report a very negative impact of the
crisis (Table 19). Overall, the results suggest that the expansion of telework during the crisis had
a sizable mitigating effect on the severity of the COVID-19 shock for firms.
4 Working from Home and the Spread of COVID-19 across Ger-
man Counties
We now turn to the impact of working from home on SARS-CoV-2 infections. We expect working
from home to reduce coronavirus infections for the following reasons. A higher WFH share at the
county level is associated with a smaller fraction of workers working on site. This directly reduces
the contact rate – defined as the average number of contacts of an infected individual, which is a
key parameter in infectious disease models (Giesecke, 2002) – by reducing the number of personal
contacts both at work and while commuting. In addition, a larger share of workers engaging in
telework also allows co-workers who have to work on site keeping more physical distance, thereby
also reducing transmission of the disease between these workers. In this section we study the
effectiveness of WFH in reducing SARS-CoV-2 infections empirically.
17Table 6: Effect of Working from Home on Short-Time Work – Firm-Level Evidence
RF OLS IV
(1) (2) (3) (4) (5) (6)
Intensified telework -11.03*** -4.06* -71.11*** -49.80***
(3.86) (2.18) (11.22) (14.72)
WFH feas (z-score) -11.18*** -6.14***
(2.66) (1.68)
Mandatory shutdown 28.12*** 33.44*** 18.92**
(5.90) (6.26) (7.16)
Business outlook 2019Q4
negative 2.11 2.58 1.46
(2.00) (2.10) (2.33)
positive 2.03 2.10 4.31*
(2.11) (2.11) (2.22)
State of business 2019Q4
negative 12.31*** 12.47*** 10.46***
(1.82) (1.89) (2.10)
positive -10.00*** -10.45*** -9.84***
(1.56) (1.65) (1.62)
County F.E. yes yes yes yes yes yes
R2 0.14 0.20 0.12 0.19
Wald F 52.92 65.65
N 6,580 5,649 6,580 5,649 6,580 5,649
Notes: The dependent variable is an indicator (rescaled by 100) identifying firms who participated in the Short-
Time Work scheme due to the COVID-19 crisis in April 2020. WFH feas is the z-score (mean 0, standard deviation
1) of the percentage share of employees in the NACE-2 industry with jobs that are feasible for telework (WFH
feas) as defined in Subsection 2. Intensified telework is a binary variable identifying firms who report an intensified
usage of telework in response to the COVID-19 crisis in April 2020. Controls include a dummy variable identifying
firms operating in a sector subject to mandatory business closures, controls for pre-crisis business conditions and
expected future state of business in Q4 2019 (baseline: neutral) and location fixed effects at the county level.
Additional controls (not reported) include firm size fixed effects (5 size categories), the share of sales generated
abroad, fixed effects for the date of survey completion and survey fixed effects (Construction, Wholesale/Retail,
Service and Manufacturing). Data are from the ifo Business Survey. Standard errors clustered at the NACE-2
level reported in parentheses. *** p < 0.01, ** p < 0.05, * p < 0.1
18Table 7: Effect of Working from Home on Severity of COVID-19 Shock – Firm-Level Evidence
RF OLS IV
(1) (2) (3) (4) (5) (6)
Intensified telework -15.03*** -7.18*** -77.12*** -38.50***
(4.71) (2.48) (14.06) (14.25)
WFH feas (z-score) -12.23*** -4.90***
(3.44) (1.74)
Mandatory shutdown 41.29*** 44.33*** 34.72***
(7.18) (7.48) (6.52)
Business outlook 2019Q4
negative 3.47** 3.69** 2.68*
(1.41) (1.42) (1.45)
positive 0.31 0.65 2.41
(2.10) (2.04) (2.50)
State of business 2019Q4
negative 11.46*** 11.40*** 9.76***
(2.71) (2.82) (2.93)
positive -9.17*** -9.51*** -9.27***
(2.04) (2.05) (1.92)
County F.E. yes yes yes yes yes yes
R2 0.17 0.26 0.14 0.26
Wald F 54.17 66.01
Firms 5,850 5,012 5,850 5,012 5,850 5,012
Notes: The dependent variable is an indicator (rescaled by 100) identifying firms who report a “very negative”
impact of the COVID-19 crisis in April 2020. WFH feas is the z-score (mean 0, standard deviation 1) of the
percentage share of employees in the NACE-2 industry with jobs that are feasible for telework (WFH feas) as
defined in Subsection 2. Intensified telework is a binary variable identifying firms who report an intensified usage
of telework in response to the COVID-19 crisis in April 2020. Controls include a dummy variable identifying
firms operating in a sector subject to mandatory business closures, controls for pre-crisis business conditions and
expected future state of business in Q4 2019 (baseline: neutral) and location fixed effects at the county level.
Additional controls (not reported) include firm size fixed effects (5 size categories), the share of sales generated
abroad, fixed effects for the date of survey completion and survey fixed effects (Construction, Wholesale/Retail,
Service and Manufacturing). Data are from the ifo Business Survey. Standard errors clustered at the NACE-2
level reported in parentheses. *** p < 0.01, ** p < 0.05, * p < 0.1
194.1 Measuring SARS-CoV-2 Infections and Fatalities
To measure SARS-CoV-2 infections and fatality cases in Germany, we use administrative data
provided by the Robert-Koch-Institut (RKI). In Germany, local health authorities are required by
law to report suspected cases, infections and proof of the SARS-CoV-2 virus at the county level
on a daily basis.16 Only cases with a positive laboratory diagnostic are counted, independently of
their clinical evidence. After basic verification, this information is transferred electronically by local
health authorities to the RKI, at the latest by the next working day. At the RKI, data are validated
using an automatic validation algorithm. The RKI processes the reported new cases once a day at
midnight and publishes them by the next morning. The final dataset contains daily information
on the number of local infections and fatalities by sex and age cohort at the county level, where
counties are based on individuals’ places of residence.17 To minimize measurement issues caused by
reporting lags over weekends, we consider weekly data measured on Wednesdays. Our final dataset
covers 12 weeks of the pandemic from week 1 (January 23-29, 2020) to week 12 (April 09-15, 2020).
Figure 3 plots the distribution of infection rates (cumulative infections/population) across counties
and the aggregate number of COVID-19 cases in Germany over the sample time on a log scale. We
report summary statistics on infection rates in Table 8.
Table 8: Summary of Infection Statistics at the County-Level
Mean Std. Dev. Min 25th Median 75th Max
Infection Rate in %
on Apr 15, 2020 0.17 0.13 0.02 0.09 0.21 0.21 1.42
on Mar 18, 2020 0.04 0.04 0.00 0.02 0.05 0.05 0.41
Days since first infection
on Apr 15, 2020 50.7 11.3 33 43 55 55 80
Notes: The table reports descriptive statistics for RKI infection data across 401 NUTS-3 regions in Germany.
4.2 SARS-CoV-2 Infections, Fatalities and Working from Home – Cross-Sectional
Evidence
To explore the cross-sectional association between regional variation in telework and the spread of
COVID-19 across counties we regress the (log of) regional SARS-CoV-2 infection (defined as the
cumulative number of cases relative to the number of inhabitants) or fatality rates (defined as the
cumulative number of deaths relative to the number of inhabitants) on our regional measures of
teleworkability, using the disease data from the last sample week (Wednesday, April 15, 2020).18 At
16
See Infektionsschutzgesetz (IfSG).
17
In principle, the data also report recoveries but as the exact dates of recovery are difficult to measure and are
partly imputed by the local health authorities, we do not use those.
18
Results are robust to using earlier weeks. See Table 14 in the Appendix.
20You can also read