Mechanical heterogeneity along single cell-cell junctions is driven by lateral clustering of cadherins during vertebrate axis elongation
←
→
Page content transcription
If your browser does not render page correctly, please read the page content below
RESEARCH ARTICLE

                                   Mechanical heterogeneity along single
                                   cell-cell junctions is driven by lateral
                                   clustering of cadherins during vertebrate
                                   axis elongation
                                   Robert J Huebner1†, Abdul Naseer Malmi-Kakkada2,3†, Sena Sarıkaya1,
                                   Shinuo Weng1, D Thirumalai2*, John B Wallingford1*
                                   1
                                    Department of Molecular Biosciences, University of Texas, Austin, United States;
                                   2
                                    Department of Chemistry, University of Texas, Austin, United States; 3Department
                                   of Chemistry and Physics, Augusta University, Augusta, Georgia

                                   Abstract Morphogenesis is governed by the interplay of molecular signals and mechanical
                                   forces across multiple length scales. The last decade has seen tremendous advances in our
                                   understanding of the dynamics of protein localization and turnover at subcellular length scales, and
                                   at the other end of the spectrum, of mechanics at tissue-level length scales. Integrating the two
                                   remains a challenge, however, because we lack a detailed understanding of the subcellular patterns
                                   of mechanical properties of cells within tissues. Here, in the context of the elongating body axis of
                                   Xenopus embryos, we combine tools from cell biology and physics to demonstrate that individual
                                   cell-cell junctions display finely-patterned local mechanical heterogeneity along their length. We
                                   show that such local mechanical patterning is essential for the cell movements of convergent
*For correspondence:               extension and is imparted by locally patterned clustering of a classical cadherin. Finally, the
dave.thirumalai@gmail.com (DT);    patterning of cadherins and thus local mechanics along cell-cell junctions are controlled by Planar
wallingford@austin.utexas.edu      Cell Polarity signaling, a key genetic module for CE that is mutated in diverse human birth defects.
(JBW)
†
 These authors contributed
equally to this work
                                   Introduction
Competing interests: The
                                   The establishment and maintenance of animal form involves the control of physical forces by molecu-
authors declare that no
                                   lar systems encoded in the genome, and the elongation of an animal’s head-to-tail body axis is a
competing interests exist.
                                   long-studied paradigm for understanding morphogenesis (Guillot and Lecuit, 2013). This essential
Funding: See page 15               step in the construction of a new embryo is driven by an array of morphogenetic engines, including
Received: 02 December 2020         an evolutionarily ancient suite of collective cell behaviors termed convergent extension (Figure 1A;
Accepted: 01 May 2021              Figure 1—figure supplement 1; Huebner and Wallingford, 2018). Critically, failure of axis elonga-
Published: 25 May 2021             tion does not simply result in a shorter embryo, but rather has catastrophic consequences, and
                                   defects in convergent extension in mammals, including humans, results in lethal birth defects
Reviewing editor: Danelle
Devenport, Princeton University,
                                   (Wallingford et al., 2013).
United States                          The biomechanics of convergent extension (CE) and axis elongation more generally have been
                                   studied across diverse length scales, providing several key insights (Davidson, 2017;
   Copyright Huebner et al. This
                                   Mongera et al., 2019; Stooke-Vaughan and Campàs, 2018). At the tissue scale, these include
article is distributed under the
                                   quantitative descriptions of patterned macroscopic stiffening (Moore et al., 1995; Zhou et al.,
terms of the Creative Commons
Attribution License, which         2009), tissue-scale jamming transitions (Mongera et al., 2018; Serwane et al., 2017), and fluid-like
permits unrestricted use and       multicellular flows (Bénazéraf et al., 2010; Lawton et al., 2013). At smaller length scales, laser abla-
redistribution provided that the   tion studies have provided insights into the patterns of junctional tension within these tissues (Fer-
original author and source are     nandez-Gonzalez et al., 2009; Rauzi et al., 2008; Shindo and Wallingford, 2014). Finally, a more
credited.                          granular examination of the mechanics of CE has been made possible by the use of theoretical

Huebner, Malmi-Kakkada, et al. eLife 2021;10:e65390. DOI: https://doi.org/10.7554/eLife.65390                                         1 of 29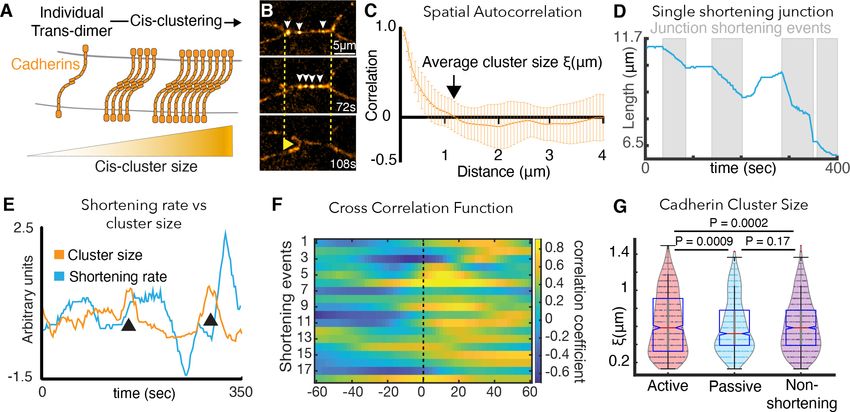
Research article                                                                                           Physics of Living Systems Cell Biology

    A                 T1 transition                  B                                        C                     D                 Activity Parameter
                            ML
                                                                                                                                          p < 1.64e-8
                                                                                                   L(to)                1

                                       v-junction
            A
                                                                             10µm
                                                                                                                                                     n = 20
                                                                                                                                                   junctions

                                                                                                                    AL, AR
                                                                             +666s
                                       t-junction

                                                                                                                        0
                                                                                                            L(tf)                  Active         Passive
            P                                                               +1320s

   E                                     Mean Square                                               F                          Offset MSD
         101
                                      Displacement (MSD)                             ~t1.6

                                                             Fluidized               ~t1.3

                                                                                     ~t0.97
                                                                                                                                                        0.65
       Δ (µm 2)

                                                                             Glass-like                1
                                                                  Active
                                                                                                                                                         0.5
                                                                  Passive
                                                                  Non-shortening R
                                                                  Non-shortening L                     -1
       10-2                                                                                       10
                  0                                 t(sec)                       102                   40                                   100          200

Figure 1. Vertices bounding shortening v-junctions are physically asymmetric and display heterogeneous fluid and glass-like dynamics. (A) A four cell
T1 transition with mediolaterally (ML)-aligned ‘v-junctions’ (red) and anterior-posterior (A/P) aligned t-junctions (orange) indicated. (B) Frames from time-
lapse showing vertex movements of a v-junction; arrows highlight vertices. Frames were acquired at a z-depth of 5 mm above the ECM/coverslip and
with a time interval of 2 s. (C) Schematic of asymmetric vertex movements from B; active = red; passive = blue. (D) Vertex motion quantified by the
activity parameter, as described in Appendix, Section 1. (N = 42 vertices from 20 embryos; t-test p value is shown). (E) MSD reveals active vertices’
persistent superdiffusive movement (red); passive vertices exhibit intermediate time slowdown (blue). Pink and black display MSD for left and right non-
shortening junctions. MSD is described in Appendix, Section 2. (F) MSD from boxed region in E is shown with traces offset for clarity (0.5 for left; 0.65
for right)(N = 20 vertices from 10 embryos).
The online version of this article includes the following figure supplement(s) for figure 1:
Figure supplement 1. Schematics of Xenopus development.
Figure supplement 2. Mean squared displacement measured from multiple frames of reference.
Figure supplement 3. Extended analysis of vertex glass-like dynamics.

                                                modeling (Alt et al., 2017; Fletcher et al., 2017; Merkel and Manning, 2017), with recent innova-
                                                tions continuing to improve these models (e.g. Staddon et al., 2019).
                                                   However, our still-emerging understanding of the cell biology of CE continues to present new
                                                challenges to understanding its biomechanics. For example, CE is driven by a combination of lamelli-
                                                podia-based cell crawling by laterally positioned cells and by junction contraction in medially posi-
                                                tioned cells (Sun et al., 2017; Williams et al., 2014; Huebner and Wallingford, 2018). When
                                                considering the biomechanics however, very few models consider cell crawling (e.g.
                                                Belmonte et al., 2016), with the majority of models addressing only junction contraction. In addi-
                                                tion, these junction-contraction models consistently consider individual cell-cell junctions to be
                                                mechanically homogenous along their length (Alt et al., 2017; Fletcher et al., 2017; Merkel and
                                                Manning, 2017), yet recent work in single cells suggests this approach may be limited. Indeed, there

Huebner, Malmi-Kakkada, et al. eLife 2021;10:e65390. DOI: https://doi.org/10.7554/eLife.65390                                                               2 of 29
Research article                                                                            Physics of Living Systems Cell Biology

                                   is accumulating evidence that single cells’ membranes can be mechanically heterogeneous
                                   (Lieber et al., 2015; Shi et al., 2018; Strale et al., 2015). Thus, the role of mechanical heterogene-
                                   ity along individual cell-cell junctions during collective cell movement in vivo remains poorly defined.
                                       In addition, we know comparatively little about the interplay of subcellular mechanical properties
                                   in vivo and the molecules that govern them. Resolving this disconnect is crucial, because CE in
                                   diverse systems is known to require complex spatial and temporal patterns of protein localization
                                   and dynamics along individual cell-cell junctions during morphogenesis. For example, the localization
                                   and turnover of actomyosin and cadherin adhesion proteins have been extensively quantified during
                                   Drosophila CE (Blankenship et al., 2006; Fernandez-Gonzalez et al., 2009; Levayer and Lecuit,
                                   2013; Rauzi et al., 2008), as have similar patterns for the Planar Cell Polarity (PCP) proteins and
                                   actomyosin during vertebrate CE (Butler and Wallingford, 2018; Kim and Davidson, 2011;
                                   Shindo and Wallingford, 2014). However, the significance of these molecular patterns remains
                                   unclear because we lack a similarly granular understanding of subcellular mechanical properties and
                                   their dynamics, which ultimately explain the cell behaviors that drive vertebrate CE.
                                       Here, we combine high-speed super-resolution microscopy with concepts rooted in soft matter
                                   physics to demonstrate that individual cell-cell junctions in the elongating vertebrate body axis dis-
                                   play finely-patterned local mechanical heterogeneity along their length. To explore this unexpected
                                   finding, we developed a new theory for junction remodeling in silico and new tools for assessment
                                   of very local mechanics in vivo. Combining these, we show that sub-cellular mechanical heterogene-
                                   ity is essential for CE and is imparted by cadherins via locally patterned intracellular (cis-) interac-
                                   tions. Finally, the local patterns of both cadherin clustering and heterogeneous junction mechanics
                                   are controlled by PCP signaling, a key regulatory module for CE that is mutated in diverse human
                                   birth defects.

                                   Results
                                   The dynamics of tricellular junction motion during CE suggest an
                                   unexpected mechanical heterogeneity at subcellular length scales
                                   The elongating body axis of Xenopus embryos is a long-standing and powerful model system for
                                   studying PCP-dependent vertebrate CE (Figure 1—figure supplement 1; Huebner and Walling-
                                   ford, 2018). Xenopus CE can be considered most simply in terms of four-cell neighbor exchanges in
                                   which mediolaterally aligned cell-cell junctions (‘v-junctions’) shorten, followed by the elongation of
                                   new, perpendicularly aligned junctions (‘t-junctions’)(Figure 1A). To gain deeper insights into this
                                   process, we used high-speed super-resolution imaging to establish a quantitative physical descrip-
                                   tion of the motion of tricellular vertices bounding v-junctions (Figure 1B).
                                       First, we found that v-junction shortening was dominated by the movement of a single ‘active’
                                   vertex, while the other ‘passive’ vertex moved comparatively less (Figure 1C,D), similar to the asym-
                                   metry observed previously during CE in Drosophila epithelial cells (Vanderleest et al., 2018). To
                                   quantify the asymmetric movement of vertices in Xenopus mesenchymal cells, we used a fixed coor-
                                   dinate system and defined an activity parameter, A, as the ratio of the net distance moved by the
                                   vertices to the initial junction length, (Figure 1C; Figure 1—figure supplement 2A) (Appendix, Sec-
                                   tion 1). This analysis demonstrated significant differences in the motion of active and passive vertices
                                   (Figure 1D).
                                       We then explored the physical basis of asymmetric motion in active and passive vertices using
                                   mean squared displacement (MSD)(SI Section 2). Our analysis revealed that active vertices consis-
                                   tently displayed a highly fluidized movement (i.e. super-diffusive)(Figure 1E,F, red). By contrast, pas-
                                   sive vertices displayed the hallmarks of more-constrained, glass-like motion (i.e. defined by sub-
                                   diffusive movement with an intermediate time slowdown, as observed in colloidal systems);
                                   (Kegel and van Blaaderen, 2000; Weeks et al., 2000; Figure 1E,F, blue). The juxtaposition of liq-
                                   uid- and glass-like motion along a single cell-cell junction was interesting, because while fluid-to-
                                   glass phase transitions are known features at tissue-level length scales (Angelini et al., 2011;
                                   Bi et al., 2015; Malmi-Kakkada et al., 2018; Sinha et al., 2020), such transitions have not been
                                   reported at sub-cellular length scales during morphogenesis.
                                       Given these surprising results, we also controlled for the possibility that image drift may interfere
                                   with our quantification. To this end, we quantified the motion of active and passive vertices using

Huebner, Malmi-Kakkada, et al. eLife 2021;10:e65390. DOI: https://doi.org/10.7554/eLife.65390                                         3 of 29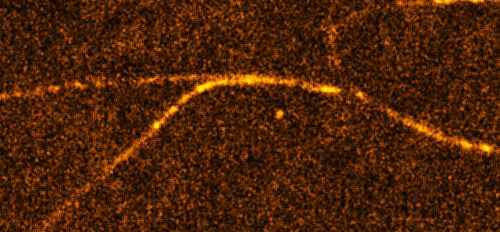
Research article                                                                           Physics of Living Systems Cell Biology

                                   two relative reference frames with respect to slowly moving landmarks within the tissue (Figure 1—
                                   figure supplement 2D–F). All three quantification strategies demonstrate that the asymmetry we
                                   observed was not a point-of-reference artifact (Figure 1—figure supplement 2D–G).
                                      Finally, we confirmed the distinct patterns of motion in active and passive vertices using four
                                   additional physical metrics, the Van Hove function, the velocity auto-correlation function, the self-
                                   overlap parameter, and the fourth order susceptibility, 4 ðt Þ (SI sections 2-3). All four orthogonal
                                   approaches confirmed our finding that the active and passive vertices bounding individual v-junc-
                                   tions exhibit asymmetric dynamic behaviors, with one vertex displaying a fluid-like motion and the
                                   other, glass-like (Figure 1—figure supplement 3). Critically, this asymmetric behavior was specific
                                   to shortening dynamics of v-junctions, as the two vertices bounding non-shortening junctions in the
                                   same tissue were consistently symmetrical, both resembling passive vertices (Figure 1E,F, pink,
                                   black; Figure 1—figure supplement 3).
                                      This physical analysis provided three important insights: First, glass-like dynamics previously
                                   observed only at tissue-length scales in morphogenesis also exist at the subcellular length scale of
                                   individual junctions. Second, the frequently invoked assumption of mechanical homogeneity along
                                   single cell-cell junctions, which underlies a wide swath of the biophysical work on morphogenesis,
                                   may not be valid. And finally, because only shortening junctions exhibited local mechanical hetero-
                                   geneities, this phenomenon may be a specific and essential feature of convergent extension.

                                   A new physical model of cell-cell junction remodeling predicts
                                   asymmetric, local patterning of junction stiffness as an essential feature
                                   of convergent extension
                                   The possibility of mechanical heterogeneity along single cell-cell junctions has important implica-
                                   tions, as many biophysical approaches and in silico tools for understanding morphogenesis (e.g.
                                   laser cutting, vertex models) assume that junctions are mechanically homogeneous along their
                                   length. We therefore developed a new theoretical framework for junction shortening that accommo-
                                   dates the possibility of local mechanical heterogeneity by independently modeling the movement of
                                   each vertex (Figure 2A,B; Appendix, Section 4–8).
                                       Our model involves (i) a local junction stiffness (or elasticity) modeled using a spring element,
                                   which is consistent with the pulsatile relaxation of v-junctions observed in Xenopus CE (Shindo and
                                   Wallingford, 2014) (ii) a dynamic rest length, recently shown to be important for modeling CE
                                   (Shindo et al., 2019) (iii) a viscoelastic parameter, k=g, dictated by the spring stiffness, k, and the
                                   friction at the vertices,g; and (iv) a rest length exponent, , which describes the time dependence of
                                   plastic displacement of the vertices modeled with a piston (Figure 2A,B; Appendix, Section 4-8).
                                       Using this model, we explored parameter space to find variables in elastic and viscous deforma-
                                   tion that can support effective shortening of the junction (Appendix, Sections 7, 8). As shown in the
                                   heatmap in Figure 2C, for a given rest length exponent, junctions failed to shorten if the viscoelastic
                                   parameter was equal and small for both the vertices (Figure 2C, red box; Appendix, Sections 7, 8).
                                   When the viscoelastic parameter was asymmetric, junctions shortened effectively (Figure 2C, gold
                                   box). Thus, at the level of binary outcome (i.e. shorten versus fail-to-shorten), our model suggests
                                   that CE requires mechanical heterogeneity along single v-junctions.
                                       For a more stringent test, we compared the temporal dynamics of junction shortening in our
                                   model to those quantified in vivo from high-speed super-resolution movies (Figure 2D,E). In time-
                                   lapse data, the relaxation behavior of v-junctions collapsed into a self-similar pattern when normal-
                                   ized; relaxation became progressively more efficient over time and could be described by a com-
                                   pressed exponential (Figure 2G, black lines; Figure 2—figure supplement 1A,B; Appendix,
                                   Sections 9). When the viscoelastic parameters in our model were asymmetric, the shortening dynam-
                                   ics closely recapitulated this compressed exponential relaxation (Figure 2G, gray lines, I; expanded
                                   view in Figure 2—figure supplement 1A,B; Appendix, Sections 8–10).
                                       Finally, we also analyzed junction length dynamics in non-shortening junctions in vivo (Figure 2D,
                                   F), because unlike shortening junctions, these display symmetrical mechanics along their length
                                   (Figure 1E, black, pink). Defining non-shortening junctions as any that displayed no net reduction in
                                   length over the observation time scale of ~400 s, we found that the length dynamics of non-shorten-
                                   ing junctions in vivo displayed wide fluctuations over time. Moreover, non-shortening junctions did
                                   not share a self-similar relaxation pattern and displayed large deviations from the compressed expo-
                                   nential (Figure 2H, black, I; Appendix, Sections 8–10). Likewise, when symmetric viscoelastic

Huebner, Malmi-Kakkada, et al. eLife 2021;10:e65390. DOI: https://doi.org/10.7554/eLife.65390                                        4 of 29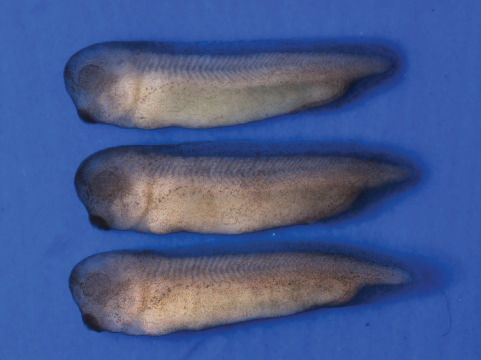
Research article                                                                                                                                       Physics of Living Systems Cell Biology

   A                                                                          B                                      C                                       Phase Space of Theory Parameters
                                   Converge                                         Active vertex                                                                (k R /γ R = 0.1 passive vertex)
                                                                                    dxL     kx   F
                                                                                        = − L L + L + ζL                   2.0                                                                        100
                    Active vertex Passive vertex                                     dt     γL   γL                                                          Failure to               Successful

                                                                                                                               Rest length exponent (ψ L )
                                                                                    Passive vertex                                                            shorten                 shortening

                                                                                                                                                                                                          % junctions closed
                        kL                              kR                          dxR     k x  F
       FL                                 γL γR                        FR               = − R R + R + ζR
                                                                                     dt     γR   γR
                                                                                   kL= Vertex elasticity
                                                                                   γ L= Vertex viscosity
                                                                                   ζ = Noise
                     Dynamic harmonic oscillator                                   FL= kLaLtψ L
                  Piston = viscoplastic displacement                               (Force for viscous deformation)     1.85                                        0
                    Spring = elastic displacement                                  ψ L = Rest length exponent             0.9 Ratio of viscoelastic parameter 24.9
                                                                                                                                        (kL/γ L)/(kR/γ R)

     D                                                  E

                                                         Shortening                 5µm                      +100s                                                        +200s                     +300s
              E                                         F
                        F
                                                20µm Non-shortening 5µm                                      +100s                                                        +200s                     +300s

   G              Scaled normalized                                H              Scaled normalized                  I Deviation from compressed exponential
                   Junction Length                                                 Junction Length
                                                                                                                                                                Shortening            Non-shortening
       3                Successful                                     3                Failure to
                        shortening                                                       shorten                       2                                                          p=1.94e-166
                                                                                                                                                                          p=0
                                                                   Ln
     Ln

                                                                                                                     Residue

             Experimental                                                   Experimental
             Compressed exponential                                         Compressed exponential
     -1 Theory                                                     -1 Theory

         0        0.5        1.0          1.5     2.0        2.5        0         0.5    1.0 t/τ 1.5   2.0    2.5      0
                                   t/τf                                                         f
                                                                                                                                                   Theory                 Expt      Theory         Expt

Figure 2. A new vertex model incorporating local mechanical heterogeneity recapitulates the fine-scale dynamics of junction shortening observed in
vivo. (A) Sketch of v- junction shortening with elements of the model overlain. Active (red) and passive (blue) vertex movements are affected by a piston
modulating the dynamic rest length. The vertices execute elastic motion due to springs of elasticity, kL and kR . L; R indices indicate left and right. The
thicker spring indicates a stiffer elasticity constant, kL . (B) Equations of motion for active and passive vertex positions, xL and xR . Displacement of the left
(right) vertex due to the piston is determined by the forces FL ðFR Þ whose time dependence is determined by the rest length exponent, L ð R Þ. The
friction experienced by the left (right) vertices are modeled using g L ðgR Þ: zL is the colored noise term for the left vertex (Appendix, Section 4-6). (C)
Heatmap indicating probability of successful junction shortening (legend at right) in parameter space for the viscoelastic parameter near vertices and
the rest length exponent, staying within biologically reasonable values based on data from Drosophila (Solon et al., 2009; Appendix, Section 6). (D)
Still image from a time-lapse of Xenopus CE. Insets indicate representative shortening and non-shortening junctions shown in Panels E and F (vertices
indicated by arrowheads). (G) Normalized change in length, Ln , for shortening junctions in vivo (black lines) and in simulations using asymmetric
viscoelastic parameters (gray lines) resembling the compressed exponential form (red, dashed line) after the time axis is rescaled. (H) Normalized
change in length, Ln , for non-shortening junctions in vivo (black lines) and in simulations using symmetrical viscoelastic parameters (gray lines). (I)
Quantification of relaxation behavior deviation from the compressed exponential using the residue (Appendix, Section 8-10).
The online version of this article includes the following figure supplement(s) for figure 2:
Figure supplement 1. Extended analysis comparing in vivo and in silico junction dynamics.

                                                   parameters (k=g) were input into the model for both vertices bounding a single junction, the result-
                                                   ing junction length dynamics displayed wide fluctuations in length and deviated substantially from
                                                   the normal relaxation pattern (Figure 2H, gray; I; Appendix, Sections 8–10).

Huebner, Malmi-Kakkada, et al. eLife 2021;10:e65390. DOI: https://doi.org/10.7554/eLife.65390                                                                                                                  5 of 29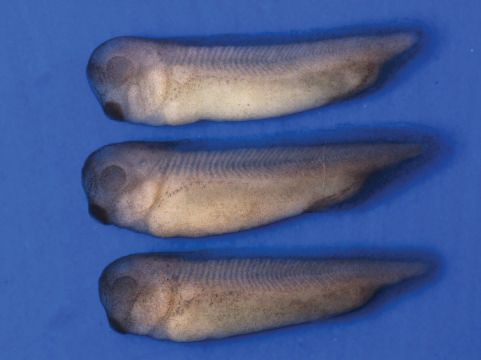
Research article                                                                                                                Physics of Living Systems Cell Biology

                                          Thus, by incorporating local mechanical heterogeneity, our new model not only recapitulates
                                       overall shortening/non-shortening outcomes, but also quantitatively recapitulates the dynamic pat-
                                       terns of length change observed in both shortening and non-shortening junctions in vivo. Because
                                       both modeling and observations suggest a key role for mechanical heterogeneity, we next sought to
                                       understand the contribution of such local mechanical regimes to cell movement during CE.

                                       Fluid-like directed motion of active vertices results from restriction of
                                       transverse fluctuations in motion
                                       Our theory makes a prediction: that the more fluid-like motion of the active vertex occurs in the con-
                                       text of increased local stiffness (i.e. higher viscoelastic parameter), while the more glass-like motion
                                       of the passive vertex occurs in a relatively decreased stiffness regime. Given that vertex movement,
                                       while highly directional, is not entirely directed along the line joining two vertices (in-line movement)
                                       (Figure 3A), we reasoned that a stiffer mechanical regime might limit the movement of the active
                                       vertices perpendicular to the in-line direction; the perpendicular motion is referred to as transverse
                                       movement (Figure 3A, green). Transverse movement is indeed limited for active vertices thereby
                                       resulting in more smoothly processive, fluid-like motion in the line of shortening as compared to pas-
                                       sive vertices (Figure 3A, orange).

      A              TrDQVYHUVH tXFWXations as                      B     2.6
                     pro[\ IRU ORFDO PHFKDQLFV                                                                                Passive
                                                                                                                              Vertex

                                                                                                                                                                 Time(s) 300
                                                                          Y-coordinate (+m)

               Transverse
               movement
                                       Vertex                                                                    Active
                                       trajectory                                                                Vertex

                                                                                                                                                                 100
                                                       In-line
                                                       movement
                                                                            0
                                                                                              0                  X-coordinate (+m)                          13

      C     Mean transverse            D     Probability transverse                             E     Mean straightness       F                  Probability
              tXFWXations                        tXFWXations                                               index                             straightness index
                 P = 1.3648e-07
                                          0.5                                                                                 0.5
                                                                                          0.5
       -1
    10                                                                                                      P = 0.0126                                      Active
                                                               Active
                                                                                                                              Probability

                                                                                                                                                           (Offset)
                                                               Passive
                                                                                              Ratio

                                           P(RT)

                                                                                                                                                           Passive
                                                               (Offset)

    10-2
                                             0                                                                                    0
                                                                                                  0                                         0     Ratio                    0.6
            Active        Passive                  0      RT         0.6                                Active      Passive

Figure 3. Patterns of transverse vertex fluctuations reveal mechanical heterogeneity of active and passive vertices in vivo. (A) Schematic of transverse
fluctuations in the vertex position perpendicular to the direction of junction shortening; traverse movements are extracted using the transverse ’hop’
function, which is inversely proportional to the local vertex stiffness (Appendix, Section 12). (B) X/Y coordinates for a representative pair of active and
passive vertices color coded for time, with transverse (green) and in-line (orange) motion indicated. (C) Mean transverse fluctuation hRT i, for active and
passive vertices. (N=20 vertices; 10 embryos over 386 seconds; t-test p value shown). (D) Probability distribution of transverse fluctuations, RT , (offset for
clarity). (E) Straightness index quantifying the persistence of vertex motion in terms of directionality (Appendix, Section 12); t-test p value is shown. (F)
Probability distribution of the straightness index for active (red, offset for clarity) and passive (blue) vertices.

Huebner, Malmi-Kakkada, et al. eLife 2021;10:e65390. DOI: https://doi.org/10.7554/eLife.65390                                                                                    6 of 29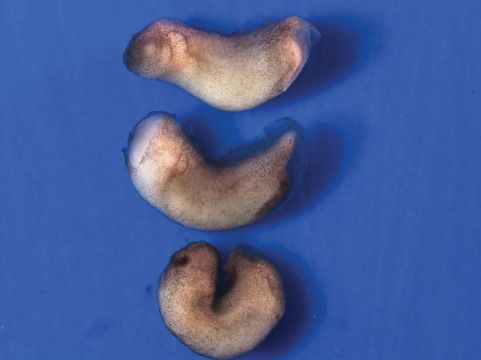
Research article                                                                             Physics of Living Systems Cell Biology

                                       To test our model’s prediction in vivo, we used our time-lapse data to quantify the transverse
                                   fluctuations of vertices (Figure 3B, green arrows; Appendix, Section 12). Consistent with our model’s
                                   prediction, active vertices displayed significantly less transverse fluctuation than did passive vertices
                                   at the same junctions (Figure 3B,C,E), indicating a higher local stiffness at active vertices
                                   (Marmottant et al., 2009). Analysis of the straightness index, quantifying how straight vertices
                                   move along the in-line direction, independently validated this conclusion (Figure 3E,F; Appendix,
                                   Section 12).
                                       This analysis of in vivo imaging data validates our physical model’s prediction of an increased stiff-
                                   ness regime near active junctions and suggests that the lower stiffness regime of passive vertices
                                   allows more transverse fluctuation, resulting in less-directed, more glass-like movement. As such,
                                   multiple independent lines of observation and theory suggest that local mechanical heterogeneity
                                   along cell-cell junctions is a fundamental feature of CE. We next sought to understand the molecular
                                   underpinnings of this feature, asking if patterns of protein localization during CE might reflect the
                                   local mechanical patterns we identified here.

                                   Patterned cis-clustering of cadherins reflects the heterogeneous
                                   mechanics along shortening junctions
                                   We first considered that the observed mechanical asymmetry along shortening v-junctions might
                                   result from asymmetric distribution of actomyosin, for example from asymmetric cellular protrusions
                                   from neighboring cells or asymmetric junction contraction events along v-junctions. We therefore
                                   measured actin intensity in the region abutting active and passive vertices, but we observed no such
                                   asymmetry (Figure 4—figure supplement 1A–C).
                                      We next turned our attention to cadherin cell adhesion proteins, which have been shown to tune
                                   the very local mechanics of individual cell membranes in culture (Strale et al., 2015). We specifically
                                   examined Cdh3, as it is essential for CE in Xenopus (Brieher and Gumbiner, 1994; Fagotto et al.,
                                   2013; Figure 4—figure supplement 1D) and was recently implicated in CE cell movements in the
                                   mouse skin (Cetera et al., 2018). Like all classical cadherins, Cdh3 forms both intercellular trans-
                                   dimers and also cis-clusters mediated by intracellular interactions (Figure 4A; Yap et al., 1997).
                                   Such cis-clustering is a key regulatory nexus for cadherin function (Yap et al., 2015), so it is interest-
                                   ing that while the mechanisms governing formation of cadherin cis-clusters during CE has been stud-
                                   ied, cis-cluster function during CE remains unknown (e.g. Levayer and Lecuit, 2013;
                                   Truong Quang et al., 2013).
                                      We used high-speed super-resolution microscopy to image a functional GFP-fusion to Cdh3 and
                                   used the spatial autocorrelation function for an unbiased quantification of Cdh3-GFP cluster size
                                   (Figure 4B)(Appendix, Section 13). Using this function, an exponential decay in spatial correlation is
                                   expected for clusters that are regularly ordered, and this pattern was observed for Cdh3-GFP
                                   (Figure 4C). Moreover, this decay reached zero at ~1 mm (Figure 4C), consistent with the size
                                   reported for cis-clusters of cadherins in vertebrate cell culture (Yap et al., 2015).
                                      This analysis revealed that together with pulsatile junction shortening (Figure 4D; Shindo and
                                   Wallingford, 2014) Cdh3 clusters undergo dynamic fluctuations in size (Figure 4E). Moreover, fluc-
                                   tuations in mean Cdh3 cluster size significantly cross-correlated with shortening pulses (Figure 4F).
                                   Mean cluster size peaked ~20 s prior to the onset of junction shortening pulses (Figure 4E,F)(Appen-
                                   dix, Section 14,15), suggesting a functional relationship between Cdh3 clustering and junction
                                   remodeling.
                                      We then reasoned that mechanical heterogeneity observed along cell-cell junctions during CE
                                   might be driven by local patterns of Cdh3 clustering, since cadherins can tune the local mechanics of
                                   free cell membranes in single cultured cells (Strale et al., 2015). This led us to measure Cdh3 cluster
                                   size specifically in the ~3 micron region abutting vertices of shortening v-junctions during shortening
                                   pulses. Patterns of Cdh3 clustering were complex and highly heterogeneous, consistent with the
                                   mechanical heterogeneities we report here (Figure 4—figure supplement 2). Nonetheless, the
                                   mean size of Cdh3 clusters near active junctions was significantly larger than that for clusters near
                                   passive vertices (Figure 4G; Appendix, Section 16). We confirmed this important result using an
                                   alternative quantification of cluster size involving fits to the exponential decay of the spatial autocor-
                                   relation (Figure 4—figure supplement 1E–G; Appendix, Section 16).
                                      Importantly, asymmetric Cdh3 clustering was specific to shortening v-junctions and was not
                                   observed along non-shortening junctions in the same tissue. Rather, all vertices bounding non-

Huebner, Malmi-Kakkada, et al. eLife 2021;10:e65390. DOI: https://doi.org/10.7554/eLife.65390                                          7 of 29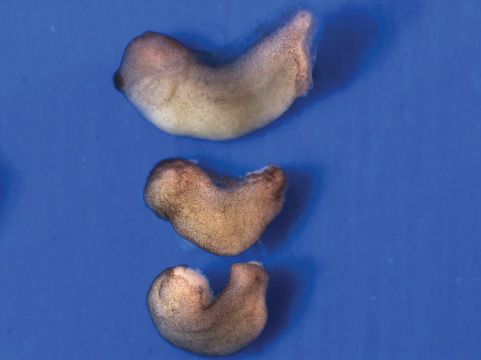
Research article Physics of Living Systems Cell Biology
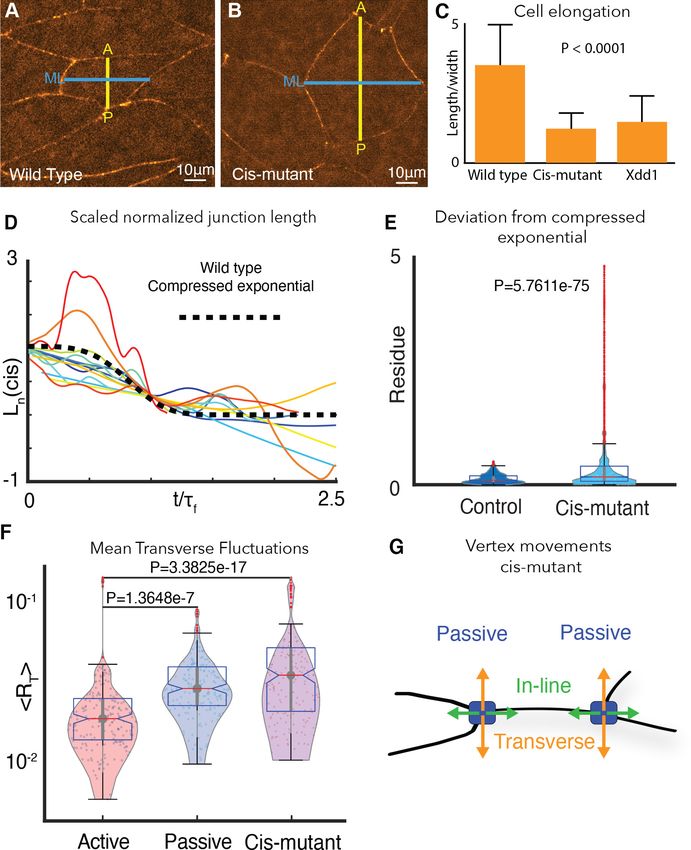
Figure 4. Cadherin cis-clustering correlates with vertex movements and mirrors asymmetric vertex dynamics. (A) C-cadherin (Cdh3) cis-clustering; trans-
dimers form across opposing cell membranes (gray); lateral cis interactions drive clustering. (B) Frames from time-lapse of Cdh3-GFP; white arrows
highlight clusters. Dashed lines denote initial vertex positions; yellow arrow indicates junction shortening. (C) Spatial autocorrelation of Cdh3 intensity
fluctuations (SI Section 13)(60 image frames, 10 embryos). Autocorrelation decays to zero at ~1 mm. Error bars are standard deviation. (D) Trace from a
single v-junction displaying pulsatile shortening highlighted by gray boxes (E) Junction length and Cdh3 cluster size fluctuations for an individual cell-
cell junction. Cadherin cluster size fluctuations peak prior to junction shortening events (Appendix, Section 14,15). (F) Heat map showing cross
correlation between junction length and Cdh3 cluster size. Color represents the value of the correlation coefficient (legend at right). Dashed black line
indicates zero lag time. (Appendix, Section 14,15)(n = 11 junctions and 18 shortening events.) (G) Cadherin cluster size as extracted from spatial
correlation curves (Figure 4—figure supplement 2; Appendix, Section 16). Cadherin cluster sizes are significantly larger near active vertices. Clusters
near vertices of non-shortening junctions are not significantly different from those near passive vertices.
The online version of this article includes the following figure supplement(s) for figure 4:
Figure supplement 1. Extended analysis pertaining to cdh3 clustering and actin next to junctions (Appendix, Section 16).
Figure supplement 2. Source data for spatial correlation of Cdh3 intensity fluctuations reveal extreme heterogeneity in cluster size.
shortening junctions displayed clustering similar to that near passive vertices in shortening junctions
(Figure 4G). Symmetrical clustering in non-shortening reflects the symmetrical dynamics of vertices
bounding these junctions, described above (Figure 1E). Accordingly, these results demonstrate that
asymmetric cis-clustering of Cdh3 is a specific property of shortening v-junctions during CE and sug-
gests that such clustering may drive the asymmetric mechanics of active and passive vertices that we
observed in vivo and predicted in silico.
Cdh3 cis-clustering is required for axis elongation but not homeostatic
tissue integrity in vivo
The patterned, asymmetric cis-clustering of Cdh3 during CE is a significant finding, because as men-
tioned above the function of cis-clustering remains undefined not only for CE, but indeed in any in
vivo context. We therefore took advantage of point mutations in Cdh3 that specifically disrupt the
hydrophobic pocket that mediates cis clustering, without affecting trans dimerization (cisMut-Cdh3;
Figure 5A; Harrison et al., 2011; Strale et al., 2015). To test this mutant in vivo, we depleted
endogenous Cdh3 as previously described (Figure 5—figure supplement 1; Ninomiya et al.,
2012), and then re-expressed either wild-type Cdh3-GFP or cisMutant-Cdh3-GFP.
We first confirmed the cis mutant’s impact on clustering in vivo. Re-expressed wild-type Cdh3-
GFP clustered normally and displayed the expected exponential decay in spatial autocorrelation that
Huebner, Malmi-Kakkada, et al. eLife 2021;10:e65390. DOI: https://doi.org/10.7554/eLife.65390 8 of 29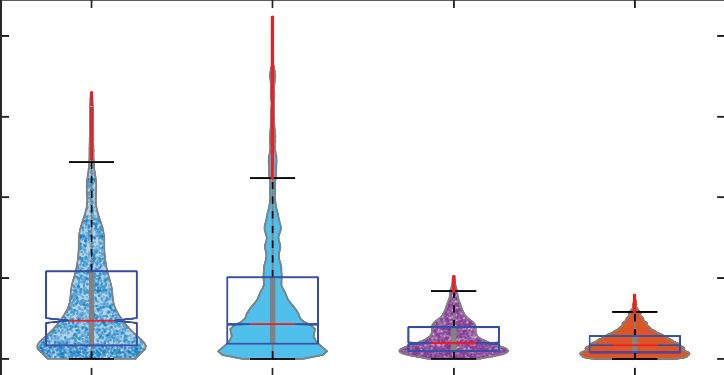
Research article                                                                                                                   Physics of Living Systems Cell Biology

    A                          B                Cdh3    D                 Spatial autocorrelation function
               Cis-mutant                                1.0

                                                                                                 Wild type

                                                            Correlation
                                                                                                 Cis-mutant
                                                 5µm

                               C               KD +
                                          Cis-mutant

                                                         -0.5                    1                      2               3                 4
        Cadherins                                5µm                                 Distance (µm)

    E                                F                                            I                   Embryo elongation
                                                                                         6
                                                                                                            ***     ***        ***

                                                                                       Length/width
     Control                         Cdh3-KD                                                           WT KD Res Cis
    G                                H                                            J                   Embryo integrity
                                                                                         N = 61                   247     60         64
                                                                                      100
                                                                                       % Intact

     KD +                            KD +
     Rescue                          Cis-mutant
                                                                                                       WT KD Res Cis

Figure 5. Cdh3 cis-clustering is required for convergent extension but not homeostatic tissue integrity. (A) Mutations used to inhibit cadherin cis-
clustering. (B) Cdh3-GFP clustering in a control embryo. (C) Cis-clusters absent after re-expression of cisMut-Cdh3-GFP. (D) Mean spatial
autocorrelation of Cdh3-GFP intensity fluctuations for wild type (60 image frames, from 10 embryos) and the cis-mutant (56 image frames, five embryos)
(Appendix, Section 17). Gradual, non-exponential decay for cisMut-Cdh3-GFP indicates a lack of spatial order (i.e. failure to cluster). (E) Control
embryos (~stage 33). (F) Sibling embryos after Cdh3 knockdown. (G) Knockdown embryos re-expressing wild-type Cdh3-GFP. (H) Knockdown embryos
re-expressing cisMut-Cdh3-GFP. (I) Axis elongation assessed as the ratio of anteroposterior to dorsoventral length at the widest point. (J) Embryo
integrity assessed as percent of embryos alive and intact at stage 23.
The online version of this article includes the following figure supplement(s) for figure 5:
Figure supplement 1. Cdh3 knockdown.

                                    indicates regular spatial order and a mean cluster size ~1 mm (Figure 5B,D) (Appendix, Section
                                    13,17). By contrast, when cisMut-Cdh3-GFP was re-expressed, clusters were clearly absent, and the
                                    signal was diffuse along cell-cell junctions (Figure 5C). Moreover, the spatial autocorrelation of cis-
                                    Mut-Cdh3-GFP did not decay exponentially (Figure 5D), consistent with a lack of spatial order
                                    (Appendix, Section 13,17). We confirmed this result using fits to the exponential decay of the spatial
                                    autocorrelation (Figure 7—figure supplement 1) (Appendix, Section 13,17).
                                       We next used the same replacement strategy to directly test the function of cis-clustering in Xen-
                                    opus CE. At neurulation stages, embryos depleted of Cdh3 display severe defects in axis elongation
                                    (Figure 5E,F,I, green) (Brieher and Gumbiner, 1994; Lee and Gumbiner, 1995). At later stages,
                                    these embryos disassociate to individual cells due to the widespread requirement for Cdh3 in cell
                                    cohesion (Ninomiya et al., 2012; Figure 5J, green). We found that re-expression of wild-type Cdh3-
                                    GFP rescued both axis elongation and embryo integrity, as expected (Figure 5G,I,J, purple).
                                       Strikingly however, while re-expression of cisMut-Cdh3-GFP significantly rescued overall embryo
                                    integrity (Figure 5J, red), it failed to rescue axis elongation (Figure 5H,I, red). These data provide
                                    the first experimental test of the role of cadherin cis-clustering in vivo, and moreover, provide an

Huebner, Malmi-Kakkada, et al. eLife 2021;10:e65390. DOI: https://doi.org/10.7554/eLife.65390                                                                                9 of 29
Research article Physics of Living Systems Cell Biology
experimental entry point for testing the role of cis-clustering in the generation of local mechanical
patterns along cell-cell junctions.
Loss of Cdh3 cis-clustering eliminates mechanical heterogeneity and
disrupts shortening dynamics of cell-cell junctions during CE
To understand the relationship between Cdh3 clustering (Figure 4) and the asymmetric mechanics
and vertex dynamics of shortening v-junctions (Figures 1–3), we applied our battery of physical
methods to quantify the motion of vertices in cells with disrupted Cdh3 cis-clustering (i.e. Cdh3
knockdown +cisMut-Cdh3 re-expression). We found first that defects in axis elongation in cisMut-
Cdh3 expressing cells were accompanied by defects in cell polarization (Figure 6A–C), reflecting the
phenotype seen when PCP signaling is disrupted (Wallingford et al., 2000). Second, v-junctions in
cells with disrupted Cdh3 clustering displayed large fluctuations in length that deviated significantly
from the compressed exponential relaxation pattern observed for normal v-junctions (Figure 6D,E).
The aberrant length dynamics of cisMut-Cdh3 expressing junctions resembled those of junctions
that lack mechanical heterogeneity (i.e. non-shortening junctions in normal embryos in vivo or those
modeled in silico (compare Figure 6D with Figure 2H)).
We then asked if cisMut-Cdh3 expression also disrupted the normal mechanical heterogeneity of
v-junctions by quantifying transverse fluctuations of vertices. We found that all vertices in cells with
defective cis-clustering of Cdh3 displayed the elevated transverse fluctuations observed only in pas-
sive vertices of normal cells (Figure 6F,G). These results provide direct experimental evidence that
Cdh3 cis-clustering restricts transverse movement of vertices, thereby facilitating fluid-like shorten-
ing of the junction.
PCP is essential for Cdh3 cis-clustering and mechanical heterogeneity at
cell-cell junctions
A key challenge in animal morphogenesis is to understand how ubiquitous cellular machinery such as
cadherin adhesion is directed by tissue-specific developmental control mechanisms. PCP signaling is
a central regulator of vertebrate CE and PCP proteins localize to shortening v-junctions during Xeno-
pus CE (Figure 7A), where they control actomyosin contractility (Butler and Wallingford, 2018;
Shindo et al., 2019), but how these systems interface with cadherin adhesion during CE is poorly
defined. Because cells with disrupted Cdh3 cis-clustering superficially resemble those with defective
PCP (Figure 6B,C), we asked if Cdh3 clustering may be under the control of PCP signaling.
We disrupted PCP with the well-characterized dominant-negative version of Dvl2, Xdd1, which
severely disrupted cell intercalation behaviors as expected (Wallingford et al., 2000; Figure 6C).
Strikingly, expression of Xdd1 also elicited a significant disruption of Cdh3 clustering that was appar-
ent in both images and in the lack of exponential decay in spatial autocorrelation data (Figure 7B,
C). Finally, Xdd1 expressing junctions also displayed exaggerated length fluctuations, significant
deviation from the compressed exponential relaxation behavior, and symmetrical, elevated trans-
verse fluctuations (Figure 7D–F), all features associated only with junctions lacking local mechanical
heterogeneity in vivo or in silico.
These data not only provide an independent experimental confirmation of the link between Cdh3
cis-clustering, local mechanical heterogeneity of junctions, and asymmetric vertex dynamics
(Figure 7G), but also provide a novel mechanistic link between a conserved and essential develop-
mental regulatory module (PCP), and the ubiquitous machinery of Cadherin adhesion.
Discussion
Here, we combined physical and cell biological approaches to observation, theory, and experiment
to identify and link two novel features of vertebrate convergent extension, one physical, the other
molecular. First, we show that single cell-cell junctions in vivo display patterned mechanical hetero-
geneities along their length. Second, we show that locally patterned cis-clustering of a classical cad-
herin impart these patterns of mechanical heterogeneity under the control of PCP signaling.
These results are fundamentally important, because mechanical homeostasis in tissues is an emer-
gent property of forces interacting across a wide range of length scales, yet we still know little about
the subcellular mechanical properties of cells within tissues. Thus, while previous studies describe
local heterogeneity in the membranes of single cultured cells (e.g. Lieber et al., 2015; Shi et al.,
Huebner, Malmi-Kakkada, et al. eLife 2021;10:e65390. DOI: https://doi.org/10.7554/eLife.65390 10 of 29Research article Physics of Living Systems Cell Biology
Figure 6. Cdh3 cis-clustering is required for heterogeneous junction mechanics. (A) Image of polarized, elongated control Xenopus mesoderm cells.
Blue = mediolateral (ML); yellow = anterior-posterior (AP). (B) Stage-matched cells after depletion of endogenous Cdh3 and re-expression of cisMut-
Cdh3. (C) Cellular length/width ratio to quantify CE cell behaviors (p value indicates ANOVA result). (D) Normalized junction length dynamics (Ln ) for
cis-mutant expressing junctions. Large fluctuations here are similar to those seen normally in non-shortening junctions (see Figure 2H). Dashed black
line indicates the expected compressed exponential. (E) The residue quantifying significant Ln deviation from the compressed exponential function as
compared to control junctions. (F) Plots for transverse fluctuations hRT i, for control active and passive vertices compared to cis-mutant vertices. (Note:
Data for active and passive junctions are re-presented from Figure 3C for comparison.) (G) Schematic illustrating symmetrical vertex behavior after
disruption of cdh3 cis-clustering.
2018; Strale et al., 2015), our demonstration of local mechanical heterogeneity along single cell-
cell junctions in an intact tissue is a substantial advance. Indeed, our data demonstrate that it is not
the local heterogeneity per se, but rather its local patterning along individual cell-cell junctions that
is a specific and essential feature of the junctional remodeling that drives CE. From a physical
Huebner, Malmi-Kakkada, et al. eLife 2021;10:e65390. DOI: https://doi.org/10.7554/eLife.65390 11 of 29Research article Physics of Living Systems Cell Biology
Figure 7. PCP is required for cdh3 cis-clustering and heterogeneous junction mechanics. (A) Cartoon of polarized core PCP protein localization. (B) Still
image of Cdh3-GFP after expression of dominant negative Dvl2 (Xdd1). (C) Spatial autocorrelation of Cdh3 intensity fluctuations for Xdd1 (53 image
frames, 5 embryos) and control embryos (60 frames, from 10 embryos),± std. dev. The spatial organization of Xdd1 mutant cadherin is similar to cisMut-
Cdh3 expressing embryos. (D) Normalized junction length dynamics for Xdd1 embryos. Dashed black line indicates the normal compressed exponential
behavior. (E) Residue for the deviation from the universal compressed exponential function for Xdd1 junctions. (F) Plots for transverse fluctuations at
active and passive vertices compared to Xdd1-expressing vertices. (Note: Data for active and passive junctions are re-presented from Figure 3C for
comparison to Xdd1.) (G) Schematic summarizing the primary conclusions.
The online version of this article includes the following figure supplement(s) for figure 7:
Figure supplement 1. Extended analysis of cadherin clustering for the cis-mutant, rescue, and Xdd1.
standpoint, this insight is important because it implies that the origin of patterned dynamic hetero-
geneities observed at tissue length scales (e.g. Angelini et al., 2011; Bi et al., 2015; Malmi-
Kakkada et al., 2018) may reside in similarly complex patterns at length scales as small as that of
individual cadherin clusters.
Our findings are also important for understanding the unifying suite of CE cell behaviors that is
deeply conserved across evolution. V-junction shortening is accomplished by a combination of cell
crawling via mediolaterally positioned lamellipodia and active contraction of
anteroposteriorly positioned cell-cell junctions (Sun et al., 2017; Williams et al., 2014), a pattern
that has now been described in animals ranging from nematodes, to insects to vertebrates
(Huebner and Wallingford, 2018). Although it remains to be determined whether v-junction short-
ening in other tissues and animals also displays the heterogeneity we report here, it is nonetheless
remarkable that even subtle aspects (e.g. active and passive vertices) are similar in tissues as diverse
as Drosophila epithelial cells (Vanderleest et al., 2018) and Xenopus mesenchymal cells (Figure 1).
Strikingly, a new preprint reports that asymmetric vertex behaviors are also observed when junction
shortening is driven artificially in cultured cells by optogenetic activation of RhoA (Cavanaugh et al.,
2021). Moreover, using an entirely independent modeling approach to the one we describe here,
that work also suggests that local mechanical heterogeneity in cell-cell junctions is a fundamental
feature of cell intercalation (Cavanaugh et al., 2021). Thus, asymmetric junction shortening may
have a fundamental physical basis and is clearly ripe for further study.
Perhaps most importantly, our findings also have important implications for cadherin biology. The
lateral cis-clustering of cadherins was first described decades ago (Yap et al., 1997) and has been
extensively characterized using structural, biochemical, and cell biological approaches (Chen et al.,
2015; Fagotto et al., 2013; Hong et al., 2013; Kale et al., 2018; Levayer and Lecuit, 2013;
Levayer et al., 2011; Truong Quang et al., 2013; Yap et al., 1998). Because cadherin clustering is
Huebner, Malmi-Kakkada, et al. eLife 2021;10:e65390. DOI: https://doi.org/10.7554/eLife.65390 12 of 29Research article Physics of Living Systems Cell Biology
thought to be driven by actomyosin contraction (Yap et al., 2015), our finding that PCP signaling is
required for normal Cdh3 clustering is important. PCP proteins are enriched at shortening v-junc-
tions, where they control pulsatile actomyosin contractions (Butler and Wallingford, 2018;
Shindo et al., 2019; Shindo and Wallingford, 2014). It is reasonable, then, to posit that PCP-
dependent actomyosin contraction is the key driver of Cdh3 clustering. However, another PCP pro-
tein, Frizzled7, has also been shown to tune cadherin adhesion during Xenopus CE, but bi-fluores-
cence complementation experiments suggested Frizzled7 inhibits cis-clustering (Kraft et al., 2012).
Adding additional complexity is the recent finding that the PCP protein Celsr1, itself an atypical cad-
herin, not only forms adhesive trans-dimers but also tunes PCP signaling (Stahley et al., 2021).
Unraveling the relationship between PCP, cadherins, and cell adhesion is thus an important chal-
lenge for future work.
Furthermore, despite the substantial body of work exploring the mechanisms by which cadherin
clusters are formed, the functional consequences of defective cis-clustering in morphogenesis, or
indeed in any intact tissue, have never been described. Our work therefore fills a critical gap and will
be relevant far beyond the context of Xenopus axis elongation; for example Cdh3 (aka p-cadherin) is
also implicated in PCP-mediated CE movements in the mouse skin (Cetera et al., 2018).
Our data argue that local asymmetric cis-clustering of Cdh3 is essential for the shortening of cell-
cell junctions joining anteroposteriorly neighboring cells. Ultimately, such shortening is the result of
the combined action of junction contraction and directed cell crawling (Huebner and Wallingford,
2018). In epithelial cells, contraction occurs apically, while cell crawling acts basolaterally (Sun et al.,
2017; Williams et al., 2014). In Xenopus mesenchymal cells, which lack apical-basal polarity, we
have found that the two mechanisms are integrated, driving more effective intercalation when both
mechanisms act simultaneously (Weng et al., 2021). Another key challenge, therefore, will be to ask
how the asymmetry of Cdh3 clustering observed here relates to contraction and/or cell crawling-
based intercalation. Our imaging of actin dynamics argues against the simple interpretation that
enhanced clustering relates directly to protrusive activity (Figure 4—figure supplement 1). Thus,
integrating our findings here with previous work on Cdh3 in lamellipodial protrusions and in tissue
boundary formation during Xenopus CE will also be important (see Fagotto et al., 2013;
Pfister et al., 2016).
Finally, we note that our work here provides an important complement to the already extensive
literature on CE and cadherin function in Drosophila. This is important because unlike all vertebrate
animals, PCP proteins are dispensable for CE in Drosophila (Zallen and Wieschaus, 2004). Since
PCP-mediated CE is essential for neural tube closure and PCP genes are among the most well-
defined genetic risk factors for human neural tube defects (Butler and Wallingford, 2017;
Wallingford et al., 2013), our data provide insights that span from the fundamental physics of living
cells, to the cell and developmental biology of vertebrate axis elongation, to the etiology of human
birth defects.
Materials and methods
Xenopus embryo manipulations
Ovulation was induced by injection of adult female Xenopus with 600 units of human chorionic
gonadotropin and animals were kept at 16˚C overnight. Eggs were acquired the following day by
squeezing the ovulating females and eggs were fertilized in vitro. Eggs were dejellied in 3% cysteine
(pH 8) 1.5 hr after fertilization and embryos were reared in 1/3X Marc’s modified Ringer’s (MMR)
solution. For microinjection, embryos were placed in 2% ficoll in 1/3X MMR and then washed in 1/3X
MMR after injection. Embryos were injected using a Parker’s Picospritizer III with an MK1 manipula-
tor. Embryos were injected in the dorsal blastomeres at the four cells stage targeting the presump-
tive dorsal marginal zone. Keller explants were excised at stage 10.25 in Steinberg’s solution using
eyelash hair tools.
Morpholino, plasmids, antibody, and cloning
The Cdh3 morpholino had been previously described (Ninomiya et al., 2012) and was ordered from
Gene Tools. Cdh3-GFP, (Pfister et al., 2016) lifeact-RFP, and membrane-BFP were made in pCS105
and Xdd1 was made in CS2myc (Sokol, 1996). Cdh3 antibody was ordered from Developmental
Huebner, Malmi-Kakkada, et al. eLife 2021;10:e65390. DOI: https://doi.org/10.7554/eLife.65390 13 of 29Research article Physics of Living Systems Cell Biology
Studies Hybridoma Bank (catalog number 6B6). The Cdh3-cis-mutant was generated using the Q5
Site-Directed Mutagenesis Kit (NEB, catalog number A13282) and here we changed valine 259 to
aspartic acid and isoleucine 353 to aspartic acid.
Morpholino and mRNA microinjections
Capped mRNA was generated using the ThermoFisher SP6 mMessage mMachine kit (catalog num-
ber AM1340). mRNAs were injected at the following concentrations per blastomere, Membrane-BFP
(100 pg), Cdh3-GFP for imaging (50 pg), Cdh3-GFP for rescue (300 pg), Cdh3-cis-mutant (300 pg),
lifeact-RFP (100 pg), and Xdd1 (1 ng). Cdh3 morpholino was injected at a concentration of 10 ng per
blastomere.
Imaging Xenopus explants
Explants were mounted on fibronectin coated glass coverslips in either Steinberg’s solution or Danil-
chik’s for Amy solution. Experiments were repeated in the absence of fibronectin to ensure fibronec-
tin did not confound results. Explants were incubated at room temperature for 4 hr or at 16˚C
overnight before imaging. Standard confocal images were acquired with either a Nikon A1R or a
Zeiss LSM 700. Super-resolution images were acquired with a commercially available instantaneous
structured illumination microscope (BioVision Technologies). Standard confocal time-lapse movies
were acquired with a 20 s time interval and super resolution images were acquired with a 2 s time
interval. All images were acquired at a z-depth of 5 mm above the coverslip to insure similar z-depth
sampling between images.
Measurement of Cdh3 intensity at cell junctions
All image analyses were performed using the open-source image analysis software Fiji
(Schindelin et al., 2012). Images were first processed with 50-pixel rolling ball radius background
subtraction and smoothed with a 3 3 averaging filter, which allowed better distinction of individual
cadherin clusters. The segmented line tool, with width set to the thickness of the junction (~16 pix-
els), was used to set a line of interest (LOI) across the length of the cell junction. Next the multi-plot
tool was used to extract cdh3 intensity values across the length of the cell junction and the measure
tool was used to collect data such as junction length and mean intensity values. The Fiji Time Lapse
plugin Line Interpolator Tool was used to make successive measurements for movies. Here a seg-
mented line LOI was drawn every 10–30 frames, the line interpolator tool was then used to fill in the
LOIs between the manually drawn LOIs allowing rapid semi-manual segmentation. The multi-plot
tool and measure tool were then used to extract data for each time-point of the movie. Source data
for all imaging experiments can be found in the Dryad Server (doi: 10.5061/dryad.pg4f4qrph).
Cdh3 immunostaining
Samples were prepared by micro-dissection as described above and incubated at room temperature
for 4 hr or overnight at 16˚C. Samples were then fixed in 1x MEMFA for 1 hr at room temperature
and washed three times with PBS to remove fixative. Next samples were permeabilized with 0.05%
Triton X-100 in PBS for 30 min and then blocked in 1% normal goat serum (NGS) in PBS for 2 hr at
room temperature. The primary antibody was then diluted 1:100 in fresh 0.1% NGS/PBS and sam-
ples were incubated with primary antibody at 4˚C overnight. Samples were then blocked a second
time at room temperature for 1 hr and then washed twice with fresh blocking solution. Secondary
antibody (goat anti-Mouse 488, #A32723) was diluted 1:500 and samples were incubated at 4˚C
overnight. Finally, samples were washed three times in 1X PBS and imaged.
Embryo length to width measurement
Embryos were injected in the dorsal blastomeres with Cdh3-MO, Cdh3-MO + Cdh3 GFP (rescue),
Cdh3-MO + Cdh3 cis-mutant (mutant),or left as un-injected controls. Live embryos were kept at
room temperature for 26 hr post fertilization (~stage 33). Embryos were then fixed with MEMFA in
glass vials on and rotated for 1 hr at room temperature. Post fixation samples were washed three
times in 0.1% Tween-20 in 1X PBS and then images of embryos were acquired using a Zeiss AXIO
Zoom stereoscope. The embryos anterior-posterior length and dorsal-ventral width were then mea-
sured using Fiji.
Huebner, Malmi-Kakkada, et al. eLife 2021;10:e65390. DOI: https://doi.org/10.7554/eLife.65390 14 of 29Research article Physics of Living Systems Cell Biology
Embryo survivability assay
Embryos were injected in the same manner as done for the length to width measurement and the
number of embryos injected for each condition was recorded. Embryos were then kept at room tem-
perature for 20 hr (~stage 20) and the number of surviving embryos was recorded. The percentage
of embryos surviving (embryo integrity) was reported.
Measurement of Cdh3 knockdown efficiency
Embryos were injected at the four-cell stage in a single dorsal blastomere with Cdh3-
MO + membrane BFP generating embryos with mosaic knockdown of Cdh3 on the dorsal side of
the embryo. Explants were next dissected from embryos, immuno-stained for Cdh3, and images
were acquired as described above. The mosaic labeling allowed us to compare wild type and Cdh3-
KD cells (marked by membrane-BFP) within a single explant. First, we used Fiji to measure endoge-
nous Cdh3 intensity at cell junctions in wild type and Cdh3-KD cells and used a t-test to statistically
compare these conditions. Next cellular polarity was assessed for each condition by measuring the
ratio of the mediolateral length to the anterior-posterior width of individual cells.
Acknowledgements
We thank Dan Dickinson for use of the iSIM microscope and for critical reading and helpful discus-
sions. We thank Andy Ewald for critical reading of the manuscript. This work was supported by
grants from the NICHD (R21HD084072) and the NIGMS (R01GM104853) to JBW and from the NSF
(Phys 17–08128) and the Collie-Welch Chair through the Welch Foundation (F-0059) to DT.
Additional information
Funding
Funder Grant reference number Author
Eunice Kennedy Shriver Na- R01HD099191 John B Wallingford
tional Institute of Child Health
and Human Development
National Science Foundation Phys 17-08128 D Thirumalai
Welch Foundation F-0059 D Thirumalai
The funders had no role in study design, data collection and interpretation, or the
decision to submit the work for publication.
Author contributions
Robert J Huebner, Conceptualization, Data curation, Formal analysis, Validation, Investigation, Visu-
alization, Writing - review and editing; Abdul Naseer Malmi-Kakkada, Conceptualization, Data cura-
tion, Software, Formal analysis, Visualization, Methodology, Writing - review and editing; Sena
Sarıkaya, Investigation, Visualization; Shinuo Weng, Investigation, Methodology; D Thirumalai, For-
mal analysis, Supervision, Funding acquisition, Visualization, Project administration, Writing - review
and editing; John B Wallingford, Conceptualization, Supervision, Funding acquisition, Writing - origi-
nal draft, Project administration, Writing - review and editing
Author ORCIDs
Robert J Huebner https://orcid.org/0000-0001-8778-9689
Abdul Naseer Malmi-Kakkada https://orcid.org/0000-0002-5429-4652
Sena Sarıkaya https://orcid.org/0000-0001-5008-2065
Shinuo Weng https://orcid.org/0000-0001-7932-913X
D Thirumalai https://orcid.org/0000-0003-1801-5924
John B Wallingford https://orcid.org/0000-0002-6280-8625
Huebner, Malmi-Kakkada, et al. eLife 2021;10:e65390. DOI: https://doi.org/10.7554/eLife.65390 15 of 29You can also read