Molecular determinants of large cargo transport into the nucleus - eLife
←
→
Page content transcription
If your browser does not render page correctly, please read the page content below
RESEARCH ARTICLE

                                    Molecular determinants of large cargo
                                    transport into the nucleus
                                    Giulia Paci1,2,3, Tiantian Zheng4, Joana Caria1,2,3, Anton Zilman4,5*,
                                    Edward A Lemke1,2,3*
                                    1
                                     Biocentre, Johannes Gutenberg-University Mainz, Mainz, Germany; 2Institute of
                                    Molecular Biology, Mainz, Germany; 3European Molecular Biology Laboratory,
                                    Heidelberg, Germany; 4Department of Physics, University of Toronto, Toronto,
                                    Canada; 5Institute for Biomaterials and Biomedical Engineering (IBBME), University
                                    of Toronto, Toronto, Canada

                                    Abstract Nucleocytoplasmic transport is tightly regulated by the nuclear pore complex (NPC).
                                    Among the thousands of molecules that cross the NPC, even very large (>15 nm) cargoes such as
                                    pathogens, mRNAs and pre-ribosomes can pass the NPC intact. For these cargoes, there is little
                                    quantitative understanding of the requirements for their nuclear import, especially the role of
                                    multivalent binding to transport receptors via nuclear localisation sequences (NLSs) and the effect
                                    of size on import efficiency. Here, we assayed nuclear import kinetics of 30 large cargo models
                                    based on four capsid-like particles in the size range of 17–36 nm, with tuneable numbers of up to
                                    240 NLSs. We show that the requirements for nuclear transport can be recapitulated by a simple
                                    two-parameter biophysical model that correlates the import flux with the energetics of large cargo
                                    transport through the NPC. Together, our results reveal key molecular determinants of large cargo
                                    import in cells.

*For correspondence:
                                    Introduction
zilmana@physics.utoronto.ca (AZ);   Cargo transport across the nuclear envelope is a hallmark of eukaryotic cells and is central to cellular
edlemke@uni-mainz.de (EAL)          viability (Knockenhauer and Schwartz, 2016; Jamali et al., 2011; Fahrenkrog and Aebi, 2003). In
                                    a typical HeLa cell, more than 2000 nuclear pore complexes (NPCs) span the nuclear envelope
Competing interests: The
                                    (Ribbeck and Görlich, 2001; Maul et al., 1972). With » 120 MDa in metazoans (Reichelt et al.,
authors declare that no
                                    1990) and roughly half that weight in yeast (Rout and Blobel, 1993; Yang et al., 1998), the NPC is
competing interests exist.
                                    among the largest macromolecular complexes found inside the cell. NPCs are the gatekeepers of
Funding: See page 20                nucleocytoplasmic transport and restrict access of cargoes larger than the typically reported thresh-
Received: 12 February 2020          old of 40 kDa (Paine et al., 1975; Keminer and Peters, 1999; Mohr et al., 2009), albeit recent
Accepted: 18 June 2020              work points to a rather ‘soft’ barrier model and a gradual decrease of passive transport rates with
Published: 21 July 2020             size (Timney et al., 2016). However, cargoes that present a nuclear localisation sequence (NLS) and
                                    bind nuclear transport receptors (NTRs) can rapidly enter into the nucleus. Several studies have char-
Reviewing editor: Robert H
Singer, Albert Einstein College
                                    acterized the NTR-mediated transport process, typically focusing on cargoes with one to five NLSs,
of Medicine, United States          and their nuclear import kinetics have been shown to follow a mono-exponential behaviour
                                    (Ribbeck and Görlich, 2001; Kopito and Elbaum, 2007; Timney et al., 2006).
   Copyright Paci et al. This
                                       NPCs are remarkable in the diversity of sizes of cargoes they can transport, ranging from import
article is distributed under the
                                    of nuclear proteins (including histones and transcription factors), to viral import and nuclear export
terms of the Creative Commons
Attribution License, which          of pre-ribosomal subunits and mRNA complexes (Panté and Kann, 2002; Grünwald and Singer,
permits unrestricted use and        2010; Grünwald et al., 2011; Babcock et al., 2004; Mor et al., 2010; Au and Panté, 2012). How
redistribution provided that the    very large cargoes (>15 nm) can be efficiently transported is still an enigma, especially considering
original author and source are      the dimensions and structure of the transport conduit itself. The NPC is formed by multiple copies
credited.                           of about 30 proteins, two thirds of which are folded proteins that assemble the NPC scaffold. The

Paci et al. eLife 2020;9:e55963. DOI: https://doi.org/10.7554/eLife.55963                                                            1 of 24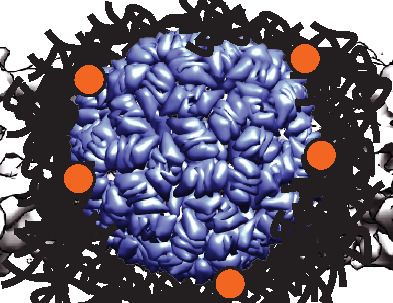
Research article                                                            Cell Biology Structural Biology and Molecular Biophysics

                                    eLife digest Eukaryotes, such as animals, plants and fungi, store the genetic material within
                                    their cells inside a specific compartment called the nucleus. Surrounding the nucleus is a protective
                                    membrane which molecules must pass across in order to reach the cell’s DNA. Straddling the
                                    membrane are nuclear pore complexes, or NPCs for short, which act as the gatekeepers to the
                                    nucleus, shuttling thousands of different molecules back and forth whilst restricting access to others.
                                        Large cargoes need to have specific markers on their surface called nuclear localization signals in
                                    order to be transported by NPCs. Certain transporter proteins help the NPC carry large molecules
                                    across the membrane by binding to these signals. This generates the energy needed to overcome
                                    the barrier of transporting it across the membrane.
                                        Some viruses have nuclear localization signals of their own, which can exploit this transport
                                    system; these signals allow the virus to enter the nucleus and hijack the genetic machinery of the
                                    cell. It has been suggested that viruses have multiple copies of these surface signals to improve their
                                    chances of reaching the nucleus. However, it remained unclear how the number of nuclear
                                    localization signals affects the transport of large molecules into the nucleus.
                                        To answer this question, Paci et al. engineered a range of different sized particles derived from
                                    viral structures which had varying numbers of nuclear localization signals on their surface. These
                                    particles were inserted into human cell lines grown in the laboratory, and imaged to see how they
                                    were transported into the nucleus. The rate of nuclear transport was then measured for each
                                    particle, and this data was used to create a mathematical model.
                                        Paci et al. found that the larger the cargo, the more nuclear localization signals it needed to be
                                    efficiently transported across the membrane into the nucleus. This is because inserting big cargoes
                                    into the NPC requires more energy. Therefore, by increasing the number of surface signals
                                    transporter proteins can bind to, larger molecules are able to interact with the NPC and generate
                                    the energy required for crossing.
                                        These findings improve our current understanding of how nuclear transport could be hijacked by
                                    viruses. It could also help scientists who are developing targeted nanoparticles to deliver therapies
                                    for genetic conditions to the nucleus.

                                    recent improvements in electron tomography (ET), paired with X-ray crystallography, have greatly
                                    expanded our knowledge on the organisation of these folded components of the NPC (von Appen
                                    et al., 2015; Szymborska et al., 2013; Lin et al., 2016; Kosinski et al., 2016). This pore-like scaf-
                                    fold is filled with multiple copies of » 10 different intrinsically disordered proteins, known as FG
                                    nucleoporins (FG Nups), which form the NPC permeability barrier. FG repeats have been estimated
                                    to be at concentrations in the mM range inside the NPC (Aramburu and Lemke, 2017; Frey and
                                    Görlich, 2007). Our structural knowledge about the actual transport conduit compared to the scaf-
                                    fold is much lower, as its dynamic nature leads to a loss of electron density in the averaging process
                                    inherent to ET, leaving a » 40 nm wide ‘hole’ inside the structural map of the NPC tomogram. As
                                    the transport of many large cargoes is believed not to irreversibly alter the structure of the NPC,
                                    substantial amounts of FG Nups mass must be displaced in order to facilitate such transport events.
                                    In addition to dynamics in the permeability barrier, dilation mechanisms in the scaffold structure
                                    itself have also been suggested (Beck and Hurt, 2017).
                                        Despite its high biological relevance, nuclear transport of large cargoes is still poorly understood.
                                    In order to address this gap, we designed a set of large model cargoes based on capsid-derived
                                    structures. In contrast to using fully physiological large cargoes, such as complete viruses, this strat-
                                    egy enabled us to titrate key features such as size, number of binding sites and surface properties.
                                    This reductionist approach opened the possibility to experimentally measure a rigorous set of bio-
                                    physical parameters. We used a combination of spectroscopy and semi-automated microscopy
                                    assays to investigate the kinetics of nuclear import of cargoes ranging from 17 to 36 nm in diameter
                                    and with a number of NLSs between 0 and 240 in permeabilised cells. Our results uncovered the
                                    quantitative dependence of cargo size and NLS number in an understudied size range. The results
                                    are rationalized using a minimal physical model of nuclear transport that takes into account the

Paci et al. eLife 2020;9:e55963. DOI: https://doi.org/10.7554/eLife.55963                                                               2 of 24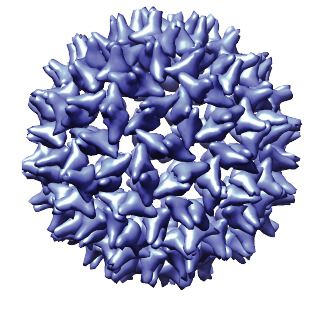
Research article                                                            Cell Biology Structural Biology and Molecular Biophysics

                                    energy gain from NTR binding to FG motifs, and the free energy cost needed for the insertion of a
                                    large particle into a densely filled channel.

                                    Results and discussion
                                    A large cargo toolkit for nuclear transport studies
                                    We first aimed to develop a set of model import cargoes with known size and tuneable number of
                                    NLSs (#NLSs) on their surface. Naturally occurring cargoes with multiple NLSs, such as proteasomes,
                                    pre-ribosomes, mRNA or RNA-protein complexes do not offer the possibility to control both proper-
                                    ties reliably at the same time. Vice versa, for artificial large substrates, like quantum dots or gold
                                    nanoparticles, it can be challenging to tune size and #NLSs and extensive functionalisation is typically
                                    required. Thus we turned to viral capsids, which are known to self-assemble from one or few proteins
                                    into large structures of fixed size. We screened the literature for capsid-like particles obeying the fol-
                                    lowing criteria: i) Large-scale high yielding recombinant expression is possible in an expression host
                                    like Escherichia coli. ii) Surface modification via a unique residue is possible. Thus, we focused on sys-
                                    tems with existing crystal and/or EM structures and checked for single functional surface exposed
                                    cysteines or the possibility of mutating another residue to one with no impact on capsid assembly.
                                    iii) Capsid is stable at physiological conditions. iv) Capsid diameter is between 15 nm and 40 nm:
                                    this size range focuses on rather uncharted territory, with its upper limit reported to be the largest
                                    size of cargoes transported by the NPC (Hepatitis B virus, Panté and Kann, 2002). As a result, the
                                    following four icosahedral shaped capsids of different size were selected for this study (Figure 1).
                                         MS2S37P (diameter 17 nm): This capsid is derived from the bacteriophage MS2, formed by a sin-
                                    gle coat protein with a point mutation S37P. The coat protein assembles into dimers and then into
                                    12 pentamers yielding an icosahedron with a total of 60 copies (Asensio et al., 2016). A cysteine
                                    mutation (T15C) that had previously been shown not to interfere with capsid assembly was intro-
                                    duced to allow surface tagging via maleimide labelling (Peabody, 2003).
                                         I53-47 (diameter 23 nm): This artificial capsid is derived from de novo designed capsids devel-
                                    oped by the Baker lab (Bale et al., 2016). The I53-47 variant is formed by two different proteins
                                    (chain A and chain B), occurring in 60 copies each and organised into 12 pentamers and 20 trimers.
                                    A cysteine mutation exposed on the capsid surface was introduced in chain B (D43C), following the
                                    recent work where different surface mutations were introduced in a similar capsid variant
                                    (Butterfield et al., 2017). We note that another synthetic capsid of a similar type but 27 nm in diam-
                                    eter, I53-50, could not be specifically labelled and thus was not included in this work (Figure 1—fig-
                                    ure supplement 1).
                                         MS2 (diameter 27 nm): This capsid is derived from the wild-type bacteriophage MS2 coat protein,
                                    which in total of 180 copies assembles into dimers and then into an icosahedron with 12 pentameric
                                    and 20 hexameric faces. The same cysteine mutation as in MS2S37P (T15C) enabled tagging via mal-
                                    eimide labelling (Peabody, 2003).
                                         Hepatitis B capsid (diameter 36 or 32 nm depending on isoform): This capsid is based on an
                                    assembly-competent truncated version of the HBV core protein (aa 1–149). This truncation leads to
                                    higher levels of bacterial expression and to a predominance of the T = 4 capsid (36 nm) with no obvi-
                                    ous change in capsid morphology (Zlotnick et al., 1996). The core protein thus assembles mainly
                                    into 12 pentameric and 30 hexameric units, for a total of 240 copies. The truncation also removes
                                    the C-terminal native NLS (which can be buried inside the capsid), enabling a complete control over
                                    the number of exposed NLSs via surface engineering. A cysteine mutation (S81C) was introduced
                                    into an exposed loop of the core protein (c/e1 epitope) to allow surface tagging via maleimide label-
                                    ling. The Hepatitis B capsid is frequently quoted as the largest cargo known to pass the NPC intact
                                    (Panté and Kann, 2002), and constitutes the upper limit of the cargoes we investigated.
                                         After successful purification, the next step was to engineer the capsid surface with a fluorescent
                                    dye and with NLSs. As detailed in the methods, the use of tangential flow for sample concentration
                                    and buffer exchange turned out to be of highest practical relevance to purify preparative amounts
                                    of intact capsids for further labelling reactions. We chose maleimide reactive dyes and a synthetic
                                    maleimide reactive NLS, with a sequence known to bind tightly to Importina, which binds to
                                    Importinb via its IBB domain (Hodel et al., 2001). Capsids were labelled with suitable mixtures of
                                    dye and NLS peptide simultaneously.

Paci et al. eLife 2020;9:e55963. DOI: https://doi.org/10.7554/eLife.55963                                                               3 of 24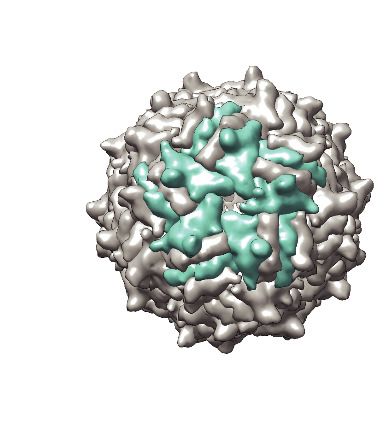
Research article                                                                    Cell Biology Structural Biology and Molecular Biophysics

     A

                                                                                                                                    NLS
                                                                           +          NLS

                                                                                                                                          NL
                                                                                                                                          S
     B

                 MS2S37P                            I53-47                             MS2                                     HBVcore
     C                                                D                                        E
       kDa            #NLSs         fluorescence
                                                                                        S37P
                                                            1.0                     MS2
       130 -                                                                                                    40
       100 -                                                                        I53-47
                                                                                                Diameter (nm)

        70 -                                                0.8                     MS2
                                                                                                                30
        55 -                                                0.6
                                                     G(t)

        40 -                                                                                                    20
        35 -                                                0.4
        25 -                                                                                                    10
                                                            0.2
         15 -
                                                            0.0                                                 0
         10 -                                                  0.01         1        100                             MS2S37P I53-47 MS2    HBV
                                                                      Correlation time (ms)

Figure 1. A large cargo ‘toolkit’ for nuclear import studies. (A) Schematic representation of the mixed labelling reaction with maleimide reactive NLS
peptide and maleimide reactive fluorescent dye. The capsid protein, containing a cysteine mutation (in red), self-assembles into a capsid. The purified
capsids are then labelled with a mixture of dye and NLS peptide, in different ratios according to the desired reaction outcome. (B) Capsid structures
rendered in Chimera (Pettersen et al., 2004) (top) and EM images of the purified capsids (bottom). The scale bar corresponds to 50 nm. (C) SDS-PAGE
gel of MS2S37P samples with increasing number of NLS peptides attached (top band). The lower band corresponds to a capsid protein tagged with dye
or no dye, but 0 NLS. The upper band corresponds always to the capsid protein without any dye, but NLS, as evident from the fluorescent scan on the
right side. (D) Representative FCS autocorrelation curves for the MS2S37P, I53-47 and MS2 capsids. The curves were fitted with a diffusion model to
calculate the capsid brightness and concentration. (E) DLS quantification of capsid diameters (blue bars) compared with reference values from literature
and structural information (red bars).
The online version of this article includes the following figure supplement(s) for figure 1:
Figure supplement 1. I53-50 capsid.

Paci et al. eLife 2020;9:e55963. DOI: https://doi.org/10.7554/eLife.55963                                                                        4 of 24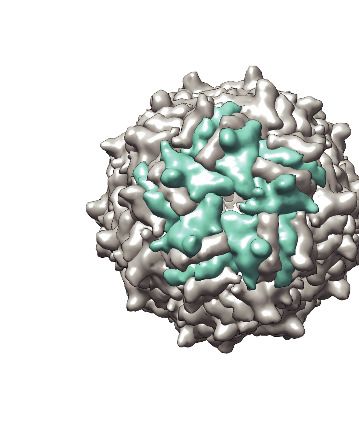
Research article                                                              Cell Biology Structural Biology and Molecular Biophysics

                                        Figure 1 summarises the labelling scheme used for all capsids and its characterisation. Figure 1B
                                    shows negative staining EM images of capsids after purification and labelling, visualizing intact cap-
                                    sids with the expected diameter. To guarantee the robustness of the quantitative experiments, it
                                    was crucial to determine each capsids’ fluorescence brightness (i.e. how many dyes are attached to
                                    one capsid) as well as the #NLSs. The #dyes/capsid was determined via fluorescence correlation
                                    spectroscopy (FCS), a widely employed biophysical tool to probe brightness and concentration of a
                                    freely diffusing species (Figure 1D, Table 1). FCS can also be used to estimate the size and size dis-
                                    tribution (such as substantial contaminations of other species than intact capsids) of the samples,
                                    which was found to be in line with the high purity indicated by the EM micrographs. Additional DLS
                                    (dynamic light scattering) studies were employed to further validate capsid diameter in solution and
                                    presence of intact capsids as the dominant species (Figure 1E). The #NLSs was determined from gel
                                    shift assays, as NLS-labelled capsid monomers migrate substantially different than their unlabelled
                                    counterparts. In contrast, the dye labelling did not alter capsid monomers mobility on gel
                                    (Figure 1C). Estimated #NLSs and #dyes/capsid are listed for all samples in Table 1. The presence
                                    of a single cysteine per monomer ensures that each is labelled either with NLS or dye, but not both:
                                    in this way, unassembled monomers cannot be fluorescently detectable NLS-dependent import

Table 1. Sample properties and parameters from fits of import kinetics.
Here we list all capsid sample properties (estimated #NLSs and #dyes per capsids), as well as all parameters extracted from fitting the
import traces with an inverse exponential I ðt Þ ¼ A þ IMAX ð1 e t t Þ. The initial flux is calculated as J ¼ IMAX  t . When different biologi-
cal replicates were measured for the same sample, the values indicate the average.
                    sample             #dyes             #NLSs              A             IMAX            t                J               DG
    S37P
MS2                 1                  23                0                  0.24          0.39            0.022            0.01            6.34
                    2                  15                14                 0.65          0.94            0.054            0.05            4.54
                    3                  30                19                 1.12          12.44           0.041            0.49            2.01
                    4                  34                23                 0.64          16.63           0.053            0.88            1.25
                    5                  25                29                 0.33          28.91           0.022            0.64            1.51
                    6                  38                38                 1.45          43.59           0.037            1.60              0.02
                    7                  10                54                 2.33          49.76           0.029            1.37            0.32
I53-47              8                  24                0                  0.18          1.58            0.018            0.03            5.27
                    9                  30                15                 0.80          3.71            0.085            0.32            3.19
                    10                 31                18                 3.81          3.89            0.056            0.22            3.29
                    11                 36                22                 2.34          2.95            0.080            0.23            3.36
                    12                 16                22                 2.01          5.35            0.060            0.32            3.04
                    13                 31                25                 1.83          2.91            0.094            0.27            3.15
                    14                 6                 30                 2.27          7.22            0.063            0.45            2.41
                    15                 3                 35                 1.18          16.82           0.048            0.81            1.49
                    16                 8                 37                 1.21          6.67            0.053            0.35            2.28
                    17                 3                 37                 2.16          13.80           0.059            0.81            1.52
                    18                 10                41                 1.13          13.92           0.057            0.79            1.54
                    19                 8                 44                 0.31          11.78           0.038            0.45            2.00
MS2                 20                 50                0                  0.07          0.18            0.038            0.01            6.88
                    21                 38                42                 0.47          0.52            0.106            0.05            4.94
                    22                 58                54                 0.19          1.07            0.241            0.26            2.95
                    23                 44                57                 0.07          1.83            0.074            0.13            3.49
                    24                 52                77                 0.47          1.31            0.072            0.09            3.96
                    25                 61                86                 0.55          2.67            0.042            0.11            3.72
                    26                 57                93                 0.38          2.04            0.051            0.10            3.88
                    27                 54                98                 0.27          3.82            0.033            0.12            3.49

Paci et al. eLife 2020;9:e55963. DOI: https://doi.org/10.7554/eLife.55963                                                                 5 of 24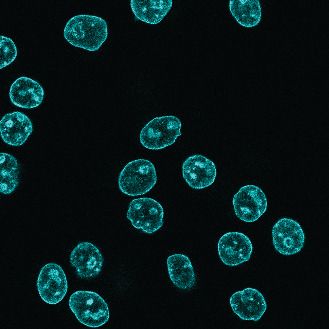
Research article                                                           Cell Biology Structural Biology and Molecular Biophysics

                                    substrates. We note that labelling with a synthetic NLS pre-tagged with a dye was found to be
                                    impractical in preliminary experiments, as the unreacted species can contribute to elevated back-
                                    ground fluorescence in the nucleus.

                                    Import kinetics of large cargoes are tuned by size and NLS numbers
                                    (#NLS)
                                    The different labelled capsids samples (total 30, Table 1) were subjected to nuclear import assays
                                    using the widely employed permeabilised cell assay (Adam et al., 1990). Figure 2A outlines the
                                    details of the experiments. In brief, mild digitonin treatment was used to permeabilise the plasma
                                    membrane of HeLa cells, leaving the nuclear envelope intact. In these conditions, functional nucleo-
                                    cytoplasmic transport can be reconstituted for a few hours by adding the key components of the
                                    transport machinery: Importinb, Importina, RanGDP, NTF2 (a NTR which allows recycling of
                                    RanGDP) and GTP to the cells. Intactness of the nuclear envelope and functional nuclear transport
                                    were always validated by a set of control experiments using fluorescently labelled dextran and
                                    model cargoes (see Materials and methods). As shown in Figure 2B exemplarily for the MS2S37P and
                                    MS2 capsids, cargoes labelled with NLSs showed an increased nuclear accumulation over time, indic-
                                    ative of functional nuclear import.
                                       Experiments were performed on a semi-automated confocal microscope, recording time-lapse
                                    images over several cells and different field of views (error bars correspond to standard deviations
                                    between different FOV). Note that for practical reasons, imaging always started ~ 2 min after addi-
                                    tion of the transport mix to the cells. This timing offset was accounted for by an offset fitting param-
                                    eter A in our fit equation (I ðt Þ ¼ A þ IMAX ð1 e t t Þ).
                                       Besides the nuclear signal, we also recorded the nuclear envelope and cytoplasmic signals using
                                    suitable imaging masks (Figure 2C, Materials and methods and Source code 1 for details). We took
                                    precautions to distinguish nuclear fluorescence from nuclear envelope fluorescence by eroding the
                                    nuclear mask to a region furthest away from the rim. This turned out to be important, as some cap-
                                    sids showed nuclear envelope targeting but no substantial accumulation into the nucleoplasm (for
                                    instance, HBV and MS2 capsids with few NLSs). In addition, this method enabled us to discriminate
                                    nuclear signal from sticking of capsids to the cytoplasm, which was observed in some cases.
                                       Figure 2D summarises the three kinetic traces that were obtained from a typical experiment. In
                                    the representative experiment shown for a MS2S37P capsid sample, the cytoplasmic fluorescence
                                    stayed constant, while nuclear envelope signal increased pointing to recruitment and accumulation
                                    of capsids at the NPCs. The red curve shows the import kinetics of capsids into the nucleus. Fig-
                                    ure 2—figure supplement 1 shows additional control experiments (addition of the Importina export
                                    receptor CAS to transport mix and excess of GTP or Importina) to establish that the observed satu-
                                    rating nuclear import depends on the substrate size and #NLSs and is not due to any of the compo-
                                    nents in the transport mix becoming limiting during the course of the experiment.
                                       To further support our findings under fully physiological conditions, we carried out microinjection
                                    of representative capsid samples in starfish oocytes to observe their nuclear accumulation in live
                                    cells. The results of these experiments are presented in Figure 2—figure supplement 2 and are
                                    qualitatively in agreement with the quantitative nuclear import assays in permeabilised cells
                                    described in the next paragraph.
                                       Figure 3 shows representative nuclear import data for the three kinetically investigated capsids
                                    MS2S37P, I53-47 and MS2 (see Figure 3—figure supplement 1 for full dataset). The results for HBV
                                    capsids will be discussed in the next paragraph. Figure 3 panel A displays typical confocal images of
                                    cargoes with different #NLSs and panel B shows representative nuclear kinetic traces extracted from
                                    semi-automated microscopy. Figure 3—figure supplement 1 shows the full dataset overlaid with
                                    the mono-exponential fits. In absence of NLSs (0 NLSs), all capsids localised to the cytoplasm and no
                                    targeting to the nuclear envelope or accumulation in the nucleus was observed, in line with an
                                    Importin-dependent pathway. With increasing #NLSs present on the capsid surface we observed
                                    progressive nuclear envelope targeting, and eventually, efficient accumulation of cargo in the nucle-
                                    oplasm. Strikingly, the #NLSs required to observe similar behavior with different capsids scaled dra-
                                    matically with cargo size, as can be seen by comparing for example the I53-47 sample image with 35
                                    NLSs and the MS2 one with 86 NLSs. The observation of robust bulk import for all capsid constructs
                                    with sufficiently high #NLSs highlights another benefit of using viral capsids as large cargo models:

Paci et al. eLife 2020;9:e55963. DOI: https://doi.org/10.7554/eLife.55963                                                              6 of 24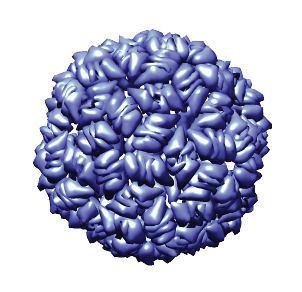
Research article                                                            Cell Biology Structural Biology and Molecular Biophysics

     A                                                                                    Importinβ

                                                   Permeabilise                    NTF2
                                                         +                                         Cargo
                                                   transport mix          Importinα                    RanGDP
                                                                                                                                 Imaging

     B
         MS2S37P
         MS2

                   4 min              8 min            20 min                    40 min            60 min               80 min

                                                                                                                                      Time
     C                                                             D
                                       Create
                                        mask
                                                                                          nucleus
                                                                                          envelope
                                                                               1200       cytoplasm
                                                Nucleus
                                                                   Intensity

                                                                               800
                      Hoechst

                    Mitotracker
                                                                               400
                                                Cytoplasm
                                                Envelope

                                                                                 0
                                                                                      2      20             40           60            80
                                                                                                      Time (min)
                      Mitotracker               Cytoplasm

Figure 2. Pipeline for import kinetic experiments. (A) Scheme of the transport assay experiment: HeLa cells were permeabilised and incubated with a
transport mix containing the cargo of interest, nuclear transport receptors and energy. Confocal images were acquired in 12 different areas every 2 min,
for 80 min in total. (B) Representative time-lapse snapshots of cargo import (MS2S37P and MS2 capsids). The scale bar corresponds to 20 mm. (C)
Overview of the image analysis pipeline for import kinetics experiments. Two reference stain images (Hoechst and MitoTracker) were segmented and
used to generate three masks corresponding to the regions of interest: nucleus, nuclear envelope and cytoplasm. The masks were then applied to the
cargo images to calculate the average intensity in the different regions. (D) Representative raw import kinetics traces for the three cellular
compartments of interest. Note that imaging starts after 2 min of adding the transport mix to the cells. Curves depict the average fluorescence
measured in the different regions; the shaded areas represent the standard deviation over 12 areas.
The online version of this article includes the following figure supplement(s) for figure 2:
Figure supplement 1. Control experiments in permeabilised cells.
Figure supplement 2. Microinjection of capsids in live starfish oocytes.

Paci et al. eLife 2020;9:e55963. DOI: https://doi.org/10.7554/eLife.55963                                                                        7 of 24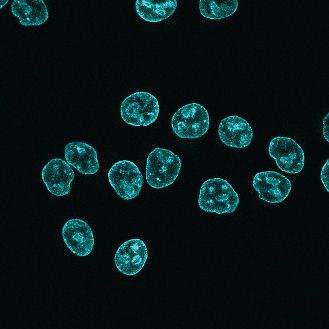
Research article Cell Biology Structural Biology and Molecular Biophysics
A B
0 NLSs 23 NLSs 38 NLSs
Hoechst
40 0 NLSs
19 NLSs
Corrected Nuclear Intensity
23 NLSs
29 NLSs
38 NLSs
30
MS2S37P
20
Alexa647
10
2 20 40 60 80
Time (min)
0 NLSs 22 NLSs 35 NLSs
16 0 NLSs
Corrected Nuclear Intensity
22 NLSs
25 NLSs
14 30 NLSs
35 NLSs
12
10
I53-47
8
6
4
2
0
2 20 40 60 80
Time (min)
0 NLSs 42 NLSs 86 NLSs
3.5 0 NLSs
Corrected Nuclear Intensity
42 NLSs
3.0 57 NLSs
86 NLSs
98 NLSs
2.5
2.0
MS2
1.5
1.0
0.5
0.0
2 20 40 60 80
Time (min)
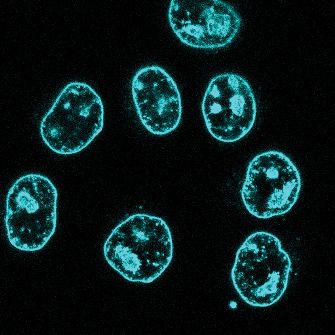
Figure 3. The import kinetics of large cargoes is tuned by the NLS number. (A) Confocal images of nuclear import of the different large cargoes. Cells
were incubated for up to 1.5 hr with capsids tagged with different number of NLS peptides on their surface. All cargoes displayed a distinct NLS-
dependent behaviour. The scale bar corresponds to 20 mm. (B) Representative nuclear import traces for the three large cargoes labelled with increasing
amount of NLS peptides. The corrected nuclear intensities are obtained by background-subtracting the raw nuclear intensities, scaling them according
to capsid brightness (#dyes) estimated from FCS (Table 1) and subtracting the initial offset A determined by the mono-exponential fit, to better
compare the import efficiencies. The corrected intensities are proportional to capsid concentration and allow us to compare the import efficiency of the
different samples. See Figure 3—figure supplement 1 for the full dataset displayed without offsetting by A and overlaid with mono-exponential fits.
The online version of this article includes the following figure supplement(s) for figure 3:
Figure 3 continued on next page
Paci et al. eLife 2020;9:e55963. DOI: https://doi.org/10.7554/eLife.55963 8 of 24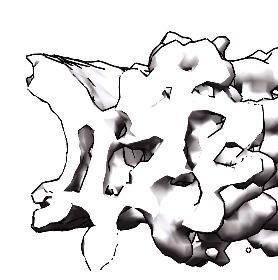
Research article                                                                       Cell Biology Structural Biology and Molecular Biophysics

Figure 3 continued
Figure supplement 1. Entire import kinetic dataset.

                                                           in a previous study using coated quantum dots (18 nm) no bulk import could be detected but only
                                                           rare import events were captured by advanced single molecule technologies (Lowe et al., 2010).

                                                           Modified HBV capsids are targeted to NPCs but do not accumulate into
                                                           the nucleoplasm
                                                           We next used the established pipeline to investigate the transport of HBV capsids, achieving a maxi-
                                                           mum of 50% capsid monomer labelling (120 NLSs). The capsids were targeted to the nuclear enve-
                                                           lope; however, no bulk nuclear import could be detected (Figure 4, first row). As we were not able
                                                           to further increase the #NLS with our chemical labelling strategies, and we wondered whether 120
                                                           NLSs might still be insufficient, we resorted to genetic tools to achieve the full coverage of 240 NLSs
                                                           per capsid. To do this, we designed a capsid based on the SplitCore construct (Walker et al.,
                                                           2011), in which a core-GFP fusion protein was split into two halves that self-assemble before forming
                                                           the capsid. This exposes a free C terminus, which we exploited to introduce an NLS. Also for this

   A                                                       B                    C
                           NLS
                                                                                    Hoechst            Alexa647
       HBVcoreS81C

                                              N
                           C
                                                  NLS

                                                                                    Hoechst            GFP
       SplitCore-NLS

                                   GFPβ1-10

                                                  GFPβ11

                                              N
                          C

                                                                                    Hoechst            Cy3B
       HBVcore-NLS

                                              N
                           C

Figure 4. The NLS-engineered Hepatitis B capsid is not imported in the nucleus of permeabilised cells. Following the same labelling approach as
described in Figure 1, HBV capsids with up to 120 NLSs were generated (first row). In order to test capsids with a higher number of NLSs exposed on
the surface, we designed two additional versions of the HBV core protein with a direct NLS insertion (total of 240 NLSs). The middle row shows a
construct based on the SplitCore-SplitGFP (Walker et al., 2011), where the HBV core protein is split via artificial stop and start codons into two halves
and fused to a split-GFP (GFPb1–10 and GFPb11), to which we further added an NLS. Once co-expressed, the two core-GFP halves self-assemble into
capsid-like particles. The last row shows a construct where the NLS is inserted in the c/e1 epitope loop of the core protein (orange loop) and a cysteine
mutation is introduced to perform labelling with a dye (red star). All capsids were targeted to the nuclear envelope but did not give rise to bulk nuclear
accumulation in import experiments using permeabilised cells. (A) Schematic representations of the different HBV core protein constructs. (B) EM
images of the purified capsids. The scale bar corresponds to 100 nm. (C) Confocal images of capsid import experiments after 1.5 hr. The scale bar
corresponds to 20 mm.

Paci et al. eLife 2020;9:e55963. DOI: https://doi.org/10.7554/eLife.55963                                                                                      9 of 24
Research article                                                              Cell Biology Structural Biology and Molecular Biophysics

                                    capsid, we did not observe any bulk import. However, the slightly increased size due to the GFP
                                    could potentially push this capsid over the maximum NPC transport size limit. We thus tested
                                    another strategy, and introduced an NLS into an exposed capsid loop (Figure 4, last row). Again, no
                                    functional bulk import could be observed. EM showed that the engineered capsids are less homoge-
                                    nous, but still a large number of intact capsid was observed. Hence we conclude that none of the
                                    tested HBV capsids constructs can functionally be enriched in the nucleus. As the chances that our
                                    careful modifications rendered the HBV capsid transport-incompetent seem rather low, our data is in
                                    line with studies that suggest that only the mature infectious virus can translocate through the NPC
                                    into the nucleoplasm (Rabe et al., 2003; Kann et al., 1999). Our results are consistent with EM data
                                    of intact HBV capsids entering the NPC barrier, (Panté and Kann, 2002) as we also see strong NE
                                    accumulation. However, additional mechanisms would be required for cargo release into the nucleo-
                                    plasm such as the previously reported structural destabilisation of mature capsids (Cui et al., 2013)
                                    or other mechanism that can disassemble capsid that are docked at the NPC. Collectively, this sug-
                                    gests that 36 nm capsids might be able to enter the NPC barrier, but are too large to pass the NPC
                                    intact into the nucleus (i.e. undock or release). We, thus, focus our global quantitative analysis on the
                                    three capsids for which we could experimentally identify conditions of functional import and nuclear
                                    enrichment.

                                    Quantitative analysis of nuclear import in relation to cargo size and
                                    #NLSs
                                    Our results on large cargo import kinetics (Figure 3) highlight the strikingly different #NLS require-
                                    ments for the nuclear import of differently sized cargoes. We formulate here a biophysical model
                                    that considers the translocation of a large ‘spherical object’ through the crowded NPC permeability
                                    barrier (scheme in Figure 5A) and enables us to extract key information about the energetics of
                                    transport from our kinetic data.
                                         The final steady state accumulation and the late kinetics of the capsid import are affected by a
                                    number of factors that are still incompletely understood – such as the competition between Ran and
                                    NTRs for the cargo, the back leakage of the cargo into the cytoplasm and potential clogging of the
                                    pores by the capsids (Kim and Elbaum, 2013a; Kim and Elbaum, 2013b). For this reason, we focus
                                    our quantitative analysis on the initial flux J (slope of the kinetic curve at the initial time point). Unlike
                                    the steady state accumulation, the initial flux J of cargoes into the nucleus is independent of the
                                    rates of cargo-NTR dissociation kinetics and is less affected by any potential rate-limiting steps in
                                    the Ran cycle (Kim and Elbaum, 2013a; Kim and Elbaum, 2013b; Görlich et al., 2003). To this end,
                                    all nuclear import curves were fitted with a mono-exponential kinetic model
                                    I ðtÞ ¼ A þ IMAX ð1 e t t Þ, with IMAX being the plateau value reached by the fit at infinity, t the reac-
                                    tion constant with units 1/s and A is the offset parameter. A accounts for any nonzero offset, which
                                    could be due to: i) initial recruitment of the cargoes to the cells and nuclear envelope. ii) limiting
                                    accuracy in pipetting and sample mixing (there is a 2-min delay in our experiments between the
                                    addition of the sample and the start of imaging) and for slightly different background levels due to
                                    non-specific adhesion of some samples to cellular structures. A is thus fitted in every experiment and
                                    not expected to be a constant. The initial flux can be calculated from the fit parameters as
                                    J ¼ IMAX  t (see Table 1 for values of all fit parameters). We emphasize that the mono-exponential
                                    fit is a mathematical tool to estimate the initial flux from the data. Calculating the initial flux from the
                                    mono-exponential fits was more robust than the alternative of measuring the initial flux directly from
                                    a linear fit of the first few data points, since the timing resolution of the experiment and the accuracy
                                    of defining the zero time point when mixing the cargo with the cells was limited. We note that more
                                    complex fits, such as bi-exponential fits have been discussed in the literature to include additional
                                    effects such as cargo leaking back into the cytoplasm. (Kim and Elbaum, 2013a; Kim and Elbaum,
                                    2013b). In Supplementary file 1, we further compare bi-exponential and the mono-exponential fits.
                                    The initial rates for all samples are plotted in Figure 5C (experimental data displayed as dots). We
                                    also note that despite the samples having different labelling ratios (see #dyes, Table 1), we con-
                                    firmed that there were no global correlations between overall #dyes/capsid ratio and extrapolated
                                    rate (R2=0.14).
                                         Based on extensive previous theoretical and experimental work on the NPC (Iyer-Biswas and Zil-
                                    man, 2016; Zilman, 2009; Zilman et al., 2007; Berezhkovskii et al., 2002; Pagliara et al., 2013),

Paci et al. eLife 2020;9:e55963. DOI: https://doi.org/10.7554/eLife.55963                                                                10 of 24
Research article Cell Biology Structural Biology and Molecular Biophysics
A
cost of insertion
binding energy
∆G = F(R) - εN
B
C
Figure 5. Effect of cargo size and number of NLSs (#NLSs) on import kinetics and biophysical model. (A) Cartoon
of the determinants for large cargo import: the free energy cost of inserting a large cargo into the dense FG Nup
barrier must be compensated by the binding to FG Nups via multiple NTRs (binding sites represented in orange,
NTRs omitted for simplicity). The NPC scaffold structure is from EMD-8087. (B) Dependence of DG on the capsid
size and #NLS for aRan ¼ 2. Shaded regions show one standard deviation of F ðRÞ and . Fitted values for F ðRÞ and
are shown in Table 2. (C) Initial flux (corresponding to the slope of the kinetic curve at the initial time point)
modelled as J / aRan þe1FðRÞ N overlaid on the (normalised) experimental data (dots). Additional experiments with
MS2S37P capsids containing additional charges are overlaid and shown as squares. Whenever independent
biological replicates were available, the initial flux is calculated as an average and shown with the error extracted
from the technical replicates (12 areas imaged in each experiment). In Figure 5—figure supplement 5 we show
that the uncertainty between different cells imaged in a single experiment captures well the variability of
independent experiments.
Figure 5 continued on next page
Paci et al. eLife 2020;9:e55963. DOI: https://doi.org/10.7554/eLife.55963 11 of 24Research article Cell Biology Structural Biology and Molecular Biophysics
Figure 5 continued
The online version of this article includes the following figure supplement(s) for figure 5:
Figure supplement 1. Results from biophysical model with aRan ¼ 1.
Figure supplement 2. Results from biophysical model where the data point for #NLS=0 is excluded from the fit.
Figure supplement 3. Non-uniform distribution of FG Nups along the pore: theoretical model.
Figure supplement 4. Comparison of large cargo surface properties.
Figure supplement 5. Comparison of biological and technical replicates.
the initial flux J can be approximated as J ¼ aRankONþecDG , where kON is the rate of cargoes reaching the
NPC entrance, c is the concentration of cargoes in the cytoplasm, aRan is a number between 1 and 2
depending on the availability of RanGTP at the nuclear exit (aRan ¼ 2 corresponds to the absence of
RanGTP, and aRan ¼ 1 corresponds to RanGTP always being immediately available at the nuclear
exit). DG is the effective average non-equilibrium free energy potential of the cargo inside the NPC
(expressed in units of kB T » 0:6 kcal=molÞ; a conceptually similar expression was used in Frey and
Görlich, 2007 to analyse the transport of cargoes through FG Nup ’hydrogels’. This expression
mathematically describes the fact that the probability of a particle that impinges on the NPC
1
entrance to actually translocate to the other side is Ptr ¼ aRan þe DG due to the random nature of the dif-
fusive motion inside the NPC. For cargoes that are strongly repelled by the FG Nup network,
DG
1, and the flux is exponentially inhibited, as J ~ e DG . By contrast, for cargoes that interact
attractively with the FG Nups, DGResearch article Cell Biology Structural Biology and Molecular Biophysics
to the maximal observed value among all technical replicates that was still within 95% confidence
interval for that value. The conclusions of the analysis were robust with respect to the choice of the
normalisation constant.
Figure 5C shows the experimentally measured initial flux J data (dots) overlaid with the theoreti-
cal equation for J using the values of F ðRÞ and obtained from the fit (Figure 5B, parameters values
are listed in Table 2). The fits in both figures agree well with our experimental data. Consistent with
the theoretical expectations, the cost of insertion F ðRÞ was the highest for the largest capsid. The
differences between the insertion costs for the two smaller capsids were within the error bars. To
control for the possibility that the similar values of F ðRÞ observed for all three capsids are an artefact
of the limitations on the experimental accuracy at very low fluxes, we repeated the model fit, exclud-
ing the #NLS=0 point, which resulted in essentially the same fitting parameter values (Figure 5—fig-
ure supplement 2). Another possibility is that for such large capsids the insertion cost saturates to a
plateau value at maximal FG Nup compression.
Surprisingly, the values were different for different capsids, with the for the MS2 (largest) cap-
sid substantially lower than those for MS2S37P and I53-47 capsids. At first glance, one would expect
the main difference in the fluxes of capsids of different size to stem from the difference in the inser-
tion cost F ðRÞ, while the interaction energy would be relatively unaffected by the particle size. It was
also surprising that significant accumulation in or near the nuclear envelope was observed even for
the cargo samples whose interaction with the NPC is insufficient to cause substantial nuclear accu-
mulation (Figure 2D).
To further understand the implications of these findings, we extended the model to include a var-
iation in the FG Nup density along the pore. Our model is a variant of previously postulated ’vesti-
bule’/’docking’models (Tagliazucchi et al., 2013; Tu et al., 2013; Lowe et al., 2015), with a central
’barrier’ region with high density of FG Nups and correspondingly high insertion cost, and a
’vestibule’ outside the NPC (corresponding to a low density cloud of FG Nups extending into the
cytoplasm). The capsids weakly bind in the vestibule but experience no insertion cost as FG Nups
and capsids are unconstrained by the NPC scaffold in this region. Bridging between the barrier and
the vestibule there are narrow transition regions at the NPC peripheries, with a medium density of
FG Nups and correspondingly low insertion cost. As shown in Figure 5—figure supplement 3, this
simple extension of the model allows us to explain the fluxes of all capsids with the same value of
the ’bare’ NTR-FG binding energy 0 , as well as the accumulation in the cytoplasmic ’vestibule’ even
at low . Assuming the average number of FG motifs in the pore ~3000 (Tu et al., 2013), corre-
sponding to the average volume fraction/density f ¼ 0:01, the obtained values of 0 ’ 4 15 kB T are
within the range of the common estimates of NTR-FG interaction strength (Aramburu and Lemke,
2017; Tu et al., 2013; Kapinos et al., 2014; Eisele et al., 2010; Milles et al., 2015). This analysis
should be viewed with the caveat that this minimal model is likely to be modified in the future with
more molecular details; we return to this point in the Discussion.
Surface property effects on large viral import
Surface properties such as charge or hydrophobicity have been frequently indicated to influence the
import properties through the nuclear pore complex of smaller cargoes, which in many cases were
systematically assessed by creating large data sets in which the cargo properties were carefully stud-
ied and/or tuned (Frey et al., 2018; Naim et al., 2009; Colwell et al., 2010).
While our capsid study does not lend itself to similar high throughput screening of surface prop-
erties, we speculate on the role of surface properties for large cargoes based on a few observations
and experiments. i) We found that our minimal physical model describes our experimental data well.
Table 2. Parameters from free energy fit.
Fitted values for F ðRÞ and values, for aRan ¼ 2. The error corresponds to the standard deviation.
Capsid Diameter [nm] F(R) [kBT] [kBT]
S37P
MS2 17 5.2 ± 0.9 0.12 ± 0.03
I53-47 23 4.9 ± 0.3 0.08 ± 0.01
MS2 27 6.0 ± 0.7 0.03 ± 0.01
Paci et al. eLife 2020;9:e55963. DOI: https://doi.org/10.7554/eLife.55963 13 of 24Research article Cell Biology Structural Biology and Molecular Biophysics
As the capsids all have a different and complex surface properties landscape (see Figure 5—figure
supplement 4) this can be seen as an indicator that in the regime studied in this paper, the rules of
large cargo transport might be dominated by the size of the capsid sphere and the number of NTRs
that it can bind rather than direct interactions between the capsids and FG Nups due to surface
effects. A potential exception could be at very low #NLS labelling regime, where the signal-to-noise
ratio does not offer a detectable measurement of initial flux. ii) To substantially alter surface charges,
we labelled capsids with a longer NLS peptide containing a linker with a negatively charged stretch
of amino acids (DEDED). We focused on the MS2S37P capsid with high #NLS labelling, where conse-
quently the largest number of additional charges could be included by this method. As shown in
Figure 5C (charged capsid data shown as squares), we did not observe substantially different behav-
iours in capsids with and without the additional charges. We note that we faced practical hurdles in
obtaining capsids with a positively charged linker due to precipitation/aggregation of the peptide
during labelling and, thus, were not able to experimentally test this regime. iii) Simple geometrical
considerations could also support that for large objects like our capsids the actual surface properties
might be less relevant in the regime of large #NLS. If we just focus on Importinb for simplicity and
consider its surface footprint of roughly 20 nm2 for the capsids with highest #NLS (1:1 stoichiometric
complex of NLS and Importin), the overall surface shielding by Importins is roughly 100% for
MS2S37P, 80% for MS2 and 50% for I53-47. Thus, the substantial cargo decoration with Importins
would result in a larger portion of the capsid surface being shielded.
Discussion
Our approach based on modified capsids with tuneable surface properties and quantitative imaging
in permeabilised cells enabled us to arrive at a substantially enhanced quantitative understanding of
large cargo transport through the NPC. Assaying nuclear import kinetics in an unprecedented cargo
size and #NLSs range, we have shown that the requirements for transport scale non-linearly with size
and can be recapitulated by a two-parameter biophysical model that correlates the import flux to
the energetic requirements for nuclear transport.
For small cargo transport, biochemical or physicochemical properties of the cargo surface have
been shown to influence nuclear transport (Frey et al., 2018; Naim et al., 2009). While we do not
claim that surface effects play no role in large cargo transport, based on the prediction from our
experimental assay we would suggest that the binding of multiple Importin complexes seem to par-
tially mask the cargo surface properties.
Our work significantly expands the range of sizes and #NLSs for which nuclear import has been
characterised: Tu et al., 2013 previously reported a single molecule study of a b-galactosidase
cargo, which has four NLSs. This approximately cylindrical molecule is 18 nm at its longest axis, simi-
lar to MS2S37P, and 9 nm along its shorter axis. If the cargo crosses the NPC in a favourable orienta-
tion (through its narrow end), this would result in a lower cost of insertion and explain well why for
this substrate 4 NLSs are sufficient for import (Tu et al., 2013). By comparison, our smallest cargo,
MS2S37P, which is spherical with a 17 nm diameter, was not substantially imported below 10 NLSs
within the timeframe of our assay. For the larger MS2, more than 30 NLSs were required to detect a
clear signal. It is important to note that in addition to cargo shape (Mohr et al., 2009), its mechani-
cal stability and rigidity are likely to play a role in nucleocytoplasmic transport: the import rate of
proteins is inversely correlated with its mechanical stability (Infante et al., 2019), and flexibility is
likely relevant for the transport of large deformable synthetic cargoes, such as polymer vesicles
(Zelmer et al., 2020).
While our simple biophysical model can explain the experimental data very well with only two fit-
ting parameters per capsid (F ðRÞ and ) it also raises several interesting questions. The model pro-
vides quantitative estimates of the free energy cost of capsid insertion into the FG Nup assembly, as
well as the effective binding energy needed to compensate for the insertion cost. Notably, despite
the fact that a single MS2 capsid already occupies » 1/3 of the estimated volume of the central NPC
channel (Isgro and Schulten, 2005) (as illustrated in the cartoon in Figure 5) the free energy cost of
insertion is relatively low (on the order of a few kB T’s), and is similar for the capsids of different sizes.
This might indicate that further mechanisms facilitate large cargo transport, such as NPC scaffold
dilation, a hypothesis supported also by multiple evidences for tentative hinge elements in the NPC
Paci et al. eLife 2020;9:e55963. DOI: https://doi.org/10.7554/eLife.55963 14 of 24Research article Cell Biology Structural Biology and Molecular Biophysics
scaffold structures (Bui et al., 2013; Kelley et al., 2015), or bistability in the FG density in the radial
direction induced by such extremely large cargo (Osmanović et al., 2013).
In terms of the effective interaction energy , the largest MS2 capsid required a fit with the lowest
effective . This finding is surprising at first glance, because one would expect that the main differ-
ence between the capsids would stem from their size difference, while the interaction energy of an
NTR with an FG motif stays relatively constant. One can think of several potential origins for this
effect, among those are the lack of independence in the NTR binding of the FG repeats in case of
large surface coverage, or the loss of accessibility of the FG motifs due to the high compression of
the FG assembly by the largest capsid, which will be explored in future work. Nevertheless, we
found that all these features can be explained in a minimal model that incorporates the potential
heterogeneity of the FG Nup distribution along the NPC axis, whereby there are at least two differ-
ent regions of different FG Nup densities, as has been previously suggested in a ’two gate’ or ’vesti-
bule’ pictures of the NPC (Tu et al., 2013; Lowe et al., 2015; Yamada et al., 2010). In Figure 5—
figure supplement 3, we show that such a spatially heterogeneous model would be consistent with
the data across all three capsid data sets, without invoking different effective interaction energies
for the different capsids.
In our model, the energetic terms represent the binding between FG repeats and NTRs. The
microscopic binding mechanism between NTRs and FG repeats during NPC passage is probably
similar both for import and export, with a few exceptions - such as the binding of the export factor
Crm1 to a specific stretch of Nup214, (which has likely a larger role in undocking than permeability
barrier passage) (Port et al., 2015; Tan et al., 2018). We thus anticipate that basic principles of our
work could also help in the future to better understand export of large cargoes, such as pre-ribo-
somal subunits and large RNA export complexes.
The theoretical model used in this paper implicitly assumes that the capsids do not interact with
each other during transport through the pore. We cannot exclude multiple capsids colliding with
each other in a single pore with absolute certainty - and this has indeed been observed in EM of
HBV capsids injected in Xenopus oocytes (Panté and Kann, 2002). However, the hallmark of jam-
ming resulting from multi-particle occupancy is the non-monotonic dependence of the flux on the
interaction strength and thus on the #NLS on the capsid (Zilman, 2009; Pagliara et al., 2013) - a
trend that is currently not apparent in our data within the experimental accuracy, at least in the initial
rate, which is the focus of our analysis.
A more complete picture of nuclear transport and refined model building in the future would
require taking into account additional features in more detail, such as docking and undocking from
the barrier, more realistic modelling of the capsid cargo passage through the pore, and complex
entropic effects of capsid-FG Nup interactions. Future studies using our cargo substrates and time
resolved high-resolution measurements could provide further insights into the individual kinetic
steps of NPC binding, barrier passage and undocking and how those link to FG Nup and potentially
scaffold dynamics in the NPC.
Materials and methods
Key resources table
Reagent type Additional
(species) or resource Designation Source or reference Identifiers information
Strain, strain BL21 Invitrogen/Thermo AI strain
background Fisher Scientific
(E. coli)
Cell Line HeLa Kyoto Gift from Martin RRID:CVCL_1922
(Homo-sapiens) Beck’s Lab
Recombinant pBAD_MS2_Coat_Protein This study Protein expression
DNA reagent –(1–393) (plasmid) plasmid for
E. coli (MS2)
Recombinant pET29b(+)_I53–47A.1– This study Protein expression
DNA reagent B.3_D43C (plasmid) plasmid for
E. coli (I53-47)
Continued on next page
Paci et al. eLife 2020;9:e55963. DOI: https://doi.org/10.7554/eLife.55963 15 of 24Research article Cell Biology Structural Biology and Molecular Biophysics
Continued
Reagent type Additional
(species) or resource Designation Source or reference Identifiers information
Recombinant pBAD_MS2_Coat_Protein– This study Protein expression
DNA reagent (1–393)_S37P (plasmid) plasmid for
E. coli (MS2S37P)
Recombinant pET28a2-SCSG-GB1-coreN- This study Protein expression
DNA reagent GFPb1–10//NLS-GFPb11- plasmid for E. coli
coreC149H6 (plasmid) (HBV SplitCore)
Recombinant pBAD-MCS-CoreN-cys-loop- This study Protein expression
DNA reagent CoreC-TEV-12His (plasmid) plasmid for E. coli
(HBV core with cysteine
and NLS)
Recombinant pET28a2-HBc14S This study Protein expression
DNA reagent H6_S81C (plasmid) plasmid for E. coli
(HBV core with cysteine)
Recombinant pTXB3-12His-Importin This study Protein expression
DNA reagent beta WT (plasmid) plasmid for E. coli (Impb)
Recombinant pBAD-Importa1-FL-Intein This study Protein expression
DNA reagent CBD-12His (plasmid) plasmid for E. coli (Impa)
Recombinant pTXB3-NTF2-intein This study Protein expression
DNA reagent -6His (plasmid) plasmid for E. coli (NTF2)
Recombinant pTXB3-Ran Human FL- This study Protein expression
DNA reagent Intein-CBD-12His (plamid) plasmid for E. coli (Ran)
Peptide, NLS peptide PSL GmbH Mal-GGGGKTGRLESTP
recombinant PKKKRKVEDSAS
protein
Peptide, NLS peptide with PSL GmbH Mal-DEDED-
recombinant additional charges GGGGKTGRLESTPP
protein KKKRKVEDSAS
Chemical Hoechst Sigma B2261 For nuclei labelling
compound,
drug
Chemical Mitotracker green Invitrogen M7514 For mitochondria
compound, labelling
drug
Chemical FITC-Dextran 70 kDa Sigma 53471 Used for checking
compound, nuclear envelope integrity
drug
Chemical Alexa Fluor 647 Invitrogen A20347 Dye for capsid
compound, maleimide labelling
drug
Software, UCSF Chimera http://www.rbvi. RRID:SCR_004097
algorithm ucsf.edu/chimera/
Software, Fiji https://fiji.sc/# RRID:SCR_002285
algorithm
Software, SymphoTime PicoQuant RRID:SCR_016263
algorithm
Software, Igor Pro Wavemetrics RRID:SCR_000325
algorithm
Software, Adobe Illustrator CS6 Adobe RRID:SCR_010279
algorithm
Large cargo expression and purification
MS2 and MS2S37P capsids
A colony of E. coli BL21 AI cells containing the pBAD_MS2_Coat Protein-(1-393) or the pBAD_MS2_-
Coat Protein-(1-393)_S37P plasmids was inoculated in LB medium containing 50 mg/mL ampicillin.
The culture was grown overnight shaking at 37˚C (180 rpm) and then used at a 1:100 dilution to inoc-
ulate an expression culture in LB medium. Protein expression was induced at OD600 = 0.6–0.7 by
Paci et al. eLife 2020;9:e55963. DOI: https://doi.org/10.7554/eLife.55963 16 of 24Research article Cell Biology Structural Biology and Molecular Biophysics
adding 0.02% arabinose and carried out at 37˚C shaking (180 rpm), for 4 hr. Cells were harvested by
centrifugation in a Beckmann centrifuge, rotor JLA 8.100 at 4500 rpm, for 20 min, at 4˚C. For purifi-
cation, pellets were resuspended in an equal volume of lysis buffer (10 mM Tris pH 7.5, 100 mM
NaCl, 5 mM DTT, 1 mM MgCl2, 1 mM PMSF) and lysed through 3–4 rounds in a microfluidizer, at 4˚
C. The lysate was incubated with 0.2% PEI (polyethylenimine) for 1 hr, on ice and then clarified by
centrifugation in a Beckmann centrifuge, rotor JA 25.50 at 10,000 rpm, for 30 min. A saturated solu-
tion of (NH4)2SO4 was added at 4˚C drop-wise to the clear lysate under continuous mild stirring up
to 25% of ammonium sulphate. After 1 hr, the lysate was spun down again at 10000 rpm, for 30 min.
The supernatant was discarded, and the pellets were gently resuspended with 10–20 mL of lysis
buffer on a rotator, at room temperature. The lysate was then centrifuged at 10,000 rpm, for 30 min
and the clear supernatant was collected. The supernatant was cleared using the KrosFlo system
(SpectrumLabs) with a 0.2 mm cut-off membrane to remove large impurities. The membrane perme-
ate containing the cleared sample was collected on ice. In order to maximise protein recovery, the
remaining supernatant was washed with 50 mL of lysis buffer and the permeate was pooled with the
previously collected one. The sample was then concentrated using the KrosFlo with a 500 kDa cut-
off membrane (for the smaller MS2S37P capsid, a 30 kDa cutoff was used).
I53-47 capsids
A colony of E. coli BL21 AI cells containing the pET29b(+)_I53-47A.1-B.3_D43C plasmid was inocu-
lated in LB medium containing 50 mg/mL kanamycin. The culture was grown overnight shaking at 37˚
C (180 rpm) and then used at a 1:100 dilution to inoculate an expression culture in LB medium. Pro-
tein expression was induced at OD600 = 0.8 by adding 1 mM IPTG and carried out at 37˚C shaking
(180 rpm), for 3 hr. Cells were harvested by centrifugation in a Beckmann centrifuge, rotor JLA 8.100
at 4500 rpm, for 20 min, at 4˚C. The purification procedure was adapted from Bale et al., 2016. Pel-
lets were resuspended in two pellet volumes of lysis buffer (25 mM Tris pH 8.0, 250 mM NaCl, 20
mM imidazole, 1 mM PMSF, 0.2 mM TCEP), sieved to remove clumps and supplemented with 1 mg/
mL lysozyme and DNase. Cells were lysed by sonication on ice, and the lysate was clarified by centri-
fugation at 24,000 g, for 35 min, at 4˚C. The clear lysate was incubated with Ni-beads (1 mL/L
expression) for 1–2 hr, at 4˚C under gentle rotation. Ni-beads with lysate were poured in a polypro-
pylene (PP) column and the flow through (FT) was collected. Ni-beads were washed three times with
20 mL of lysis buffer followed by elution with 5 mL of elution buffer, containing 500 mM imidazole.
The elution was immediately supplemented with 5 mM EDTA to prevent Ni-mediated aggregation
of the sample. The buffer of the protein was then exchanged to dialysis buffer (25 mM Tris pH 8.0,
150 mM NaCl, 0.2 mM TCEP), at 4˚C. After dialysis, the protein was transferred to a new tube and
spun down for 10 min, at 5000 rpm, at 4˚C, in order to remove any precipitation. The protein was
concentrated using the KrosFlo with a 100 kDa cutoff membrane, which also helps removing any
remaining unassembled capsid proteins. After concentrating down to 3–4 mL of volume, the sample
was washed with 50 mL of fresh dialysis buffer using the continuous buffer exchange mode of the
KrosFlo.
HBV capsids
A colony of E. coli AI cells containing the desired HBV plasmid was inoculated in TB medium contain-
ing 50 mg/mL ampicillin. The culture was grown overnight shaking at 37˚C (180 rpm) and then used
at a 1:100 dilution to inoculate an expression culture in LB medium. Protein expression was induced
at OD600 = 0.8–1 by adding 0.02% arabinose and carried out at 20˚C shaking (180 rpm) overnight.
Cells were harvested by centrifugation in a Beckmann centrifuge, rotor JLA 8.100 at 4500 rpm, for
20 min, at 4˚C. The purification procedure was adapted from Walker et al., 2011. Pellets were resus-
pended in one pellet volume of lysis buffer (25 mM Tris pH 7.5, 500 mM NaCl, 0.2 mM TCEP, 10
mM CHAPS) and lysed by sonication 3 30 s, on ice. The lysate was spun down in a Beckmann cen-
trifuge rotor JA 25.50 at 10,000 rpm, for 10 min. The cleared supernatant was then loaded on a step
gradient 10–60% sucrose obtained by mixing lysis and sucrose buffers (25 mM Tris pH 7.5, 500 mM
NaCl, 0.2 mM TCEP, 10 mM CHAPS, 60% sucrose) in appropriate ratios and by carefully layering the
different percentage buffers into ultracentrifugation tubes. The lysate was then subjected to ultra-
centrifugation at 28,000 rpm, for 3.5 hr at 4˚C. Fractions of 2 mL were collected by gravity, by
Paci et al. eLife 2020;9:e55963. DOI: https://doi.org/10.7554/eLife.55963 17 of 24You can also read