State of Working Ohio 2021 Meeting the moment
←
→
Page content transcription
If your browser does not render page correctly, please read the page content below
policymattersohio.org

State of Working Ohio 2021
                  Meeting the moment

                      Greater Cleveland Regional Transit Authority

Michael Shields
Vivian Jacobs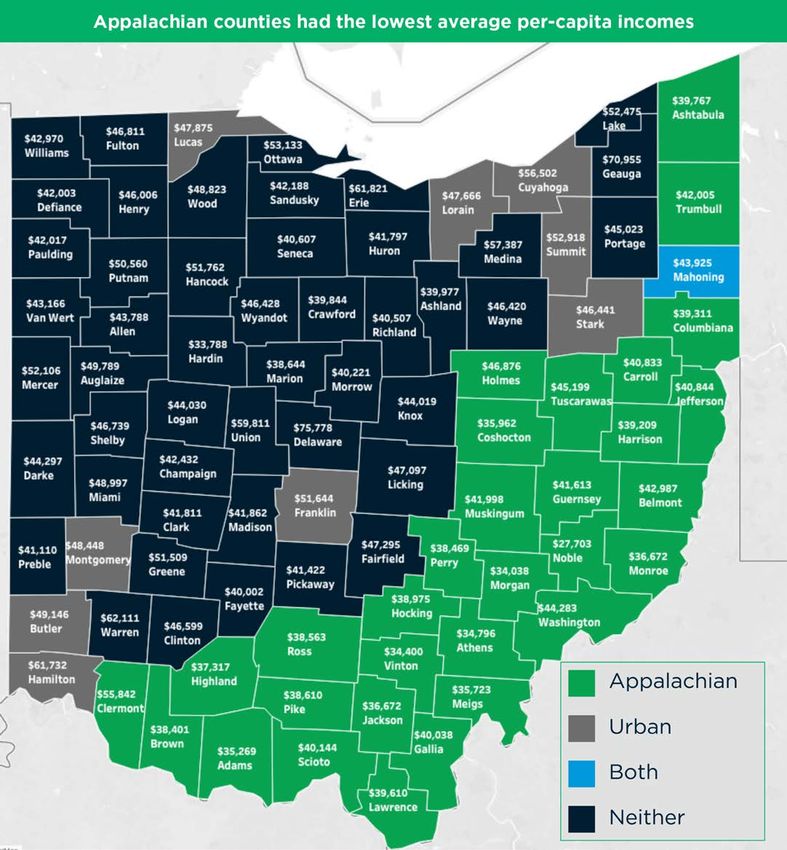
policymattersohio.org

Contents
Executive summary                    iii
Introduction1
Key findings                          4
Unemployment6
An economy distorted & restructured 12
More wealth for the wealthiest      16
Essential workers                   21
Who has been harmed                 23
  Impact on women & men                                 23
  COVID & race                                          27
  Geographic impact                                     30
  COVID impact by age                                   33
Tools for building worker power 36
Recommendations43
  Build worker power                                    43
  Build an equitable recovery                           46
Conclusion47
Endnotes48

STATE OF WORKING OHIO 2021
                                                         ii
policymattersohio.org

Executive summary
The COVID-19 pandemic has reshaped Ohio’s economy, forcing hundreds of thousands of Ohioans out of the
workforce and exacerbating racial, gender and income inequality. Unprecedented federal stimulus helped to
make this recession the shortest in history, as measured by Gross Domestic Product, but Ohioans who rely
on their jobs for their sole source of income have yet to recover.

This year has also shown how, by coming together, we can overcome great challenge and use the lessons
learned from it to craft a better world. This year’s State of working Ohio 2021: Meeting the moment, finds
that:

•   Long-term trends show that Ohio’s wealthiest and highest-paid hoarded pre-COVID prosperity.
    Unprecedented fiscal stimulus provides policymakers with the opportunity to reshape the economy so
    more people prosper.
•   More than a year after COVID-19 displaced over 1 million Ohioans from their jobs, as of July of 2021, Ohio
    still had 269,000 fewer jobs than pre-pandemic.
•   COVID-19 disproportionately forced low-paid Ohioans out of their jobs – skewing the wage data which
    shows a higher median wage last year. For example, there were nearly 25% fewer waitresses and waiters
    in Ohio than there were in 2019. The leisure and hospitality industry account for 28% of all the state’s jobs
    destroyed during COVID.
•   People who hold “essential jobs” are at higher risk for COVID exposure; are more likely to be Black or
    brown; and are also paid nearly 13% less than those with nonessential jobs.
•   COVID-19 exacerbated long-standing structural barriers that hold down wages for Black, brown and
    immigrant workers and exclude them from job opportunities. Last year, at the median, white Ohioans
    were paid $21 an hour compared to $16 for Black Ohioans. At 15%, the unemployment rate for Black
    Ohioans was more than double the rate for white Ohioans, 6.8%.
•   Ohio women were more likely than men to be laid off or forced to leave their jobs, reversing years of
    progress. Their employment-to-population rate fell from 55.6% in 2019 to 52.7% in 2020. At the median,
    women were paid $18 an hour compared to $21.50 for men.
•   Many Ohioans couldn’t count on their wages or traditional sources of income to make ends meet last
    year. They tapped credit cards, took out loans, sold assets and borrowed from family and friends. For
    many – both working and not – government stimulus payments were critical.
•   Higher education and union membership improve working people’s wages. The typical Ohio union
    worker was paid $23.47 an hour compared $18.46 for the typical nonunion worker. At the median, people
    with a bachelor’s degree were paid $30.17 an hour compared to $16.95 for those with a high school
    diploma. Over time, a college degree has insulated some workers from pay decreases experienced by
    less educated workers. Yet a college degree doesn’t make up for years of policies and practices that
    have excluded and exploited people of color. Black high-school grads and college grads are both paid
    79-cents on the dollar compared with their white counterparts.

STATE OF WORKING OHIO 2021
                                                                                                             iii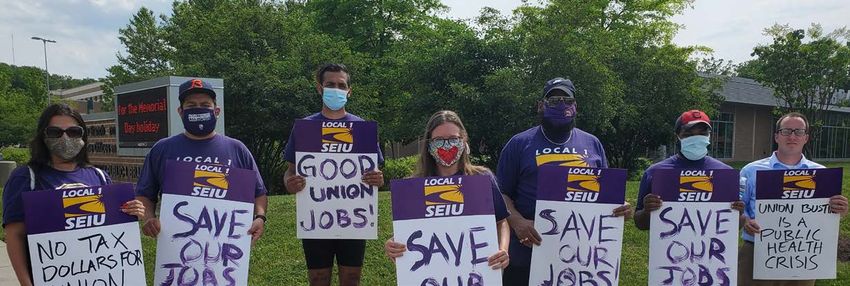
policymattersohio.org

Policy recommendations
•   Lawmakers must protect working people’s right to join in union - and can start by passing the federal
    Protecting the Right to Organize (PRO) Act. The Act will make it harder for corporations to use union-
    busting strategies they have used in recent years to resist unions by intimidating workers.
•   Raising the minimum wage to $15 an hour and including tipped workers by 2026 would increase wages
    for more than 1.56 million Ohioans and circulate an additional $6 billion in the state’s economy.
•   Ohio should make college affordable to all Ohioans by substantially deepening investment in the need-
    based aid program, the Ohio College Opportunity Grant and implementing an equitable free college
    program through public universities and community colleges.
•   State and local policymakers can use American Rescue Plan dollars to center working people with hazard
    pay for essential workers; enforcing wage and hour law; and ensuring the entire community benefits from
    public projects, not just the corporations that win the contracts.
•   Federal policymakers should continue and make permanent stimulus programs that provided Americans
    with more financial stability like the expanded Child Tax Credit and pandemic unemployment assistance.

STATE OF WORKING OHIO 2021
                                                                                                         iv
policymattersohio.org

Cleveland Teachers Union

        Introduction

More than a year into the health and economic crisis caused by
COVID-19, it is now possible to describe how the pandemic has
reshaped the lives of Ohioans to date, anticipate its long-term
consequences, and craft policy to ensure that all Ohioans who avoided
or survived COVID-19 can emerge from the crisis stronger than before.
It has been a difficult year-and-a-half. The luckiest Ohioans have
endured only isolation. Others have suffered illness, lost jobs, and even
lost loved ones. Data now available for 2020 show that Ohio’s working
people have faced innumerable challenges, compounded by years of
policy choices that have directed resources to the wealthy few and
corporations while pitting working people against each other based on
race and gender.

STATE OF WORKING OHIO 2021
                                                                          1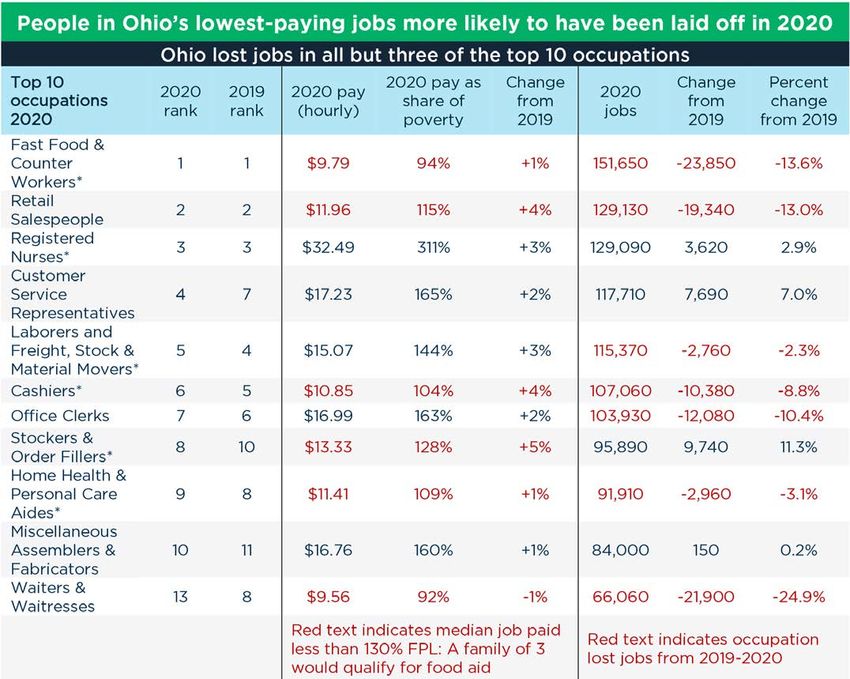
policymattersohio.org

Yet this year has also shown how, by coming together, we can overcome great
challenge and use the lessons learned from it to craft a better world. One enduring
feature of the pandemic has been the countless Ohioans who kept us all fed, cared
for us if we were ill, and for our children so that we could go to work. A second
feature should be that we never forget their vital work, or the risk and sometimes
sacrifice they took on to get it done. We need public policies that demonstrate our
gratitude to Ohio’s essential workers with livable wages that dignify their work, safe
workplaces and a voice on the job.

Another feature was the unprecedented fiscal        health impacts of the pandemic — emerged
stimulus the federal government directed to         stronger than ever. But for the vast majority
our state to prevent crisis for the roughly 2       of non-elderly U.S. households, which rely on
million Ohioans who spent time without work,        job earnings as their sole source of income, the
sustain consumer spending and make this             labor market is the most important facet of the
the shortest recession in U.S. history. Federal     economy.1 After the most recent recessions,
policymakers learned from the slow austerity-       Ohio has never fully recovered.2 We cannot
burdened recovery from the Great Recession          afford to repeat the policy errors that left
that government has a vital role in steering        vast swaths of Ohioans on the margins and
our economy through downturns and driving           struggling even before the latest downturn.
a rapid and vibrant recovery. We need to stay
the course to keep this recovery on track long      The unique cause of the COVID-19 recession
enough to reach everyone.                           — the need to control the pandemic and keep
                                                    people safe — also meant that it affected
The pandemic remains with us. Weeks after           economic sectors, wages and specific groups
COVID-19 seemed to be receding as a threat,         of workers differently from past recessions.3
daily cases surged again, prompting renewed         Working people tended to find themselves in
uncertainties about when and how we will            one of three situations: as frontline workers
overcome the coronavirus. Ohio lawmakers            with elevated levels of exposure; unemployed
have compounded this uncertainty and made           and dealing with loss of income; or able to
COVID-19 more dangerous by circumscribing           work from home or otherwise insulated from
gubernatorial and local government powers           exposure to the virus at work. Ohioans who
to combat it through public health mandates.        could work from home were insulated from
The consequences have been felt across Ohio,        `both the health dangers of COVID-19 and the
but working people, whether working on the          economic risk of job loss.
frontlines at risk of exposure, or displaced from
their jobs, have borne the brunt.                   The health risk is not over. New daily case
                                                    counts — which were pushed in June to the low
Already COVID-19 and the recession have             hundreds with the help of rapid dissemination of
created new realities for working Ohioans.          effective vaccines — are now on the rise again,
Rapid recovery of corporate stock prices and        with 3,227 cases reported on August 16 alone.4
real estate meant that the wealthiest recovered     More than one in 10 Ohioans has now contracted
rapidly and — provided they were spared the         COVID-19.

STATE OF WORKING OHIO 2021
                                                                                                  2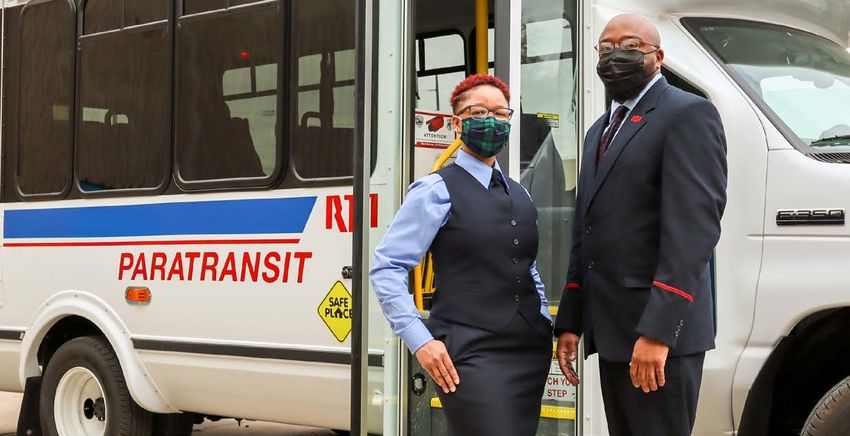
policymattersohio.org

 Frontline essential workers
 risked — and some lost — their
 lives doing the vital work that
 has carried us this far through
 the crisis. For those still working
 essential jobs, new recognition
 of how vital these workers are
 could help them win better
 wages and working conditions.
 Yet the danger that just weeks
 ago seemed like it might be
 under control is now on the rise
 again. And so far, calls for hazard
 pay or a permanent increase to
 poverty and near-poverty wages
 for some essential workers have
 gone largely unheeded by many
 policymakers.                                                    Greater Cleveland Regional Transit Authority

 For other Ohioans, a crisis of unemployment remains as eviction and foreclosure moratoria expire
 and Unemployment Compensation (UC) benefits run out. As of July, Ohio remained 269,000 jobs
 short of our pre-COVID number in February 2020.5 The job market remains unrecovered.

 Ohioans who could shelter at home were spared risk of workplace exposure to COVID-19 and
 job loss, but even they will not all emerge unscathed. For many parents, working from home has
 meant juggling careers with unpaid care work. Women especially have faced the challenge of this
 extra work, and in some cases have had to reduce work hours or leave their jobs.

 Ohioans of color have been and remain more likely to work in frontline essential jobs, facing
 higher risk of exposure to COVID-19 for themselves and their families. With the exception of Asian
 Ohioans, they have also faced higher COVID death rates. Men and women were equally likely to
 work as essential workers filling critical infrastructure roles in 2020, but occupational segregation
 meant that women held more of the jobs that were both high-risk and low-pay. Young people
 were more likely to hold jobs that were destroyed by COVID-19 and those who went to college are
 graduating into a battered economy with a smaller job market; with the partial recovery moving
 more quickly than in the Great Recession, it remains uncertain how long they will be adversely
 impacted.

 More than a year into the ongoing crisis, this report uses 2020 data to examine the impact
 COVID-19 has had thus far on working Ohioans; identifies those hardest hit in the short term;
 outlines what we know about the still-unfolding long-term impact on the labor market; discusses
 how COVID-19 interacted with challenges we already faced — of growing inequality and increased
 strain on ordinary Ohioans — before COVID-19; and identifies broad policy interventions to tap
 this moment as a chance to reset, and rebuild a better economy than before: one in which every
 Ohioan can thrive.

STATE OF WORKING OHIO 2021
                                                                                                       3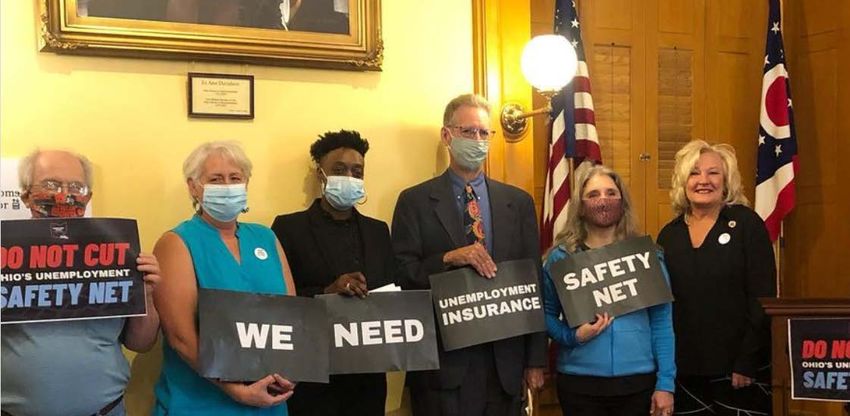
policymattersohio.org

       Key findings
Job destruction is one the most enduring             COVID-19 reversed progress made by Ohio
economic impacts from COVID-19. COVID-19             women. COVID-19 reversed decades of progress
displaced more than 1 million Ohioans from           made by Ohio women in narrowing the wage
work in March and April of 2020. By July 2021,       gap and the gap in employment and workforce
Ohio still had 269,000 fewer jobs than before        participation. Ohio women were more likely to
COVID-19, setting us all the way back to June        be laid off or forced to leave their jobs early
2014.                                                in the recession. For 2020, their workforce
                                                     participation, which had been growing over
Higher median wage data reflect that low-paid        the long term, fell sharply. Women were more
workers were disproportionately laid off — not       likely to have to take on unpaid care work
actual progress. COVID-19 disproportionately         that disrupted their careers. This recession
forced low-paid Ohioans out of their jobs.           was distinct from the Great Recession in
Failure to understand this creates a deceptive       disproportionately harming women.
story about wage trends. Last year’s wage levels
appear on the surface to break with a decades-       Major stimulus from unemployment and
long stagnation, but they do not measure a true      direct payments insulated Ohioans, but many
improvement in the typical (median) worker’s         struggled while waiting months for help.
well-being. Instead, they reflect a change in        Unprecedented federal stimulus in the form
the composition of who was still working after       of UC, direct stimulus payments and massive
COVID-19 destroyed so many Ohioans’ jobs.            aid packages to state and local governments,
In short, low-paid Ohioans bore the brunt of         businesses and families has insulated many
layoffs, and this meant the group of workers         Ohioans from the worst economic impacts of
sampled to determine wage levels was a higher-       COVID-19. By injecting billions into the Ohio
paid group to begin with.                            economy, federal policymakers likely prevented
                                                     the recession from dragging on months longer
COVID-19 exacerbated race-based inequities.          and creating more far-ranging economic
COVID-19 exacerbated long-standing trends            destruction than it did. They also averted crisis
that have made Ohioans of color worse off than       for many Ohio working people and their families
white counterparts in economic and health            who lost their only source of income when they
outcomes. Black, brown and immigrant workers         were laid off. Substantial federal supplements to
were more likely to work frontline essential jobs,   UC — initially $600 per week, and later $300 —
faced higher rates of illness and death from         meant that some Ohioans had enough income
COVID-19, and were more likely to have their         for the first time. These and other stimulus
jobs destroyed by COVID-19.                          measures pushed poverty temporarily to record
                                                     lows.

STATE OF WORKING OHIO 2021
                                                                                                  4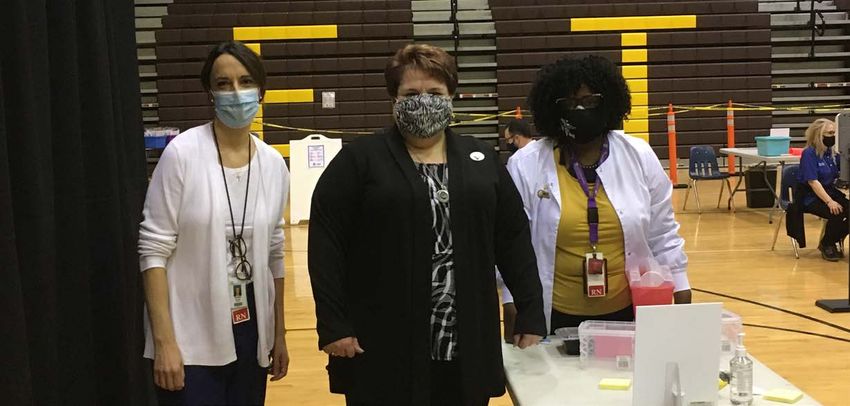
policymattersohio.org

The main limitation on the stimulus’s              Ohioans’ age and geographic region
effectiveness was inconsistency. This played       impact how they have been affected by the
out through administrative delays in delivering    coronavirus recession, and how they fared
benefits; Congress allowing benefits to            before. Young people who have graduated into
abruptly end, then the president or Congress       previous recessions struggled to get established
implementing new ones; and states’ decisions to    in their careers and faced long-term wage
opt out of benefits. The erratic policy response   penalties, which could occur from this recession,
and distribution disruptions meant that even       too. Ohioans in Appalachia face lower pay and
Ohioans whose total income rose during             fewer opportunities.
COVID-19 might go months without income.
Today the emerging challenge is that these         Federal policymakers are now allowing
programs are abruptly ending.                      stimulus, which drove rapid partial recovery
                                                   from the coronavirus recession, to expire. This
Long-term trends show that Ohio’s wealthiest       includes the enhanced federal unemployment
and highest-paid have disproportionately           benefits Ohio’s Supreme Court is now
captured pre-COVID prosperity growth. The          deliberating after Gov. DeWine cut Ohioans
Great Recession exacerbated that inequity, and     off early; the extensions in eligible weeks; and
early signs show that COVID-19 could do so, too.   eviction moratoria that prevented Ohioans
One positive sign is that unprecedented fiscal     displaced from work from also losing their
stimulus provides opportunity to craft a more      homes.
equitable state economy.

STATE OF WORKING OHIO 2021
                                                                                                5
policymattersohio.org

 Section 1
       Unemployment

The U.S. and Ohio economies measured in              half the 2019 rate.12 Such measures included
Gross Domestic Product (GDP) have now                $600-per-week federal supplemental UC, which
fully recovered to pre-pandemic levels. The          ended July 202013; the emergency temporary
stock market has reached record heights.             benefit ordered by former President Trump
The National Bureau of Economic Research,            from disaster relief dollars, worth $300 per
which tracks the business cycle, declared the        week in Ohio;14 and the most recent round of
coronavirus recession over as of May 2020,           $300 supplements, which expired on Sept. 4.
making it the shortest recession on record.6         Gov. DeWine prematurely blocked unemployed
But as measured by its impact on people, the         Ohioans from receiving these benefits
recession is far from over. As of July 2021, there   beginning in June 2021. After an appeals court
were 269,000 fewer jobs in Ohio than there           overturned that decision, the matter is pending
were in February 2020. Because most Ohio             as of this writing before the Ohio Supreme
families rely on employment earnings as their        Court. Also ending are the eviction moratoria
sole source of income, it is the labor market        overturned in August by the U.S. Supreme
— not GDP or stock prices — that marks the           Court, enhanced SNAP benefits that provided
most meaningful aspect of economic life.7 And        food support, and insurance waivers on COVID
working people are still struggling.                 testing. With these stimulus measures slated
                                                     to abruptly end, thousands of Ohioans could
It took seven years to restore the number of         be forced out of their homes and could find
jobs destroyed in the Great Recession.8 Ohio’s       themselves unable to afford groceries or pay
poverty rate did not reach 2007 lows until 2019,     the bills. The poverty rate may spike again.
just before COVID-19 caused another recession.9
Following the 2001 recession, Ohio’s median          Sixteen months after COVID-19 sent Ohioans
wage did not recover until 2018.10 Ohio never        home to shelter in place — working from home
fully recovered from the last few recessions.11      if they could, unemployed if not, or braving
This time has to be different.                       the pandemic to come to work in a new and
                                                     more dangerous landscape — Ohio’s job market
Unprecedented fiscal stimulus has shown that         remained 4.8% smaller in July 2021 than it was
with the right policy response, government can       in February 2020.15 Gov. DeWine issued his
reduce hardship for ordinary Americans. This         stay-at-home order on March 22, 2020. By April,
stimulus has rapidly and deeply driven down          Ohio had 889,000 fewer jobs. Over the course
poverty, at least temporarily. Urban Institute       of the COVID-19 pandemic, more than 2 million
researchers put Ohio’s 2021 rate at 5.9% —           Ohioans would experience joblessness and

STATE OF WORKING OHIO 2021
                                                                                                 6
policymattersohio.org
file state unemployment claims at some point, By July 2021, Ohio had 5,341,000 jobs, a level
along with 1.2 million who claimed Pandemic that took us back to June 2014 (5,343,700).
Unemployment Assistance (PUA), some of See Figure 1. Compared with February 2020,
whom were overlapping.16 Ohio reached and there were 295,000 more Ohioans out of the
surpassed the deepest job losses of the 2008 workforce, and 317,000 fewer were working.17
recession in a matter of weeks. Ohioans of all backgrounds were swept up in
this crisis, but job displacement played out
differently for Ohioans based on their race,
gender, age, and where they lived.
Figure 1
Source: Policy Matters analysis of C.E.S. data, U.S. Bureau of Labor Statistics data. Most recent data available, seasonally adjusted.
STATE OF WORKING OHIO 2021
7policymattersohio.org
As of this writing, Ohio’s job recovery has Overall, while the U.S. recovered 96.3% of its
posted two months of progress following six pre-COVID job level by July, Ohio had recovered
months without growth beginning in November 95.2%.19 See Figure 2. The second month of
2020.18 Those months followed a rapid partial job gains may be a sign that Ohio’s recovery
recovery beginning in May 2020, as Ohio is picking up much-needed momentum. At
businesses that only paused for the health its current six-month average rate of 0.12%
emergency resumed work and called back per month, it will take Ohio 43 months to
workers. Over the long term, Ohio has been on restore our pre-COVID level of jobs; the U.S. is
a similar growth path to the U.S. Ohio recovered recovering at 0.48% per month. From its lowest
slightly more quickly than the nation from June level in April 2020 Ohio had regained 619,500
2020 to March 2021 and is now trailing slightly. jobs by July 2021, while the U.S. had regained
16.7 million.
Figure 2
Source: Policy Matters Ohio from Current Employment Statistics, seasonally adjusted, Ohio Labor Market Information https://ohiolmi.com/Home/
DS_Results_CES and Bureau of Labor Statistics https://www.bls.gov/ces/data/.
STATE OF WORKING OHIO 2021
8policymattersohio.org
Layoffs due to the COVID recession were not borne evenly by all Ohioans. Black Ohioans were
twice as likely as white Ohioans to be laid off from their jobs last year, consistent with the long-
term trend of the Black unemployment rate running roughly double the rate for white Ohioans.
Women were more likely to be pushed out of the workforce than men in the early months of the
pandemic, largely owing to the types of jobs they held, and were more likely to leave work to take
on added caregiving tasks. Trends for both groups of Ohioans are discussed in detail below.
Jobless claims
More than 2 million Ohioans filed for regular unemployment benefits at some time during 2020.
See Figure 3. The largest surge of state unemployment claims occurred in March 2020 in the
wake of Gov. DeWine’s necessary public health order requiring many Ohioans to shelter at home:
Ohioans filed 592,000 initial claims under the state system that month. A slightly smaller 526,000
filed new claims in April. A run-up in the number of claims flagged for potential fraud caused
spikes in the data for February and March 2021, though reports so far from the Ohio Department of
Job & Family Services (ODJFS) indicate that fraudulent payments of regular state unemployment
benefits did not show an increase.20
Figure 3
Source: Ohio Department of Job and Family Services, Labor Market Information, “UC 237.CD – Monthly Claimant Demographics by
County,” https://ohiolmi.com/home/Uiclaims.
STATE OF WORKING OHIO 2021
9policymattersohio.org
The unprecedented scale of unemployment rose — during COVID-19 might go months
benefits, and the scope of Ohioans reached without income. Many unemployed workers
by them, served as a major mitigating factor were unable to obtain benefits on a timely basis
protecting hundreds of thousands of Ohioans or received overpayments through no fault of
from crisis they would otherwise have endured, their own. Many thousands of claims flagged
and continuing their consumer spending to for fraud were flagged incorrectly and are likely
stave off a major and lasting contraction. to receive ultimate — but delayed — approval.23
PUA covered Ohioans excluded from regular Federal benefits are ending prematurely in early
state benefits, including those who were self- September even while Ohio’s economy has
employed or misclassified as such, gig workers hundreds of thousands fewer jobs than it did
and those whose income was too low to qualify before the pandemic.
for regular benefits. Some 1.2 million filed for
PUA — a group partially overlapping regular UC Workforce participation and employment
claimants. Congress also extended the usual share
maximum of 26 weeks of benefits by another 53
weeks. Federal benefits provided unemployed Many Ohioans left the workforce altogether.
Ohioans with an additional $600 per week Ohio’s Labor Force Participation Rate (LFPR)
in benefits for some months before expiring; reached its lowest level on record by 2020,
later action by Congress replaced that with with 61.8% of Ohioans working or seeking
$300-per-week benefits, which were abruptly work. Ohio’s LFPR had never recovered from a
ended by Gov. DeWine in June, 10 weeks before pre-Great Recession high of 67.8%. As of July
their slated expiration. Ohio’s 10th District Court 2021, Ohio’s civilian labor force, which includes
ruled in August that Gov. DeWine exceeded those working and actively seeking work, was
his authority in prematurely ending federal 5,604,000.24 That meant 295,000 more Ohioans
jobless benefits.21 Gov. DeWine has appealed were out of the workforce, and 317,000 fewer
the decision to the Ohio Supreme Court. At the were working, compared with pre-COVID
time of this writing, it is unclear whether back levels.25 Ohioans were out of the workforce for
payments owed to affected Ohioans will ever be a number of reasons, including fear of exposure
paid. Altogether, ODJFS reported that between to COVID-19 and lack of childcare. Had more of
March 15, 2020, and July 26, 2021, more than 1 these Ohioans returned to the workforce, our
million Ohioans received regular unemployment 5.4% reported unemployment rate would have
benefits or federal extensions of them totaling been higher, since the rate ignores those who
almost $12.4 billion. Separately, more than 1.2 are neither working nor looking for work.
million claimants got PUA benefits totaling
nearly $11 billion.22 The Employment-to-Population ratio (E-Pop)
never recovered from the Great Recession,
The main limitation on the effectiveness of this either. E-Pop measures who is working as a
support was inconsistency on the part of state share of the entire population aged 16+ who
and federal policymakers. While the scale of are not institutionalized or in the military. It’s
sudden unemployment was unprecedented, a useful labor market indicator, because it is
the erratic U.S. policy response and long-term unaffected by voluntary changes in labor force
underinvestment in the administration of the participation that can make the unemployment
UC system meant that even Ohioans whose rate artificially low when many workers are
total income was not badly affected — or even sidelined.26 After reaching bottom in 2013 at
STATE OF WORKING OHIO 2021
10policymattersohio.org
58.2%, it mounted a bumpy climb to 60.7% will return to work at the rate they previously
in 2019. In 2020, it fell four points to 58.7%. did. What may be the most striking feature of
It had been 37 years since such a small share Ohio’s data is that Ohioans never returned to
of working age Ohioans were employed; the workforce at the same rates following either
the share reached 55.8% in 1983 due to the the 2001 recession or the Great Recession.
recession induced by Federal Reserve policy to Their absence means that, looking at the
reduce high inflation. E-Pop lows correspond unemployment rate alone, Ohio’s job market may
to economic downturns. Our series ends in appear healthier than it truly is. See Figure 4.
2020, so it remains to be seen whether Ohioans
Figure 4
Source: EPI analysis of Current Population Survey microdata.
STATE OF WORKING OHIO 2021
11policymattersohio.org
An economy distorted & restructured
Wage data cited throughout this report were higher for 2020 than for other recent years, and
in many cases for all years. The overall median rose 5% year-over-year. Increases in some cases
reversed long-term downward trends. Yet these figures are not good news; they do not represent
improvements in the well-being of most Ohio workers. Instead, they reflect the fact that low-
paid workers bore the brunt of job losses, leaving their better-paid counterparts as the only ones
left in the employed workforce to have their wages counted.27 It’s critical to understand this fact,
because failure to grasp it could lead policymakers to prematurely slow the economy or to reduce
or eliminate monetary supports to Ohioans still facing crisis. In fact Gov. DeWine has already done
so in his decision to end federal jobless benefits to unemployed Ohioans, a decision now pending
before the Ohio Supreme Court as of this writing.
Figure 5
Disproportionate layoffs in low-paying industries skew data on Ohio wages
Wage growth is not normal for a recession. It would be a mistake to read the reported changes for 2020 as a sign of improved bargaining
power or true wage growth for working Ohioans.
STATE OF WORKING OHIO 2021
12policymattersohio.org
Changes in the makeup of the employed Ohio still had a shortfall of 68,300 pre-
workforce typically accompany recessions, but pandemic accommodation and food service
the effect for this recession was much stronger. jobs by June 2020. The leisure and hospitality
Bureau of Labor Statistics researchers found sector has the lowest average wage of all the
that the lowest-paid workers faced the steepest major industrial sectors. Waiters and waitresses
job losses and that those losses persisted were paid just $9.56 per hour at the median in
longest.28 Data from employer and household 2020. The leisure and hospitality industry lost
surveys both confirmed this. Part of the reason nearly three times its share of jobs.31
low-paid workers faced the largest job losses
is due to their concentration in industries Figure 6 shows how not just the number, but
disproportionately impacted by the coronavirus the mix of jobs in Ohio was changed by the
recession. Low-paying industries fell as a COVID-19 recession. Looking at only the top
share of all employment, but the researchers 10 most common jobs in Ohio as of 2019 — a
also found that within industries, employers group that comprised 21.7% of all working
were more likely to cut low-paid workers than Ohioans — employment fell in seven of those
others; those within-industry cuts accounted occupations: Fast Food and Counter Workers,
for between 23% and 46% of April 2020 to Retail Salespeople, Laborers & Freight, Stock
May 2021 job loss among low-paid workers.29 & Material Movers, Cashiers, Office Clerks,
Nationally, the median hourly wage of workers Home Health & Personal Care Aides and
in highly exposed sectors was $15.00 for Waiters & Waitresses. Employment rose in
2019, compared to $21.50 for workers in other three: Registered Nurses, Customer Service
sectors.30 Representatives and Stockers & Order Fillers.
Miscellaneous Assemblers & Fabricators,
which ranked #11 in 2019, displaced Waiters
& Waitresses from the top 10, mostly due to
the large loss in the latter group (-21,900 jobs;
24.9%). Many of these workers were in essential
occupations. Overall, Ohio had lost 5.7% of all
jobs at the time these figures were compiled.
Overall, median wages rose 5% from 2019
to 2020, but when we focus on specific
occupations, those increases are much smaller.
Figure 6 also shows that in Ohio’s most
common jobs, wages changed from a loss of 1%
for waiters and waitresses to a gain of 5% for
stockers and order fillers. There were no large
gains in other industries to pull the median up
Elvert Barnes /Flickr to 5%.
STATE OF WORKING OHIO 2021
13policymattersohio.org
Figure 6
Source: BLS, OES Survey, state estimates May 2019, and May 2020, https://bit.ly/3jxOKuY. Largest detail occupations in Ohio by em-
ployment. Median annual earnings shown as share of poverty threshold for a family of three in 2000 ($21,960). Asterisk (*) indicates
likely “essential” occupation.
Brookings Institute researchers have found that the lowest-paid sector — hospitality — also gives
workers the least opportunity for upward mobility.32 When workers change jobs, they may move
up, laterally, or in some cases, even down. Only 36% of occupational changes in hospitality are
upward, compared with 66% in both utilities and professional services, sectors that are among
both the highest-paying and most upwardly mobile. This research suggests that jobs that start out
low-paying also tend to offer fewer opportunities to climb a career ladder to a higher-paid position
without moving to a different sector. These trends were already in place before COVID-19.
STATE OF WORKING OHIO 2021
14policymattersohio.org
Industry
Though most sectors lost jobs that remained unrecovered by June, those losses were heavily
concentrated in some industries. Service sector industries bore more than their share of job loss.
The leisure and hospitality industry comprised 6.3% of Ohio jobs as of June 2019. From its pre-
pandemic level in February 2020 to June 2021, that industry has seen 28.2% of all job losses
in Ohio, more than four times its share. The “other services” industry had 8.2% of losses for an
industry that comprised 3.0% of jobs. State government jobs comprised 3.6% of jobs but 5.6% of
job losses. This is especially egregious because this is the industry over which state policymakers
have the most control, as a direct employer. While certain occupations grew — notably, certain
healthcare jobs and jobs in the logistics industry that supported growing online retail trade — no
industry had as many jobs in June 2021 as it had pre-pandemic in February 2020.
Figure 7
Source: Current Employment Statistics by Industry Sector, June 2021. Seasonally Adjusted, Ohio
Department of Job and Family Services, https://ohiolmi.com/Home/DS_Results_CES, retrieved July 19, 2021.
STATE OF WORKING OHIO 2021
15policymattersohio.org
More wealth for the wealthiest
While hundreds of thousands of Ohioans are time for policymakers to drive a more equitable
still out of work, asset prices for corporate recovery from the COVID-19 recession than we
stocks and real estate recovered rapidly and achieved after the Great Recession.
have now soared to new heights, driving
an uneven recovery in which the wealthiest This trend of financial market and real estate
are better off than ever, but working people recovery that left behind jobs has also
continue to struggle. exacerbated wealth inequity based on race.
White people held 89.5% of corporate equities
The trend of the wealthiest capturing a growing by the first quarter of 2021, while Black people
share of total income has been under way held just 1.1% and Hispanic Americans — a rough
since the 1970s. By 2015, Ohio’s wealthiest proxy for Latinx people — held only 0.5%.37 The
1% captured 15.8% of all income in Ohio. The remainder of stocks were owned by people of
average 1-percenter had an income of $858,965, other races. The data do not specify the share
while the lowest income that fell within the of corporate equities owners who are foreign
wealthiest 1% was $334,979.33 nationals.
International Monetary Fund economists Diverging fates based on pay
reported that policy responses to previous
pandemics have led to increases in wealth Even among Ohioans who get most or all their
inequality, and found early evidence that these income from wages, the post-COVID trend and
trends have been more pronounced in the case the long-term trend alike favor the most highly
of COVID-19.34 paid people. While the 90th percentile worker —
the one paid more than 90% of all workers and
This trend accelerated in the wake of the Great less than the other 10% — saw their income rise
Recession and spiked once more following 36.2% from $33.30 per hour in 1979 to $45.37 in
COVID-19. By 2018, the wealthiest 1% in the 2020, the middle earner saw theirs rise just 7.6%
U.S. had captured 45% of all income gains in to $19.99. The 10th percentile earner, who made
the recovery from the Great Recession.35 That less than the other 90% of workers, was paid
outcome actually marked a more equitable just $10.04 in 2020, an increase of only 1.7%
long-term distribution of income growth than over 40 years. All figures are given in real 2020
took place in the early recovery: In the first year dollars adjusted for inflation. Only the highest-
of the recovery, the richest 1% captured 93% paid Ohioans have seen substantial pay growth
of all income growth.36 This means there is still over the last four decades. See Figure 8.
STATE OF WORKING OHIO 2021
16policymattersohio.org
Figure 8
Source: EPI analysis of Current Population Survey microdata, inflation adjusted to 2020 dollars.
Also noteworthy: Nearly half (48.6%) of all growth for those being paid the median wage took
place in the single year from 2019 to 2020. Given the way the new makeup of the labor force has
distorted wages, this fact raises concerns that many of these gains may prove to have been data
irregularities and may not persist. This is a fact that could influence wage trends for all groups as
reported in this paper. For people paid wages in the 90th percentile, the relative year-over-year
increase was smaller (15.6%). However, the single year dollar increase for highly paid Ohioans
exceeded growth for middle-income Ohioans for the entire four decades ($1.88 versus $1.42). The
changing jobs mix likely heavily distorted highly paid Ohioans’ wages too. Low-paid Ohioans were
paid just 17 cents more for the whole timespan, and their 1-cent bump year-over-year ending 2020
was not statistically different from zero.
STATE OF WORKING OHIO 2021
17policymattersohio.org
Figure 9
Source: EPI analysis of Current Population Survey microdata, inflation adjusted to 2020 dollars.
Household Pulse showed many Ohioans still struggling
While the wealthiest rapidly recovered from the COVID-19 recession — if they suffered any loss at
all — many ordinary Ohioans struggled tremendously in the early months of the pandemic, and
many continue to struggle today. Figure 10 from the Census Bureau’s Household Pulse survey
compares survey data from spring 2020 and spring 2021. The data show significant progress in
Ohioans’ economic security since the worst months of the pandemic and many Ohioans benefiting
from the unprecedented fiscal stimulus, but that we have not attained recovery.
STATE OF WORKING OHIO 2021
18policymattersohio.org
Many Ohioans turned to stop-gap methods to meet living costs during COVID-19. In real-time
surveys conducted by the Census Bureau between April and June 2021, roughly a quarter of
Ohioans used credit cards to meet basic living costs. One in six drew down savings or sold assets.
Among nonworking Ohioans, just 69.2% were able to use regular income, compared with 88.8%
for those who were employed.38 Many Ohioans had to turn to friends or family for loans: 12.7% of
nonworking Ohioans and 7.3% of working counterparts did so.
The most notable changes from spring 2020 were that, among Ohioans who were not working,
the share who had regular income rose 10.9 percentage points, while the share who used
unemployment benefits fell 10.2 percentage points.
Figure 10
Source: Policy Matters Ohio analysis of U.S. Census Bureau Household Pulse data, pooled weeks 28-32, https://bit.ly/3kJGxDd, accessed June 30,
2021, and weeks 9-12, accessed August 25, 2020. See Michael Shields, April Hopcroft and Siyang Liu, “State of Working Ohio 2020,” https://bit.
ly/SOWO_2020, Table 1. Nonworking Ohioans includes those who are unemployed, and adults not in the labor force, including retirees. “Change
from 2020” columns are percentage points.
STATE OF WORKING OHIO 2021
19policymattersohio.org
Other data gathered by the Census Bureau of unemployment as well as payments to
through the Household Pulse in June and July, other members of their household currently
and analyzed by the Center on Budget and unemployed.
Policy Priorities, show that one in 10 Ohio adults
(723,000 people) struggled to get enough food, These challenges will get worse in the coming
17% of Ohio renters (407,000) were behind months. The moratorium on evictions issued by
on rent, and 28% of Ohio adults (2.3 million) the CDC expired July 31, and the U.S. Supreme
had too little income to meet basic household Court overturned President Biden’s extension,
costs.39 leaving Ohioans who are behind on rent to face
possible eviction.40 Gov. DeWine prematurely
Ohioans also tapped safety net resources ended federal enhanced jobless benefits of
to get through the financial hardship from $300 per week to Ohioans whose jobs were
COVID-19. A fifth of working Ohioans and a destroyed by COVID-19; that decision now
quarter of nonworking Ohioans used stimulus stands before the Ohio Supreme Court, but
payments; 6.6% of nonworking Ohioans and even if the 10th District decision overturning it
2.5% of working Ohioans relied on UI benefits is upheld, jobless Ohioans will receive benefits
for some of their family’s living costs. Such only through the first week of September, when
benefits could have comprised back payments they expire.
received by Ohioans for their own prior bout
Ohio Organizing Collaborative
STATE OF WORKING OHIO 2021
20policymattersohio.org
Essential workers
When most Ohioans were sent home to shelter from COVID-19, essential workers continued to go
to work, providing the vital services all Ohioans relied on to get through the pandemic thus far.
In doing so, they took on added risk of COVID-19 exposure to themselves and their families. This
summer, vaccine access made frontline essential workers safer than they had been in prior months
of the pandemic, but rising daily case counts show the danger of COVID-19 is not yet passed.
Despite the new recognition of their value, and the safety risks they have taken on, many Ohio
essential workers continue to struggle with wages that pay less than the cost of living, and 12.9%
less, on average, than their counterparts in industries not classified as essential.41
The safety risks of going to work in a pandemic have not been borne evenly. While nearly three in
10 Ohio workers overall are in frontline essential jobs, Ohioans of color are more likely to work in
essential jobs that place them at heightened risk of contracting COVID-19 in the workplace.42 Men
and women are equally likely to work essential jobs, but women work more of the lowest-paid and
highest-exposure jobs.
Greater Cleveland Regional Transit Authority
STATE OF WORKING OHIO 2021
21policymattersohio.org
Figure 11
Source: Economic Policy Institute Minimum Wage Simulation Model using data from the Census Bureau, Bureau of Labor Statistics, and
Congressional Budget Office. See EPI Minimum Wage Simulation Model 2019. Dollar values adjusted by projections for CPI-U in CBO
January 2020 projections.
The most common essential jobs in Ohio are in The food and agriculture sector has the
health care (391,000 workers), and food and lowest median pay of Ohio’s major essential
agriculture (287,000). Health care jobs are job categories at just $12.07. As of April, the
also the most female-dominated, with women United Food and Commercial Workers union
comprising 77.5% of all workers. Yet, while the reported 91,000 confirmed COVID-19 cases
health care industry offers well-paying jobs for and 456 deaths among their ranks as of
doctors, registered nurses and other specialists, April.43 Latinx Ohioans including documented
many health care workers, such as home health and undocumented immigrants comprise
aides, are low-paid. Across the industry, women many of Ohio’s farm workers, a reminder that
are paid 67 cents on the dollar compared with these are vital workers whom we all depend
male counterparts. on, and who deserve workplace protections
STATE OF WORKING OHIO 2021
22policymattersohio.org
and fair wages. Among the challenges farm to the fastest-growing jobs list it previously
workers face during the COVID-19 pandemic produced.44 In order to meet the threshold to
are crowded living conditions and crowded be classified as an “in-demand” job, the job
transportation to worksites, and limited access has to pay at least 80% of the median wage
to handwashing stations. for the state. Yet the new top jobs include child
care workers, home health aides, and others
Even when COVID-19 is at last behind us, whom we depend on but whose low wages
the vital importance of essential workers’ do not reflect the value of their work. Ohio
contribution to our communities will remain. policymakers should follow their designation of
The fact is, essential workers were essential these workers as critical infrastructure workers
before COVID-19, and will remain so after. with steps to ensure that they are fairly paid for
ODJFS has implicitly recognized this fact in their work.
creating a new class of “top jobs” in addition
Who has been harmed
SEIU Local 1
Impact on women & men
Women have been especially harmed by the In March and April of last year, when new UC
coronavirus recession. Besides working the claims exceeded half a million each month,
frontline jobs most exposed to safety risks, women were more likely than men to file claims.
women are also concentrated in low-paid In other months, men were slightly more likely
service sector jobs that were more likely to be to file claims. However, men are more likely to
destroyed by COVID-19. And women took on work in jobs that have seasonal cycles in which
more than their share of unpaid care work for periods of unemployment are routine. Note
loved ones who became ill, and children sent men’s substantially higher claims in January and
home from school and child care centers when February 2020, before the effects of COVID-19
they closed. on the job market. Data in February and March
2021 also capture many filings that were flagged
for fraud.
STATE OF WORKING OHIO 2021
23policymattersohio.org
Figure 12
Source: Ohio Department of Job and Family Services, Labor Market Information, “UC 237.CD – Monthly Claimant Demographics by
County,” https://ohiolmi.com/home/Uiclaims
The Institute for Women’s Policy Research has found that the Great Recession primed young
women in particular to face an especially difficult time recovering from this recession by restricting
opportunities for entry-level workers and concentrating women in low-paid service sector jobs.45
Those jobs left young women and others with fewer resources to withstand any downturn, and
they were more likely to be destroyed by COVID-19.
The share of both men and women working dropped steeply in this recession. Job losses
exacerbated a trend in which a shrinking portion of men have been working since the peak of
75.7% in 1979. The share of men working fell off steeply in the 1979-1982 recessions caused by
contractionary Federal Reserve policy, and in the Great Recession. The share has fallen off again
after six years of slow recovery beginning in 2013, with 60.9% of men working by 2020, the lowest
share on record. The Great Recession reversed growth in the share of employed women, which had
generally gone up since a low of 46.2% in 1979. The coronavirus recession has further reduced the
share of women working, from a pre-Great Recession 58.6% to 52.7% in 2020.
STATE OF WORKING OHIO 2021
24policymattersohio.org
Figure 13
Source: EPI analysis of Current Population Survey microdata, inflation adjusted to 2020 dollars.
Median wages by gender
The coronavirus recession set back progress
Ohio employers continue to pay women just
women were making toward equal pay. Year-
83 cents on the dollar compared with men.
over-year ending in 2020, Ohio men’s wages
However, the gender wage gap has narrowed
rose by $1.17 per hour, while women’s rose by
by three-fifths ($5.79). Today, women are paid
$0.53. Like other wage figures reported here,
less than men at the median by $3.58 per hour,
this likely reflects a compositional change in
but in 1979 that figure was $9.37 per hour. All
who is working, not an improvement in the
figures are given in inflation-adjusted 2020
typical (median) worker’s well-being. Low-paid
dollars. The narrowing of the wage gap is due to
workers bore more than their share of the job
both growing women’s wages (which account
losses from COVID-19 and the recession.
for 75% of the change) and falling men’s wages
(25%).
STATE OF WORKING OHIO 2021
25policymattersohio.org
Figure 14
Source: EPI analysis of Current Population Survey microdata, inflation adjusted to 2020 dollars.
For women, especially those with children, with fathers, mothers who worked from home
remaining connected to the workforce proved got three fewer hours per week (39 hours
more difficult than for male counterparts. This for mothers and 42 hours for fathers).47 For
attachment matters beyond the immediate those who worked onsite at their workplace,
months during which women experience lost mothers lost six hours (37 hours and 43,
employment income. Researchers found that respectively). Yet this ability was a privilege
for women who took even a single year off from reserved to a minority of workers. Nationally,
the workforce in the 15 years ending in 2015, those who could work from home tended
the typical woman was paid 39% less than her to be disproportionately better paid, and
female counterpart who worked each of those disproportionately white.48
years.46 The ability to work from home during
the pandemic helped women with children
remain attached to the workforce. Compared
STATE OF WORKING OHIO 2021
26policymattersohio.org
COVID & race
Median wages for Black and white Ohioans Elvert Barnes /Flickr
The amount white Ohioans were paid in
excess of Black Ohioans’ pay more than tripled
between 1979 and 2020, from $1.57 to $4.96 an
hour. In 1979, Black Ohioans were paid 92 cents
on the dollar compared with white Ohioans.
That rate peaked in 1988 at 95 cents on the
dollar. By 2020, it has fallen to just 76 cents, a
ratio that held since last year despite the large
shift in wages from 2019 to 2020.
Often with policymakers’ help, employers
successfully pushed Black workers’ pay
down by $1.07 per hour since 1979. Besides
facing direct discrimination, Black Ohioans
have been disproportionately harmed by
deindustrialization exacerbated by pro-
corporate tax and international trade policy;49
legacy housing discrimination which has
segregated neighborhoods50 and — coupled
with Ohio’s unconstitutional local property tax
model of school funding — has under-resourced
predominantly Black schools;51 and a criminal
justice system that treats Black residents more
punitively at every level of interaction and has
attached hundreds of career barriers to having
a criminal record.52
STATE OF WORKING OHIO 2021
27policymattersohio.org
Figure 15 shows how Black workers’ wages have been pushed down while white workers received
overall — albeit volatile — pay increases. For both groups, the trendlines show a significant bump
in pay from 2019 to 2020. It is important to realize that this is not a measure of actual growth
in wages, but instead reflects a change in the mix of workers who kept their jobs — better-paid
workers were more likely to still be working in 2020 than their lower-paid counterparts, who
shouldered most of the job losses.
Figure 15
Source: EPI analysis of Current Population Survey microdata, inflation adjusted to 2020 dollars.
STATE OF WORKING OHIO 2021
28policymattersohio.org
Black Ohioans experienced much higher rates of joblessness than white counterparts throughout
the last four decades and during COVID-19. The trend of Black unemployment running at double
the rate of white unemployment has persisted since the 1940s: AFL-CIO chief economist William
Spriggs has called it an equilibrium of the systemic racism baked into the labor market.53 By the
second quarter of this year, this rate had gotten even worse: Ohio’s unemployment rate for white
residents was 4.0%; for Black counterparts it stood at 12.1%.54
Figure 16
Source: EPI analysis of Current Population Survey microdata.
STATE OF WORKING OHIO 2021
29policymattersohio.org
Geographic impact
Dan Keck / Flickr
The impact of COVID-19 has differed for Ohioans based on where they live, as did the economic
opportunities available before COVID.
Statewide, average per-capita income by 2019 was $50,199. This figure was skewed upward
by wealthy Ohioans. It also varied greatly by region. For Ohio’s urban counties, the figure was
a slightly higher $50,603. Especially in urban counties, this single figure obscures significant
inequality. Among Appalachian counties, per-capita income averaged just $39,564. For counties
that were neither urban nor in the Appalachia region, average per-capita income was $47,190.
Figures are not population-weighted; this means that each county is given the same weight within
its group.
Figure 17 shows average per-capita income for Ohioans by county. Counties are color-coded to
indicate whether they are Appalachian (green), urban (gray) or both (light blue — only Mahoning
County). Other Ohio counties are marked in dark blue.
STATE OF WORKING OHIO 2021
30policymattersohio.org
Figure 17
STATE OF WORKING OHIO 2021
31policymattersohio.org
Ohioans living in cities and urban counties
More than half (52.7%) of Ohio residents live in one of the 10 most populated of the state’s 88
counties: Butler (Hamilton), Cuyahoga (Cleveland), Franklin (Columbus), Hamilton (Cincinnati),
Lorain (City of Lorain), Lucas (Toledo), Mahoning (Youngstown and Warren), Montgomery
(Dayton), Summit (Akron), and Stark (Canton).
Ohioans in urban communities have been deprived of opportunity as manufacturing industries
migrated to suburbs and out of state, often with lavish tax incentives to entice them.55 Housing
segregation has meant that Black Ohioans disproportionately suffered the effects of this.56 Today,
Ohio cities also struggle following state policy change beginning in 2011 that dramatically slashed
revenue for local governments and drained vital public resources. Those changes cost Ohio local
governments over $1 billion a year by 2017, compared with 2010 revenues.57
Ohioans living in Appalachia
Ohio has 32 Appalachian counties; 17.1% of Ohioans live in Appalachia.58
Even prior to COVID-19, Ohio’s Appalachian region struggled with limited job opportunities and
industrial diversification, low wages, lower educational attainment than the state average, higher
rates of poverty and poorer health outcomes. Appalachia is largely characterized by an extraction
economy in which absentee landlords exert outsized influence and the people who live there lack
political and economic power.59
The Appalachian region has long been dominated by corporations in extractive industries such
as coal mining, natural gas drilling, and timber, but it has also been home to some of the most
important labor battles in U.S. history. This year marks the centennial of the Battle of Blair
Mountain, in which some 13,000 mine workers in West Virginia’s Logan County took up arms in
resistance against harsh treatment and union-busting from mine owners.60 Mine workers revolted
against corporate control over nearly every facet of their lives: They lived in company towns, were
paid in “scrip,” which could only be used in company stores, and faced unsafe working conditions.
Blair Mountain is regarded as the largest labor uprising in U.S. history. The fighting and subsequent
indictments initially reduced mine workers’ union membership, but following New Deal protections,
unionization grew.
Today Appalachia needs deep infrastructure investments to create sustainable jobs, and
protections such as the PRO Act to again strengthen the bargaining power of working people in
the region.
STATE OF WORKING OHIO 2021
32policymattersohio.org
Unemployment claims
Ohioans experienced different levels of joblessness based on where they lived. Across all counties,
Ohioans filed one continuing unemployment claim for every 36 residents in June 2021. Yet this
varied by county, and both urban and Appalachian Ohioans had higher claims numbers. Residents
of urban counties were slightly more likely to file new and continuing unemployment claims than
the state average (49 versus 46 new claims per 10,000 residents, and 310 versus 276 continuing
claims). By June 2021, Appalachian residents filed more new claims per capita than the state
average, but fewer continuing claims. Statewide, Ohioans filed 46 new claims per 10,000 residents,
while Appalachians filed 52. Ohioans filed 276 continuing claims per 10,000 people the same
month, while Appalachians filed 244.
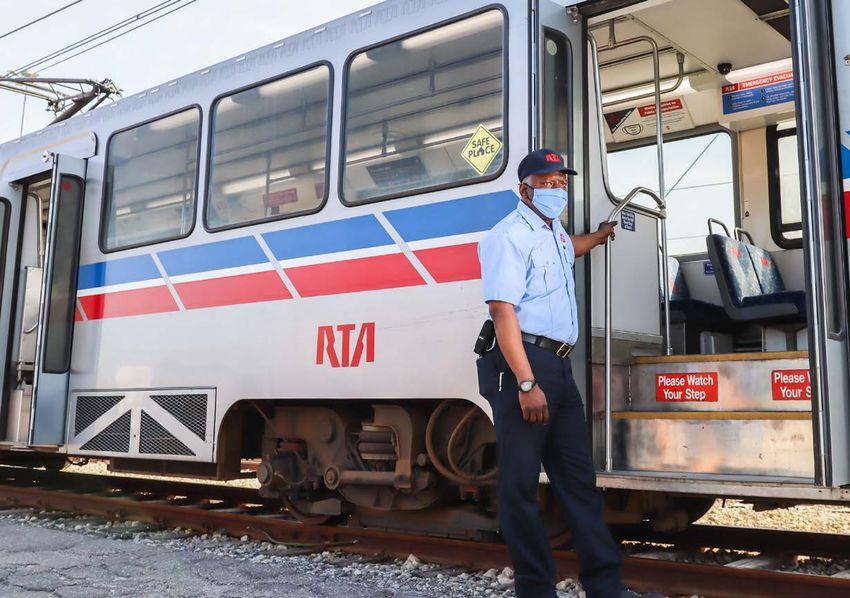
COVID impact by age
Paul Sableman / Flickr
The economic harm caused by COVID-19 has been especially intense for young workers.61 Young
people are often disproportionately harmed by economic downturns, but this recession has hit
young workers even harder because they were clustered in the sectors of the economy most
affected. Compounding this, those young people not yet employed when COVID-19 curtailed so
many job prospects were largely blocked from receiving jobless benefits.62 This includes much of
the 2020 graduating class, who graduated in May into an Ohio economy with nearly 1 million fewer
jobs than in February.
STATE OF WORKING OHIO 2021
33You can also read