Low-Carbon Alcohol Fuels for Decarbonizing the Road Transportation Industry: A Bibliometric Analysis 2000-2021
←
→
Page content transcription
If your browser does not render page correctly, please read the page content below
Low-Carbon Alcohol Fuels for Decarbonizing the
Road Transportation Industry: A Bibliometric
Analysis 2000-2021
Chao Jin
Tianjin University
Jeffrey Dankwa Ampah ( jeffampah@live.com )
Tianjin University https://orcid.org/0000-0002-0985-151X
Sandylove Afrane
Tianjin University
Zenghui Yin
Automotive Technology and Research Center, China
Xin Liu
Tianjin University
Tianyun Sun
Tianjin University
Zhenlong Geng
Tianjin University
Mubasher Ikram
Tianjin University
Haifeng Liu
Tianjin University
Research Article
Keywords: Methanol, Ethanol, Gasoline, Diesel, Internal combustion engine, Bibliometric analysis
Posted Date: April 30th, 2021
DOI: https://doi.org/10.21203/rs.3.rs-409872/v1
License: This work is licensed under a Creative Commons Attribution 4.0 International License.
Read Full License
Page 1/57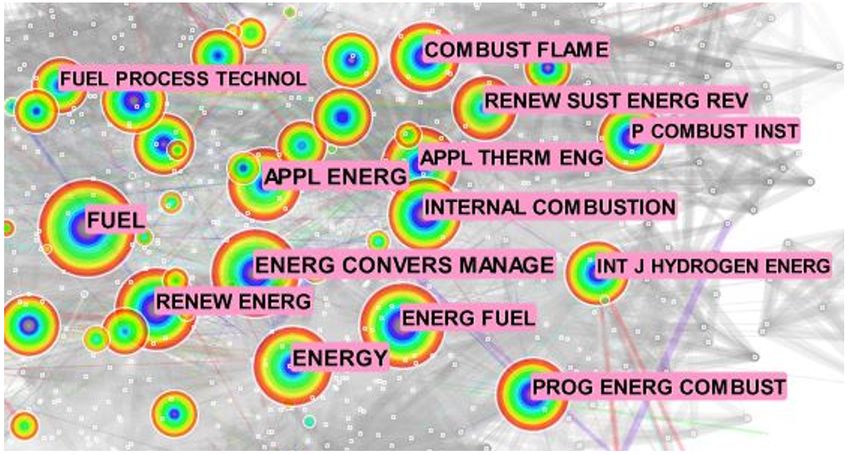
Abstract
Environmental pollution and depletion of resources from the combustion of fossil fuels have
necessitated the need for biofuels in recent years. Oxygenated fuels such as low carbon alcohols have
received significant attention from the scientific community in the last two decades as a strategy to
decarbonize the transport sector. However, a documentation of the progress, paradigm, and trend of this
research area on a global scale is currently limited. In the current study, the bibliometric analysis is
adopted to analyze the global transition of automotive fuels from conventional oils to low carbon
alcohols in the 21st century. A dataset of 2250 publications was extracted from the Web of Science Core
database and analyzed with CiteSpace, Biblioshiny, and Bibexcel. Interest in methanol and ethanol
combustion research as transportation fuels is increasing, with a 70% estimated growth by the end of the
next decade compared to current levels. China, India, and USA have been the major players in the
research field, with Tianjin University being the most influential institution. Research has primarily
centered on the combustion, performance, and emission characteristics of ethanol fuel. Alternative fuels
to compete actively with low carbon fuel in the near foreseeable future are green hydrogen and biodiesel.
Advanced combustion technologies and artificial intelligence are sure to increase in this research area in
the coming decades.

Highlights
    Bibliometric analysis on low carbon alcohol combustion in an internal combustion engine.
    Web of Science Core Collection database, from 2000 to 2021, was used.
    Growing research field with an average annual growth rate of 12%.
    Critical research hotspots of future studies on alternative fuels for internal combustion engine have
    been identified.

1. Introduction
The rapid depletion of fossil fuel reserves and its related-environmental pollution has accelerated the
search for clean alternative fuels worldwide (Chen et al., 2013; Huang et al., 2016). The use of alcohol as
alternative renewable fuels for internal combustion engines (ICEs) has been reported to minimize these
problems (Zhu et al., 2021). An internal combustion engine (ICE) is a heat engine where the combustion
of a fuel occurs with an oxidizer (usually air) in a combustion chamber that is an integral part of the
working fluid flow circuit (Mayank et al., 2016). Low or short-chain carbon alcohols viz methanol and
ethanol have been identified as two of the most promising oxygenated fuels (Han et al., 2020; Zhu et al.,
2021) to decarbonize the transportation sector. They have a wider range of feedstock and relatively
simpler production routes. Compared to traditional oils, i.e., diesel and gasoline, the C1-C2 alcohols have
excellent fuel properties such as high latent heat of vaporization, lower adiabatic flame temperature,
oxygenated molecule, absence of C-C bonds, high oxygen content, lower viscosity, high H/C ratio, low

                                                   Page 2/57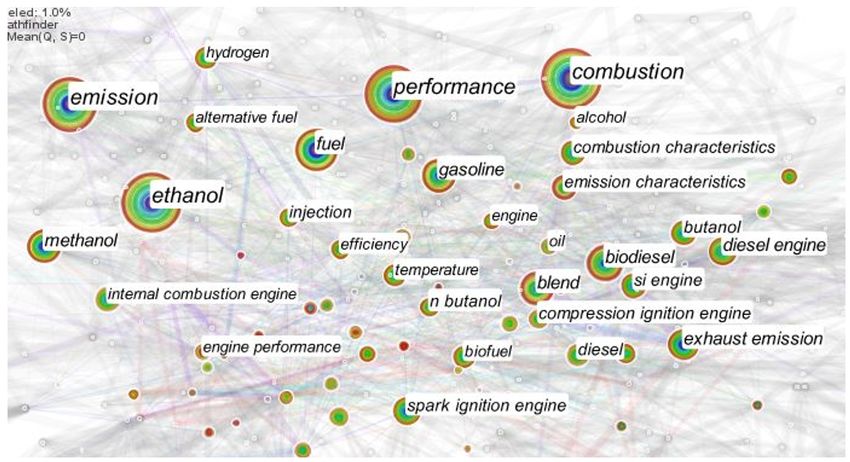
sulfur content, and high evaporative cooling (Kim et al., 2020; Zhu et al., 2021). These collective attributes
work together to reduce post-combustion emissions in neat or blended methanol/ethanol fuels.

Accelerated patronage for alcohol combustion as alternate fuels in ICE was recorded in the middle of the
1970s and reached its peak by the middle of 1980 (Solomon et al., 2007). These oxygenated fuels were
thought to be attractive due to their production from natural products or waste materials, whereas
traditional oils, which are non-renewable resource cannot be manufactured (Canakci et al., 2013; Chen et
al., 2005). In addition, these oxygenated fuels could be used without significant modifications to the
existing engine structure. Amongst various alcohols, ethanol and methanol are considered the most
suitable fuels for ICEs. They are characterized by relatively higher flash point and autoignition
temperature compared to that of pure diesel and gasoline, making them safer for storage and
transportation. The latent heat of methanol (110 KJ/kg) and ethanol (846 KJ/kg) is relatively higher than
diesel’s (243 KJ/kg) and gasoline’s (180–350 KJ/kg); thus, there is an increase in the volumetric
efficiency for alcohols due to the reduction in the intake manifold’s temperature (Iliev, 2019). The
stoichiometric air-fuel ratio of the short-chain alcohols is relatively smaller than the pure petroleum fuels;
hence methanol and ethanol would require a smaller amount of air to complete combustion (Pikonas et
al., 2003). Ethanol and methanol have better anti-knock characteristics, and their higher-octane number
enables higher compression ratios of engines, thus increasing thermal efficiency (Bata et al., 1989;
Dasilva et al., 2005).

There are several strategies to apply these low carbon alcohols in internal combustion engines; the three
most common types (Alptekin, 2017; Rakopoulos et al., 2008) are as follows: (1) fumigation into the
intake air charge (Abu-Qudais et al., 2000; Surawski et al., 2010). A fumigation system injects a gaseous
or liquid fuel into the intake air stream of compression ignited engine. This fuel burns and becomes a
part-contributor to the power-producing fuel. NOx and particulate matter reduction increase with
increasing levels of fumigation. However, in general, fumigation fuels increase HC, CO, and NO2
emissions (Cooke et al., 1971; Li et al., 2020; Zhang et al., 2011).

The second strategy is a complete substitution of commercial gasoline or diesel with methanol or ethanol
via port or direct injection. The high-octane number of oxygenated alcohols enables them to be used
directly in engines with flexible injections such as alcohol single fuel mode (Gong et al., 2019). It has
several advantages such as: controlling the amount of alcohol injected in each engine; incomplete
combustion at low load and roar combustion at high load could be avoided; simultaneously reduce THC,
CO, NOx, and soot emissions effectively; could achieve an ultra-high proportion of alcohol instead of
traditional oil (Li et al., 2019). However, there are certain drawbacks to this type of strategy: direct use of
primary alcohols in ICEs without assistance is difficult due to their lower cetane numbers and viscosities
(Ning et al., 2020) compared to gasoline and diesel; moreover, this strategy requires significant
modification of engine hardware and injection system to nullify the effect of alcohols’ autoignition
resistance and low lubricity, respectively (Haupt et al., 2004).

                                                   Page 3/57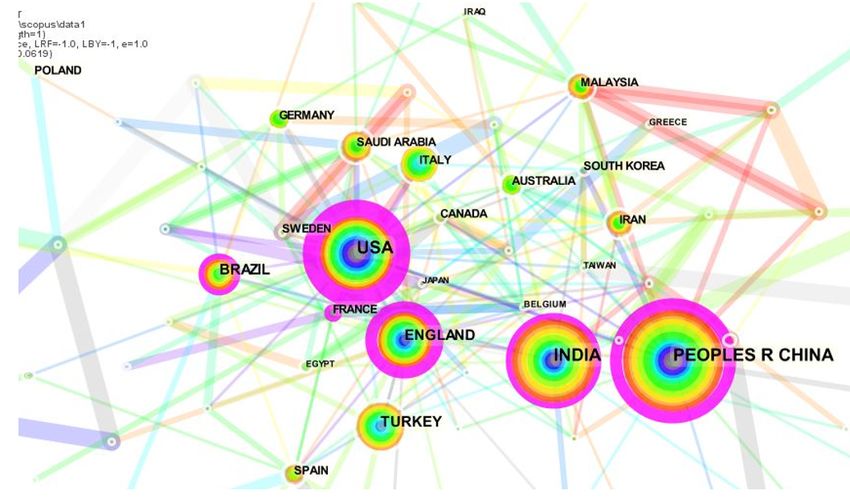
The third strategy is achieved through blending methanol or ethanol in diesel or gasoline. By far, this is
the most common strategy employed by researchers (Kim et al., 2020) since little or no modification is
required of the engine itself. Significant emission reduction has been achieved when blended fuels of
oxygenated alcohols-diesel/gasoline are used (Labeckas et al., 2014; Tse et al., 2015). However, these
fuel systems are characterized by phase separation limitations. The polarity difference existing between
the alcohols and oils prevents the formation of a single-phase uniform mixture between their blends (Jin
et al., 2019a; Jin et al., 2019b; Jin et al., 2020). The alcohols are relatively hygroscopic and miscible with
water, thus lowers the upper blending limit with diesel or gasoline (Jin et al., 2019a). All automotive fuels
must be homogenous to prevent severe consequences such as blockages and pumping difficulties during
storage and transport (Oasmaa et al., 2015). The situation warrants the use of either an emulsifier to
suspend small droplets of ethanol within the gasoline/diesel or a co-solvent with the ability to promote
molecular compatibility and bonding to yield a homogenous mixture (Shahir et al., 2014; Wu et al., 2020).
In addition, the lower cetane number, calorific value, and viscosity of low carbon alcohols have also been
described as a limitation to its blends with traditional oils (Ileri, 2016). Low cetane number and viscosity
(extreme cases) leads to poor ignition (prolonged ignition delay) and atomization, respectively, which
leads to the formation of more incomplete combustion products detrimental to the environment, whereas
lower calorific value increases fuel consumption.

Several researchers have reviewed the growing literature in this field of research. To mention a few, Kumar
et al. (2013) reviewed the advances made in diesel-alcohol blends and their effects on the performance
and emissions of diesel engines. A similar study was conducted by Prakash et al. (2018) on the recent
advancements in biofuels and bioenergy utilization. Niculescu et al. (2019) also analyzed the literature
concerning diesel-biodiesel-alcohol blends in compression ignition engines. Finally, Kumar and Chauraria
(2019) reviewed the performance and emissions of a compression ignition engine fueled with alcohol-
diesel blend. The reviews as mentioned earlier mainly: (1) compared the physicochemical properties
between alcohols and their conventional oil counterparts; (2) report on the progress of alcohol production
from different sources; and (3) analyze the effect of alcohol/conventional oil type and blending ratio on
performance, combustion, and emission characteristics. However, these traditional reviews have certain
limitations. Increasing research interest in ethanol/methanol application has resulted in many
publications over the past decade compared to the previous decades. Minimal attempts have been made
to map the global research in this area. More knowledge could be gained by qualitatively and
quantitatively analyzing the existing literature and exploring and tracking the evolution of a large number
of published works.

A typical non-traditional review methodology is the bibliometric analysis. It is a set of mathematical and
statistical methods to display up-to-date and on-going knowledge that has been applied in many
disciplines of science and engineering. The tool could be employed to ascertain the research trends by
the publication outputs of countries, characteristics of authors, and research institutes to make an overall
researching perspective of a topic of interest. Also, the distribution of words in the article title, author
keywords can be used to evaluate research trends of different researching periods or countries. Meyer
(2020) employed bibliometric and network analysis to analyze the research trend in the decarbonization
                                                   Page 4/57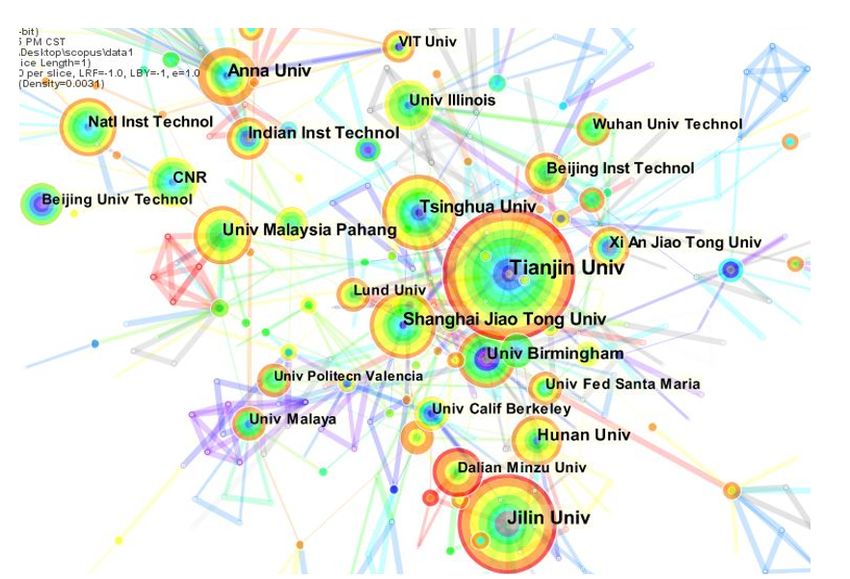
of road freight transportation. The network and content analysis revealed that decarbonization of road
freight transportation is approached from three directions; (1) technological innovations such as
alternative fuels and electrification. (2) operation measures to make use of last-mile solution, routing,
consolidation, and vehicle fill. (3) economic measures such as the influence economic activities and
development have on road freight transport, energy efficiency, and carbon emissions. The research trend
and characteristics of carbon emissions from the transport sector was also investigated by Tian et al.
(2018) This analysis revealed that within the transportation sector, road transport is the most researched
area, with electric vehicle being the most common topic. Emissions, specifically CO2 was the second
most frequent topic category. Natural gas and alternative fuels dominated fuel related keywords. Great
interest was given to vehicle design, carbon capture and storage, and torque control strategy as
technological-related topics. Zhang et al. (2018) used the technique of bibliometric analysis to investigate
the research trend of biodiesel between 1991–2015. Their study revealed that microalgae, Jatropha
curcas, vegetable oil, and waste cooking oil were the most general raw materials for biodiesel production
in that period.
Surprisingly, to the best of the authors’ knowledge, the use of bibliometrics analysis for methanol and
ethanol in ICEs is very limited (no direct publication exists so far) despite the growing research interest in
this topic. Thus, the current study seeks to use bibliometric analysis to answer at least one of the
following research gaps: (1) how long has the landscape of low carbon alcohol utilization in ICEs
research evolved? (2) how are the scientific studies on low carbon alcohol utilization in ICEs distributed
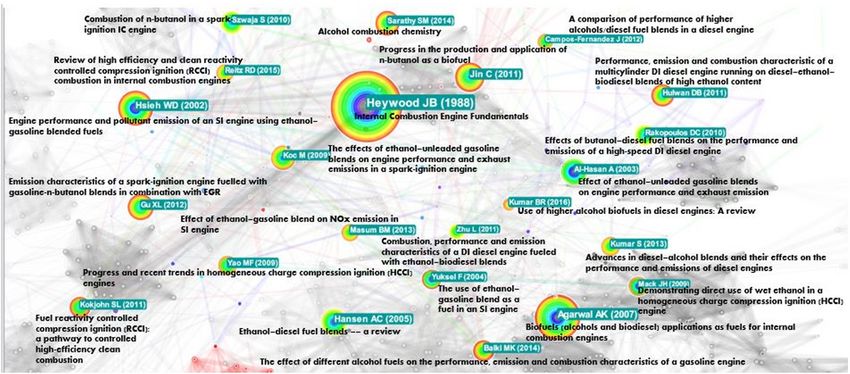
among the core and other scientific journals in this research? (3) what are the most relevant publications
on this research topic? (4) what are the most productive and influential funding agencies, countries,
organizations, and authors that have contributed to the application of low carbon alcohol in ICEs? (5)
what are the recent research hotspots in methanol/ethanol combustion for the transport sector? The
current bibliometric review seeks to bridge these research gaps and provide researchers with a better
understanding of the development of ethanol and methanol combustion in ICEs as a basis for future
research directions.
1.2 Retrospection; Low carbon alcohol combustion in ICEs
1.2.1 Ethanol
A long history of ethanol and gasoline-ethanol blends as automotive fuels exists (Solomon et al., 2007).
In the mid-1800s, Samuel Morey developed an engine that ran on ethanol and turpentine. In 1860,
German engine inventor, Nicholas Otto, known for his development of a modern internal combustion
engine (Otto cycle) used ethanol as fuel for one of his engines (HVA, 2011). By 1862, ethanol's cost had
increased significantly as a result of its imposed tax of $2 per gallon to help pay for the civil war (Mimi,
2008). Around the 1890s, Henry Ford built his first automobile, ‘the quadricycle,’ to run on pure ethanol.
After 50 years of tax imposition, congress removed the tax to make ethanol more competitive to gasoline
as a motor fuel. In 1908, the model T was developed by Henry Ford that could run on pure ethanol,
gasoline or a blend of the two. Demand for ethanol grew from 50–60 million gallons per year during the
Page 5/57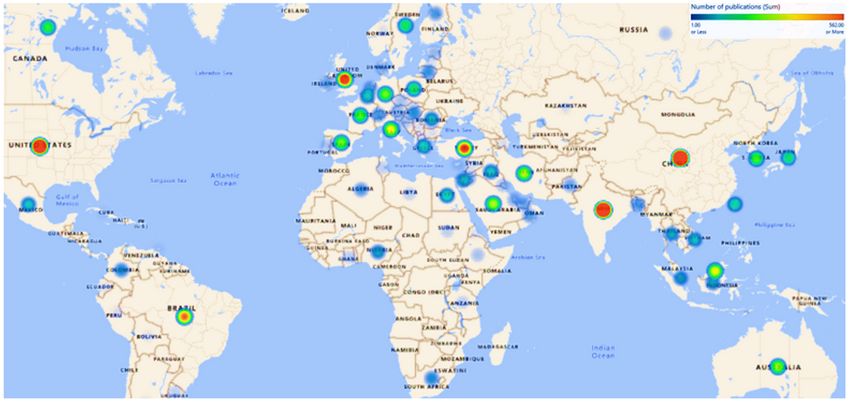
world war I (1917-18). By the 1920s, the octane property of ethanol made it as an attractive fuel to reduce
engine knocking of gasoline fueled engines. In the 1930s, 6–12% ethanol blended in gasoline were sold
over 2,000 gasoline stations in the mid-west. The start of World War II increased demand and production
of ethanol; however, the rise in ethanol’s demand was for non-fuel wartime purposes. After the war,
interest in ethanol reduced as leaded gasoline proved easier and cheaper to produce, while the discovery
of new oil reserves reduced the search for alternative fuels (Solomon et al., 2007). In 1975, interest in
ethanol was revived once more as the US-Environmental Protection Agency instituted regulations to
phase out leaded gasoline. The US Energy Tax Act of 1978 introduced the term gasohol, which refers to
gasoline with at least 10% alcohol content by volume, excluding alcohols produced from petroleum,
natural gas, or coal (Mimi, 2008; Solomon et al., 2007). 40 cent per gallon as subsidy was realized for
every gallon of ethanol blended into gasoline after this law came into effect.

Between 1980-1990s, the phasing out of leaded gasoline made methyl tertiary butyl ether (MTBE) the
most dominating oxygenated fuel in the gasoline market. After this period, MTBE dominance was
curtailed due to its toxicity, especially in ground drinking water, making ethyl tertiary butyl ether (ETBE)
take over throughout the 1990s (Solomon et al., 2007). The Energy Policy Act of 1992 provided
regulations for at least 85% ethanol as an alternative transport fuel. By 1997, major US manufacturers
began mass production of E-85 powered FFV. The Energy Policy Act of 2005 was instituted to ensure
gasoline sold in the US contained a minimum volume of renewable energy, mainly ethanol made from
corn. On April 21, 2009, 55 ethanol-producing companies led by Growth Energy submitted partial waivers
to increase the ethanol blend limit from 10 to 15%. Eighteen months later, the EPA approved the partial
waiver request to pass out E15 as automotive fuel (HVA, 2011).

1.2.2 Methanol

Boyd, in the 1920s, raised early concerns that conventional oil would run out, and efforts were to be put in
place to increase engine efficiency to reduce fuel consumption via improved knock resistance of refined
fuels (Boyd, 1950). His exact words were, “butyl alcohol (butanol) did not knock in any of the engines
they had then,” referring to engines available during the 1920s, proving that the attractiveness of alcohols
in engines was apparent early on. In the 1940s, during the Second World War, there was a limited supply
of petroleum fuels, especially in Europe, forcing vehicles to be run on the fumes from wood burners which
comprised methanol, CO, and hydrogen (Hagen, 1977). Huge discussions on alternate synthetic fuels,
especially alcohol, went on due to the imminent shortage of petroleum resources. However, the discovery
of large petroleum resources reduced the search for these alternative fuels until 1974 during the acute
awareness of the oil embargo's fuel shortage (Hagen, 1977). By 1975, several studies on methanol and its
use in gasoline considered the difficulties and problems, and advantages had been reported. The
American Chemical Society and the Society of Automotive Engineers had held meetings to emphasize the
urgent need for alternative fuels, especially methanol (Most and Longwell, 1975). Lawrence Livermore
Labs continued their studies of methanol in engines. The US Energy Research and Development
Administration and other institutions such as the University of Santa Clara collaborated to characterize
the detailed performance of methanol and gasoline-methanol blends in IC engines. In 1976, the first
                                                   Page 6/57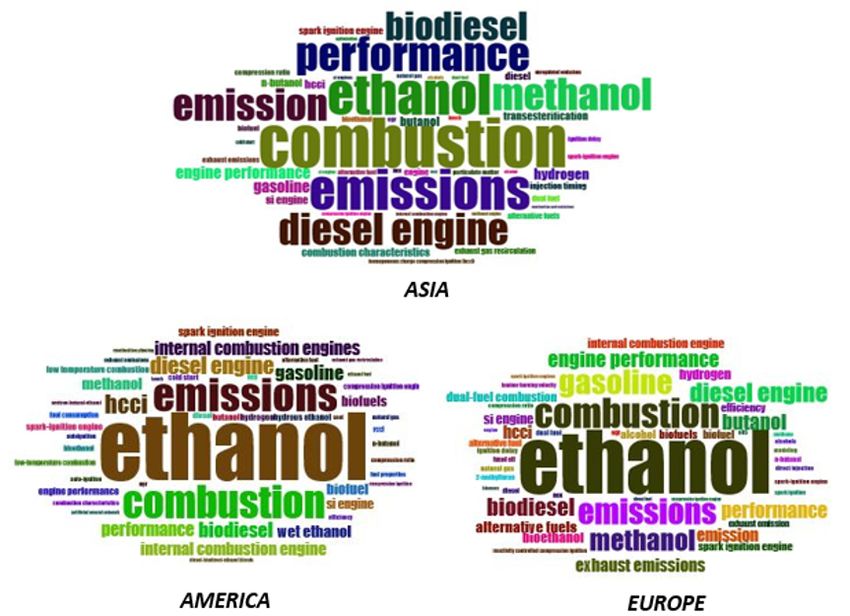
international conference on methanol combustion in ICE was held, sponsored by the Swedish Methanol
Development Co. (Hagen, 1977).

By the mid-1970s, small vehicle fleet trials were conducted in Germany (Bertau et al., 2014). Larger fleets
were brought on board in the late 1970s and early 1980s by Germany, Sweden, New Zealand, and China.
In the same period, Ford and Volkswagen developed the first flexible fuel vehicles (FFV) and participated
with other 100 vehicles in the test program in the 1990s in California. Over 21,000 methanol M85 flexible
FFV fueled with methanol-gasoline blend were used in the US by the mid-1990s (Bromberg and Cheng,
2010). The FFV program's interest took a hit as methanol prices increased, whereas gasoline’s diminished
in the mid-to-late − 1990s. Ethanol went on to receive methanol’s attention as the methanol program in
California ended in 2005. However, methanol is highly used in racing vehicles such as Grand Prix cars as
of today. Low levels of methanol (M3) in gasoline exist currently in Great Britain. At present, the use of
methanol is more dominant in the shipping sector (e.g., Stena Line, Methanex vessel). However, at
present, Chinese road transport is rolling out M15, M30, M85, and M100 for commercial application
(Andersson and Salazar, 2015; Zhao, 2019).

Table 1 compares the key fuel properties between the alcohols and conventional oils. The decline of
conventional oil is inevitable unless more reserves are discovered coupled with energy-efficient systems
and proper policing; this infinite resource behavior of conventional oils is emphasized in Fig. 1, bolstering
the increasing need for alternative fuels such as methanol and ethanol.

Table 1

Fuel properties of fuels under review (Agarwal, 2007; Harari et al., 2020; Ickes et al., 2014; Jamrozik et al.,
2019; Waluyo et al., 2021).

                                                   Page 7/57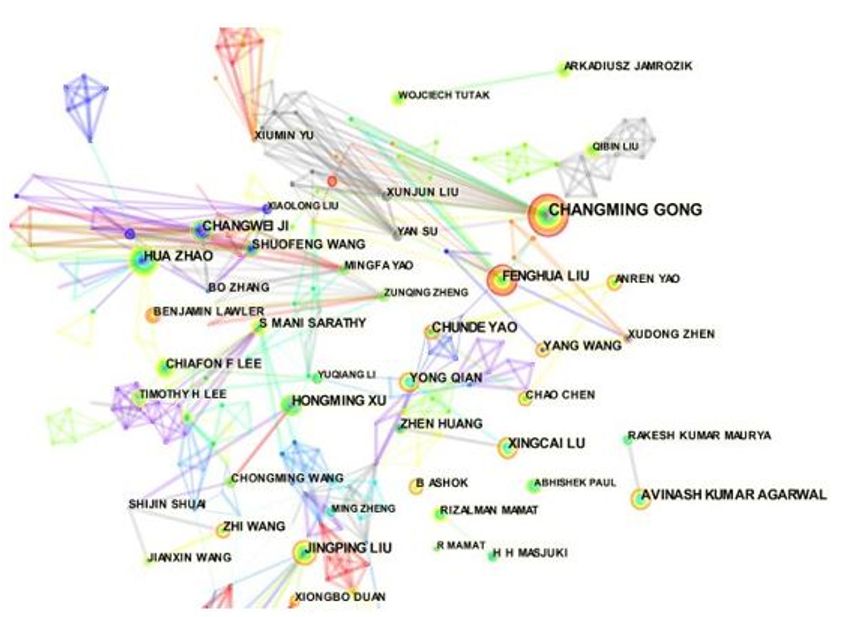
Property (unit)                 Methanol        Ethanol   Diesel    Gasoline

              Molecular formula               CH3OH           C2H5OH    C14H30    C7H16

              Molecular weight (g/mol)        32.04           46.06     198.40    100.20

              Cetane number                   3               8         51        -

              Research octane number          136             129       15–25     97

              Lower heating value (MJ/kg)     19.5            26.9      42.5      42.9

              Heat of evaporation (MJ/kg)     1100            840       243       180–350

              Auto-ignition temperature (K)   503             698       503       192–470

              Stoichiometric air fuel ratio   6.45            9.06      14.60     14.70

              Viscosity (40 ℃)                0.65            1.52      4.59      0.67

              Carbon content (%)              37.5            52.2      85.0      86.0

              Hydrogen content (%)            12.5            13        15        14

              Oxygen (%)                      50              34.8      0         0

1.3 Review of performance and emission characteristics of methanol and ethanol combustion in ICEs

In this section, the previous results of other researchers on the combustion of methanol and ethanol in
both compression and spark ignition engine is reported as an overview on the performance and emission
characteristics of an alcohol-fueled ICE.

1.3.1 Ethanol combustion in a spark-ignition engine

Table 2

Performance and emission characteristics of ethanol in a spark-ignition engine.

                                                  Page 8/57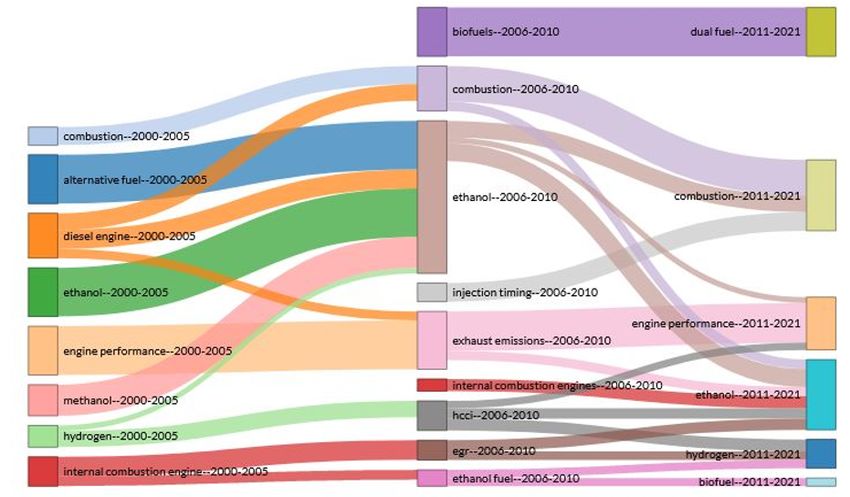
Ethanol           Engine type                             Performance      Emission    Baseline   Ref.
 blend                                                                                  Fuel

 1. E10W*,         Naturally-aspirated, port               +Brake power,    -CO, -HC,   Gasoline   (Deng et
                   injection                               +torque,         +NOx                   al.,
 E20W*                                                     +BSFC, +BTE                             2018)

 2. E10,           Single cylinder, four stroke            -BTE, +BSFC      +CO, -      Gasoline   (Li et al.,
 E30, E60          spark ignition                                           UHC, -                 2017)
                                                                            NOx

 3. E100           Low power gasoline engine               -BMEP, +BTE,     -UHC, -     Unleaded   (Koç et
                                                           +BSFC            CO, NOx,    gasoline   al.,
                                                                            ~CO2                   2009)

 4. E50,           Hydra, overhead cam shaft,              +Brake power,    -CO, -HC,   Unleaded   (Balki
 E85               with fuel injection                     +torque, +BSFC   -NOx        gasoline   and
                                                                                                   Sayin,
                                                                                                   2014)

 5. PE10,          Four stroke, single cylinder,           +BTE, +BSFC,     -HC, -CO,   Gasoline   (Dhande
 PE15,             spark ignition, multifuel, VCR          +brake power     +NOx,                  et al.,
 PE20,             with open ECU                                            ~CO2                   2021)
 PE25

 *hydrous ethanol; +: increase; −: decrease; ~: varies

1.3.2 Methanol combustion in a spark-ignition engine

Table 3

Performance and emission characteristics of methanol in a spark-ignition engine.

                                                         Page 9/57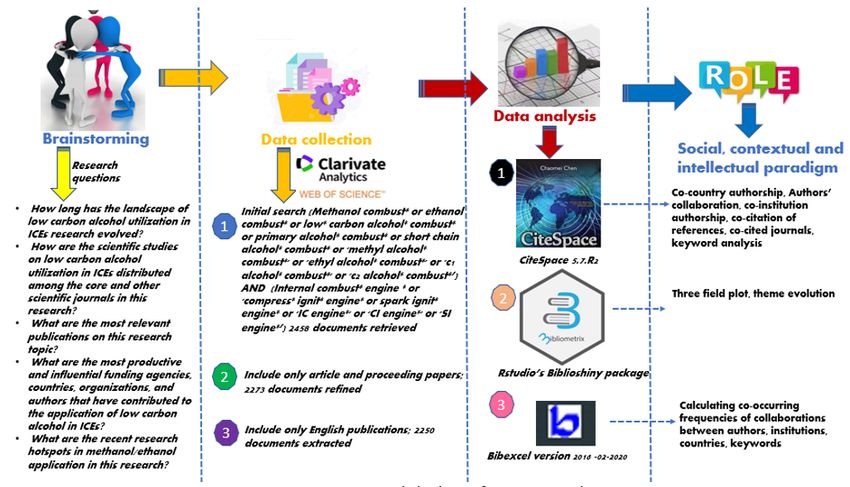
Methanol                Engine type                     Performance    Emission           Baseline   Ref.
 blend                                                                                     Fuel

 1. M10, M20             Single cylinder four            -BSEC, -EGT,   -HC, -CO, -NO, -   Gasoline   (Agarwal
                         stroke spark ignition           +BSFC, +BTE    smoke                         et al.,
                                                                        opacity                       2014)

 2. M10, M20             3-cylinder, port fuel           -BTE           -CO, = NOx         Gasoline   (Yanju et
                         injection, four stroke                                                       al.,
                                                                                                      2008)

 3. M5, M10,             Single cylinder, variable       +BMEP, BTE     -                  Gasoline   (Bilgin
 M15, M20                compression four-stroke                                                      and
                                                                                                      Sezer,
                                                                                                      2008)

 4. Me10,                3-cylinder, 4 stroke, spark     +BTE, -brake   -CO, -HC           Gasoline   (Liu et
 Me15, Me20,             ignition                        power                                        al.,
 Me25                                                                                                 2007)

 5. Me10,                Single-cylinder, 4 stroke,      -Brake         -NO, +HC           Gasoline   (Qi et al.,
 Me25                    spark ignition                  torque, -                                    2005)
                                                         brake power

 +: increase; −: decrease; =: slightly higher or equal

1.3.3 Ethanol combustion in compression ignition engine

Table 4

Performance and emission characteristics of ethanol in compression ignition engine.

                                                         Page 10/57
Ethanol Engine type Performance Emission Baseline Ref.
blend Fuel
1. e1, e2, Single cylinder, water-cooled, -BTE, -exergy -NOx, -CO2, - Diesel (Jamuwa et
e3, e4, e5 four-stroke stationary diesel efficiency, - smoke al., 2016)
engine EGT opacity,
+HC, +CO
2. 5% Six cylinder, in-line, four +BSFC, =BTE -Soot Diesel (Rakopoulos
Ethanol, stroke compression ignition, density, et al., 2008)
10% direct injection, water-cooled, =NOx, -CO,
Ethanol turbocharged, after-cooled +THC
3. E10, Direct injection, -BSFC +HC, ~CO, Diesel (Lei et al.,
E15, E20, turbocharged ~NOx, - 2011)
E30 smoke
4. RE10, 6 cylinders, 4 valves, water- +BSFC, -BTE, +NOx, -soot, Diesel (Wu et al.,
RE30 cooled, turbocharger wit air -excess co- -CO, +HC 2020)
intercooler efficient
5. E5, Four-cylinder, 4 stroke +BSFC, BTE +CO, -NO, Diesel (Labeckas
E10, E15 naturally aspirated ~HC et al., 2013)
+: increase; −: decrease; =: slightly higher or equal; ~: varies
1.3.4 Methanol combustion in compression ignition engine
Table 5
Performance and emission characteristics of methanol in compression ignition engine.
Page 11/57Methanol blend Engine type Performance Emission Baseline Ref.
Fuel
1. M5, M10, M15 Direct injection, +BSFC, -CO, -THC, - Diesel (Sayin et
naturally aspirated, +BSEC, -BTE smoke al., 2010)
and four stroke opacity,
+NOx
2. DM10, DM15, Four stroke -EGT +NOx, ~THC, Diesel (Jamrozik,
DM20, DM25, compression ignition -CO, ~CO2 2017)
DM35, DM40
3. Ratio of Direct injection, 4 -BSFC -NOx, +HC, Diesel (Song et
methanol by stroke, single- +CO al., 2008)
mass (0–70%) cylinder
4. Methanol Single cylinder direct -BSFC -NOx, - Diesel (Liu et al.,
mass fraction injection diesel smoke, +HC, 2010)
(0–85%) engine +CO
5. Me10, Me20, Four-cylinder four- +BTE, -brake - Diesel (Najafi
Me30 stroke power, -brake and
torque Yusaf,
2009)
+: increase; −: decrease; ~: varies
To summarize, ethanol/methanol combustion has its own merits and demerits compared to pure diesel
and gasoline. Results may differ from one researcher to another due to differences in test procedures,
emission control equipment, engine operating parameters such as load, speed, compression ratio,
equivalence ratio, etc.; thus, a more general observation can only be stated. Overall, alcohol-
diesel/gasoline blends in a lower alcohol concentration showed improvement in engine torque and brake
power. For higher ratios of alcohol, additives such as cetane improvers could improve the brake torque
and power. Similarly, at high concentrations of alcohol, BSFC increases compared to that of the neat oils;
researchers explain that the relatively lower energy content of alcohols may be responsible for the
observation. BTE on average has been reported to increase with an increase in alcohol fraction as a
results of alcohols’ lower viscosity which improves fuel atomization. Generally speaking, HC and CO
emissions are increased and lowered, respectively for alcohol blends in compression ignition engines.
Typically, percentage differences in NOx and HC emissions for alcohol blends and neat conventional oils
were relatively modest. However, for spark-ignition engines, HC, NOx, CO, and CO2 are relatively higher in
pure traditional oils than alcohol blends, which could be attributed to alcohols' high oxygen content.
The literature available so far shows excellent fuel characteristics in the combustion of alcohols.
However, more effort could be put in place to address the alcohol-oil solubility problem, cetane, and lower
heating value reduction to help realize the maximum characteristics of alcohol fuels.
Page 12/572. Methodology
Bibliometric analysis is the application of quantitative tools to study science (Pritchard, 1969). Thus,
researchers have a powerful technique to investigate larger datasets at their disposal than a traditional
review while maintaining a high level of rigor, scientific soundness, transparency, and replicability (Dada,
2018; Rey-Martí et al., 2016). The current study aimed to identify what is known and unknown in fuel
combustion from the start of the present century, focusing on low carbon alcohols, diesel, and gasoline.
Hence, a quantitative analysis was conducted, applying performance analysis and science mapping
using three bibliometric software; CiteSpace, RStudio biblioshiny package, and BibExcel. The conceptual
design of the current study is highlighted in Fig. 2.
CiteSpace is one of the most sought-after bibliometric tools for investigating the evolution of a topic. It is
developed to ascertain the structure and distribution, and distribution of scientific knowledge in the
context of scientific meteorology, data analysis, and information visualizations, allowing the easy trace
and understanding of the research paradigm of the interested literature landscape (Chen, 2006). The
5.7.R2 (64 bit) version of CiteSpace with Java was used. Social Network Analysis (SNA) is a quantitative
method of analyzing and visualizing the relationship among research entities (Mao et al., 2015). In this
study, SNA was adopted with CiteSpace’s aid to visualize and analyze the various research entities'
academic collaboration. SNA (authors, countries, institutions), co-citation network analysis (cited
journals, local references of documents), and keyword analysis (keywords; title, abstract, author
keywords, and keyword Plus) were evaluated with CiteSpace to map out the past, current, and future
research trend of low carbon alcohol application in ICEs. The parameters in CiteSpace were set at: (1)
Time slicing = 2000–2021, years per slice = 1; (2) Node type = author, institution, country, keyword, cited
journal, cited reference; (3) Network selection criteria was based on Top N = 50; (4) link strength and
scope = cosine and within slices, respectively; (5) Pruning = pathfinder and sliced network.
The bibliometrix package of RStudio is a handy scientific mapping tool, especially for non-coders (Aria
and Cuccurullo, 2017). It comprises five analysis levels; dataset, authors, document, conceptual,
intellectual and social. Each level includes different indicators, statistical measures, and visual
representations. Three field plots, wordcloud and theme evolution were performed with this software.
Persson’s BibExcel was minorly used in the current study; its main function was to identify the co-
occurring frequencies of the network between authors, institutions, countries, documents, and keywords.
The Web of Science Core Collection (WoS) with sub-field databases including Science Citation Index
Expanded (SCIE), Social Sciences Citation Index (SSCI), Arts & Humanities Citation Index (A&HCI),
Conference Proceedings Citation Index—Science (CPCI-S), Conference Proceedings Citation Index-
Science (CPCI-S), Emerging Sources Citation Index (ESCI), Current Chemical Reactions (CCR-EXPANDED),
Index Chemicus (IC) were selected for the current study. The WoS is a widely accepted database for
different scientific fields that employ bibliometric analysis (Chen et al., 2014; van Leeuwen, 2006). It has
over 100 subjects, making the database reliable for providing more consistent and standardized records
than other databases such as Scopus (Bettencourt and Kaur, 2011; Hou et al., 2015).
Page 13/57The search term for applying low carbon alcohol in ICEs, “TOPIC: (Methanol combust* or ethanol
combust* or low* carbon alcohol* combust* or primary alcohol* combust* or short chain alcohol*
combust* or 'methyl alcohol* combust*' or 'ethyl alcohol* combust*' or 'c1 alcohol* combust*' or 'c2
alcohol* combust*') AND TOPIC: (Internal combust* engine * or 'compress* ignit* engine* or spark ignit*
engine* or 'IC engine*' or 'CI engine*' or 'SI engine*') was entered on the database on the 30th January
2021 with a timespan of publications within 2000–2021. The inclusion of asterisk (*) at the end of words
ensures that all the words with the same root are included in the search result. “TOPIC” also involves a
simultaneous across title, abstract, author keywords, and Keywords Plus. The initial search yielded 2,458
publications.
The obtained literature contained publications (< 3%) with titles such as “Fuel processing for low-
temperature and high-temperature fuel cells - Challenges, and opportunities for sustainable development
in the 21st century (Song, 2002)” which may seem unrelated to the aim of the current study. However, a
critical look at these papers reveal that they make reference to the improvement of some of the
limitations identified in low carbon alcohol combustion in ICE which could serve as a reference point for
future direction. Thus, these very less fraction of publications with such ‘unrelated’ titles were all
considered for the current study. The h-index is a good measure of a research entities’ impact on a
subject and has the advantage of being objective (Kinney, 2007). A scientist has index h if h of his/her N
papers have at least h citations each, and the other (N-h) papers have fewer than h citations each (Braun
et al., 2006). The impact factor of top-performing journals was obtained from the Journal Citation
Reports (JCR) 2019 edition. It is a standardized indicator popularly adopted to measure the quality of
journals, research papers, as well as researchers (Mao et al., 2015). The higher the impact factor, the
higher the quality of the research. Other performance indicators included total local and total global
citation scores (TLCS and TGCS), number of publications, collaborative index. TLCS refers to citations of
a publication by the publications extracted for current study whereas TGCS refers to citation by any
publication either within or not within the extracted documents. In addition, the attractive and active
indexes of the countries have been employed from previous studies (Chen and Guan, 2011; Shen et al.,
2018). The methodology of these two indexes expressed in Eq. 1 and Eq. 2 was adopted from Huang et
al. (2020);
Where, represent the activity index and the attractive index of country i in the year t
respectively. and are the number of publications and citations of publications on low carbon
alcohol combustion in ICEs of country i in the year t; ΣP and ΣC are the total number of publications and
the sum of citations about the topic under review in country i during a given period. Similarly, TPt and TCt
represent the global number of publications and citations of publications in the year t; ΣTP and ΣTC
Page 14/57represent the total number of articles and the sum of citations during the same period as that of ΣP and
ΣC, respectively.
When the value of AI > 1, the productivity of the country is greater than the global average; AI < 1, the
productivity of the country is less than global average; AI = 1, productivity of country is same as global
average. The same rule applies to AAI but in this case describes the degree to which studies of a country
attracts other researchers either local or international.
3. Results And Discussion
Article and proceedings paper types of publications accounted for 84% and 14% of the initial search
results. The remaining 2% of documents were classified as reviews, letters, meeting abstracts, editorial
materials, etc. Thus, only articles and proceeding papers were used for the current study as previously
done by Mao et al. (Mao et al., 2015) because these types of documents provide more original research
findings and include more information on authors and their affiliations. 99% of the refined documents
were published in the English language. The other 1% included publications written in major languages
such as Czech (0.308%), Polish (0.220%), Turkish (0.176%), etc. Hence, the search results were further
refined to only include publications written in English as it is the most universal and commonly used
academic language worldwide (Chen et al., 2017). After this further screening, the remaining publications
extracted for the current study were 2,250. The main information about the obtained documents has been
displayed in Table 6.
Table 6
Main description of extracted documents.
Page 15/57Description Results
Main information about data
Timespan 2000:2021
Documents 2250
Journals 429
Average years from publication 5.09
Average citations per documents 19.77
Average citations per year per doc 2.999
References 40834
Document types
Article 1915
Article; proceedings paper 80
Proceedings paper 255
Document contents
Keywords Plus (ID) 2255
Author's Keywords (DE) 3663
Authors/institutions/countries/regions
Authors 4782
Author Appearances 9315
Authors of single-authored documents 83
Authors of multi-authored documents 4699
Authors’ collaboration
Single-authored documents 108
Documents per Author 0.471
Authors per Document 2.13
Co-Authors per Documents 4.14
Collaboration Index 2.19
Institutions 1434
Countries/regions 83
Page 16/573.1 Publications’ evolution over time.
Figure 3 presents the primary performance of alcohol-combusted-related literature published in the 21st
century so far. Results show that interest in the subject has grown significantly in the last decade
compared to the previous decade. The publications between 2011 to 2021 were at least eight times that
of 2000 to 2010. The number of citations, however, followed a different trend as that of the number of
publications. The peak of citations for both local and global was realized in 2016. This observation may
be explained by the fact that the studies during this period have significantly impacted global fuel
combustion research and thus aroused interest from scientists. This explanation is further bolstered by
the peak h-index occurring at the same period. The publications in the slow development period have
relatively the most influence on the subject compared to the initial and rapid developmental stages with
regards to citations and h-index. Interestingly, at the time of reporting these findings, the number of
publications on the combustion of low carbon alcohol in ICEs for 2021 was 53, which is just two
publications short of those produced from 2000 to 2004 combined. Referring to previous studies (Andreo-
Martínez et al., 2020; Zheng et al., 2015), polynomial, linear and exponential regression could be
employed in making future growth estimations of a given dataset. From 2000–2007, 2008–2015, and
2016–2020, the publications could be fitted with a 2nd order polynomial function y=-0.0179x2 + 1.8036x
+ 7.625 (R2 = 0.7899),y = 2.1012x2-30.435x + 144.46(R2 = 0.9903), and y = 0.2143x2 + 16.386x-80.6 (R2 =
0.9996), respectively, where X is the number of years since the start of the period and Y is the number of
publications accumulated each year. The R2 value of the rapid development period is the closest to 1 and
could be used to fairly estimate the number of publications to be expected in the next seven-year period.
By the end of 2021 to 2027, the number of publications on the current subject is expected to increase to
358 to 567, respectively, an increase of 7.5–70.3% relative to 2020’s. These figures signify that more
communication, interest, and co-operation among researchers is expected by the end of the next decade.
3.2 Distribution of output in journals.
In the current research, there were 2,250 publications across 429 related journals; the top 20 productive
journals as well as the h-index, impact factor, and cited times of journals are listed in Table 7. The two
major study themes consistent in the top 20 journals were ‘energy’ and ‘environment’. These 20 journals
constitute approximately 63% of the total number of publications used in the current review. The top 3
most publishing journals were Fuel, Energy, and Energy and Fuels. The top three journals' trend does
remain the same except for Energy and Fuels in terms of h-index. Energy and Fuels lost their spot to
Applied Energy. This observation could be attributed to the influence of the journals in terms of their
citations. Higher number of publications with lower citation reduces the h-index of the journal. For
example, the total citation of Applied Energy, and Energy was 3,985 and 3,538, respectively, compared to
their 111 and 124 publication records. Simultaneously, the trend is entirely different for impact factor. The
top three high-quality research journals were Applied Energy, Energy Conversion and Management, and
Environmental Science and Technology. The dynamics of the top 5 publishing journals in Table 7 with
Page 17/57respect to time is shown in Fig. 4. For the first ten years, the difference in publication output of these five
journals was less spontaneous. However, by the end of 2020, Fuel’s dominance in the subject area
became apparent. In addition, Fuel’s productivity has been on the rise since the start of the century, but
that of the other four journals has stabilized within the last four years.
Co-citation of journals is described in Fig. 5. Two journals are cited in the same publication if a line
known as edge connects the two journals. The bigger the node, the stronger the co-citation of the journal.
From Fig. 2, it can be seen that Fuel is the most frequently co-cited journal per the size of its node (1,776
co-citations), followed by Energy Conversion and Management (1,310 co-citations), and Applied Energy
(1,260 co-citations).
Table 7
Journals’ performance from 2000 to 2021.
Page 18/57Journal NP TC h- Impact PY
index factor start
1. Fuel 417 9909 51 5.578 2006
2. Energy 124 3538 36 6.082 2000
3. Energy & Fuels 121 2359 28 3.421 2005
4. Applied Energy 111 3985 40 8.848 2009
5. Energy Conversion and Management 110 3726 36 8.208 2000
6. Applied Thermal Engineering 77 2262 27 4.725 2007
7. Renewable Energy 61 2008 25 6.274 2003
8. International Journal of Hydrogen Energy 60 2221 22 4.939 2002
9. Combustion and Flame 45 1281 21 4.570 2006
10. Energies 43 177 9 2.702 2016
11. International Journal of Engine Research 37 300 10 2.382 2007
12. Proceedings of The Institution of Mechanical 35 387 10 1.384 2003
Engineers Part D-Journal of Automobile Engineering
13. SAE International Journal of Engines 27 169 7 - 2015
14. Fuel Processing Technology 26 570 13 4.982 2009
15. Proceedings of The Combustion Institute 26 591 14 5.627 2002
16. Environmental Science and Pollution Research 23 308 10 3.056 2017
17. Journal of Engineering for Gas Turbines and Power- 23 454 9 1.804 2003
Transactions of the ASME
18. Journal of Energy Resources Technology-Transactions 22 250 10 3.183 2007
of the ASME
19. Thermal Science 19 104 6 1.574 2011
20. Combustion Science and Technology 17 115 6 1.730 2002
NP, TC, PY represents the number of publications, total citations, and publication year, respectively.
3.3 Funding Agencies
The growth of research often greatly depends on support from funding agencies. These agencies play a
significant role in pushing forward frontiers of scientific research per national, regional, or international
policy on a specific agenda. Table 8 displays the top 10 funding agencies driving the studies of
Page 19/57methanol/ethanol utilization in ICEs. According to Table 8, funding agencies from Asia, Europe, and North
America are the main contributors to research into the current study's subject in the 21st century. For the
first quarter of the study period, no research support from these top funding agencies was given to the
researchers, thus explain the low productivity of publications in that period, as seen in Fig. 3. In the last
two quarters, these agencies made significant research support to research institutions which should
explain the increase in productivity from 2011–2020 of Fig. 3. For funding agencies that have supported
at least ten publications, 1,051 funds have been provided so far, and 70% of these supports are from the
top 10 funding agencies listed in Table 8, signifying their enormous contribution towards clean
combustion. The National Natural Science Foundation of China (NSFC) alone has supported 337
publications which far exceeds the second and third funding agencies, namely, United States Department
of Energy (76) and National Council for Scientific and Technological Development (47). This observation
implies that the NSFC is the major player in the global utilization of low carbon alcohol in ICEs research
as far as funding agencies are concerned.
Table 8
Most funding agencies from 2000–2021.
Funding Agencies Country NSP 2000– 2006– 2011– 2016–
2005 2010 2015 2021
National Natural Science Foundation of China 337 0 10 63 264
China NSFC
United States Department of Energy DOE USA 76 0 2 26 48
National Council for Scientific and Brazil 47 0 2 14 31
Technological Development CNPQ
CAPES Brazil 43 0 0 7 36
Fundamental Research Funds for The China 42 0 0 3 39
Central Universities
China Scholarship Council CHINA 41 0 0 8 33
Engineering Physical Sciences Research UK 38 0 2 19 17
Council EPSRC
UK Research Innovation UKRI UK 37 0 1 18 18
National Science Foundation NSF China 36 0 1 12 23
European Commission - 33 0 0 6 27
NSP refers to the number of supported publications.
Page 20/573.4 Authors’ performance
In this section, the performance of the top 20 authors leading the research in the subject of the current
study is discussed. This group of authors listed in Table 9 constitute 0.42% of the total authors involved
in the current study; however, their publications make up 20.8% of the total publications extracted. Criteria
for assessing these authors' performance were limited to the number of publications, h-index, and total
citations. According to the number of publications, Gong CM, Mamat R, Liu FH, Zhao H, and Lu XC were
the top 5 publishing authors. Ji CW, Wang SF, and Agarwal AK replaced Mamat R, Liu FH, and Lu XC to
complete the top 5 authors according to the h-index. The latter group of authors' losses of spot could be
attributed to their relatively low total global citation scores. Highly cited publications of authors usually
increase the h-index and vice versa. Xu HM and Gong CM are the most TGCS- and TLCS-rated authors in
Table 9, respectively. Liu FH and Qian Y have the most recent publications (2015), whereas Li J has the
oldest publication (2002). In addition, the academic co-authorship amongst influential authors was
analyzed and displayed in Fig. 6. The most partnership existed between Gong CM and Liu FH (28
Collaborations), followed by Qian Y and Lu XC (18 collaborations), and Ji CW and Wang SF (17
collaborations). In Fig. 7, the annual scientific production of these 20 authors is shown. The most active
years of these authors can typically be found in the current study's rapid developmental stage. Gong CM,
Mamat R, Liu FH, Zhao H, and Lu XC had their most publishing year in 2020, 2017, 2020, 2016, and 2019,
respectively. The author with the most different publication and citation years is Huang Z, publishing and
being cited in seventeen different years out of a possible twenty-one.
Table 9
Top 20 performing authors.
Page 21/57Author NP h-index TLCS TGCS PY start
Gong CM 40 18 458 804 2008
Mamat R 29 11 91 413 2014
Liu FH 28 12 251 471 2015
Zhao H 28 13 186 507 2010
Lu XC 27 11 135 486 2005
Agarwal AK 26 13 261 817 2003
Liu JP 26 13 136 438 2013
Yao CD 25 11 192 597 2008
Ji CW 24 17 188 636 2010
Huang Z 23 12 286 473 2005
Xu HM 23 13 294 952 2011
Wang Y 22 10 163 336 2013
Sarathy SM 21 10 85 344 2012
Wang Z 21 11 176 502 2010
Wang SF 19 15 138 503 2010
Qian Y 18 8 68 209 2015
Wang CM 18 7 129 388 2012
Irimescu A 17 10 100 291 2011
Maurya RK 17 11 186 582 2009
Li J 16 10 165 380 2002
NP, TGCS, TLCS, PY represents number of publications, total global citation scores, total local citation scores and publication year,
respectively.
3.5 Institutions’ performance
The 20 most active institutions leading the research of low carbon alcohol combustion in ICEs are listed
in Table 10. Their NP accounts for 33% of the total publications. Tianjin University tops the chart with 91
publications, followed by Jilin University (64 publications) and Tsinghua University (52 publications).
Half of the institutions mentioned in Table 10 are located in mainland China with 58% of the total
publications of the twenty institutions. These figures demonstrate the global dominance of Chinese
Page 22/57universities on the current subject. Other notable institutions outside China were Indian Institutes of
Technology, and University Illinois. Tianjin University maintained its first position in TLCS and TGCS; the
University of Birmingham and Tsinghua University ranked second and third/fourth, respectively for both
TLCS and TGCS. In terms of h-index, Tianjin University, Tsinghua University, and University of
Birmingham ranked first, second, and third, respectively, which could be attributed to their relatively
superior NP, TLCS, and TGCS.
Represented in Fig. 8 is the academic partnership amongst the most productive institutions across the
globe. The most institution collaboration existed between Dalian Minzu University and Jilin University (21
collaborated-publications), followed by Tsinghua University and University of Birmingham (16
collaborated-publications), and Beijing Institute of Technology and University Illinois (16 collaborated-
publications).
Table 10
Performance of top 20 institutions.
Page 23/57Institutions Country NP h-index TLCS TGCS
Tianjin University China 91 27 647 2222
Jilin University China 64 20 384 944
Tsinghua University China 52 22 371 1418
Shanghai Jiao Tong University China 51 15 168 732
Anna University India 46 14 167 969
University of Birmingham UK 41 21 402 1580
Hunan University China 35 17 153 659
Indian Institutes of Technology India 35 20 292 1366
Universiti Malaysia Pahang Malaysia 35 11 94 400
Xi'an Jiaotong University China 34 16 328 972
Consiglio Nazionale delle Ricerche (CNR) Italy 31 14 155 509
National Institute of Technology India 29 14 148 680
Beijing Institute of Technology China 27 13 178 558
University Illinois USA 26 13 263 768
Beijing University of Technology China 25 18 208 669
University of California, Berkeley USA 25 12 131 459
Dalian Minzu University China 24 11 103 400
Lund University Sweden 23 9 38 211
Vellore Institute of Technology (VIT) India 23 13 64 520
Wuhan University of Technology China 23 11 78 293
NP, TGCS, TLCS represents number of publications, total global citation scores and total local citation scores, respectively
.
3.6 Countries’ performance
China, India, and USA have been the three most performing countries/regions on the current study
subject. As seen in Table 11, these three countries have alone contributed to approximately 60% of the
total studies published in this field between 2000–2021. Brazil ranks 7th with 111 publications so far. It
can also be seen China ranks 1st in both single and multiple country publications and also had the most
total citations. The results of the countries’ total citations are consistent with their h-index. The top 3
most cited countries maintained their position with regards to the h-index, which implies that the studies
Page 24/57of the Chinese, Indians, Americans (USA), were highly influential to the studies of other researchers.
According to the attractive index in Fig. 9a, only China’s AAI for four different periods was almost equal or
greater than that of the global average. India’s AAI was less than the global average except during the last
quarter; however, it was the only country whose attractiveness increased with time. The highest AAI was
recorded by USA during the third quarter, whereas the lowest AAI so far has been recorded by Italy,
Malaysia, Iran, and Saudi Arabia in the 2000–2005 period. On average, the most attractive studies
originate from China. On the other hand, as seen in Fig. 9b, the research activity of US (AI) was the
highest, having AI greater than global average except for 2016 to 2021. Though China has the most
publications, its active publication period has only been relatively recent, thus explaining its lower AI
compared to that of US and UK in the earlier periods. The activeness of Malaysia, Iran, and Saudi Arabia
has only been from the start of the third quarter.
The academic partnership amongst the various countries is reported in Fig. 10. The most collaboration
existed between China and USA (79), China and UK (46), and Iran and Malaysia (15).
The dominance of these countries correlates with their biofuel production, government subsidies, and
programs. Brazil is one of the pioneer countries to implement programs for the production of ethanol fuel
from sugarcane. Since 1977, Brazil’s ethanol-use mandate has been mandatory, with a state-legislated
4.5% blend of anhydrous ethanol to gasoline (Barros, 2020). The legislation allows ethanol to be blended
in gasoline within the range of 18-27.5%, and it is currently set at 27%. In addition, the tax for gasoline
rose from R$0.38/liter to R$0.79/liter in 2017. Ethanol’s tax increase was relatively lower than gasoline’s
(from R$0.12 /liteR$0.13/liter, while for ethanol distributors, it increased from zeroR$0.11liter), which
favored ethanol’s competitiveness compared to gasoline (Barros, 2020). About 40% of fuel used in
Brazilian road transport vehicles is ethanol (Anderson, 2009). In the US, an astonishing 16.1 billion
gallons of clean, renewable ethanol was produced in 2018 (RFA, 2019). Between 2017–2018, ethanol
consumption grew by 300 million gallons, driven largely by record exports of over 1.6 billion gallons as
the demand for octane increases globally. Domestic demand was also on course to record levels as
January 2018’s blend rates topped a record 10.75%, despite the existence of the so-called ‘blend wall.’
China's increased productivity in this field of study could be attributed to its growing effort to increase the
biofuel fraction of its current energy mix, as 30% of the total global primary energy demand in the next
two decades will be from Asia, mainly from China and India (IEA, 2010). China ranked 3rd in the 2012
global rankings of ethanol fuel production (Sarathy et al., 2014). The E10 target of China was planned to
follow an incremental expansion through a few selected provinces and cities (Kim, 2018). As of 2017, 11
provinces and cities were enrolled on the mandatory E10 blend as ethanol pilot zones. In the case of
methanol, there are 50 methanol gasoline blending terminal centers either completed or under
construction in 15 Chinese provinces, and there is more than 1.2 million metric tons (or 400 million
gallons) of annual methanol blending capacity (Klein, 2020). Subsidies have been made available to
increase ethanol fuel uptake; advanced cellulosic ethanol production subsidy is currently $0.007 per liter
(600 RMB per ton) (Kim, 2018). The government of India has made plans to provide financial incentives,
including subsidies, grants, tax credits, accelerated depreciation on plant expenditures, differential pricing
vis-à-vis − 1G Ethanol, Viability Gap Funding (VGF of INR 5000 crore, or $735 million), all within 6 years
Page 25/57(Aradhey, 2019). These provisions have boosted ethanol production and consumption in India in recent
years, and efforts are being made to make second-generation ethanol a more attractive fuel than gasoline
and first-generation ethanol. Finally, the European Union adopted the new Renewable Energy Directive for
2021–2030 (RED II). The energy directive seeks to achieve a renewable energy target of at least 32% by
2030, with a 14% target allocated for the transport sector (Bob et al., 2019).
In Fig. 11, the relative trend in the five continents' research output in four different timelines is depicted.
Europe and America’s dominance were apparent in the first quarter. However, from the second to the final
quarter, Asia has been at the forefront of the research on the current subject, with most of its
contributions from China and India. Figure 12 is a geographical representation of past studies on the
combustion of low carbon alcohol in ICE from 2000 to 2021. Despite being the third-largest continent
according to the number of countries, Europe had the most country-diversified publications, followed by
Asia, America, Africa, and Oceania in that order.
Table 11
Research output of countries from 2000 to 2021.
Page 26/57Country NP1 NP2 SCP MCP h-index TC Top 3 collaborations*
China 562 513 407 106 48 9931 USA, UK, Australia
India 425 397 370 27 43 6735 Vietnam, USA, Canada
USA 348 243 182 61 46 6601 Saudi Arabia, Germany, UK
United Kingdom 153 104 59 45 35 2869 Spain, Germany, Thailand
Turkey 131 120 112 8 34 4130 Sweden, Denmark, Netherlands
Brazil 111 102 82 20 17 1051 Spain, UK, France
Italy 75 66 61 5 20 1248 Sweden, Belgium, Canada
Malaysia 75 55 35 20 22 1111 Iran, Australia, Iraq
Iran 65 53 39 14 16 771 Australia, Canada, Indonesia
Saudi Arabia 64 35 24 11 22 699 Egypt, Canada, Ireland
Australia 61 36 18 18 26 853 Iraq, Germany, Spain
Spain 56 36 22 14 16 720 Mexico, Belgium, Colombia
Germany 54 39 31 8 17 737 Netherlands, Sweden, Ireland
France 50 25 17 8 18 685 Spain, Algeria, Belgium
Korea 49 46 34 12 17 776 Japan, Indonesia, Saudi Arabia
Canada 45 32 21 11 16 542 Belgium, Israel, Netherlands
Sweden 38 25 16 9 13 363 Belgium, Denmark, Netherlands
Poland 36 35 33 2 12 538 Hungary, Slovakia
Japan 33 20 19 1 13 294 Egypt, Thailand, Belgium
Greece 23 21 18 3 10 397 Belgium, UAE
NP1, NP2, SCP, MCP, TC, refer to number of publications (overall), number of publications (according to corresponding author’s
country), single country publication, multiple country publication, and total citations, respectively. *collaborations from countries in
column 1 to countries in column 8. Note−United Kingdom consists of records from England, Scotland, Wales, and Northern Ireland.
3.7 Research hotspots and trends
The current subject's research trend is evaluated based on the frequency of keywords from titles,
abstracts, author keywords, and keyword-plus. The most frequent keywords are shown in Fig. 13. It can
be seen that the top 3 keywords (per minimum count) were ethanol (864), combustion (826), and
performance (821). The use of ‘minimum’ is to imply that other root forms of the word had appeared in
relatively lower positions. The top three keywords reveal to the current study that the main research
hotspot of the subject at hand centers around the combustion, performance, and emission characteristics
Page 27/57You can also read