Open Research Online - The Open University
←
→
Page content transcription
If your browser does not render page correctly, please read the page content below
Open Research Online
The Open University’s repository of research publications
and other research outputs

Geochemical variation in the Stimson formation of
Gale crater: Provenance, mineral sorting, and a
comparison with modern Martian dunes
Journal Item
 How to cite:
 Bedford, C. C.; Schwenzer, S.; Bridges, J. C.; Banham, S.; Wiens, R. C.; Gasnault, O.; Rampe, E. B.; Frydenvang, J.
 and Gasda, P. J. (2020). Geochemical variation in the Stimson formation of Gale crater: Provenance, mineral sorting,
 and a comparison with modern Martian dunes. Icarus, 341, article no. 113622.

For guidance on citations see FAQs.

c 2020 The Authors

Version: Version of Record

Link(s) to article on publisher’s website:
http://dx.doi.org/doi:10.1016/j.icarus.2020.113622

Copyright and Moral Rights for the articles on this site are retained by the individual authors and/or other copyright
owners. For more information on Open Research Online’s data policy on reuse of materials please consult the policies
page.

                                      oro.open.ac.uk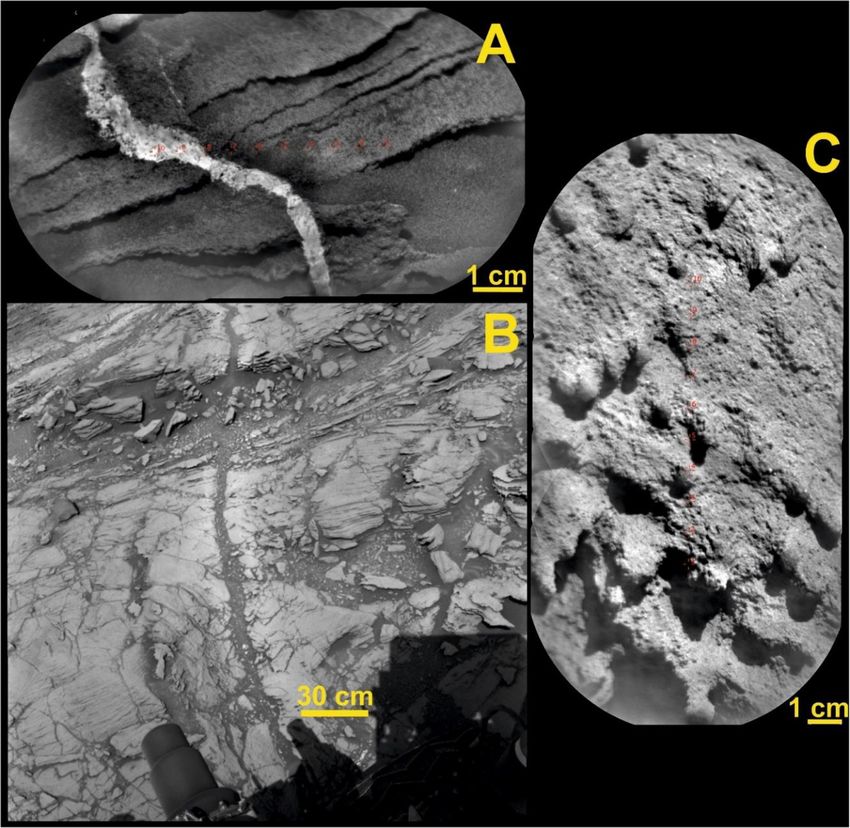
Icarus 341 (2020) 113622
Contents lists available at ScienceDirect
Icarus
journal homepage: www.elsevier.com/locate/icarus
Geochemical variation in the Stimson formation of Gale crater: Provenance,
mineral sorting, and a comparison with modern Martian dunes
C.C. Bedford a, b, *, S.P. Schwenzer c, J.C. Bridges d, S. Banham e, R.C. Wiens f, O. Gasnault g, E.
B. Rampe b, J. Frydenvang h, P.J. Gasda f
a
Lunar and Planetary Institute, Universities Space Research Association, 3600 Bay Area Blvd., Houston, TX, USA
b
Astromaterials and Exploration Science, NASA Johnson Space Center, Houston, TX, USA
c
School of Environment, Earth and Ecosystem Sciences, The Open University, Walton Hall, Milton Keynes, MK7 6AA, UK
d
Space Research Centre, School of Physics and Astronomy, University of Leicester, Leicester LE1 7RH, UK
e
Imperial College London, London, UK
f
Los Alamos National Laboratory, Los Alamos, NM, USA
g
Institut de Recherche en Astrophysique et Plan�etologie, Universit�e de Toulouse, CNRS, CNES, France
h
Natural History Museum of Denmark, University of Copenhagen, Copenhagen, Denmark
A B S T R A C T
The Mars Science Laboratory Curiosity rover has encountered both ancient lithified and modern active aeolian dune deposits within Gale crater, providing an op
portunity to study how aeolian processes have changed during Gale crater’s geological history. This study uses data from the Chemistry and Camera (ChemCam) and
Chemistry and Mineralogy (CheMin) instrument suites onboard Curiosity to; (1) constrain the diagenetic processes that lithified and altered the ancient aeolian
Stimson formation, (2) investigate whether the geochemical signature in the Stimson formation is consistent with the aeolian mafic-felsic mineral sorting trend
identified in the modern Bagnold dune fields in Gale crater, and (3) discuss the provenance of the Stimson sediments, comparing it to those identified in the modern
dune and ancient river and lake deposits also analyzed along Curiosity’s traverse.
The ancient Stimson dune deposits that stratigraphically overlie the Gale fluvio-lacustrine units were analyzed in two locations; the Emerson and the Naukluft
plateaus. ChemCam data show that the Stimson formation has subtle variations in MgO, Al2O3, Na2O, and K2O between the two localities. An agglomerative cluster
analysis of the constrained Stimson dataset reveals five clusters, four of which relate to different proportions of mafic and felsic minerals analyzed by ChemCam. In
general, the cluster analysis shows that the Emerson plateau has a greater proportion of mafic minerals and fewer coarse, felsic grains relative to the Naukluft plateau.
This variation in mafic and felsic minerals between localities suggests a southwest to northeast net sediment transport direction due to aeolian mineral sorting
dynamics preferentially transporting mafic minerals that are easier to saltate than the elongate, often coarser, felsic minerals. This derived transport direction for the
Stimson formation supports that determined by sedimentological evidence and is opposite to that previously determined for the active Bagnold dunes inferring a
change in the wind regime with time. An opposite sediment transport direction between the ancient and modern dunes in Gale crater further supports geochemical
and mineralogical evidence that suggests different basaltic source regions. Compositionally, the bulk Stimson formation is most similar to the subalkaline basalt
source region that is inferred to be the dominant sediment source of the fluvio-lacustrine Bradbury group. This is likely the result of the Stimson formation and
basaltic Bradbury group sediments sharing a similar local basaltic source region such as the rim and walls of Gale crater.
1. Introduction 2012; Milliken et al., 2010; Thomson et al., 2011; Wray, 2013). This
unconformity has been identified in several layered mound deposits
Gale crater was chosen as the site for the NASA Mars Science Labo situated in craters at other locations on Mars (Ehlmann and Buz, 2015;
ratory (MSL) Curiosity rover due to Aeolis Mons: the ~5 km tall, layered, Malin et al., 2000; Thomson et al., 2011) and may be a result of the
central mound informally named Mt. Sharp. Orbital remote sensing in change from warm and wet conditions to the cold and dry global envi
struments have detected secondary minerals in the lower units and ronment seen today (Fraeman et al., 2016; Grotzinger et al., 2012;
anhydrous mineral assemblages within large-scale cross-bedding in the Milliken et al., 2010; Thomson et al., 2011; Wray, 2013). Our study
upper units (Deit et al., 2013; Fraeman et al., 2013; Grotzinger et al., investigates the geochemistry of a preserved aeolian unit called the
* Correspondence to: C. C. Bedford, Lunar and Planetary Institute, Universities Space Research Association, 3600 Bay Area Blvd., Houston, TX, USA.
E-mail addresses: candice.c.bedford@nasa.gov (C.C. Bedford), susanne.schwenzer@open.ac.uk (S.P. Schwenzer), j.bridges@leicester.ac.uk (J.C. Bridges), s.
banham@imperial.ac.uk (S. Banham), rwiens@lanl.gov (R.C. Wiens), olivier.gasnault@irap.omp.eu (O. Gasnault), elizabeth.b.rampe@nasa.gov (E.B. Rampe),
jfrydenvang@snm.ku.dk (J. Frydenvang), gasda@lanl.gov (P.J. Gasda).
https://doi.org/10.1016/j.icarus.2020.113622
Received 1 November 2019; Received in revised form 18 December 2019; Accepted 4 January 2020
Available online 15 January 2020
0019-1035/© 2020 The Authors. Published by Elsevier Inc. This is an open access article under the CC BY license (http://creativecommons.org/licenses/by/4.0/).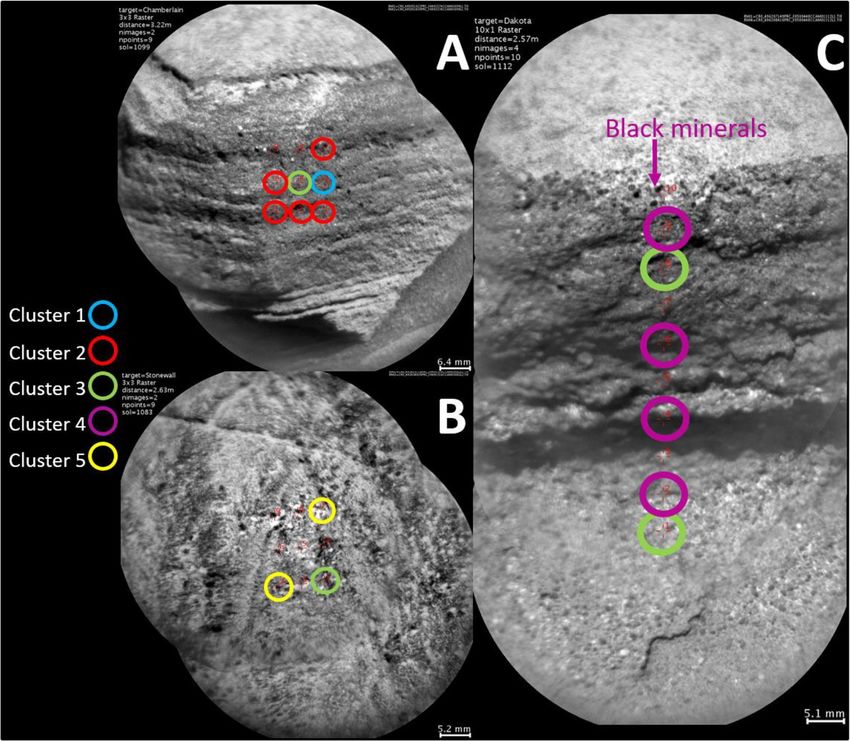
C.C. Bedford et al. Icarus 341 (2020) 113622
Stimson formation (Figs. 1A, B & 2) that was deposited after a prolonged size and rounder shape make them easier to saltate in comparison to the
period of aeolian deflation, which likely represents the end of a rela elongate feldspar grains (e.g., Baratoux et al., 2011; Mangold et al.,
tively warm and wet period in Gale crater (Banham et al., 2018; Frae 2011). Therefore, the further a basaltic dune deposit is from its source,
man et al., 2016). By investigating the geochemistry of this unit and the more enriched in mafic grains it will become relative to felsic grains
comparing it to the other ancient and modern sedimentary deposits in (Baratoux et al., 2011; Mangold et al., 2011). A mafic-felsic mineral
Gale crater, we aim to constrain sedimentary processes and provenance sorting regime has also been identified in wind-blown soil deposits and
throughout Gale’s geological history, particularly those that relate to basaltic dunes on Mars using orbital and rover data (Cousin et al., 2015;
aeolian processes which have dominated the Martian surface for several Lapotre et al., 2017; Meslin et al., 2013; O’Connell-Cooper et al., 2018;
billion years (Carr, 2007; Craddock, 2012). Rampe et al., 2018; Stockstill-Cahill et al., 2008). Similar to the terres
Studies of aeolian dunes derived from basaltic source rocks on the trial wind-blown deposits, the soil deposits of Gale crater contain a
Earth have demonstrated that major element chemistry can give infor greater abundance of felsic minerals in the coarse size fraction (Cousin
mation on mineral sorting processes, which in turn approximates the net et al., 2015; Meslin et al., 2013). The active Bagnold dunes in Gale crater
resultant wind direction at the time of deposition (Baratoux et al., 2011; (Fig. 1B) also contain felsic minerals as the coarsest grains (Cousin et al.,
Mangold et al., 2011; Mountney and Russell, 2004; Rubin and Hunter, 2017), but show an overall greater abundance of olivine compared to
1987; Swanson et al., 2016). Dunes derived from basaltic sediments feldspar in the coarser grain size fraction (>250 μm), and a lower
typically demonstrate enhanced transport of mafic minerals (olivine and abundance of volatiles compared to the inactive, dust-covered soils
pyroxene) over felsic minerals (feldspar) as their generally finer grain analyzed along the traverse (Cousin et al., 2017, 2015; O’Connell-
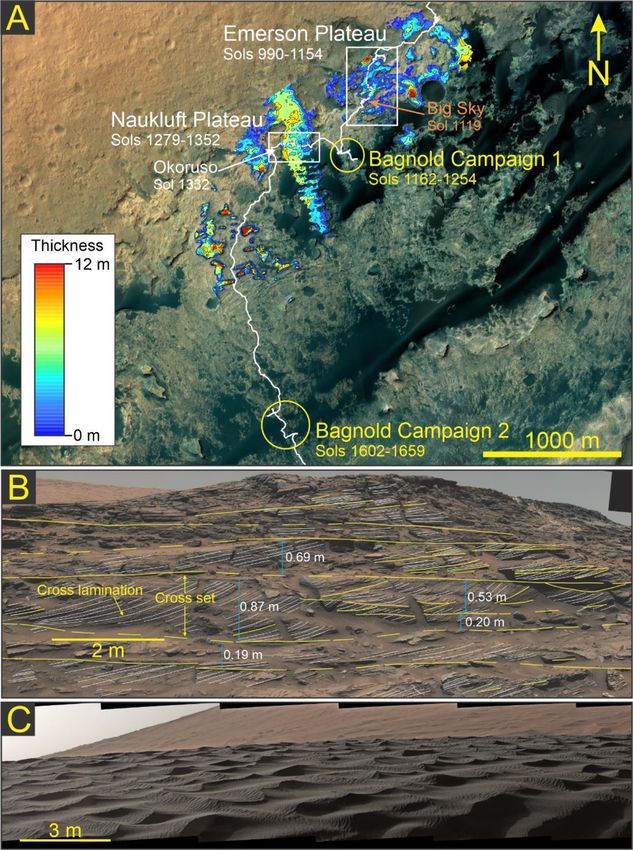
Fig. 1. Context images for the Stimson forma
tion sandstone. A) An isopach map of the
Stimson formation, white line shows the rover
traverse and triangles indicate waypoints. The
locations of drilled, unaltered Stimson samples
and the Bagnold dune campaigns are also
shown. To calculate the preserved thickness
(isopach), the unconformity was mapped where
it intersected the ground-surface using satellite
images and Digital Elevation Models (Watkins
et al., 2016). An interpolated surface was
generated based on the vertical position of the
unconformity (nearest neighbour) to create a
depth map. This depth map was subtracted from
the present-day land surface, to give a thickness
map of the remnant Stimson. Where the thick
ness of Stimson was 0 or less is where the
Stimson has been totally removed by erosion,
and these areas were deleted. B) Annotated
Mast camera (Mastcam) image of the lithified
Stimson formation at Williams Peak in the
Emerson Plateau (mcam04777, sol 1099). An
notations show the cross laminations and cross
set thicknesses present within the lithified de
posit (Banham et al., 2018), and C) Mastcam
mosaic of the modern Bagnold dune deposits
(mcam05410, sol 1192).
2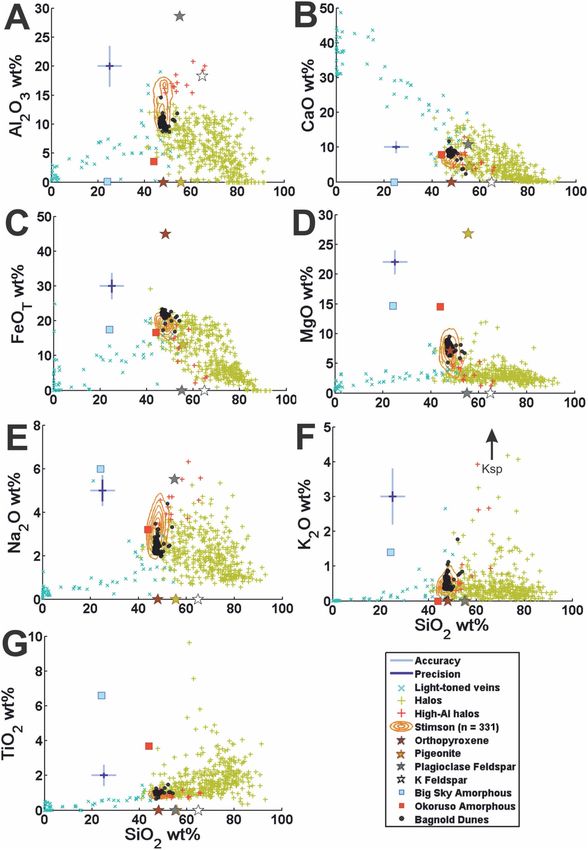
C.C. Bedford et al. Icarus 341 (2020) 113622 Fig. 2. A stratigraphic log from Edgar et al., 2020 showing an overview of the Sedimentology and Stratigraphy observed by the Mars Science Laboratory Curiosity Rover according to elevation (m). This stratigraphic log illustrates the stratigraphic relationships of the Gale crater geological units traversed by the Curiosity rover from the Bradbury landing site to the Vera Rubin Ridge. Cooper et al., 2018; Pan and Rogers, 2017; Rampe et al., 2018). This mineral sorting regime described previously and identified on the Earth. difference in olivine abundance between the modern Martian dunes and One aim of this study is to determine the mineral sorting regime of soils has several possible explanations; a result of the coarser fraction the ancient Stimson sediments using a cluster analysis of the Laser- experiencing less alteration than the Aeolis Palus soils (Cousin et al., Induced Breakdown Spectroscopy (LIBS) measurements of the Chemis 2017; O’Connell-Cooper et al., 2018), a greater maturity of mineral try and Camera (ChemCam) instrument suite; and to compare these sorting for the dunes (Cousin et al., 2017; Lapotre et al., 2017), or a results to the mineral sorting dynamics of the modern Bagnold dunes. An greater abundance of olivine-rich sediment source rocks (O’Connell- advantage to the small sampling size (
C.C. Bedford et al. Icarus 341 (2020) 113622
coarser grained targets (Cousin et al., 2017; Rivera-Herna �ndez et al., coevally within the same wider fluvio-lacustrine system, as the groups
2019). This is in contrast to the Alpha Particle X-Ray Spectrometer are interpreted to interfinger at their contact (Grotzinger et al., 2015).
(APXS) geochemical instrument on-board Curiosity whose analyses are The majority of the Mt. Sharp group traversed by Curiosity is strati
more representative of bulk geochemistry due to the larger size (17 mm graphically younger than the Bradbury group as these outcrops are
diameter) of the sampling area (Gellert and Clark, 2015; Siebach et al., observed at higher elevations, and the strata across the north of Aeolis
2017a). Previous studies have shown that geochemical variations in the Mons are near-horizontal (Grotzinger et al., 2015). Although the Mt.
ChemCam dataset for Gale crater’s lithified and unlithified sediment Sharp group is also largely basaltic in geochemistry, the bulk composi
deposits are associated with mafic and felsic minerals (Bedford et al., tion of the Mt. Sharp group mudstone is distinct from that of the Brad
2019; Cousin et al., 2017; Deit et al., 2016; Mangold et al., 2016; Meslin bury group mudstone, having a more silica-rich basalt as the dominant
et al., 2013) which makes it a promising dataset for identifying mineral source (Bedford et al., 2019). Additionally, the detection of tridymite in
sorting in the ancient Stimson formation. We use a multivariate cluster the highly (>60 wt%) silica-rich locality of Marias Pass suggests that the
analysis to group over 330 ChemCam LIBS geochemical data points sediment in this area could have been derived from an evolved, silicic
according to their relative compositional similarity, which, in the case of igneous source (Czarnecki et al., 2018; Morris et al., 2016).
the LIBS data, will isolate groups that likely reflect the different pro The Mt. Sharp group is unconformably overlain by the Siccar Point
portions of minerals in the sediments provided analyses of alteration group (Fig. 2), which is a draping unit deposited on a deflation surface
features (i.e., mineral veins) have been removed (Cousin et al., 2015; (Banham et al., 2018; Fraeman et al., 2016; Kite et al., 2013; Watkins
Gasnault et al., 2013; Meslin et al., 2013). Comparing the proportion of et al., 2016). At present, the Stimson formation is the only unit within
different clusters between the two Stimson localities – the Emerson the Siccar Point group encountered so far by the rover, however the
plateau and Naukluft plateau (Fig. 1A) – should therefore constrain the Greenheugh pediment is observed to overlay the Murray formation at
effect of mineral sorting between these two sites in the Stimson dune higher elevations of the flank of Aeolis Mons, and is interpreted to lay on
field. the same unconformity dividing the Siccar Point and Mt. Sharp groups
Basaltic dune studies also show that bulk geochemical variation can (Bryk et al., 2019). The unconformity on which the Stimson formation
be a result of changes in dominant sediment provenance with time on accumulated represents an undulating palaeo surface. Watkins et al.
Earth and Mars (Achilles et al., 2017; Baratoux et al., 2011; Lapotre (2016) mapped this unconformity and demonstrated that the surface
et al., 2017; Mangold et al., 2011; Mountney and Russell, 2004; rises ~140 m in elevation towards the south over a distance of 2 km.
O’Connell-Cooper et al., 2018; Pan and Rogers, 2017; Rampe et al., Curiosity investigated the sedimentology, chemistry and mineralogy
2018). We therefore also use a density contour analysis of ChemCam of the Stimson formation between Sols 987–1455 (Fig. 1), which was
LIBS data to compare the Stimson formation bulk geochemistry to that of interpreted to represent the preserved remnants of an ancient aeolian
the modern dunes and ancient fluvio-lacustrine deposits in Gale crater in dune field (Banham et al., 2018). Sand grains observed using the MAHLI
order to identify changes in dominant source regions throughout instrument have a high roundness and sphericity, and bimodal grain size
geological time. distribution (major modal peak of 250 μm and minor modal peak ~850
μm), which indicates that the grains were transported by saltation and
1.1. Geological context of the Stimson formation surface creep by the wind (Bagnold, 1937; Kok et al., 2012; Sharp,
1963). Cross sets, measured up to 1 m in thickness across the Emerson
The stratigraphy of Gale crater is composed of sedimentary rocks plateau (Fig. 1.B) represent the migration of aeolian dunes up to 15 m
deposited in an ancient river-lake system that likely existed between 3.8 high (Banham et al., 2018). The lack of phyllosilicates (Yen et al., 2017)
and 3.1 Ga ago (Deit et al., 2013; Grotzinger et al., 2015, 2014; Stack fine-grained interdune deposits or fluvial facies deposits (i.e., laminated
et al., 2019), with minor aeolian units, or units of unknown affinity, mudstones or conglomerate beds), indicate that the system accumulated
unconformably draping the older lake deposits (Banham et al., 2018; by dry aeolian processes, in an arid environment (Banham et al., 2018).
Bryk et al., 2019). Stratigraphy within Gale crater is divided into three The inclined unconformity formed by deflation and the slope-
distinct groups based on their lateral extent, separation by major dis draping nature of the dry-aeolian system suggests the Stimson forma
continuities, and depositional origins into the Bradbury, Mt. Sharp, and tion accumulated after a protracted period of aridity. A substantial
Siccar Point groups (Fig. 2). period of time would have passed for the climate to shift from humid
The Bradbury group is characterized predominantly by fluvial, conditions which supported the fluvio-lacustrine system that deposited
fluvio-deltaic, and lacustrine deposits (Grotzinger et al., 2015, 2014; the Bradbury and Mt. Sharp groups, to the arid environment which
Stack et al., 2019; Vasavada et al., 2014; Williams et al., 2013). Brad supported deposition of the Stimson formation (Watkins et al., 2016;
bury is the lowest stratigraphic group analyzed by Curiosity and contains Banham et al., 2018). As such, the Stimson formation is one of the
sediments likely derived from a tholeiite-dominated source (Bedford youngest, in situ, lithified units investigated by Curiosity to date (Ban
et al., 2019; Edwards et al., 2017), but with certain parts of the suc ham et al., 2018).
cession (i.e., the Kimberley formation) also containing sediments The presence of Mg-rich ridges (L�eveill�e et al., 2014), calcium-sulfate
sourced from more alkaline provenances (Bedford et al., 2019; Deit mineral veins (Nachon et al., 2014; Rapin et al., 2016) and fracture-
et al., 2016; Siebach et al., 2017a; Treiman et al., 2016). It is likely that associated alteration halos (Frydenvang et al., 2017; Yen et al., 2017)
the main tholeiite source region of the Bradbury group sediments was show a long history of groundwater activity in Gale crater (Bridges et al.,
also plagioclase-phyric, which resulted in the coarser plagioclase min 2015; McLennan et al., 2014). The lithification of the Stimson formation
erals being segregated from the finer mafic component during trans and the presence of post-depositional aqueous alteration features such as
portation in the ancient fluvio-lacustrine system (Siebach et al., 2017a). calcium-sulfate veins and cement, fracture associated halos and con
Curiosity’s investigation of the Bradbury group began once it landed in cretions within the Stimson formation (Fig. 3) suggests that even after
Gale crater in 2012 and ended on sol 753 of the mission when it entered the surface became arid, sufficient groundwater was present within the
the Pahrump Hills locality that marked the first strata encountered by subsurface post-deposition to allow diagenesis to take place (Banham
Curiosity within the Mt. Sharp group (Grotzinger et al., 2015). et al., 2018; Chan et al., 2012; Frydenvang et al., 2017; Potter-McIntyre
The Mt. Sharp group is dominated by finely-laminated mudstone et al., 2014; Potter et al., 2011; Yen et al., 2017). Based on the compa
deposited in shallow and deep lake waters (Fedo et al., 2018; Hurowitz rable geochemistry to the surrounding bedrock, concretions found in
et al., 2017), where sediments were transported to the lake margin by Stimson rocks are hypothesized to have formed in closed-system con
fluvial processes, before being redistributed within the deeper sections ditions (Banham et al., 2018; Siebach et al., 2017a), meanwhile, the
of the lake by plunging hyperpycnal flows (Stack et al., 2019). The veins and halos have a unique chemistry indicative of open-system
Bradbury and Mt. Sharp groups are hypothesized to have accumulated aqueous alteration (Hausrath et al., 2018; Yen et al., 2017).
4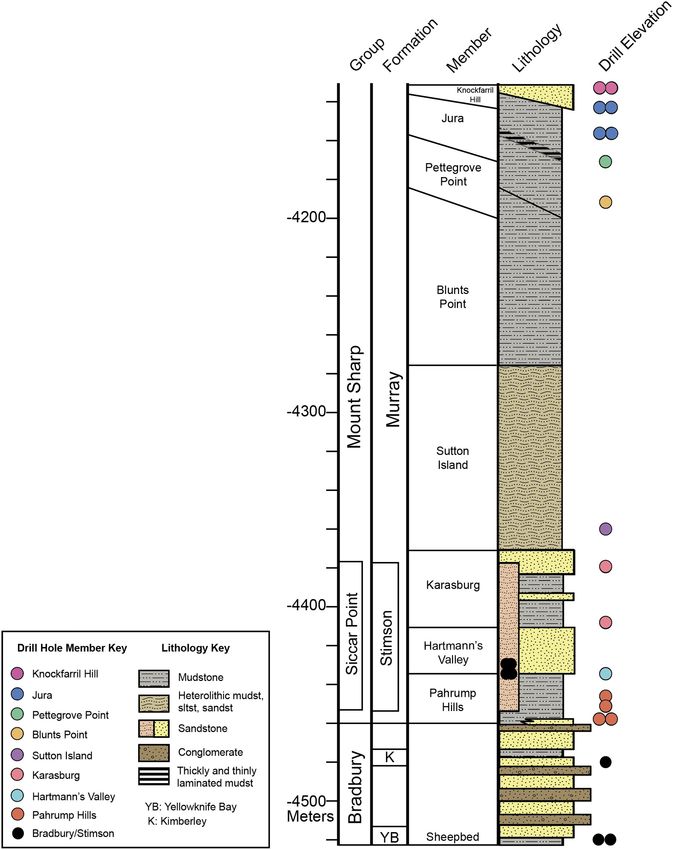
C.C. Bedford et al. Icarus 341 (2020) 113622
Fig. 3. ChemCam Remote Micro-Imager (RMI) and Navcam images of alteration features in the Stimson sandstone. A) shows an RMI mosaic of the O’Brien’s Creek
ChemCam target (sol 1090) that sampled a calcium-sulfate vein, B) is a Navcam image (ncam00354, sol 1094) of an alteration halo and C) is the RMI mosaic of
ChemCam target Katwitwi (sol 1305) showing concretions that are common within Stimson, especially at the Naukluft Plateau.
1.2. Description of Stimson localities (Fig. 1B). The cross sets are formed of cross laminations that are uniform
in thickness along their length from the upper to lower bounding surface
The Stimson formation has a total outcrop coverage of 20 km2 and have an average measured thickness of 4 mm (Banham et al., 2018).
(Kronyak et al., 2019), which outcrops in 3 main geographically distinct Where outcrop permits, bounding surfaces can be traced for a distance of
areas on the traverse: Emerson plateau, Naukluft plateau, and Murray ~30 m, are largely sub-horizontal and can undulate by a few decimeters
Buttes. The ChemCam instrument was used to analyze the Stimson in along their length. These bounding surfaces, which define the upper and
two of these areas (Fig. 1A): the Emerson plateau (sols 990–1154) which lower surfaces of the cross sets are interpreted to be interdune surfaces
covers the Marias Pass and Bridger Basin localities, and the Naukluft formed by the scour pit that preceded the dune as it advanced (Banham
plateau (sols 1279–1352). Analysis at the Murray Buttes area was not et al., 2018; Kocurek, 1991). At a few locations, such as Marias Pass,
possible as the outcrop was inaccessible and was situated beyond the concretions measured to between 20 and 40 mm in diameter can be
useful range of the LIBS instrument. As a result, this study focuses solely observed overprinting the sedimentary texture, however, these concre
on geochemical and mineralogical data collected at the Emerson and tions are not ubiquitous (Banham et al., 2018).
Naukluft plateaus.
1.2.2. The Naukluft Plateau
1.2.1. The Emerson Plateau The Stimson formation at Naukluft is exposed on a plateau ¼ km
The Stimson formation at the Emerson plateau area is characterized wide, measured east to west (Fig. 1A). The total thickness of the Stimson
by outcrops of blocky, dark grey sandstones up to ~7 m tall which un formation here ranges between ~0.5–10 m, based on the interpolation
conformably overlies the smooth, tan-colored outcrop of the Mt. Sharp of the base of the unconformity (Watkins et al., 2016; Fig. 1A). In this
group (for a detailed description of this locality, see Banham et al., area, the Stimson is characterized by an outcrop composed of trough-
2018). Here, the Stimson formation is composed predominantly of cross bedded sandstones, similar to those exposed in the Emerson
simple cross sets, which are typically between 0.3 and 1.0 m thick area. Measurement of set thickness here is difficult due to the lack of
5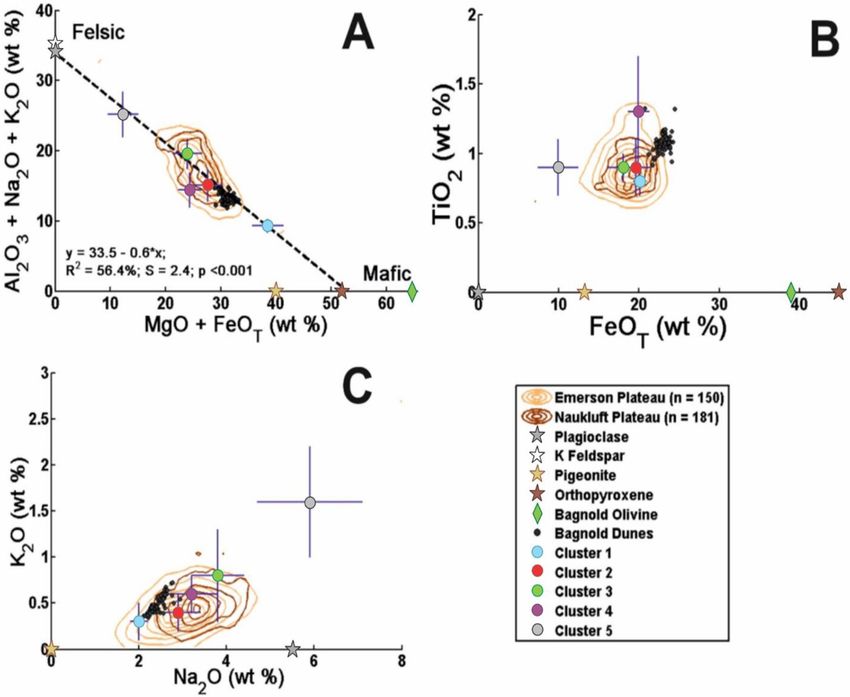
C.C. Bedford et al. Icarus 341 (2020) 113622
vertical exposure across the plateau. In this area, there is a prevalence of observations in a raster pattern on each target (Maurice et al., 2016).
concretions (Fig. 3C) with diameters of up to a few 10 s mm. The However, individual observation points rather than averages of entire
occurrence of these concretions can range from sporadically distributed raster patterns are used here to evaluate data that is more representative
within a single cross set, through to completely overprinting the sedi of the different mineral grains and sandstone cement present in the rock.
mentary facies, all but masking evidence of crossbedding. Both from the ChemCam uncertainty has been presented as accuracy and precision
surface and orbital images, polygonal fractures with widths on average (Wiens et al., 2012) and shown in Supplementary information
7.5 m (Kronyak et al., 2019), similar to the fracture-halos observed in (Table A.1). Accuracy is determined by the root mean square error
the Emerson plateau can be identified. At both localities these halos product of prediction (RMSEP) for representative geological samples
(Fig. 3.B) showed clear chemical and mineral alteration with high SiO2 that share abundance ranges similar to those in the calibration regres
> 80 wt% (Frydenvang et al., 2017), low crystalline mineral abun sion models (Clegg et al., 2017). ChemCam instrument precision is the
dances < 35 wt%, and a notable amorphous component > 65 wt% equivalent of the ‘error’ (precision) presented with APXS results, and is
(Morrison et al., 2018b; Yen et al., 2017). calculated as the variation observed across the 25 shots that make up the
average spectrum for each observation point (Blaney et al., 2014), or
1.3. The Bagnold dunes as a modern analogue across targets from a uniform unit (Mangold et al., 2016).
Gale crater contains several modern active aeolian dune fields, which 2.2. ChemCam target classification and methods to minimize the
occupy the crater moat surrounding Mt. Sharp (Hobbs et al., 2010). The geochemical effects of alteration in the bulk rock dataset
Bagnold dune field (Fig. 1A & C), the only dune field to fall within the
MSL landing ellipse, has been the subject of two science campaigns ChemCam observation points have been grouped into bulk rock,
during the traverse (Bridges and Ehlmann, 2018; Lapotre and Rampe, secondary diagenetic features, unconsolidated sediments, and float
2018). The first campaign analyzed two barchan dunes, informally datasets based on targets imaged by RMI and the other scientific cam
named Namib dune and High dune between sols 1162–1254 (Bridges eras on-board Curiosity: Mast camera (Mastcam) and the Mars Hand Lens
and Ehlmann, 2018). During this campaign, CheMin analyzed a scooped Imager (MAHLI) (Edgett et al., 2012; Malin et al., 2017). Mastcam
sample named “Gobabeb” on the stoss slope of Namib dune (Achilles comprises two, fixed-focal length, multispectral, colour CCD imagers
et al., 2017). The second campaign analyzed linear dunes at the Nathan (Malin et al., 2017). These cameras are situated on Curiosity’s mast 24.2
Bridges dune and Mount Desert Island ripple field between sols cm apart and are positioned ~2 m from the surface (Malin et al., 2017).
1602–1659 (Lapotre and Rampe, 2018) with the scooped sample named The left Mastcam (M-34) has a focal length of 34 mm, with a field of
“Ogunquit Beach” taken from a ripple trough at Mount Desert Island view (FOV) of 20� x 15� , and a pixel scale of 0.22 mrad/pixel, while the
(Rampe et al., 2018). CheMin analyses indicate these dunes largely right Mastcam (M-100) has a 100 mm focal length, a FOV of 6.8� � 5.1� ,
contain basaltic minerals such as olivine, plagioclase feldspar and py and a 0.074 mrad/pixel scale of sampling (Malin et al., 2017). Data from
roxene (Achilles et al., 2017; Rampe et al., 2018) and show evidence that this instrument suite were used to analyze geological targets at the scale
they have scavenged local material from underlying bedrock such as of the outcrop. Images taken by MAHLI of ChemCam targets are used in
anhydrite, hematite or a silica-rich amorphous component (Achilles this study to support those from the ChemCam RMI. MAHLI is situated
et al., 2017; Rampe et al., 2018). A ChemCam study in the first dune on the turret at the end of the Curiosity rover’s arm, and uses a 2-mega
campaign and Dynamic Albedo of Neutron (DAN) instrument mea pixel colour CCD camera to analyze the textures, structures and mor
surements for both dune campaigns also show that the dunes are phologies present at Curiosity’s field site at the finest grain size possible
dehydrated relative to the surrounding bedrock and soils, suggesting 0.0042 mm (silt) for Curiosity’s cameras (Edgett et al., 2012; Mangold
that the more hydrated, fine-grained portion (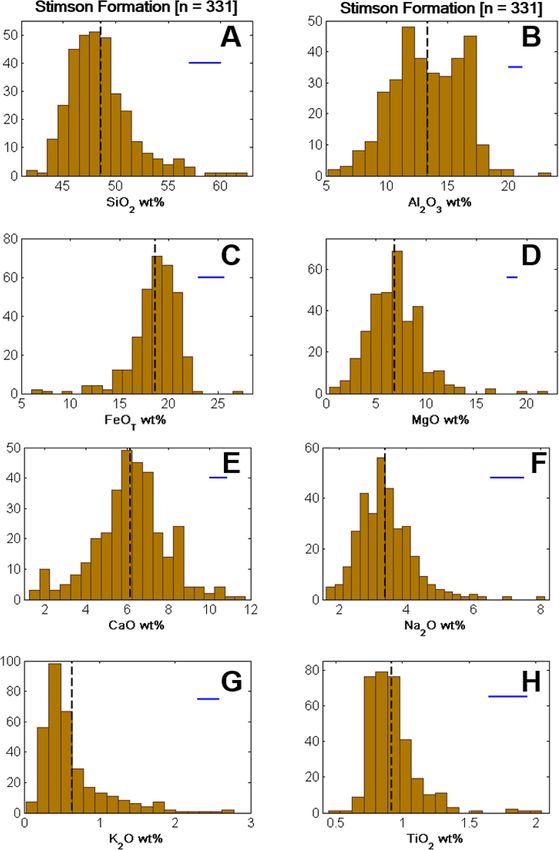
C.C. Bedford et al. Icarus 341 (2020) 113622
points on float have also been removed from the main bulk rock dataset and Drew, 2011). The similarity or correlation of each Cluster is pre
as their stratigraphic position cannot be fully determined. sented in the dendrogram as a similarity level, where higher similarity
Sediments affected by extensive alteration largely become enriched levels represent stronger correlations between Clusters (Schuenemeyer
in volatile elements (S, Cl, H) that are not normally quantified in the and Drew, 2011). The similarity level is also used to identify the number
standard ChemCam dataset. Hence, any observation point that has tar of Clusters in the dataset. In this study, if there is an abrupt change in
geted open-system alteration features usually shows a depletion in the similarity or distance values between steps (i.e., the difference in simi
non-normalized total sum of oxides. For this reason, observation points larity is >5.00 where previously it was 4 m from the rover, scooped samples (Blake et al., 2012; Morrison et al., 2018b). These
therefore we also excluded 8 targets that were taken beyond this dis diffraction patterns are used alongside data from the Sample Analysis at
tance to avoid its effect on the results. The constrained bulk rock dataset Mars (SAM) and APXS instruments to identify the mineral, clay and
used in this study is provided in the Supplementary materials, Appendix amorphous components of the sample, their relative abundances, as well
C. as the unit-cell parameters of major crystalline phases (Bish et al., 2014;
Morrison et al., 2018a). By May 2019, CheMin had analyzed 3 scooped
2.3. Statistical approach samples of unconsolidated aeolian sands, as well as 17 drilled samples of
mudstones and sandstones spanning all three stratigraphic groups
In total, 331 observation points constitute the constrained Stimson (Achilles et al., 2017; Bish et al., 2013; Bristow et al., 2018; Morris et al.,
bulk rock dataset; 150 within the Emerson plateau and 181 for the 2016; Rampe et al., 2017; Treiman et al., 2016; Vaniman et al., 2014).
Naukluft plateau (See Table C.1 in the Supplementary material for the CheMin-derived mineral abundances of these samples enable the
observation points used in the study). The ChemCam LIBS laser has a geochemical compositions acquired by ChemCam to be placed in
relatively small footprint (350–750 μm for distances of 3–7 m from the mineralogical context. Mineralogical information discussed in this study
rover mast; Maurice et al., 2012), so target analyses are often not is acquired from the relatively unaltered Stimson bedrock drill samples
representative of whole rock compositions, particularly if the target is Big Sky (drilled on sol 1119) and Okoruso (drilled on sol 1332; Morrison
coarse-grained (grain diameter > 1 mm) as individual mineral grains are et al., 2018b; Yen et al., 2017) in addition to the Gobabeb (sol 1224) and
more likely to be analyzed (Cousin et al., 2017). Due to the large number Ogunquit Beach (sol 1832) scooped samples from the Bagnold dune field
of observation points acquired by ChemCam, a statistical approach is campaigns 1 and 2 respectively (Fig. 1.A; Achilles et al., 2017; Rampe
implemented to identify the geochemical trends and bulk compositions et al., 2018).
for the stratigraphic units. The statistical methods applied here include a
simple univariate description of the data in the form of basic statistics (i. 3. Results
e., mean, mode, range), followed by the estimation of bulk composition
with multivariate density contour plots. Density contour plots display 3.1. Bulk geochemistry and alteration trends of the Stimson formation
the data population across two variables as isolines (contours) repre
sentative of the density of smoothed data within each pixel defined by Overall, the Stimson formation has a basaltic geochemical compo
the bin size (Bedford et al., 2019; Eilers and Goeman, 2004). Data sition with minimal difference between the mean and median compo
densities are smoothed according to Eilers and Goeman (2004) and sitions and reasonable standard deviations from these means (Table 1
contours are generated using MATLAB (2003). This method has proven and Fig. 4). Major element oxides largely demonstrate an approximately
useful to illustrate the compositional foci and geochemical trends across normal distribution about their peak compositions of 48.0 wt% SiO2,
each of the fluvio-lacustrine stratigraphic groups and igneous rocks 0.8 wt% TiO2, 18.8 wt% FeOT, 6.0 wt% CaO, and 0.4 wt% K2O (Fig. 4).
within Gale crater (Bedford et al., 2019; Edwards et al., 2017). A density Although, the distribution in FeOT shows a slightly heavy tail towards
contour analysis also has the additional benefit of effectively simulating low compositions (Fig. 4C), and the distributions in SiO2, TiO2 and K2O
bulk rock compositions of the Emerson plateau and Naukluft plateau are slightly skewed towards higher values (Fig. 4A, G & F). Al2O3 has a
localities. clear bimodal distribution with peaks at 11.8 wt% and 16.9 wt% and,
Following the density contour analysis, subgroups relating to min despite the bimodality, the mean and median compositions are
eral proportions within the Stimson formation are calculated using an approximately equal (Table 1). MgO and Na2O also have slightly
agglomerative cluster algorithm with Minitab 17 Statistical Software bimodal distributions present in their histograms (Fig. 4D & E) with
(2010). This algorithm defines each data point as a cluster, then com peaks at 7.1 wt% and 9.2 wt% MgO, and 2.7 wt% and 3.2 wt% Na2O.
bines the two closest clusters into a new one at each step (Schuenemeyer These bimodal distributions within Al2O3, Na2O and MgO could
7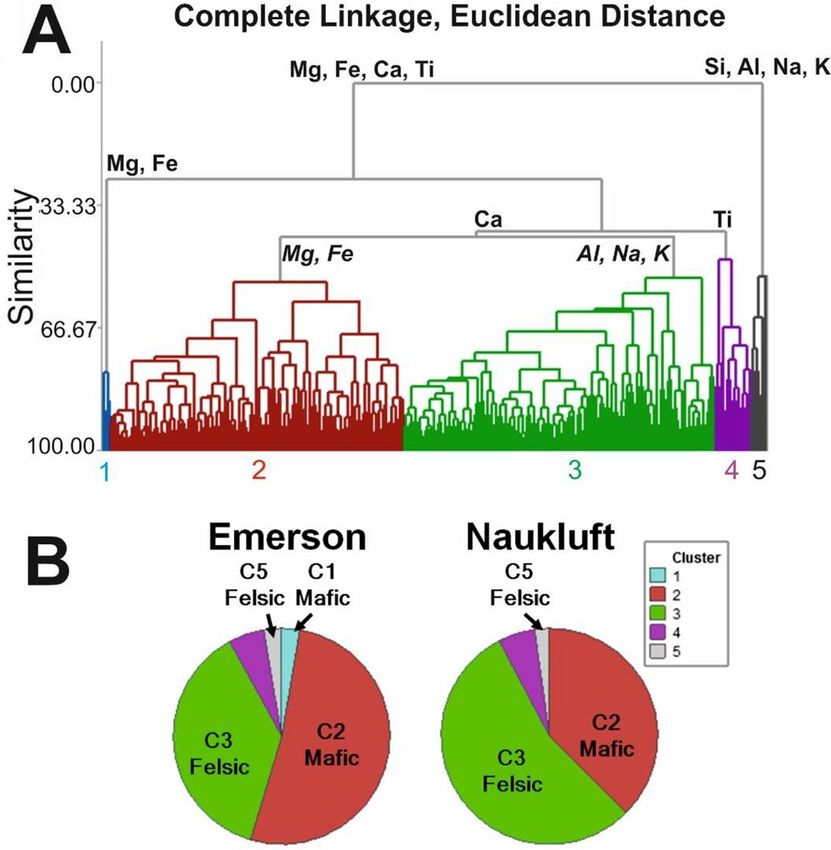
C.C. Bedford et al. Icarus 341 (2020) 113622
Table 1 all on average slightly more abundant in Cluster 3. Compositionally,
Basic statistics of the observation point compositions included in the constrained Clusters 2 and 3 are distinguished from the other clusters as they
bulk Stimson formation dataset. Basic statistics include the mean, standard de correlate with the subfocal compositions of the Stimson dataset (Fig. 7)
viation (StDev), minimum (Min), median (Med), maximum (Max), composi and hence are more representative of the average ratios of mixed
tional range, and for each major element oxide. sandstone components. Some analyses with Cluster 2, 3, and 4 mem
Variable Mean StDev Min Med Max Range berships do not belong strongly to their cluster which is reflected in their
SiO2 48.6 3.0 42.0 48.1 61.6 19.6 standard deviations (Table 2 and Fig. 7). However, the association of the
TiO2 0.9 0.2 0.5 0.9 2.0 1.5 Cluster 2 and 3 average compositions with the Stimson formation focal
Al2O3 13.4 2.9 5.7 13.3 22.5 16.8 compositions (Fig. 7), and correlation of most Cluster 4 analyses with
FeOT 18.6 2.4 6.6 19.0 27.1 20.5
dark features in the RMI images (Fig. 8C) suggests that these weakly
MgO 6.9 2.7 0.9 6.8 21.6 20.7
CaO 6.2 1.8 1.6 6.2 11.5 9.9 correlated analyses have not significantly skewed the model results. It is
Na2O 3.4 0.8 1.7 3.3 8.1 6.4 therefore likely that the Cluster 2, 3, & 4 averages are still representative
K2O 0.6 0.4 0.1 0.5 2.7 2.6 of the different components in the Stimson sandstone, particularly in the
context of the other statistical analyses (Figs. 6 & 7) and geological
observations (Fig. 8).
represent subpopulations within the Stimson formation, which are
The other Clusters are even more distinct than the main Clusters 2 &
investigated with the cluster analysis.
3 (Fig. 6A). Cluster 1 has the largest concentration of MgO (18.4 � 2.7
Density contours for the bulk Stimson formation (Fig. 5) also reflect
wt%) relative to the other Clusters, and lowest concentrations of Al2O3
the compositional spread of data present in the histograms, mean and
(7.0 � 0.9 wt%), Na2O (2.0 � 0.2 wt%), and K2O (0.3 � 0.2 wt%).
median statistics. Only Al2O3, Na2O, and MgO show apparent elongation
Cluster 5 shows the reverse major element abundances to Cluster 1 and
of the contours along their y-axis compared to the concentric circles
2, showing greater element abundances in SiO2 (58.0 � 2.6 wt%), Al2O3
distributed around the foci for the other major elements (Fig. 5A, D & E).
(17.7 � 2.9 wt%), Na2O (5.9 � 1.2 wt%) and K2O (1.6 � 0.6 wt%), and
The relatively uniform, concentric distribution of the bulk Stimson
lower MgO (2.4 � 1.1 wt%) and FeOT (9.9 � 2.5 wt%) concentrations
contours around the focal composition(s) and lack of their association
than Cluster 3 (Table 2, Fig. 7). On a plot of Al2O3, Na2O, and K2O with
with alteration feature trends show that the methods used to constrain
MgO and FeOT, Clusters 1 and 5 plot closest to the Big Sky mafic (augite
the dataset appropriately distinguish open-system alteration from bulk
and orthopyroxene) and felsic (plagioclase and K feldspar) calculated
rock composition (Fig. 5).
mineral compositions respectively (Fig. 7A), while Clusters 1 and 5
Observation points that have targeted calcium-sulfate veins and
appear to represent mineral endmember compositions (Fig. 7A). Cluster
cement show strong enrichments in CaO relative to Stimson bedrock
4 does not lie along the same trend of negative correlation between MgO
similar to the trends outlined for the fluvio-lacustrine groups (Bedford
and FeOT against Al2O3, Na2O, and K2O as the other Clusters due to its
et al., 2019; Nachon et al., 2014), depletions in all other major element
higher SiO2 and lower CaO abundances relative to Clusters 2 & 3
oxides, and low total sum of oxides. Alteration halos (shown in Fig. 5 as
(Fig. 6A), and overall higher TiO2 (Fig. 6.A, 7.B & Table 2).
yellow and red crosses) have a geochemical trend towards high SiO2
compositions (>80 wt%). The majority of ChemCam halo analyses
4. Discussion
(yellow crosses) also show low abundances for the other major elements
except TiO2 and some K2O values reflecting the geochemical trends
4.1. Diagenesis and alteration of the Stimson sandstone
observed in the Mt. Sharp group halos (Bedford et al., 2019; Frydenvang
et al., 2017). Nevertheless, some Stimson halo analyses, which we refer
The main, open-system aqueous alteration features of the Stimson
to as High-Al halos in Fig. 5, show an additional trend with an apparent
formation (halos and calcium-sulfate mineral veins) show geochemical
positive correlation for Al2O3, Na2O and K2O with SiO2 (red crosses).
compositions that trend away from the Stimson formation bulk density
These high Al2O3, Na2O and K2O halo analyses trend away from the high
contours indicating that we have successfully removed their influence
Al2O3 (~16 wt%) bulk Stimson contour subfocus towards the calculated
from the bulk rock geochemistry (Fig. 5). We have also identified a halo
crystal compositions of Big Sky plagioclase and K feldspar (Fig. 5) and
alteration trend that extends from the high Al2O3 Stimson focus towards
appear to correlate with ChemCam analyzing large, white grains
the calculated crystalline chemistries of the Big Sky drilled sample
(Fig. E.1 of the Supplementary material).
plagioclase and potassium feldspars (Morrison et al., 2018b; Yen et al.,
2017). This supports the resilience of feldspar minerals to the halo
3.2. Cluster analysis results for bulk Stimson alteration process in comparison to the mafic minerals of the bulk
Stimson bedrock (Frydenvang et al., 2017; Hausrath et al., 2018; Yen
Results from the multivariate analysis show that five clusters best fit et al., 2017). The Stimson formation sampled away from these open-
the data for the 8 major element oxide variables used to differentiate system alteration features lacks advanced alteration phases, like phyl
them (Table 2). According to the dendrogram (Fig. 6A), Clusters 2 & 3 losilicates, indicating that the Stimson formation was not altered
(similarity level 41.7) are closely linked. Clusters 5 and 1 are the most extensively (Siebach et al., 2017b; Yen et al., 2017). However, the
distinct from Clusters 2, 3, & 4 with a similarity level of 0.0 and 26.0. Stimson formation has undergone burial diagenesis through post depo
The Cluster with the greatest proportion of observations is Cluster 3 sitional resurgence of groundwater in order to convert it from a loose,
(155), followed by Cluster 2 (146). Clusters 1 and 5 have the fewest aeolian deposit to the sandstone at the surface today (Banham et al.,
observation points associated with them (4 and 8 respectively). 2018). Provided the incipient alteration of the Stimson formation
After the five clusters had been identified, each Stimson analysis was occurred in a closed-system, constrained bulk rock geochemistry should
assigned its cluster membership number, and a one-way analysis of be largely representative of the ancient dune deposits before
variance (ANOVA) was undertaken to calculate the cluster mean com lithification.
positions and standard deviations that differentiate them in the cluster Two major mineralogical differences exist between the Stimson
analysis (Table 2, Fig. 7). Overall, ANOVA results (Table 2, Fig. 6A) formation and the modern dune and soil deposits in Gale crater. CheMin
suggest that the two largest and most similar clusters - Cluster 2 and analyses of the Stimson formation did not detect olivine (Yen et al.,
Cluster 3 - are differentiated by relative variations in MgO (8.1 � 2.0 wt 2017), but showed that Stimson contains 16.2–18.4 wt% iron-oxide
% in Cluster 1, 5.9 � 1.8 wt% in Cluster 2) and Al2O3 (11.8 � 2.2 wt% minerals compared to the Bagnold dunes that instead have 3.0–4.8 wt
Cluster 1, 15.0 � 2.0 wt% Cluster 2) abundances, although some vari % iron-oxides and 25.8–18.2 wt% olivine (Achilles et al., 2017; Rampe
ations in mean composition also exist for SiO2, Na2O and K2O, which are et al., 2018). Reactive transport aqueous alteration models of the
8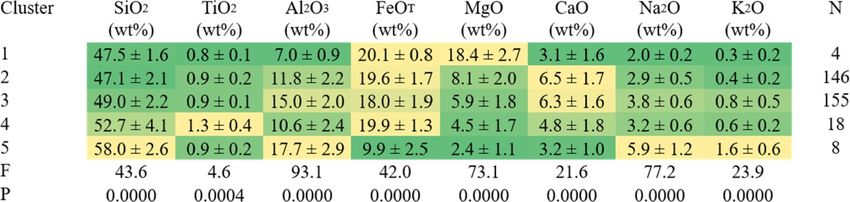
C.C. Bedford et al. Icarus 341 (2020) 113622
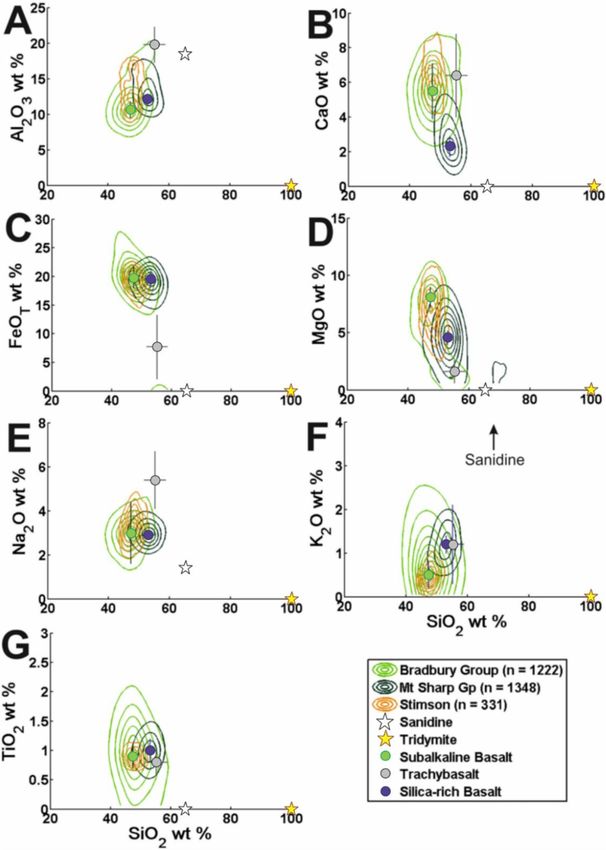
Fig. 4. Major element histograms of Stimson analyses within 95–105% sum of oxides, and excluding observation points taken >4 m from the rover or that had
analyzed obvious diagenetic features. Mean compositions (dashed vertical line) and 1σ precision (horizontal blue line) are also shown. (For interpretation of the
references to colour in this figure legend, the reader is referred to the web version of this article.)
9C.C. Bedford et al. Icarus 341 (2020) 113622
Fig. 5. Density contour Harker plots of the
constrained Stimson dataset for each major
element against SiO2 with a level step of
0.001, smoothing factor 30 and bin size 50.
Alteration feature trends are shown as yel
low and red crosses for the light-toned halos,
and light blue crosses for the Ca-sulfate
veins. Data also included are the Big Sky
plagioclase feldspar, K-feldspar, pigeonite
and orthopyroxene mineral compositions
from Morrison et al. (2018b) shown as stars,
and the Big Sky and Okoruso amorphous
component best estimate from Morrison
et al. (2018b) shown as squares. The light
and dark blue crosses show the ChemCam
instrument accuracy and precision respec
tively to 1σ. K fekdspar in F) illustrates the
direction of the CheMin derived K-feldspar
composition from Morrison et al. (2018b)
which contains16.9 wt% K2O. Black circles
are the Bagnold dune ChemCam observation
point analyses. (For interpretation of the
references to colour in this figure legend, the
reader is referred to the web version of this
article.)
Stimson formation have shown that the prevalent iron-oxide cement and component that includes orthopyroxene and pigeonite (6.2–7.0 wt%
high abundance of MgO (~15 wt% APXS, Big Sky and Okoruso; Mor MgO, Morrison et al., 2018b). ChemCam RMI images of targets with
rison et al., 2018b) in the amorphous component is likely the product of Cluster 1 and 2 memberships support that Clusters 1 and 2 may relate to
olivine subjected to burial diagenesis at 1 � C and pH 6–8 (Hausrath et al., fine-grained mafic minerals or dark iron-oxide and amorphous-bearing
2018). This diagenesis makes it likely that the high MgO and FeOT sandstone cement as these targets are generally fine grained, dark-
Clusters 1 and 2 could relate to ChemCam points that have sampled a toned, and have not sampled any obvious light-toned mineral grains
greater proportion of iron-oxide and MgO-bearing amorphous sandstone (Fig. 8A). In particular, Cluster 1 consists of four isolated observation
cement that constitutes on average 31 wt% of the Big Sky and Okoruso points that are all situated in different ChemCam targets in the Emerson
drilled Stimson samples (Morrison et al., 2018b). Cluster 2 also has high plateau, with two Cluster 1 targets - Mission Creek and Chamberlain -
abundances of MgO suggesting a possible influence of the amorphous analyzed on sol 1099 indicating that there may have been larger pockets
component, but MgO compositions in Cluster 2 (8.1 � 2.0 wt%) are of sandstone cement in this area.
more similar in composition to the CheMin derived crystalline Provided the diagenesis that cemented the Stimson sandstone was
10C.C. Bedford et al. Icarus 341 (2020) 113622
Table 2
Mean compositions of the 5 clusters identified in the cluster analysis with the standard deviation, number
of observations within each cluster (N), F-values (F) and p-values (p) derived from the F-test statistic1.
Box shading refers to relative abundances of the different major element oxides where yellow is high and
dark green is low.
1
p-Values were generated using one-way ANOVA on the data assigned to each cluster membership in
order to determine statistical significance from one another. Unequal variance was assumed for the
ANOVA analysis.
isochemical, it is still possible to use MgO and FeOT as a proxy for the isochemically with reactants sourced locally from the ferromagnesian
mafic minerals that were originally deposited in the Stimson dune field minerals (Banham et al., 2018; Hausrath et al., 2018; Potter-McIntyre
as the bulk chemistry will not have changed. The first evidence to sup et al., 2014; Siebach et al., 2017b). Next, the absence of clay minerals in
port the isochemical nature of the Stimson sandstone cement is shown CheMin analyses of Stimson sandstone suggests that the diagenesis was
by the equivalent composition of concretionary and non-concretionary not pervasive enough to form phyllosilicates and shows that it did not
sandstone in the Stimson formation according to both APXS geochem occur in an open-system (Yen et al., 2017), hence, the overall
ical data (Banham et al., 2018; Siebach et al., 2017b), and the ChemCam geochemistry of the initial sand deposit is likely to have been main
data reported here (Appendix B). Concretions form due to the prefer tained. Finally, the focal composition of bulk Stimson MgO is equivalent
ential cementation of the sandstone, making them more erosion resistant to the MgO concentrations of the Bagnold dune analyses (Fig. 5.D) and
when exposed at the surface (Banham et al., 2018; Chan et al., 2012; when Bagnold dune olivine is included in a plot of major elements
Potter-McIntyre et al., 2014; Potter et al., 2011). As these more associated with felsic minerals plotted against those associated with
cemented parts of the sandstone are not geochemically distinct from the mafic minerals (Fig. 7A), the linear regression line plots near perfectly
non-concretionary cement, they can be considered to have formed through the center of the Stimson mafic and Bagnold olivine composi
tions suggesting that they both contained olivine. All these factors
indicate that the Stimson sandstone cement formed in a closed-system
and as such, we continue to use MgO and FeOT as a proxy for the
mafic minerals that were initially deposited in the original dune sands.
4.2. Constraining the mineral sorting regime in the Stimson formation
with clusters 1, 2, 3, & 5
Clusters 2 and 3 are the most similar to the bulk Stimson composition
and are distinguished from one another by their relative concentrations
of Al2O3, Na2O, and K2O compared to MgO (Table 2, Fig. 7A). This is
similar to the geochemical differences between Clusters 1 and 5, with
Cluster 1 showing the highest abundance of MgO, and Cluster 5 the
highest abundances of Al2O3, Na2O, and K2O (Table 2, Fig. 7A). Hence,
Clusters 1 and 5 appear to be closer to endmember compositions than
Clusters 2 and 3, which are instead more representative of the sub
populations in the Stimson formation that are the cause of the bimodal
distributions for Al2O3, MgO and Na2O (Fig. 4B, D, and F).
According to calculated CheMin mineral compositions of the Stimson
formation drilled samples Big Sky and Okoruso, Al2O3 is determined by
the proportion of the felsic minerals plagioclase and K-feldspar, MgO is
influenced by the abundances of the mafic minerals pigeonite and
orthopyroxene, and previously by olivine (Hausrath et al., 2018), Na2O
is located within plagioclase feldspar, and K2O within K-feldspar (Mor
rison et al., 2018b). When a regression line is calculated for bulk Stimson
data using major element oxides that solely constitute plagioclase feld
spar and K feldspar (Al2O3, Na2O and K2O) against those only found in
Fig. 6. A) A dendrogram derived from the Cluster analysis on bulk Stimson mafic minerals (MgO and FeOT) a straight line (R2 ¼ 56.4%; p < 0.001)
observation points. According to the change in similarity levels, 5 clusters were is plotted through the Stimson focus (Fig. 7.A) and plots between the Big
derived from this formation. Blue ¼ Cluster 1, red ¼ Cluster 2, green ¼ Cluster
Sky mafic and felsic mineral compositions derived by Morrison et al.
3, pink ¼ Cluster 4, grey ¼ Cluster 5. The geochemical variations that define the
(2018b). Clusters 1, 2, 3, and 5 lie within error of this line (Fig. 7A).
different clusters are shown at the branching points with italicised major ele
ments for Clusters 2 and 3 indicating relative major element differences be Clusters 2 and 3 are also situated about the focal compositions of the
tween these two clusters. B) Pie charts showing the proportion of each cluster Stimson sandstone, which supports that Clusters 1 and 5 are closest in
between the Emerson and Naukluft Plateaus. (For interpretation of the refer composition to mineral endmembers, with Clusters 2 and 3 correlating
ences to colour in this figure legend, the reader is referred to the web version of to analyses that have targeted an average Stimson mixing proportion of
this article.) respective mafic and felsic mineral populations (Fig. 7A). These clusters
11C.C. Bedford et al. Icarus 341 (2020) 113622
Fig. 7. Density contour and scatter plots for the constrained Emerson Plateau (orange contours) and Naukluft Plateau (dark brown contours), cluster average
compositions (circles), and CheMin-derived Big Sky drilled sample mineral chemistry (stars; Yen et al., 2017; Morrison et al., 2018b). The Big Sky mineral com
positions were selected as they show the least evidence of alteration (Yen et al., 2017). A) Also shows a modelled linear regression line for data with mafic and felsic
cluster memberships that shows statistical significance according to p < 0.05. (For interpretation of the references to colour in this figure legend, the reader is referred
to the web version of this article.)
with an apparent negative correlation between Al2O3, Na2O, and K2O compared to Stimson analyzed at the Naukluft plateau which in turn has
versus MgO and FeOT are similar to the mafic and felsic clusters deter a much greater proportion of points associated with felsic clusters
mined from several cluster analysis studies of ChemCam data from the (Clusters 3 and 6, see Fig. 6.B). Further support for the mafic classifi
inactive Aeolus Palus soils in Gale crater (Cousin et al., 2015; Meslin cation of Clusters 1 & 2 and felsic classification of Clusters 3 & 5 is
et al., 2013). Therefore, it is probable that the Clusters from the Stimson provided by the target RMI images (Fig. 8). Targets with Cluster 1 & 2
formation ChemCam data are also representative of the different pro classifications have fewer coarse, light toned mineral grains in them
portions of mafic and felsic minerals that existed in the previously (Fig. 8A) compared to targets with Cluster 3 and 5 classifications that
deposited Stimson dune field and can be used to understand the effects show several, often coarse (>1 mm) light-toned mineral grains (Fig. 8B).
of sediment transport on bulk Stimson geochemistry. Mineral sorting within the dunes themselves and deposition across
When Stimson density contours are divided into the Emerson and different geological time periods were considered as possible causes of
Naukluft plateaus (Fig. 7), the Emerson plateau shows a distribution and mafic-felsic geochemical variation for the Emerson and Naukluft pla
bulk composition that extends to higher MgO and FeOT, and lower teaus. On Mars, the proportion of olivine/feldspar is shown to vary from
Al2O3, Na2O and K2O compared to the Naukluft plateau (Fig. 7). ripple and dune troughs to crests with crests being more enriched in the
Although the bulk compositional differences are small between Stimson coarser mafic material relative to the troughs (Johnson et al., 2017;
localities, the geochemical variation between localities are shown to be Lapotre et al., 2017; O’Connell-Cooper et al., 2018, 2017). A plot of
statistically significant with two-way equivalence tests for Al2O3, MgO, mafic and felsic ChemCam clusters against height above the unconfor
CaO, and K2O (see Table F.1 of Supplementary information). Overall, mity does not show a correlation of mafic-felsic proportions with posi
the Emerson plateau density contours on the mafic-felsic mineral sorting tion in the dune outcrop (Appendix Fig. G.1). Dune crests are also rarely
plot show a larger spread in compositional data than the Naukluft preserved in the geological record (Banham et al., 2018; Kocurek, 1991;
plateau contours, extending towards more mafic compositions (Fig. 7A). Nichols, 2009), hence, ChemCam has successively sampled the lower
Alternatively, the Naukluft plateau density contours are fewer in num portion of the ancient dunes avoiding the bias associated with mineral
ber denoting a lower spread in data with a focus extending more to the sorting within the dunes themselves. Therefore, the mafic-felsic mineral
felsic Clusters 3 and 5. The distribution of clusters between the two lo proportions are clearly associated with locality rather than elevation or
calities also shows that the Emerson plateau has a higher proportion of position in the dune. The similarity between the minerals that constitute
points within the mafic cluster memberships (Clusters 1 and 2) the Stimson formation across both plateaus and lack of sedimentological
12C.C. Bedford et al. Icarus 341 (2020) 113622
Fig. 8. ChemCam RMI images of targets with different proportions of cluster memberships. A) Target Chamberlain (sol 1099) from the Emerson Plateau is a dark
sandstone with few coarse, light-toned minerals and mostly Cluster 1 & 2 memberships. B) Target Stonewall (sol 1083) from the Emerson Plateau. This target has
abundant, coarse grained felsic minerals and only Cluster 3 & 5 memberships. C) Target Dakota (sol 1112) from the Naukluft Plateau. This target has several high-Ti
Cluster 4 memberships and contains abundant black minerals that are uncommon in targets without a Cluster 4 membership, in addition to coarse, felsic grains.
features that indicate a period of aeolian deflation i.e., super surfaces further from the source is richer in MgO and FeO, but has a lower
(Banham et al., 2018; Kocurek, 1988), also indicates that Stimson was abundance of Al2O3, Na2O and K2O (Baratoux et al., 2011; Cousin et al.,
deposited during a single period of aeolian accumulation (Banham et al., 2015; Mangold et al., 2011). This mineral sorting regime and compo
2018; Yen et al., 2017). As such, it is highly unlikely that mafic-felsic sitional characteristic is also identified in the Bagnold dunes in Gale
geochemical variation occurred as a result of either mineral sorting crater (Lapotre et al., 2017; Rampe et al., 2018), although, the Bagnold
within dunes or a change in stratigraphic position. We therefore hy dunes appear to be either better sorted than the Gale crater soils or
pothesize that the ancient net sediment transport direction can be derived from a more olivine-phyric source region due to their uniform
inferred according to the mafic-felsic mineral sorting regime across the geochemistry, concentration of olivine, and absence of coarse, felsic
Stimson formation, particularly if the sediments were derived from a grains at the dune crests (Cousin et al., 2017; Johnson et al., 2017;
line or point source with a single source geometry (Ewing and Kocurek, O’Connell-Cooper et al., 2018). The lower chemical weathering rates for
2010). present-day Mars may also promote the preservation of relatively coarse
The aeolian mineral sorting regime determined from the unconsoli olivine grains in currently active aeolian systems such as the Bagnold
dated soil deposits in Gale crater and Mars-analog basaltic aeolian dunes dunes. Whereas, soil deposits may in comparison have higher hydration
in Iceland both show that coarse-grained felsic minerals are more signals due to the presence of a < 100 μm fine fraction that could relate
abundant closer to the sediment source compared to the often finer to alteration products present in the Martian dust (Cousin et al., 2017,
mafic minerals such as olivine and pyroxene that are transported further 2015; Gabriel et al., 2018).
in the system (Baratoux et al., 2011; Cousin et al., 2015; Mangold et al., In the Stimson formation, coarse, light-toned mineral grains ~1.5
2011; Meslin et al., 2013; Mountney and Russell, 2004). The preferential mm in size have been identified in images across the Emerson and
transportation of mafic mineral grains in aeolian environments occurs as Naukluft plateaus (e.g., Fig. 8), particularly in Naukluft plateau targets,
their rounder shape and finer grain size made them more efficient at showing that feldspar is present in the coarser grain size fractions (>250
saltation compared to the elongate feldspar grains (Baratoux et al., μm) of the ancient Stimson dune field. Furthermore, the proportion of
2011; Mangold et al., 2011; Mountney and Russell, 2004). Due to the felsic Clusters 3 and 5 is greater in the Naukluft plateau relative to the
increased abundance of mafic minerals in the finer portion of basaltic Emerson plateau which is instead more abundant in mafic Clusters 1 and
sediments that are transported further in aeolian processes, aeolian sand 2 (Fig. 6B). According to this mineral sorting regime, the greater
13You can also read


