Reduced phosphorus loads from the Loire and Vilaine rivers were accompanied by increasing eutrophication in the Vilaine Bay (south Brittany, France)
←
→
Page content transcription
If your browser does not render page correctly, please read the page content below
Biogeosciences, 16, 1361–1380, 2019
https://doi.org/10.5194/bg-16-1361-2019
© Author(s) 2019. This work is distributed under
the Creative Commons Attribution 4.0 License.

Reduced phosphorus loads from the Loire and Vilaine rivers were
accompanied by increasing eutrophication in the Vilaine Bay
(south Brittany, France)
Widya Ratmaya1 , Dominique Soudant2 , Jordy Salmon-Monviola3 , Martin Plus5 , Nathalie Cochennec-Laureau1 ,
Evelyne Goubert4 , Françoise Andrieux-Loyer5 , Laurent Barillé6 , and Philippe Souchu1
1 Ifremer – LER MPL, Rue de l’Ile d’Yeu, BP 21105, 44311 Nantes CEDEX 03, France
2 Ifremer,VIGIES, Rue de l’Ile d’Yeu, BP 21105, 44311 Nantes CEDEX 03, France
3 INRA/Agrocampus Ouest – UMR1069 Sol Agro et Hydrosystème Spatialisation, 35000 Rennes, France
4 Université de Bretagne Sud – GMGL, UMR CNRS 6538 DO, Campus Tohannic, 56000 Vannes, France
5 Ifremer – DYNECO PELAGOS, ZI Pointe du Diable, 29280 Plouzané, France
6 Université de Nantes, Laboratoire Mer Molécules Santé EA 2160, Faculté des Sciences et des Techniques,

BP 92208, 44322 Nantes CEDEX 03, France

Correspondence: Widya Ratmaya (widya.ratmaya@ifremer.fr)

Received: 12 September 2018 – Discussion started: 19 September 2018
Revised: 26 January 2019 – Accepted: 18 February 2019 – Published: 2 April 2019

Abstract. The evolution of eutrophication parameters (i.e.,       ues to increase downstream, especially when N is the limit-
nutrients and phytoplankton biomass) during recent decades        ing factor. More N input reduction, paying particular atten-
was examined in coastal waters of the Vilaine Bay (VB,            tion to diffuse N sources, is required to control eutrophica-
France) in relation to changes in the Loire and Vilaine rivers.   tion in receiving VB coastal waters. Internal benthic DIP and
Dynamic linear models were used to study long-term trends         DSi recycling appears to have contributed to the worsening
and seasonality of dissolved inorganic nutrient and chloro-       of summer VB water quality, augmenting the effects of an-
phyll a concentrations (Chl a) in rivers and coastal waters.      thropogenic DIN inputs. For this coastal ecosystem, nutrient
For the period 1997–2013, the reduction in dissolved river-       management strategies should consider the role played by in-
ine inorganic phosphorus (DIP) concentrations led to the de-      ternal nutrient loads to tackle eutrophication processes.
crease in their Chl a levels. However, while dissolved inor-
ganic nitrogen (DIN) concentrations decreased only slightly
in the Vilaine, they increased in the Loire, specifically in
summer. Simultaneously, phytoplankton in the VB under-            1   Introduction
went profound changes with increase in biomass and change
in the timing of the annual peak from spring to summer. The       Anthropogenic eutrophication is widely regarded as one of
increase in phytoplankton biomass in the VB, manifested           the major problems affecting both inland and coastal aquatic
particularly by increased summer diatom abundances, was           ecosystems (Downing, 2014). The increase in phytoplank-
due to enhanced summer DIN loads from the Loire, sus-             ton biomass is the most common symptom of eutrophication
tained by internal regeneration of DIP and dissolved silicate     among the myriad responses of aquatic ecosystems to an-
(DSi) from sediments. The long-term trajectories of this case     thropogenic inputs of nitrogen (N) and phosphorus (P) (Clo-
study evidence that significant reduction of P inputs with-       ern, 2001; Glibert et al., 2011). Since the beginning of the
out simultaneous N abatement was not yet sufficient to con-       1990s, measures to reduce nutrient inputs in European rivers
trol eutrophication all along the Loire–Vilaine–VB contin-        have been more effective for P, originating largely from point
uum. Upstream rivers reveal indices of recoveries following       sources, than for N, coming mainly from diffuse sources
the significant diminution of P, while eutrophication contin-     (Grizzetti et al., 2012). However, this strong imbalance be-

Published by Copernicus Publications on behalf of the European Geosciences Union.
1362                                       W. Ratmaya et al.: Reduced phosphorus loads from the Loire and Vilaine rivers

tween N and P input reduction still led to substantial de-         algae, such as dinoflagellates and harmful species (Billen and
crease in phytoplankton biomass in many European rivers            Garnier, 2007; Lancelot et al., 2007; Howarth et al., 2011).
(Istvánovics and Honti, 2012; Romero et al., 2013). This re-          The present study investigated the long-term evolution
sult is consistent with the idea that P universally limits pri-    (trend and seasonality) of eutrophication parameters (dis-
mary productivity in many freshwater ecosystems (Correll,          solved inorganic nutrient concentrations and phytoplankton
1999). Thus, reducing P inputs, and not N, can mitigate eu-        biomass) in the VB coastal waters, in relation to those in the
trophication of freshwater ecosystems (Schindler et al., 2008,     Loire and the Vilaine between 1980 and 2013, using dynamic
2016).                                                             linear models. This long-term ecosystem-scale analysis pro-
   Despite significant P input reduction, eutrophication per-      vided an opportunity to test the hypothesis that eutrophica-
sists in some rivers (Bowes et al., 2012; Jarvie et al., 2013),    tion trajectories in the downstream VB coastal waters during
and particularly in downstream coastal ecosystems, where           recent decades have been influenced by those in the Loire and
the primary productivity is often limited by N (Ryther and         Vilaine rivers. We aim to establish the link between fresh and
Dunstan, 1971; Paerl, 2018). As freshwater systems drain           marine water trajectories and highlight the impact of nutrient
into coastal waters (Vannote et al., 1980; Bouwman et al.,         reduction strategies in rivers on coastal water quality.
2013), the efficient P reduction without simultaneous N
abatement may result in more N being transported down-
stream, where it can exacerbate eutrophication problems in         2     Material and methods
coastal ecosystems, delaying recovery (Paerl et al., 2004), for
                                                                   2.1    Sites
example, the Neuse River Estuary (Paerl et al., 2004), Bel-
gian coastal waters (Lancelot et al., 2007) and the Seine Bay      The Loire is the longest river in France (1012 km) with a wa-
(Romero et al., 2013). Despite more than 20 years of nutrient      tershed of 117 000 km2 , while the Vilaine watershed is only
reduction implementation in European freshwater ecosys-            a tenth of the size, with an area of 10 800 km2 (Fig. 1). Their
tems, including rivers (e.g., Nitrates Directive, 91/676/EEC,      catchment areas are dominated by agricultural activity, sus-
1991; Urban Waste Water Treatment Directive, 91/271/EEC,           taining two-thirds of the national livestock and half the cereal
1991), little measurable progress has been observed in many        production (Bouraoui and Grizzetti, 2008; Aquilina et al.,
European coastal waters (EEA, 2017; OSPAR, 2017).                  2012). The Arzal dam, 8 km from the mouth of the Vilaine,
   The Loire River and the Vilaine River are among these           was constructed in 1970 to regulate freshwater discharge and
major European rivers whose phytoplankton biomass and P            prevent saltwater intrusion (Traini et al., 2015). The two stud-
concentrations have decreased since the early 1990s but with       ied rivers, especially the Loire, are the main nutrient sources
minor, if any, simultaneous diminution in N concentrations         in the northern Bay of Biscay, which includes the VB (Guil-
(Romero et al., 2013; Minaudo et al., 2015). Affected by the       laud et al., 2008; Ménesguen et al., 2018a).
Loire and Vilaine river runoff (Guillaud et al., 2008; Go-            The VB, with an average depth of 10 m, is located un-
hin, 2012; Ménesguen et al., 2018b), the Vilaine Bay (VB)          der direct influence of these two rivers (Fig. 1). The Loire
is one of the European Atlantic coastal ecosystems most sen-       river plume tends to spread northwestward with a dilution
sitive to eutrophication (Chapelle et al., 1994; Ménesguen et      of 20- to 100-fold by the time it reaches the VB (Ménes-
al., 2019). The VB coastal waters are classified as a prob-        guen and Dussauze, 2015; Ménesguen et al., 2018b). The
lem area due to elevated phytoplankton biomass, according          model ECO-MARS3D, using numerical tracers (Ménesguen
to the criteria established within OSPAR (OSPAR, 2017)             et al., 2018a), estimates that the Loire constitutes, on aver-
and the European Water Framework Directive (Ménesguen              age, 30 % of VB dissolved inorganic nitrogen (DIN) concen-
et al., 2018b). However, there is little information on how        trations during floods (min–max 2 %–49 %) and 18 % dur-
eutrophication parameters have evolved in the VB over the          ing periods of low water (min–max 6 %–29 %). The contri-
past 20 years in the light of eutrophication mitigation in the     butions of the Loire to VB dissolved inorganic phosphorus
Loire and Vilaine rivers. An approach taking into account          (DIP) concentrations can reach 36 % during flood periods
seasonal variations is required, as phytoplankton in many          (average 12 %) but remain < 5 % during periods of low wa-
coastal ecosystems, such as the coastal waters off the Loire       ter. The Vilaine river plume tends to spread throughout the
and Vilaine rivers, is often limited by P in spring and by N in    bay before moving westward (Chapelle et al., 1994). The Vi-
summer (Lunven et al., 2005; Loyer et al., 2006).                  laine contributions to the DIN concentrations in the VB, esti-
   In temperate coastal waters, diatoms and dinoflagellates        mated by the model, are slightly lower than those of the Loire
constitute the two dominant phytoplankton classes (Sournia         whatever the period, on average 23 % and 17 % for flood and
et al., 1991). In terms of nutrient requirements, the balance      low-water periods, respectively. The Vilaine contributes, on
between these classes is controlled by silica (Si) availability.   average, to 5 % and 8 % of VB DIP concentrations during
Increased inputs in N and P (and not Si) in aquatic ecosys-        flood and low-water periods respectively.
tems can lead to limitation in diatom biomass due to a lack of
dissolved silicate (Conley et al., 1993). Therefore, increasing
eutrophication may favor the development of non-siliceous

Biogeosciences, 16, 1361–1380, 2019                                                     www.biogeosciences.net/16/1361/2019/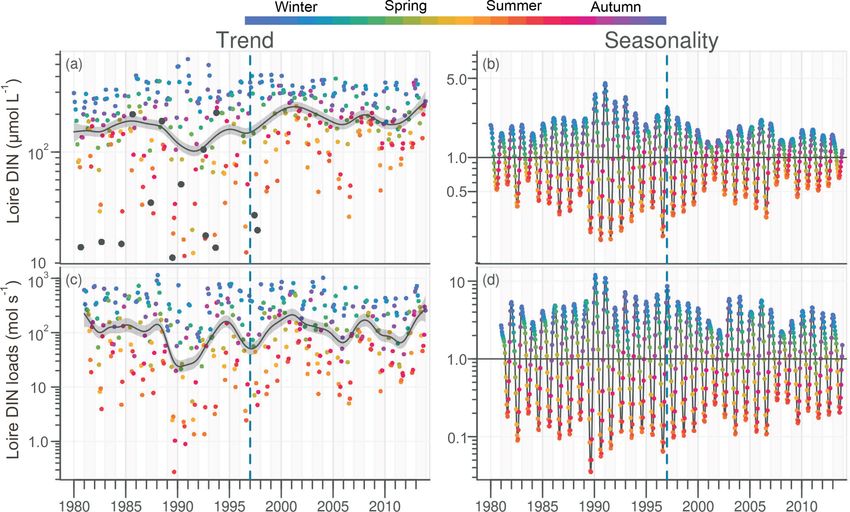
W. Ratmaya et al.: Reduced phosphorus loads from the Loire and Vilaine rivers                                                        1363

Figure 1. Map of the area studied showing Loire and Vilaine rivers and delimitation of Vilaine Bay (inset red dotted line). Black dots mark
the sampling and gauging stations cited.

   The water residence time in the VB varies between 10 and             discharge data were extracted from the French hydrologic
20 days depending on the season and tends to be longer dur-             “Banque Hydro” database (http://www.hydro.eaufrance.fr/,
ing calm periods (Chapelle, 1991; Chapelle et al., 1994), with          last access: 20 May 2016). For the Loire, river discharge
tidal ranges varying between 4 and 6 m (Merceron, 1985).                measurements at Montjean-sur-Loire were used due to the
The water circulation is characterized by low tidal and resid-          absence of data at Sainte-Luce-sur-Loire. The difference in
ual currents, driven mainly by tides, winds and river flows             drainage areas between Montjean (109 930 km2 ) and Sainte-
(Lazure and Salomon, 1991; Lazure and Jegou, 1998). Dur-                Luce (111 570 km2 ) is negligible (ratio of 1.01) and would
ing periods of prevailing winds, particularly from the south-           not have significantly changed calculations of nutrient in-
west and west, the water column of the VB is subjected to               puts. For the Vilaine, daily discharge data were available at
vertical mixing, which can lead sometimes to sediment re-               Rieux from the 1980s. DIN and DIP loads from rivers were
suspension and high turbidity (Goubert et al., 2010). Except            calculated using averaged monthly discharge and individual
during winter and periods of high hydrodynamic activity,                monthly nutrient concentrations (Romero et al., 2013).
phytoplankton production in the VB is not limited by light                 Nutrient and Chl a concentrations, plus phytoplankton
(Guillaud et al., 2008).                                                count data in the VB, provided by the French National Obser-
                                                                        vation Network for Phytoplankton and Hydrology in coastal
2.2   Long-term monitoring dataset: rivers and VB                       waters (REPHY, 2017), were collected from Ouest Loscolo
                                                                        station (Fig. 1). This station is representative of the VB
The Loire Brittany River Basin Authority (http:                         coastal waters (Bizzozero et al., 2018; Ménesguen et al.,
//osur.eau-loire-bretagne.fr/exportosur/Accueil, last access:           2019) and displayed the longest dataset (from 1983 for phy-
31 March 2017) furnished dissolved inorganic nutrients and              toplankton counts and 1997 for nutrient and Chl a concen-
phytoplankton biomass data (concentrations of DIP; DIN;                 trations).
dissolved silicate, DSi; and chlorophyll a, Chl a) in rivers,              Acquisition periods, sampling frequencies and methods of
at pre-estuarine stations located closest to the river mouth            analysis are detailed in Table S1 in the Supplement. Briefly,
upstream of the haline intrusion (Fig. 1). DIN was defined              nutrient concentrations were measured manually or automat-
as the sum of nitrate, nitrite and ammonium, with nitrate               ically in flow analysis using standard colorimetric methods
as the major component (> 90 %). Sainte-Luce-sur-Loire                  with fluorimetry or photometry detection. Chl a concentra-
on the Loire and Rieux on the Vilaine provided DIP, DIN                 tions were measured with either spectrophotometry or fluo-
and Chl a, measured monthly since the 1980s. For Sainte-                rimetry. Microscopic quantitative micro-phytoplankton anal-
Luce-sur-Loire, the influence of tidal dynamics was avoided             yses in coastal waters were conducted on Lugol-fixed sam-
by discarding data collected during high tide. Monthly DSi              ples and counted according to Utermöhl (1958). Phytoplank-
data were available from 2002 at Montjean-sur-Loire on the              ton identification and counts were carried out for organ-
Loire and at Férel on the Vilaine (Fig. 1).                             isms whose size is > 20 µm (i.e., micro-phytoplankton) and
   In order to calculate riverine nutrient loads, gauging sta-          smaller species with chain structure. Further details about
tions located close to the river mouth were selected. River

www.biogeosciences.net/16/1361/2019/                                                            Biogeosciences, 16, 1361–1380, 2019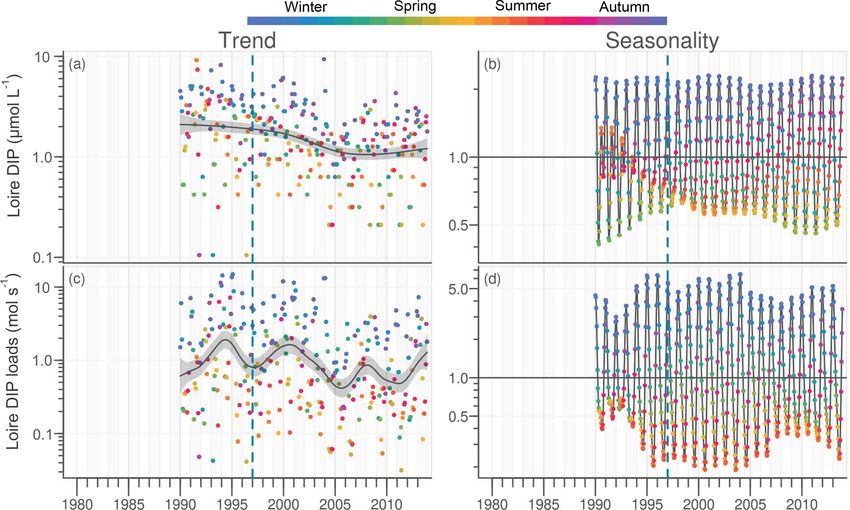
1364                                      W. Ratmaya et al.: Reduced phosphorus loads from the Loire and Vilaine rivers

sampling and processing of phytoplankton species are avail-       for model parameters (West and Harrison, 1997). For other
able in Hernández-Fariñas et al. (2014) and Belin and Neaud-      examples of DLM applications, readers may refer to Soudant
Masson (2017). In order to account for the role of DSi, of all    et al. (1997), Scheuerell et al. (2002) and Hernández-Fariñas
the micro-phytoplankton classes, genera and species iden-         et al. (2014).
tified in the VB, only total counts of diatoms (Bacillario-           The model used was a second-order polynomial trend,
phyceae) and dinoflagellates (Dinophyceae) were used in this      which allows modeling up to a quadratic trend. This was cho-
work. Other micro-phytoplankton classes (Dictyophyceae,           sen because a linear trend (i.e., first-order polynomial) was
Prasinophyceae, Cyanophyceae, Chrysophyceae and Raphi-            too restrictive and a cubic trend (i.e., third-order polynomial)
dophyceae) together represented only 10 % to 15 % of the          might lead to an over-fitted model. For the seasonal compo-
VB total counts (Belin and Soudant, 2018).                        nent, the model used was trigonometric with two harmonics,
    DIN : DIP, DIN : DSi and DSi : DIP molar ratios were cal-     which considers a potential bimodal pattern. This bimodal
culated and compared with theoretical molar N : P : Si ratios     pattern is characterized by two peaks per year, such as spring
of 16 : 1 : 16 (Redfield, 1958; Brzezinski, 1985) in order to     and autumn or summer and winter blooms. This model spec-
assess the potential limitation of phytoplankton growth by        ification was used for all parameters.
nutrient in rivers and in the VB and to investigate for trends.       The time unit, defined as the smallest time interval be-
                                                                  tween sampling dates within a period of analysis (i.e., 1
2.3     Time-series analyses                                      year), was weekly, fortnightly or monthly according to sam-
                                                                  pling frequencies of variables (see Table S1). Normality of
2.3.1    Data preprocessing                                       standardized residuals was checked using a Q–Q plot and
                                                                  their independence using estimates of the autocorrelation
Prior to analysis, all datasets were examined using time-         function. If deviations were suspected, outliers were iden-
scaled scatter plots. For DIP in rivers, these showed peri-       tified as 2.5 % higher and lower than standardized residu-
ods during which a limited set of values appeared repeat-         als and treated appropriately; i.e., specific observational vari-
edly (Fig. S1 in the Supplement), which resulted from an-         ances were estimated for each outlier. The DLM time-series
alytical problems (Loire Brittany River Basin Authority, Syl-     analysis provides figures allowing the visual identification of
vain Jolly, personal communication, 2016). Consequently,          trends and variations in seasonality.
these suspect data were discarded to avoid misinterpretation.
The removed DIP datasets represented 29 % and 31 % of the         2.3.3   Trend
total number of data, corresponding respectively to the pe-
riod 1980–1989 in the Loire and 1980–1989 and 2009–2011           The DLM trend plot displayed observed values with a shade
in the Vilaine. Trend analysis was not conducted on DSi in        of color for each time unit segments: weekly, fortnightly or
rivers because the data covered the period 2002–2013 only.        monthly. The trend was represented by a dark grey line, with
   Prior to time-series decomposition, a variance-stabilizing     the shaded area indicating the 90 % confidence interval. For
base e log transformation was applied to all variables, ex-       the period 1997–2013, common to all variables, (“common
cept for phytoplankton counts for which the base was 10,          period” hereafter in the text), a monotonic linear trend sig-
to ensure compliance with the constant variance assumption        nificance test was performed on DLM trend components us-
(i.e., homoscedasticity).                                         ing a modified nonparametric Mann–Kendall (MK) test (Yue
                                                                  and Wang, 2004). When monotonic linear trends were signif-
2.3.2    Time-series decomposition                                icant (p < 0.05), changes were calculated from differences
                                                                  between the beginning and the end of the common period of
The time series were modeled using dynamic linear mod-            Sen’s robust line (Helsel and Hirsch, 2002).
els (DLMs; West and Harrison, 1997) with the dlm pack-
age (Petris, 2010) in R software (R Development Core Team,        2.3.4   Seasonality
2016). This tool belongs to the family of methods which en-
compass, for example, state-space models, structural time-        The seasonality plot displayed the DLM seasonal compo-
series models, the Unobserved Components Model (Harvey            nent values. The figure provides visual access to the inter-
et al., 1998) and dynamic harmonic regression (Taylor et al.,     annual evolution of the amplitude, corresponding to the dif-
2007). The model decomposes an observed time series into          ference between the minimum and maximum values of each
component parts, typically the trend, the seasonal component      year. As dependent variables have been log-transformed, the
(i.e., seasonality) and the residual. The DLM approach is par-    model was multiplicative. Therefore, when seasonal com-
ticularly suitable for environmental data series characterized    ponent values were equal to 1 (i.e., horizontal line), fitted
by outliers, irregular sampling frequency and missing data.       values were equal to the trend. The seasonality plot also al-
The last-mentioned are taken into account by the Kalman fil-      lowed a visualization of how the values have evolved over the
ter (Kalman, 1960), using a prior which replaces the missing      years according to their seasonal position. The significance
value; i.e., no information leads to no change in distributions   of changes in the seasonality (monotonic linear increase or

Biogeosciences, 16, 1361–1380, 2019                                                     www.biogeosciences.net/16/1361/2019/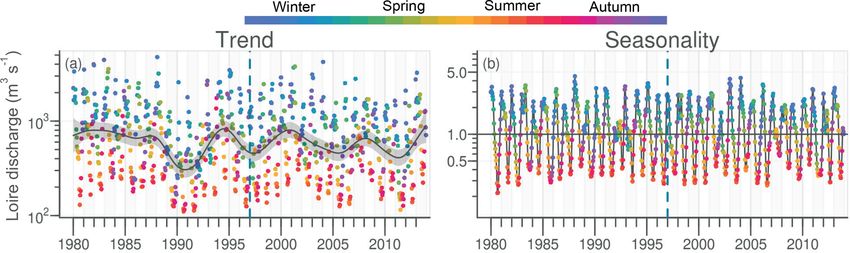
W. Ratmaya et al.: Reduced phosphorus loads from the Loire and Vilaine rivers 1365
decrease in the value for a given season) was assessed for
Table 1. Statistical results from the Mann–Kendall test performed on DLM trend components of eutrophication parameters in rivers and in the VB coastal waters for the common period
1997–2013. If the test was significant at p < 0.05, differences of Sen’s robust line between the beginning and the end of the period (17 years) were calculated. Values in parentheses are
percentages of changes relative to the initial values of Sen’s robust line. Increasing or decreasing trends are indicated by + and − signs, respectively. NS denotes non-significant values.
Change
(%)
(108 %)
+8 × 10³
the common period using the modified MK test performed
Dinoflagellates
(Cells L−1 )
on DLM seasonal components for each season. The seasons
were defined as winter (January, February, March), spring
< 0.001
p
(April, May, June), summer (July, August, September), and
autumn (October, November, December). The interpretation
of the seasonal components per se was not meaningful; there-
Change
(%)
(227 %)
+90 × 103
fore changes were not calculated, but when monotonic linear
trends were significant (p < 0.05), the sign and the percent-
(Cells L−1 )
Diatoms
age of the changes were provided.
< 0.001
p
2.4 Correlation analysis
Spearman correlations were computed for annual median
Change
(%)
−54
(93 %)
−12
(76 %)
+2.1
(126 %)
values of the common period in order to analyze relationships
between variables and tested using STATGRAPHIC CEN-
(µg L−1 )
Chl a
TURION software (Statgraphics Technologies Inc., Version
< 0.001
< 0.001
< 0.001
p
XVII, Released 2014).
Change
(%)
+3.6
(34 %)
3 Results
(µmol L−1 )
DSi
3.1 Long-term trends in eutrophication parameters in
< 0.001
p
river basin outlet
The daily discharge of the Loire varied between 111 and
4760 m3 s−1 for the period 1980–2013, with the DLM
Change
(%)
NS
−4.6
(38 %)
trend displaying oscillations with periodicities of 6–7 years
DIN loads
(mol s−1 )
(Fig. 2a). A significant negative trend was detected for the
0.42
< 0.001
p
common period (1997–2013), with a decrease of 94 m3 s−1
(Table 1). The seasonality plot displayed no marked change,
with maximum values always observed in winter (blue) and
Change
(%)
NS
−71
(21 %)
+3.2
(40 %)
minimum in summer (orange/red; Fig. 2b) and no signifi-
(µmol L−1 )
cant linear change whatever the season (Table 2). The Vilaine
DIN
discharge (median of 32 m3 s−1 for the period 1980–2013)
0.63
< 0.001
0.01
p
corresponded to 6 % of the Loire discharge and displayed a
similar trend and seasonality to those of the Loire (Fig. S2,
Tables 1, 2), as highlighted by the significant correlation be-
Change
(%)
−0.60
(52 %)
−0.09
(88 %)
tween their annual medians (Table 3).
DIP loads
(mol s−1 )
DIP in the Loire varied between 0.1 and 9.4 µmol L−1
for the period 1990–2013 (Fig. 3a). A significant decrease
< 0.001
< 0.001
p
of 0.85 µmol L−1 was detected for the common period (Ta-
ble 1). Also during this period, the seasonality plot indicated
a noteworthy shift in timing of annual DIP minima from sum-
Change
(%)
−0.85
(47 %)
−1.9
(75 %)
−0.05
(13 %)
mer to spring, as indicated by its change in color from yel-
(µmol L−1 )
low/orange (summer) in 2000 to green (spring) from 2006
DIP
onwards (Fig. 3b). This change was accompanied by a signif-
< 0.001
< 0.001
< 0.001
p
icant negative trend for winter–spring seasonal components
and a significant positive trend for summer–autumn ones (Ta-
ble 2). DIP loads from the Loire ranged between < 0.1 and
Change
(%)
−94
(16 %)
−8.7
(23 %)
Discharge
(m3 s−1 )
15 mol s−1 for the period 1990–2013, with the trend display-
ing oscillations reflecting the influence of river discharge
0.01
0.02
p
(Fig. 3c). For the common period, the Loire DIP loads de-
creased significantly by 52 % (Table 1). The seasonality plot
Vilaine
of DIP loads from the Loire reflected that of discharge, with
Loire
Site
VB
annual minimum and maximum values always observed in
www.biogeosciences.net/16/1361/2019/ Biogeosciences, 16, 1361–1380, 2019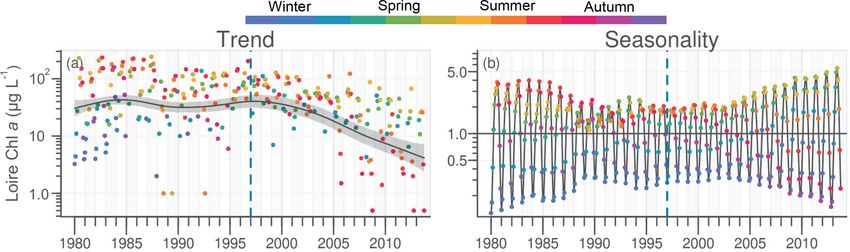
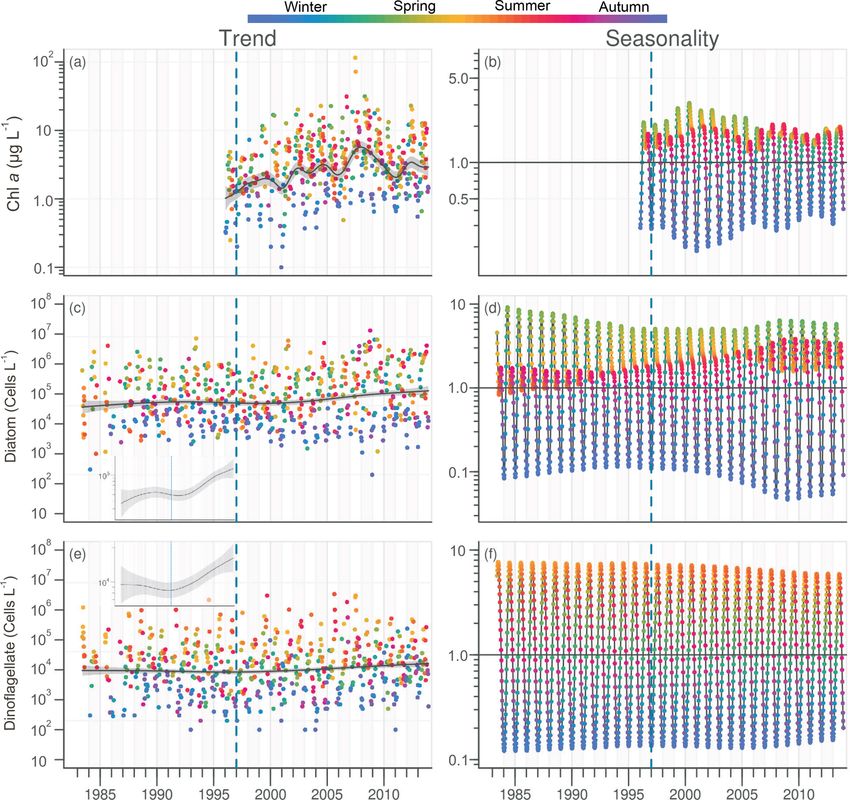
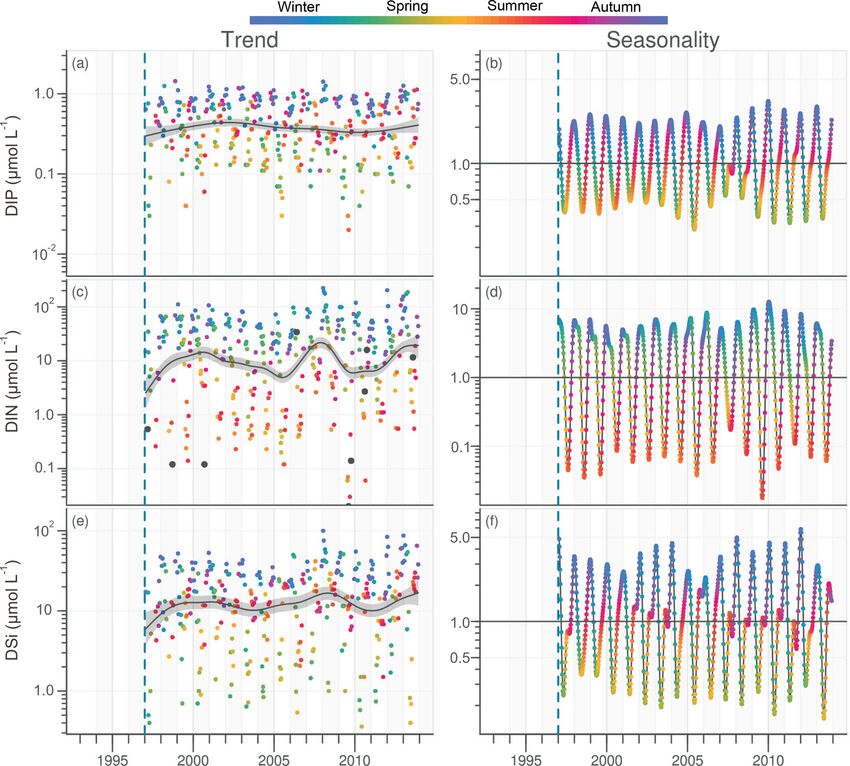
1366                                           W. Ratmaya et al.: Reduced phosphorus loads from the Loire and Vilaine rivers

Figure 2. Long-term trend and seasonality of the Loire discharges. Dark grey lines represent DLM trends. Shaded areas indicate the 90 %
confidence interval. Each dot in the trend plot (a) represents an observed value, and those in the seasonality plot (b) represent values estimated
by the model. In the seasonality plot, the horizontal line (y = 1.0) indicates seasonal components for which fitted values were equal to the
trend. The dashed vertical blue line indicates the beginning of the longest common period for all studied variables in rivers and in the VB
(1997–2013).

summer and winter, respectively (Fig. 3d). Trends of DIP                   remained stable between 1980 and 2000 before decreasing
concentration and DIP loads for the Vilaine were similar to                subsequently (Fig. 5a). For the common period, the Loire
those for the Loire (Fig. S3, Tables 1, 2), as indicated by a              Chl a decreased by 93 % (54 µg L−1 ; Table 1). The DLM
significant correlation between annual medians of DIP in the               Loire Chl a seasonality plot displayed a shift in timing of
two rivers (Table 3).                                                      the annual Chl a maximum, as indicated by its change in
   DIN in the Loire ranged between 11 and 489 µmol L−1 for                 color from orange/red (summer) during 1980–1990 to green
the period 1980–2013, with the trend displaying a decrease                 (spring) during 2005–2013 (Fig. 5b). For the common pe-
between the 1980s and the early 1990s, followed by an in-                  riod, this change in timing was accompanied by a significant
crease (Fig. 4a). However, the increase was not significant for            negative trend for autumn seasonal components and signif-
the common period (Table 1). The DLM Loire DIN season-                     icant positive trend for winter and spring (Table 2). Results
ality plot indicated a decrease in the seasonal amplitude start-           for Chl a in the Vilaine revealed a similar trend and season-
ing in 1990 (Fig. 4b). For the common period, this decreasing              ality to those in the Loire (Fig. S6, Tables 1, 2), as indicated
amplitude resulted from a significant decrease in winter DIN               by a significant correlation between Chl a annual medians in
maxima on the one hand and significant increase in summer                  the two rivers (Table 3).
minima on the other hand (Table 2) by around 60 µmol L−1
(Fig. 4a). The DIN loads from the Loire varied from < 1.0                  3.2    Long-term trends in eutrophication parameters in
to 1142 mol s−1 and displayed a similar trend and seasonal-                       the VB
ity to those of DIN (Fig. 4c, d), with an increase in summer
minima from around 5 to 50 mol s−1 for the common period                   DIP in the VB varied between < 0.1 and > 1.0 µmol L−1
(Fig. 4c, Table 2). The trend of DIN in the Vilaine displayed              with no noticeable trend (Fig. 6a). A significant decrease
an oscillation (Fig. S4), with a slight significant decrease over          of 0.05 µmol L−1 was detected over the common period (Ta-
the common period (Table 1) and no marked variation in the                 ble 1). The seasonality plot of the VB DIP revealed a change
seasonality (Fig. S4b, Table 2). As for the Loire, the trend               in timing of the minimum values, as indicated by its change
and seasonality of DIN loads from the Vilaine were similar                 in color from yellow/orange (summer) before 2006 to green
to those of DIN (Fig. S4c, d, Tables 1, 2).                                (spring) afterwards (Fig. 6b). This shift was accompanied by
   DIN : DIP ratios in both rivers ranged between 1.0 and                  a significant negative linear trend for spring seasonal compo-
1000, with > 80 % of values being higher than 30, and dis-                 nents and a significant positive trend for summer (Table 2).
played an increasing trend between 1990 and 2013 (Fig. S5).                   DIN in the VB varied between < 1.0 and > 200 µmol L−1 ,
A significant increase of 85 % and 303 %, respectively, for                with the trend displaying an oscillation (Fig. 6c). A signifi-
the Loire and the Vilaine, was detected for the common                     cant increase of 3.2 µmol L−1 was detected for the common
period (Table S3). DSi in rivers ranged between 46 and                     period (Table 1). The DLM seasonality indicated that this in-
261 µmol L−1 in the Loire and from 5.0 to 201 µmol L−1                     crease was focused in winter (Fig. 6d, Table 2). Annual DIN
in the Vilaine for the period of available data (2002–2013).               medians in the VB were positively correlated with those of
More than 80 % of DIN : DSi ratios in rivers were higher than              discharge from the two rivers (Table 3).
the theoretical molar N : Si ratio of 1 for the potential require-            DSi in the VB varied between < 1.0 and 100 µmol L−1
ment of diatoms (data not shown).                                          without a noticeable trend (Fig. 6e). For the common period,
   Chl a in the Loire ranged between > 200 µg L−1 during                   a significant increase of 3.6 µmol L−1 was detected, which
the 1980s and < 1.0 µg L−1 in the 2010s. The Chl a trend                   was comparable to that of DIN (Table 1). The seasonality did

Biogeosciences, 16, 1361–1380, 2019                                                                www.biogeosciences.net/16/1361/2019/
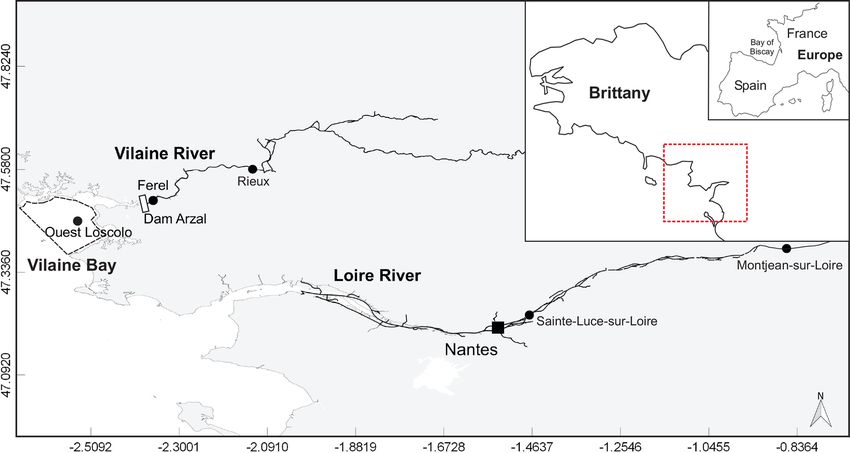
Table 2. Statistical results of the modified Mann–Kendall test performed on DLM seasonal components of eutrophication parameters in rivers and in the VB for the common period
                                       1997–2013. If the test was significant at p < 0.05, percentages of changes relative to the initial values of Sen’s robust line were calculated. Increasing or decreasing trends are indicated
                                       by + and − signs, respectively. NS denotes non-significant values.

www.biogeosciences.net/16/1361/2019/
                                        Site/       Discharge           DIP                 DIP loads              DIN              DIN loads            DSi               Chl a               Diatoms            Dinoflagellates
                                        season      (m3 s−1 )        (µmol L−1 )            (mol s−1 )          (µmol L−1 )         (mol s−1 )        (µmol L−1 )        (µg L−1 )            (cells L−1 )         (cells L−1 )
                                                      p     %           p          %          p          %        p           %       p          %       p     %          p          %           p           %        p         %
                                        Loire
                                        Winter      0.63   NS       0.04     −23 %      < 0.01     −41 %        0.02   −24 %      < 0.01   −40 %                    < 0.001    +190 %
                                        Spring      0.50   NS    < 0.001     −28 %        0.02     −33 %        0.21     NS         0.49     NS                     < 0.001    +283 %
                                        Summer      0.60   NS    < 0.001     +33 %     < 0.001     +59 %      < 0.01   +55 %        0.01   +69 %                       0.09       NS
                                        Autumn      0.98   NS     < 0.01     +35 %        0.26       NS         0.29     NS         0.92     NS                     < 0.001     −82 %
                                        Vilaine
                                        Winter      0.23   NS       0.02     −17 %         0.07          NS     0.90      NS        0.11         NS                  < 0.01     +97 %
                                        Spring      0.93   NS       0.06        NS         0.07          NS     0.99      NS        0.56         NS                 < 0.001     +63 %
                                        Summer      0.26   NS    < 0.001     +9.4 %        0.09          NS     0.29      NS        0.28         NS                 < 0.001     −41 %
                                        Autumn      0.97   NS       0.51        NS         0.40          NS     0.66      NS        0.69         NS                    0.01     −44 %
                                        VB
                                                                                                                                                                                                                                       W. Ratmaya et al.: Reduced phosphorus loads from the Loire and Vilaine rivers

                                        Winter                      0.73       NS                               0.03   +32 %                          0.329   NS       0.11       NS         0.85       NS          0.05     NS
                                        Spring                   < 0.001     −30 %                              0.10     NS                           0.086   NS    < 0.001     −36 %        0.93       NS          0.83     NS
                                        Summer                   < 0.001     +80 %                              0.17     NS                           0.085   NS       0.19       NS      < 0.001     +43 %      < 0.001   −23 %
                                        Autumn                      0.94       NS                               0.76     NS                           0.647   NS       0.37       NS         0.27       NS          0.87     NS

Biogeosciences, 16, 1361–1380, 2019
                                                                                                                                                                                                                                       1367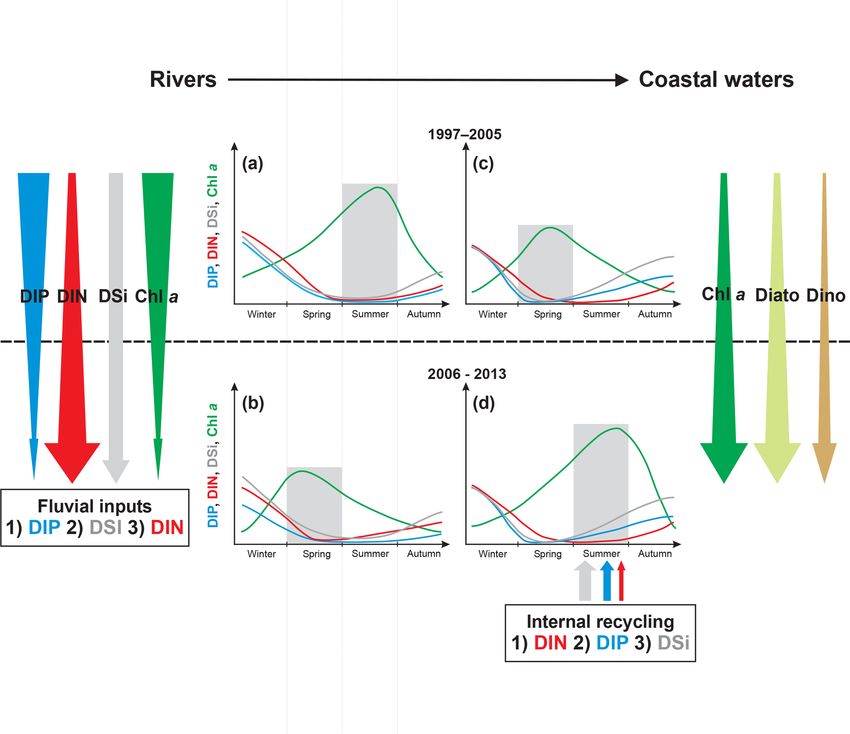
1368                                          W. Ratmaya et al.: Reduced phosphorus loads from the Loire and Vilaine rivers

Figure 3. Long-term trend and seasonality of DIP in the Loire (a, b) and DIP loads from the Loire (c, d). See Fig. 2 for details.

Figure 4. Long-term trend and seasonality of DIN in the Loire (a, b) and DIN loads from the Loire (c, d). Black dots represent data considered
as outliers (see Sect. 2.3.2). See Fig. 2 for details.

not indicate any particular change (Fig. 6f, Table 2). Annual            trends for dissolved inorganic nutrient ratios in the VB dis-
DSi medians in the VB were positively correlated with those              played a significant increase for the common period (Fig. S7,
of the Loire discharge and with the VB DIN (Table 3).                    Table S3).
   DIN : DIP and DIN : DSi ratios in the VB ranged between                  Chl a in the VB ranged between 0.1 and 116 µg L−1 ,
< 1.0 and 650 and from < 0.1 to 44, respectively (Fig. S7).              with the trend displaying an increase (Fig. 7a). For the com-
Summer values of DIN : DIP and DIN : DSi ratios were often               mon period, the VB Chl a increased significantly by 126 %
below theoretical values of 16 and 1, respectively, for poten-           (2.1 µg L−1 ; Table 1). The seasonality plot of Chl a in the
tial requirements of diatoms (Fig. S7). DSi : DIP ratios in the          VB displayed a shift in the timing of the annual maximum,
VB ranged between < 5.0 and > 100, with > 80 % of val-                   indicated by its change in color from green (spring) be-
ues being above the theoretical value of 16 (Fig. S7). The               fore 2006 to orange/red (late summer) afterwards (Fig. 7b).

Biogeosciences, 16, 1361–1380, 2019                                                             www.biogeosciences.net/16/1361/2019/
W. Ratmaya et al.: Reduced phosphorus loads from the Loire and Vilaine rivers                                                           1369

Figure 5. Long-term trend and seasonality of Chl a in the Loire. See Fig. 2 for details.

Table 3. Spearman’s rank correlations between annual median values of river discharge, nutrient concentrations and phytoplankton biomass
in the Loire, Vilaine and the VB for the common period 1997–2013 (n = 17). Asterisks designate significant correlations (∗∗∗ p < 0.001,
∗∗ p < 0.01, ∗ p < 0.05).

                           Loire     Vilaine     DIN      DIP       Chl a          DIN       DIP     Chl a     DIN     DIP    DSi    Chl a
                       discharge   discharge    Loire    Loire      Loire       Vilaine   Vilaine   Vilaine     VB     VB     VB      VB
   Loire discharge         1.00
   Vilaine discharge    0.88∗∗∗        1.00
   DIN Loire              0.52∗        0.39     1.00
   DIP Loire              0.51∗        0.43     0.44      1.00
   Chl a Loire           −0.08       −0.06      0.25      0.35      1.00
   DIN Vilaine             0.33        0.47     0.02     0.55*     0.59*         1.00
   DIP Vilaine             0.16        0.24     0.23    0.77∗∗     0.65∗         0.54       1.00
   Chl a Vilaine         −0.21       −0.28      0.31      0.20    0.64∗∗         0.04       0.35      1.00
   DIN VB                0.78∗∗      0.74∗∗     0.36      0.35     −0.10         0.29      −0.01     −0.20     1.00
   DIP VB                  0.13      −0.09      0.07      0.38      0.05         0.11       0.29      0.19    −0.12    1.00
   DSi VB                 0.55∗        0.41     0.35      0.08     −0.48        −0.17      −0.51     −0.31    0.63∗   −0.02   1.00
   Chl a VB                0.11        0.17    −0.14    −0.48     −0.61∗        −0.34     −0.58∗    −0.50∗     0.25   −0.45   0.33    1.00

This change was accompanied by a significant negative lin-                  4    Discussion
ear trend for spring seasonal components (Table 2). Annual
Chl a medians in the VB were negatively correlated with                     The sequence of causes and effects between eutrophication
those of Chl a from both rivers and with DIP in the Vilaine                 in continental aquatic ecosystems and in those located down-
(Table 3).                                                                  stream can be studied by observing trends of eutrophication
   Diatom abundances varied between 200 and 1.3 ×                           indicators using the same tool and observing trends during
107 cells L−1 for the period 1983–2013, with the DLM trend                  the same periods. In the present study, eutrophication tra-
showing an increase (Fig. 7c). For the common period, di-                   jectories in the downstream VB coastal waters during recent
atom abundances increased significantly by 227 % (90 ×                      decades were examined, through long-term trends of phyto-
103 cells L−1 ; Table 1). Although diatom abundances con-                   plankton biomass and nutrient concentrations, in relation to
tinued to peak in spring (Fig. 7d), their seasonality plot                  the restoration of the eutrophic Loire and Vilaine rivers. The
indicated a significant increase in summer seasonal com-                    DLM analysis provided the opportunity to explore trends and
ponents over the common period (Table 2). Dinoflagellate                    changes in seasonality in a visual manner with figures dis-
abundances were about 10-fold less than those of diatoms,                   playing individual data. The modified nonparametric Mann–
with values ranging between 40 and 3.4 × 10⁶ cells L−1 over                 Kendall test applied to DLM trend and seasonal components
the period 1983–2013. Like diatoms, the DLM trend for                       of all variables over the common period has permitted cor-
dinoflagellate abundances in the VB displayed an increase                   roboration of DLM observations. Overall results demonstrate
(Fig. 7d). For the common period, dinoflagellates’ abun-                    that upstream recoveries from eutrophication were accom-
dances increased by 8×10³ cells L−1 (108 %; Table 1). How-                  panied by increased eutrophication downstream. The signifi-
ever, the DLM seasonality plot indicated that summer sea-                   cant reduction in P input relative to N was not enough to miti-
sonal components of dinoflagellate abundances, correspond-                  gate eutrophication all along this river–coastal marine contin-
ing to the dinoflagellate annual peak, displayed a significant              uum. More reduction of N input, paying particular attention
decreasing trend over the common period (Fig. 7f, Table 2).                 to diffuse N sources, is necessary to mitigate eutrophication
                                                                            effectively in the VB coastal waters.

www.biogeosciences.net/16/1361/2019/                                                                 Biogeosciences, 16, 1361–1380, 2019
1370 W. Ratmaya et al.: Reduced phosphorus loads from the Loire and Vilaine rivers
Figure 6. Long-term trend and seasonality of DIP (a, b), DIN (c, d) and DSi (e, f) in the VB. Black dots represent data considered as outliers
(see Sect. 2.3.2). See Fig. 2 for details.
4.1 Eutrophication trajectories at the river basin outlet ter reached limiting concentrations for phytoplankton, as de-
duced at Montjean on the Loire by Garnier et al. (2018). The
change in timing of the annual DIP minima from summer to
The decrease in Chl a in pre-estuarine stations on the Loire
spring in the Loire and Vilaine rivers during the last decades
and Vilaine rivers over the past decades reflects the global
of the studied period, concomitant with that of the annual
diminution in eutrophication in North American and Euro-
peak of Chl a, can be explained by the increasingly early de-
pean rivers (Glibert et al., 2011; Romero et al., 2013; Dupas
pletion of DIP by phytoplankton (see Floury et al., 2012, for
et al., 2018). This decrease in Chl a was also observed in the
the Loire).
Upper and Middle Loire (Larroudé et al., 2013; Minaudo et
The trend of DIN in studied rivers reveals the general
al., 2015). However, the Loire did not retrieve its oligotrophic
trends observed in other large European rivers, showing a
state of the 1930s (Crouzet, 1983). At the studied stations,
slight decrease, a steady trend or even an increase, depend-
the annual Chl a peak decreased and shifted from late sum-
ing on the degree of fertilizer application in catchment areas
mer to spring (Fig. 8a, b). The parallel decrease of DIP and
(Bouraoui and Grizzetti, 2011; Romero et al., 2013). The in-
Chl a in the Loire and Vilaine rivers underlines the role of
crease in summer Loire DIN since the early 1990s was off-
decreasing P in reducing phytoplankton biomass (Descy et
set by the decrease in winter values, which is related to the
al., 2012; Minaudo et al., 2015), as also found in other river
reduction in N point source emissions and N fertilizer appli-
systems, such as the Danube (Istvánovics and Honti, 2012),
cation (Poisvert et al., 2016; data from French Ministry of
the Seine (Romero et al., 2013) and some Scandinavian rivers
Agriculture, Sylvie Lesaint, personal communication, 2017).
(Grimvall et al., 2014). This decreasing trend of DIP is a re-
An increase in summer DIN of several tens of micromole per
sult of improved sewage treatment, decreased use of P fer-
liter was also reported in the Middle Loire (Minaudo et al.,
tilizers and the removal of P from detergents (Bouraoui and
2015). This increase in summer DIN is the result of a delayed
Grizzetti, 2011). However, the decline of Chl a in both stud-
response due to the long transit time of DIN through soils and
ied rivers began several years after that of DIP when the lat-
Biogeosciences, 16, 1361–1380, 2019 www.biogeosciences.net/16/1361/2019/W. Ratmaya et al.: Reduced phosphorus loads from the Loire and Vilaine rivers 1371 Figure 7. Long-term trend and seasonality of Chl a (a, b), diatom (c, d) and dinoflagellate (e, f) in the VB. Insets display trends of diatom and dinoflagellate abundances with optimal scale. See Fig. 2 for details. aquifers in the Loire catchment (up to 14 years; Bouraoui and and potentially in receiving coastal waters, regardless of the Grizzetti, 2011). The decreasing DIN uptake by phytoplank- season. ton in the Loire may have also contributed to the increase in summer DIN (Lair, 2001; Floury et al., 2012). Concern- 4.2 Eutrophication trajectories in the VB ing the Vilaine, the slight decrease in DIN from the early 1990s reflects the decrease in N fertilizer application in the In contrast to what happened in rivers, eutrophication in the Vilaine catchment (Bouraoui and Grizzetti, 2011; Aquilina downstream VB coastal waters has worsened during recent et al., 2012), which is facilitated by a relatively short transit decades, as indicated by a significant increase in Chl a, also time of DIN in the Vilaine watershed (∼ 5–6 years; Molenat confirmed by the significant augmentation of both diatom and Gascuel-Odoux, 2002; Aquilina et al., 2012). and dinoflagellate abundances. The increase in Chl a in the DSi data series in both rivers were too short to investigate VB was accompanied by a shift in its annual peak from long-term trends and seasonality but provided values in or- spring to summer (Fig. 8c, d). This modification in the sea- der to examine nutrient stoichiometry. Larroudé et al. (2013) sonal course of phytoplankton biomass coincides with the observed no significant trend in DSi between 1985 and 2008 increase in diatom abundances, occurring mainly in sum- in the Middle Loire, as also confirmed at Montjean station mer. The dynamics of phytoplankton in the VB during the by Garnier et al. (2018). The decrease in DIP led to the in- last decade of the studied period thus underwent important creasing trend of DIN : DIP ratios, and probably DSi : DIP, changes: (1) an increase in biomass, (2) a change in timing in both rivers, as was observed in numerous rivers (Beusen of the annual peak from spring to summer and (3) a modifi- et al., 2016). Based on these trends, the DIP limitation has cation in the seasonal course of diatoms and dinoflagellates. thus been reinforced in studied rivers during the last decades, www.biogeosciences.net/16/1361/2019/ Biogeosciences, 16, 1361–1380, 2019
1372                                         W. Ratmaya et al.: Reduced phosphorus loads from the Loire and Vilaine rivers

Figure 8. Graphical representation of the major changes in phytoplankton and nutrient concentrations in rivers (a, b) and the VB coastal
waters (c, d) for the period 1997–2005 (a, c) and 2006–2013 (b, d). Downward arrows represent long-term trends. Nutrient curves are ranked
from the least limiting (below) to the most limiting (above) according to Redfield ratios. Nutrient inputs from rivers and sediments are also
ranked according to their potential limitation for phytoplankton using Redfield ratios. Benthic nutrient inputs were fitted according to the
measurement of benthic fluxes in summer 2015 (Ratmaya, 2018). Shaded areas underline the season of maximum Chl a.

4.2.1   Increased Chl a                                                  light availability, an increase in sea surface temperature can
                                                                         promote phytoplankton growth due to water column stabi-
The increase in phytoplankton biomass could result from                  lization (Doney, 2006; Boyce et al., 2010) and decreased tur-
several causes, namely decreased predation (overfishing), a              bidity (Cloern et al., 2014). In the VB, except during winter
decrease in commercially grown suspension feeders, an in-                and high hydrodynamic activity periods, phytoplankton pro-
crease in temperature and an increase in nutrient inputs.                duction is limited by nutrients (Guillaud et al., 2008). There-
Increased predation on planktonic herbivores could reduce                fore, the increase in Chl a in the VB was particularly due
grazing on phytoplankton (Caddy, 2000). In the VB, com-                  to enhanced nutrient availability, as also reported in Chinese
mercial fishing targeting small pelagic (herbivorous) species            coastal waters by Wang et al. (2018).
has been banned since 1977 (Dintheer, 1980). The decline
in fisheries in the Bay of Biscay since the 1990s (Rochet et             4.2.2   Changes in timing of annual Chl a peak
al., 2005) was unlikely to have caused increased Chl a in
the VB, since phytoplankton biomass in these oceanic wa-                 Seasonal changes in phytoplankton biomass peaks have been
ters has always been lower than that in the VB (Table S2).               reported in other aquatic ecosystems and mostly attributed to
Grazing activity by bivalve suspension feeders can modify                climate-change-induced temperature (Edwards and Richard-
phytoplankton biomass (Cloern, 1982; Souchu et al., 2001).               son, 2004; Racault et al., 2017). Variations in nutrient avail-
In the VB, there was an increase in commercial mussel pro-               ability can also induce a change in the seasonal pattern of
duction (Mytilus edulis) between 2001 and 2012 (Le Bihan                 phytoplankton biomass (Thackeray et al., 2008; Feuchtmayr
et al., 2013). This should have led to depletion in phyto-               et al., 2012). These authors observed that the advancement in
plankton biomass; in fact the opposite trend was observed.               the timing of the spring diatom bloom in some English lakes
In regions where the phytoplankton productivity is limited by            was related to the increase in winter DIP. In the VB, the shift

Biogeosciences, 16, 1361–1380, 2019                                                            www.biogeosciences.net/16/1361/2019/
W. Ratmaya et al.: Reduced phosphorus loads from the Loire and Vilaine rivers 1373
in annual Chl a peak from spring to summer, coupled with note et al., 1980). The transfer of nutrients from continents to
the change in position of the annual DIP minima from sum- coastal waters is largely determined by freshwater inputs, the
mer to spring, suggests that DIP depletion by phytoplank- dynamics of which depend largely on precipitation in water-
ton bloom occurred progressively earlier during the last two sheds. Trends in the Loire and the Vilaine discharges dis-
decades. Based on nutrient concentrations and stoichiometry played similar oscillations to those of rivers flowing to the
(Justić et al., 1995), the first nutrient-limiting phytoplankton North Sea as reported by Radach and Pätsch (2007), sug-
biomass in the VB shifts seasonally from DIP in spring to gesting a common hydroclimatic pattern in western Europe
DIN in summer, as verified by bioassays (Michaël Retho et linked to the North Atlantic Oscillation. The decrease in the
al., Ifremer, unpublished data). The conjunction of the de- Loire discharge observed between 1997 and 2013 was also
crease in DIP and an increase in DIN in the VB has probably found in the middle section of the river for the period 1977–
also contributed to the shift in annual Chl a. 2008 (Floury et al., 2012) and was attributed essentially to
abstraction for irrigation and drinking water by these authors.
4.2.3 Role of DSi in the seasonal course of diatoms and The strong correlation between Loire and Vilaine discharges
dinoflagellates underlines the similarities between the two rivers concerning
the precipitation regime. However, with a 10-fold higher dis-
In terms of nutrients, the balance between diatoms and di- charge than the Vilaine, the Loire remains the main source
noflagellates is predominantly regulated by the DSi avail- of freshwater for the northern Bay of Biscay, with a major
ability (Egge and Aksnes, 1992). In the VB, based on nu- role in the eutrophication of coastal waters in south Brittany,
trient concentrations and stoichiometry, diatoms were rarely including the VB (Guillaud et al., 2008; Ménesguen et al.,
limited by the DSi availability, thanks probably to internal 2018a, 2019). Aside from flood periods, the closure of the
DSi regeneration, as suggested by Lunven et al. (2005) and Arzal dam during the low-water periods (Traini et al., 2015)
Loyer et al. (2006) in the northern Bay of Biscay continen- makes nutrient inputs into the VB by the Vilaine negligible
tal shelf. The fact that diatoms have increased more than di- in summer, compared to those from the Loire.
noflagellates in the VB contradicts the idea that excessive
DIN and DIP inputs favor phytoplankton species, which do
not require DSi (Conley et al., 1993; European Commu- 4.3.2 Role of estuaries and the Vilaine dam
nities, 2009; Howarth et al., 2011). An increase in diatom
abundances during the eutrophication process was also ob- Biogeochemical processes within estuaries may alter the nu-
served in Tolo Harbor (Yung et al., 1997; Lie et al., 2011) trient transfer from rivers to coastal waters (Statham, 2012).
and the coastal waters of the Gulf of Finland (Weckström et Coupled nitrification–denitrification and ammonification-
al., 2007). Conversely, decreasing eutrophication in the Seto anammox can be a sink of N in estuaries (Abril et al., 2000).
Inland Sea (Yamamoto, 2003), in the Thau lagoon (Collos Inorganic nutrients in estuaries can also be removed by phy-
et al., 2009) and in other Mediterranean lagoons (Leruste et toplankton uptake, which is nonetheless limited by turbid-
al., 2016) was accompanied by the increase in dinoflagellate ity (Middelburg and Nieuwenhuize, 2000). Estuaries can also
abundances to the detriment of diatoms. These observations act as a source of nutrients, resulting from mineralization of
and our results provide evidence that eutrophication can be riverine phytoplankton organic matter (Meybeck et al., 1988;
manifested by an increase in diatom abundances. Middelburg et al., 1996). However, for the studied rivers, this
process may have diminished with the decreasing trend in
4.3 Loire–Vilaine–VB continuum
riverine Chl a. The desorption of loosely bound P from sus-
In theory, several external nutrient sources could have con- pended mineral particles in estuaries can also be a source
tributed to nutrient availability in the VB: atmospheric, of DIP (Deborde et al., 2007). Except during flood periods,
oceanic and riverine inputs. DIN inputs from rainwater es- the suspended particle fluxes from the Loire are generally
timated by Collos et al. (1989) represent only 1 % of river in- low (Moatar and Dupont, 2016). In addition to these bio-
puts, while levels of nutrients and Chl a in the Bay of Biscay geochemical processes, the increase in population around
always remained low during the studied period (Table S2). the Loire estuary (ca. 1 % yr−1 ; INSEE, 2009) during the
The proximity of the VB to the Loire and Vilaine rivers des- last decades could have contributed to the increase in N and
ignates riverine inputs as main external nutrient sources in P inputs. However, inputs of DIN and DIP from wastewa-
these coastal waters (Ménesguen et al., 2018a, b). ter treatment plants in the Loire and Vilaine estuaries have
not increased due to improved treatment techniques (Loire-
4.3.1 Rivers as the main external nutrient source to the Brittany River Basin Authority, Philippe Fera, personal com-
VB munication, 2019). The presence of a dam at the river out-
let may increase water residence time, thus favoring nutri-
Watersheds, rivers and coastal waters located at their out- ent uptake by phytoplankton and loss of N via denitrification
let constitute a continuum in which anthropogenic pollution, (Seitzinger et al., 2006). Unfortunately, for these two studied
generated in watersheds, is transported to coastal zones (Van- rivers, processes in estuaries and the dam are poorly inves-
www.biogeosciences.net/16/1361/2019/ Biogeosciences, 16, 1361–1380, 20191374 W. Ratmaya et al.: Reduced phosphorus loads from the Loire and Vilaine rivers
tigated and quantified, which makes it difficult to estimate ecosystems is related to salinity (Blomqvist et al., 2004). The
their influence on nutrient transfer to coastal zone. presence of sulfate (a major element of salinity) decreases the
Despite influences of estuaries and the dam, the increase efficiency of sediments to retain DIP (Caraco et al., 1990;
in DIN : DIP and DSi : DIP ratios in rivers during the last Lehtoranta et al., 2009) and favors the recycling of DIP over
two decades, with values already largely above the theoret- DIN, the latter being potentially eliminated through deni-
ical value of 16 in the 1990s, has been reflected in the VB trification (Conley, 2000; Conley et al., 2009). In the VB,
coastal waters (Figs. S5, S7). Moreover, significant negative measurements of benthic nutrient fluxes confirm that sedi-
correlations between annual Chl a medians in the VB and ments represent a substantial DIP and DSi source compared
in rivers, as well as significant positive correlations between to riverine inputs (Ratmaya, 2018), allowing summer phyto-
annual medians of DIN and DSi in the VB with those of river plankton production to benefit from surplus DIN inputs from
discharge, suggest that changes in eutrophication parame- the Loire. The increase in summer diatom abundances in the
ters in the VB (i.e., phytoplankton biomass) were related to VB was thus mainly due to increased summer DIN loads
changes in rivers (Ménesguen et al., 2018a, b). Although bio- from the Loire, sustained by internal sources of DIP and DSi
geochemical processes in estuaries and the Vilaine dam may coming from sediments.
introduce bias in nutrient transfer from rivers to the VB, they
are probably not intense enough to decouple the observed 4.4 Implications for nutrient management
trends between rivers and the VB, as suggested by Romero
et al. (2016) for the Seine River–Seine Bay continuum. 4.4.1 Impact of nutrient management strategies
The need to control both N and P inputs to mitigate eutroph-
4.3.3 Link between eutrophication trajectories in
ication along the freshwater–marine continuum is still de-
rivers and in the VB
bated within the scientific community (see Schindler et al.,
2008, 2016; Conley et al., 2009; Schindler, 2012; Paerl et
During the last two decades, the downstream VB coastal wa-
al., 2016). Despite the imbalance between P and N input
ters have received decreasing DIP inputs, increasing DIN in-
reduction, eutrophication in the river section of the Loire–
puts especially from the Loire during summer and no change
Vilaine–VB continuum has diminished but the increase in
in DSi inputs (Fig. 8). The decrease in riverine DIP loads was
phytoplankton biomass in the VB provides evidence that sig-
the cause of the simultaneously decreasing trend in the VB
nificant reduction of P inputs, without concomitant N abate-
DIP and may have reinforced spring DIP limitation, as also
ment, was not yet sufficient to improve water quality along
reported by Billen et al. (2007) in the Seine Bay. The worsen-
the entire continuum. Targeting N and P pollution from point
ing eutrophication in the VB was the consequence of increas-
sources has successfully reduced eutrophication in marine
ing DIN inputs from the Loire. A similar observation was re-
ecosystems, as evidenced in the Tampa Bay (Greening and
ported in other coastal ecosystems, such as the Neuse River
Janicki, 2006) and in several French Mediterranean lagoons
Estuary (Paerl et al., 2004), Belgian coastal waters (Lancelot
(Derolez et al., 2019). However, N pollution in coastal waters
et al., 2007) and the Seine Bay (Romero et al., 2013), where
from rivers with watersheds largely occupied by intensive
decreasing upstream Chl a, due to DIP input reduction, was
agriculture remain problematic in many European countries
accompanied by the increase in downstream Chl a, as a re-
(Bouraoui and Grizzetti, 2011; Romero et al., 2013). Reduc-
sult of increasing DIN input. The seasonal change in annual
ing diffuse N inputs through improved agricultural practices
Chl a peak in the VB also resulted from the conjunction of
and structural changes in the agro-food system (Desmit et
decreasing DIP loads and increasing summer DIN loads from
al., 2018; Garnier et al., 2018) would probably help to lessen
the Loire. The summer limitation of phytoplankton produc-
eutrophication (Conley et al., 2009; Paerl, 2009). Assuming
tion by DIN, rather than a limitation by DIP and especially
that rapid and radical change in farming practices is imple-
DSi in the VB, cannot be explained by the stoichiometry of
mented, the delayed responses due to variations in transit
nutrients in rivers. Internal sources of nutrients, especially
time of NO− 3 in aquifers should be taken into account for
sediments (see below), were also likely to support a signif-
restoration strategy (Bouraoui and Grizzetti, 2011).
icant portion of nutrient availability for phytoplankton pro-
In the VB, a reduction in DIN inputs, especially during
duction during the period of low river discharge (Cowan and
the summer, would probably have prevented eutrophication
Boynton, 1996; Pitkänen et al., 2001).
from worsening in this ecosystem. Given that in many other
coastal ecosystems the first nutrient-limiting phytoplankton
4.3.4 Role of internal nutrient loads
production tends to switch from DIP in spring to DIN in sum-
mer (Fisher et al., 1992; Del Amo et al., 1997; Tamminen and
In shallow ecosystems, internal nutrient recycling can regu-
Andersen, 2007), it would be relevant to take into account
late phytoplankton production and potentially exacerbate eu-
seasonal aspects for nutrient reduction strategy.
trophication (Paerl et al., 2016), as observed both in lakes
(Jeppesen et al., 2005) and coastal ecosystems (Pitkänen et
al., 2001). Compared to freshwater, the fragility of marine
Biogeosciences, 16, 1361–1380, 2019 www.biogeosciences.net/16/1361/2019/You can also read


