Methane-Derived Authigenic Carbonates on the Seafloor of the Laptev Sea Shelf
←
→
Page content transcription
If your browser does not render page correctly, please read the page content below
ORIGINAL RESEARCH
                                                                                                                                              published: 28 July 2021
                                                                                                                                    doi: 10.3389/fmars.2021.690304

                                            Methane-Derived Authigenic
                                            Carbonates on the Seafloor of the
                                            Laptev Sea Shelf
                                            Marina D. Kravchishina 1* , Alla Yu Lein 1 , Mikhail V. Flint 1 , Boris V. Baranov 1 ,
                                            Alexey Yu Miroshnikov 2 , Elena O. Dubinina 2 , Olga M. Dara 1 , Andrey G. Boev 1 and
                                            Alexander S. Savvichev 3
                                            1
                                             Shirshov Institute of Oceanology, Russian Academy of Sciences, Moscow, Russia, 2 Institute of Geology of Ore Deposits,
                                            Petrography, Mineralogy, and Geochemistry, Russian Academy of Sciences, Moscow, Russia, 3 Federal Research Centre
                                            “Fundamentals of Biotechnology,” Winogradsky Institute of Microbiology, Russian Academy of Sciences, Moscow, Russia

                                            Seafloor authigenic carbonate crusts are widespread in various oceanic and marine
                          Edited by:
                                            settings, excluding high-latitude basins that are corrosive to carbonate precipitation.
                     Tommaso Tesi,          Newly formed carbonate formations are relatively rare in modern Arctic marine
National Research Council (CNR), Italy      sediments. Although the first-order principles of seep carbonate formation are currently
                        Reviewed by:        quite well constrained, little is known regarding the duration or mode of carbonate
                        Daniel Smrzka,
          University of Vienna, Austria     formation in the Siberian Arctic shelf. Large (massive slabs or blocks) and small crusts
                     Anna Yurchenko,        that were micrite cemented have been recently discovered on the seafloor of the
         Skolkovo Institute of Science
              and Technology, Russia
                                            Siberian Arctic seas within the area of known seep activity in the outer Laptev Sea shelf.
                  *Correspondence:
                                            Cold methane seeps were detected in the area due to the presence of an acoustic
               Marina D. Kravchishina       anomaly in the water column (gas flares). Microbial mats, methane gas bubbles, and
               kravchishina@ocean.ru        carbonate crusts were observed using a towed camera platform. Here, we report new
                   Specialty section:
                                            geochemical and mineralogical data on authigenic shallow Siberian Arctic cold-seep
         This article was submitted to      carbonate crusts to elucidate its genesis. The Laptev Sea carbonate crusts mainly
             Marine Biogeochemistry,
                                            consist of high-Mg calcite (up to 23 mol % MgCO3 ). The δ13 C values in carbonates
               a section of the journal
          Frontiers in Marine Science       range significantly (from –40.1 to –25.9h VPDB), while the δ18 O values vary in a
             Received: 02 April 2021        narrow range (+4.4 ± 0.2h VPDB). The δ13 C values of Corg that was determined
            Accepted: 25 June 2021          from carbonates range from –40.2 to –31.1h VPDB. Using the isotope data and taking
            Published: 28 July 2021
                                            into account the geological setting, we consider that not only microbial but possibly
                             Citation:
          Kravchishina MD, Lein AYu,
                                            thermogenic methane participated in the authigenic carbonate precipitation. Carbonate
                Flint MV, Baranov BV,       crust formation occurred below the water/sediment interface of the shallow Siberian
      Miroshnikov AYu, Dubinina EO,
                                            Arctic shelf as a result of gas hydrate dissociation during Holocene warming events. The
Dara OM, Boev AG and Savvichev AS
  (2021) Methane-Derived Authigenic         studied carbonate crusts were exhumated after precipitation into shallow subsurface
    Carbonates on the Seafloor of the       shelf sediments.
                     Laptev Sea Shelf.
           Front. Mar. Sci. 8:690304.       Keywords: Siberian Arctic seas, biogeochemistry, methane, authigenic carbonates, carbon isotopes, cold seeps,
    doi: 10.3389/fmars.2021.690304          carbonate diagenesis

Frontiers in Marine Science | www.frontiersin.org                                 1                                             July 2021 | Volume 8 | Article 690304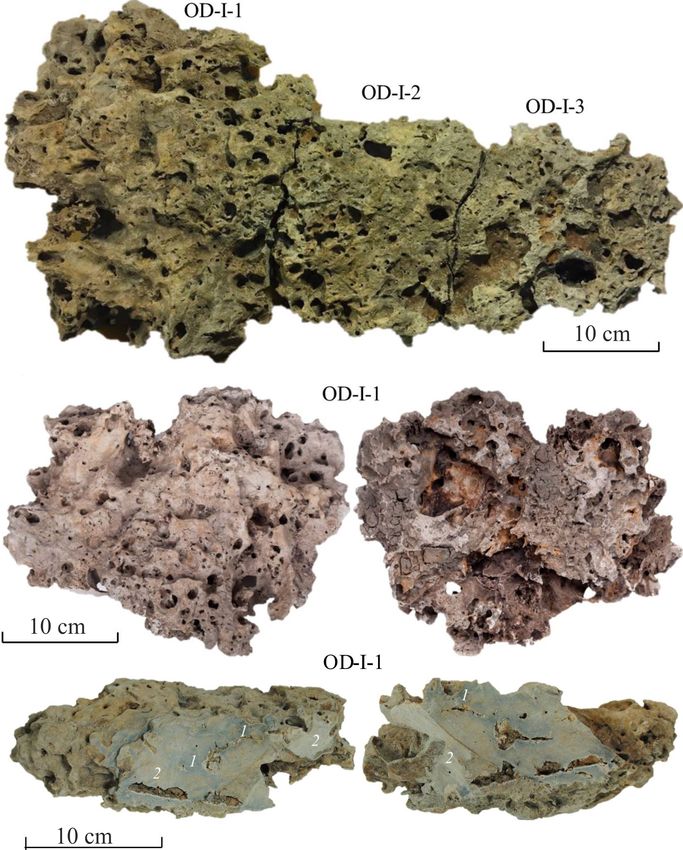
Kravchishina et al.                                                                                           Methane-Derived Authigenic Carbonates

INTRODUCTION                                                               Schubert et al., 1997; Lein et al., 1999; Kravchishina et al., 2017;
                                                                           Savvichev et al., 2018a, etc.). MDAC were found as Mg-calcite
Authigenic carbonate precipitation at cold seeps is a common               cement and pavement-forming crusts at the sediment–water
process (e.g., Schrag et al., 2013; Suess, 2014; Oppo et al., 2020).       interface of various high latitudinal seas, such as in the North Sea
Due to climate change, studies regarding carbonate formation               at depths of 120–300 m (Crémière et al., 2016b; Mazzini et al.,
in Arctic shelf seas are of particular importance. In these seas,          2016), in the Norwegian Sea at 220 m (Sauer et al., 2017), and
carbonates derived from bicarbonate, which are formed during               in the Barents Sea at 220–400 m (Crémière et al., 2016a; Hong
the microbial oxidation of methane of different genesis, are               et al., 2017; Argentino et al., 2021). They were also observed in
relatively rare (Logvina et al., 2018; Ruban et al., 2020 and              other climatic zones, such as the Green Canyon in the northern
references therein). Methane is a potent greenhouse gas (Weber             Gulf of Mexico (Bian et al., 2013). Overall, the dominant mineral
et al., 2019). Its increase in the atmosphere may lead to positive         phases are Mg-calcite and aragonite in cold seep carbonates (see
feedbacks with global warming (Yvon-Durocher et al., 2014;                 review in Suess, 2014). MDACs with predominating aragonite
Dean et al., 2018). Anaerobic oxidation of methane (AOM),                  cement typically form at or close to the seafloor (Suess, 2014),
which favors in authigenic carbonate formation, is a filter that           where sufficiently high sulfate concentrations inhibit high-Mg
reduces the natural emission of methane acting as a carbon sinks           calcite formation (e.g., Bohrmann et al., 1998; O’Reilly et al., 2014;
(e.g., Devol and Ahmed, 1981; Boetius et al., 2000; Valentine,             Prouty et al., 2016).
2002; Peckmann and Thiel, 2004; Reeburgh, 2007; Knittel and                    Recently, reports of MDAC in high-latitude seas have
Boetius, 2009). Ultimately, the contribution of the ocean to the           increased (Joseph et al., 2013; Crémière et al., 2016a; Hong
global balance of methane in the atmosphere is very small.                 et al., 2017; Kravchishina et al., 2017; Sauer et al., 2017; Åström
Estimates vary from approximately 6–3% (Weber et al., 2019)                et al., 2018). The main goals of studying the MDAC is dating
to 2% (Egger et al., 2018) or less (0.07%, Mau et al., 2017).              the carbonates to reconstruct the history of seepage, and study
The Arctic is characterized by a significant number of methane             the mineralogy or geochemistry to get information regarding
sources reviewed in a paper (O’Connor et al., 2010) and discussed          the paleo-Sulfate-Methane Transition Zone (SMTZ) depth, and
in papers (Fisher et al., 2011; Shakhova et al., 2014; James et al.,       the reconstruction and modeling of their formation processes.
2016; Skorokhod et al., 2016; Thornton et al., 2016; Mau et al.,           Both spatial and temporal changes have been demonstrated
2017), and elevated atmosphere background concentration of                 in methane flow and the associated formation of the MDAC
methane; its mean latitudinal value was approximately 1.85 ppm             (Sauer et al., 2017).
(Shakhova et al., 2010; Thornton et al., 2016). Footprints of local            According to Himmler et al., 2019, three carbonate-forming
methane emissions were observed in the atmosphere above the                methane flows in the Arctic are revealed: (i) during the
Siberian shelf (Skorokhod et al., 2016; Thornton et al., 2016;             Penultimate Glacial Maximum, (ii) during an interstadial in
Pankratova et al., 2018).                                                  the last glacial, and (iii) in the aftermath of the Last Glacial
   Cold methane seeps (methane-rich gas/fluid-escape from                  Maximum. Although the onset of MDAC formation is difficult
sediment) were discovered 35 years ago in the Gulf of Mexico               to establish, Crémière et al., 2016a report that U-Th age
at a depth of 3,200 m (Paull et al., 1984) and in the Oregon               (17.5 ± 0.7 ka) of seep carbonates coincide with the deglaciation
subduction zone located in the eastern Pacific Ocean margin at             of the southwestern Barents Sea (approximately 18–16 ka). The
a depth of 2,036 m (Kulm et al., 1986). Subsequently, methane              widespread methane seepage since the Last Glacial Maximum
seeps have been discovered in all the oceans (Peckmann and                 over the past approximately 20–5 ka was revealed in the European
Thiel, 2004; Ruff et al., 2015; Smrzka et al., 2019). To date, many        Arctic based on U-Th dating of the MDAC (Himmler et al., 2019).
studies have investigated various aspects of authigenic carbonate          During this period, methane released by hydrate destabilization
mineralization and overall methane seepage system functioning.             migrated toward the seafloor (Crémière et al., 2016a). Gas hydrate
These studies have been reviewed in several papers (Lein, 2004;            reservoirs in the European Arctic shelf were affected by the
Judd and Hovland, 2007; Roberts and Feng, 2013; Suess, 2014;               following distinct episodes: subglacial growth (during the glacial
Levin et al., 2016; Åström et al., 2020).                                  epoch) and subsequent dissociation into interglacial stages that
   Carbonates formed due to methane (and its homologs)                     controlled the methane release over the timescale of millennia
oxidation under anaerobic conditions (or under aerobic                     (Serov et al., 2017). Thus Arctic deep-water gas reservoirs are
conditions, given the strong methane influx) occur in                      sensitive to temperature variations over Quaternary time scales
regions with focused hydrocarbon fluid discharge. Carbonate                (Himmler et al., 2019). The MDAC should be considered as
mineralization in the seas of the Siberian Arctic has been                 an archive of information on the long-term evolution of fluid
previously studied (Schubert et al., 1997; Galimov et al., 2006;           flow in methane seeps (Bian et al., 2013). There are limited data
Lein et al., 2013; Krylov et al., 2015; Kravchishina et al., 2017;         on the precise chronology of past methane emission episodes
Logvina et al., 2018). Different types of authigenic carbonates            in the Arctic from which the geological factors controlling
formed during the anaerobic oxidation of methane (AOM)                     methane release may be inferred (Himmler et al., 2019). Data
of various origins were found in the Laptev Sea sediments                  on the U-Th age of the MDAC for the Siberian Arctic seas are
(Kravchishina et al., 2017; Logvina et al., 2018).                         currently unavailable.
   Stable isotopes of C and O, petrography, and the mineralogy                 The Laptev Sea is partly underlain by thawing remnant
of methane-derived authigenic carbonates (MDAC) in the Arctic              permafrost from the last glacial maximum (Romanovskii and
seas have been examined in several studies (Pauly, 1963;                   Hubberten, 2006). The destabilization of intrapermafrost gas

Frontiers in Marine Science | www.frontiersin.org                      2                                         July 2021 | Volume 8 | Article 690304
Kravchishina et al.                                                                                                     Methane-Derived Authigenic Carbonates

hydrates is a possible mechanism for methane emissions in the                      The study area where the carbonate crusts were obtained
Arctic shelf (James et al., 2016; Chuvilin et al., 2019; Puglini et al.,       was located on the Laptev Sea shelf. The center of the area
2020). The simulation of the permafrost-related Gas Hydrate                    was assigned to the location with coordinates 76.894◦ N and
Stability Zone (GHSZ) modeled for the Laptev Sea and East                      127.798◦ E, where the maximum methane content in surface
Siberian Sea shelf zones was included in Romanovskii et al.                    waters was observed (Thornton et al., 2016). These data were
(2005, 2006). The potential thickness of GHSZ was assessed                     obtained during the summer of 2014 on the SWERUS-C3
(approximately 200–250 m), and the evolution of the offshore                   expedition with the Swedish icebreaker Oden; hence, this region
permafrost and GHSZ under the impact of climate changes and                    was called the Oden area (Baranov et al., 2020; Vedenin
glacioeustatic regression–transgression cycles was considered                  et al., 2020). Structurally, the Oden area is located within the
by the authors. Simulation results were compared with field                    Laptev Sea Rift System (Figure 1). The Laptev Sea Rift System
observations. The results of modeling (Romanovskii et al., 2005,               consists of horsts and grabens, which are limited by NW-SE
2006) have shown that at present, the bases of the permafrost and              and N-S-striking faults, stretching from the coast to the shelf
GHSZ in the rifts and fault zones of the East Siberian shelf have              break. On the shelf break, it is intersected by the Khatanga-
moved to lower depths. These uplifts in areas with high oil and                Lomonosov Fault Zone (KLFZ) oriented in the SW-NE direction
gas potential can serve as regions where gasses and their hydrates             (Drachev, 2000).
are concentrated and form the so-called “cryogenic traps.” The                     The KLFZ was identified by the geophysical field pattern and
conditions for the formation of taliks have been identified in                 is considered a transform fault that formed in the Paleocene.
the modeling of the submarine relict permafrost. There are areas               It separates the oceanic lithosphere of the Eurasian Basin from
where complete dissociation of gas hydrates occurs (so-called                  the thinned continental lithosphere of the Laptev Sea (Drachev,
“windows”) in the gas hydrate stability zone (GHSZ) of the East                2000; Shipilov, 2004). The shear nature of this fault zone is
Siberian shelf. Methane discharge through the GHSZ may occur                   established by the displacement of the horst and grabens of the
in the case when the “windows” coincide with the taliks during                 Laptev Sea Rift System (Shkarubo et al., 2014). The KLFZ display
the transgressions (Romanovskii et al., 2006; Rekant et al., 2015;             evidence of modern transform fault activity (Baranov et al., 2018).
Piskunova et al., 2018). Semiletov et al. (2012) reviewed factors              North of the KLFZ, in the deep-water basin, the rifting of the
controlling CH4 release from the East Siberian shelf and the                   Laptev Sea shelf is replaced by ultra-slow spreading on the Gakkel
hypothesis of permafrost-related Arctic hydrates.                              Ridge (Gramberg et al., 1990; Drachev, 2000; Franke et al., 2001;
    We also acknowledge that the fate of methane in sub-                       Gusev et al., 2002).
seafloor Arctic Ocean reservoirs in a warming world is far from
certain (James et al., 2016; Puglini et al., 2020). The faults as a
system of conduits for thermogenic gas migration from deeper
hydrocarbon reservoirs (Mau et al., 2017; Plaza-Faverola and
Keiding, 2019) have been considered in the Laptev Sea in the
recent article by Baranov et al. (2020). The presence of gas
reservoirs/gas pockets is confirmed by multichannel seismic data
obtained on the Laptev Sea shelf (Bogoyavlensky et al., 2018).
Seepages of thermal gas from the sedimentary column into the
sea water were detected at two locations at the northern margin
of the shelf (Cramer and Franke, 2005).
    Here, we combine datasets for mineralogy and geochemistry
of carbonate crusts and the surface layer of bottom sediments
collected during the summer expedition of 2017 in the Laptev
Sea. The objective of our research was to study the composition,
morphology, and macro- and microstructure of carbonate crusts,
as well as to establish the genesis of methane, which took part in
the formation of authigenic carbonates.

GEOLOGICAL SETTING
Carbonate crusts have been collected by the Sigsbee trawl from
                                                                                FIGURE 1 | Map of the study area in the Laptev Sea, grid is from IBCAO V.3
a depth of 63 m while studying the macrofauna within the area                   (Jakobsson et al., 2012). Contour lines of 100, 50, and 25 m are shown on
of active methane discharge in the Laptev Sea (Vedenin et al.,                  the shelf. Filled squares mark the C15 and Oden (OD) study areas, crosses
2020). Carbonates have been found approximately 50 km away                      indicate sampling areas, thick lines 1 and 2 mark location of the profiles shown
from the C15 methane seep area (∼50 × 50 m, 76◦ 46.34 N and                     in Figure 2. Gray color shows the domain of methane seep fields according
                                                                                to data from Shakhova et al. (2015). The double red line is the axis of the
125◦ 49.75 E, 71 m depth), which was investigated in 2015 (Flint
                                                                                Gakkel Ridge, the dashed red line is the Khatanga-Lomonosov Fault Zone,
et al., 2016; Kravchishina et al., 2017; Demina and Galkin, 2018;               and the red lines are the faults of the Laptev Sea Rift System (Drachev, 2000).
Savvichev et al., 2018a).

Frontiers in Marine Science | www.frontiersin.org                          3                                               July 2021 | Volume 8 | Article 690304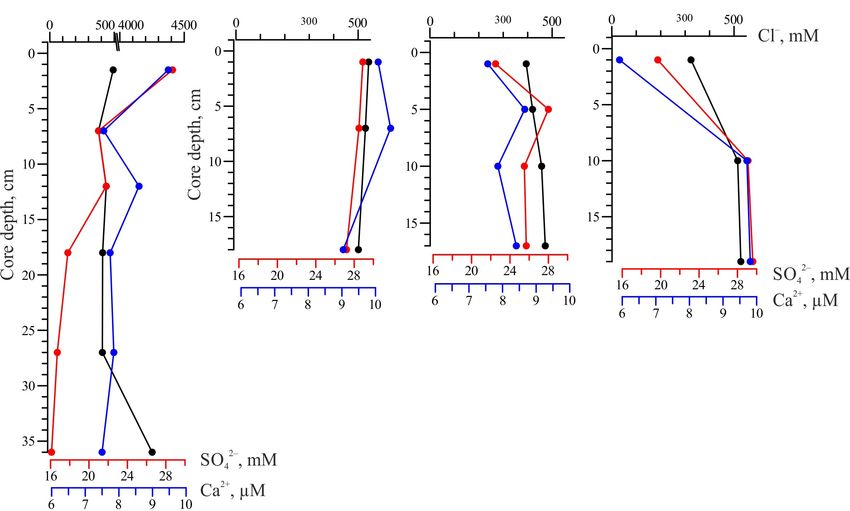
Kravchishina et al.                                                                                        Methane-Derived Authigenic Carbonates

    The relief of the Laptev Sea shelf is characterized by a system        batteries, and video cameras towed at a speed of 0.5 knots.
of basement depressions and heights, which have an N-S and                 Videos were recorded with a high-resolution BEWARD BD
NW-SE strike. Structurally, they correspond to rifts and horsts            3270Z camera and stored electronically in AVI format.
filled by sediments that reach up to 10–12 km (Drachev, 2000).                Full-depth water column profiling was performed at stations
The horsts and grabens are limited by deep-seated faults that              using an SBE 911 Plus probe. Bottom sediment sampling was
end mainly in the Paleocene sediments. Some of these faults                performed from a depth of 55–70 m using a van Veen grab
intersect the seafloor, forming scarps with a height of a few meters       sampler (0.1 m2 sampling area), box corer grab, Niemistö corer
(Rekant and Gusev, 2009).                                                  (Niemistö, 1974), and a gravity corer within the seepage area
    The shelf of the Laptev and East Siberian Seas are subdivided          at stations 5623, 5624, 5625, 5231, 5224, and 5223 (Figure 1).
into outer and inner parts. The outer shelf was morphologically            The coordinates and depth of the stations are given in the
distinguished as an inclined plane along the shelf break. It               corresponding tables of the section Results. Mini cores with
is a distinct feature and, judging by the available data, is               a length of up to 15 cm were selected by plexiglass tubes
nowhere to be found except in this region of the Arctic. It                from the bottom grab samples at stations 5623, 5624, and 5625
is assumed that its formation was most likely due to stepwise              collected adjacent to the crusts. Mineralogical identification by
subsidence of this continental margin under conditions of                  XRD, carbon content, XRF, and stable isotope analyses were
excessive sedimentary input carried by rivers flowing into the             performed in these sediment samples. All the sediment samples
Laptev Sea (Piskarev, 2016).                                               were examined using an Olympus BX-51 polarization microscope
    In the Laptev Sea, areas of intense bubble methane discharge           by the smear-slide method onboard (Rothwell, 1989). The type of
(cold methane seeps), which an echosounder records in the form             sediment was determined according to the Bezrukov and Lisitzin
of hydroacoustic anomalies, were first discovered during the               (1960) classification of sea bottom sediments (Lisitzin, 1996).
International Siberian Shelf Study expedition between August
and September 2008 (Yusupov et al., 2010). As a result of further          Petrography and Mineralogy
research on the outer shelf in the northern part of the sea, 112           The carbonate samples were washed to remove any attached
flare seep fields were discovered to be located in depths ranging          uncemented sediments and dried at 30◦ C prior to analysis.
from 50 to 90 m (Shakhova et al., 2015). These cold seeps fields           The examined samples are typically highly macroscopically
form a region approximately 150 km long and up to 50 km                    homogeneous, and samples of this size are contaminated by
wide (Figure 1). The Oden area is located within this region               clastic material. The composition, texture, structural features,
(Baranov et al., 2020).                                                    and microstructure of carbonate crusts have been studied using
                                                                           various methods. We focused our detailed analyses on the
                                                                           collected large crusts (or blocks). Carbonates were examined
MATERIALS AND METHODS                                                      using a Carl Zeiss Stemi 508 binocular microscope.
                                                                              Carbonate petrography of thin sections was investigated
Field Observations and Sample                                              using an Olympus BX-51 polarization microscope with a digital
Collection                                                                 microphotographic system based on an Olympus Camedia C5050
Two large (51 × 40 cm, 5.90 kg and 40 × 30 cm, 4.99 kg)                    camera with Image Scope S software.
carbonate crusts (OD-I and OD-II) were collected by the Sigsbee               The composition of the carbonates was studied in bulk and
trawl (2 m frame width) from a depth of 63 m during macrofauna             hand-drilled sub-samples. Sub-samples of approximately 1 cm3
investigations (Vedenin et al., 2020) in the Laptev Sea at station         in volume of macroscopically homogeneous matter (referred to
5623, during the 69th cruise of the RV Akademik Mstislav Keldysh           as “bulk” samples hereafter) were collected from larger crust
(Flint et al., 2018). The distance between the point of contact            samples (OD-I-1, OD-I-2, and OD-I-3) to quantify within-
(76◦ 53.667 N and 127◦ 48.157 E) and the detachment of the                 crust compositional variability. Hand drilled sub-samples of the
trawl from the bottom (76◦ 53.566 N and 127◦ 49.075 E) was                 micrite matrix and mineral inclusions (sample OD-I-1) were also
421 m. Six relatively small (up to ∼1–3 cm) fragments (OD-1–               sampled. Sub-samples were finely crushed in an agate mortar and
OD-6) of carbonate crusts were found during the washing of                 the same “bulk” powder was used for X-ray diffraction (XRD),
the trawl and box corer samples of the bottom sediments at the             X-ray fluorescence (XRF) analysis, and stable carbon and oxygen
same station (5623).                                                       isotope determinations.
   The bathymetric and hydroacoustic investigations at the Oden               Three sediment samples were analyzed to assess the
seep area were performed with a Kongsberg EA600 ship-mounted               composition of the clastic end-member. They were collected
single-beam echosounder operating at a constant frequency of               using the van Veen grab sampler in the study area and away
12 kHz. The standard software EA600 was used to control                    from the active zones of fluid seepage. These samples (stations
the echosounder. Hydroacoustic and bathymetric surveys were                5623 – Oden area, 5624, 5625) were retrieved from depths of
performed in the area along the separate transects, the distance           45 to 70 m. The average mineral and elemental compositions
between which ranged from less than 100 to 500 m.                          were assumed to be representative of the sediment fraction
   Visual observations of the seafloor were conducted using                incorporated within the carbonates.
the towed camera platform video module manufactured at the                    Mineralogy was determined on milled and homogenized
Shirshov Institute of Oceanology, RAS (IO RAS). The video                  bulk powders from 24 carbonate sub-samples and 3 bottom
module consists of several main hulls with electronic equipment,           sediment samples impacted by seepage. The specific phases

Frontiers in Marine Science | www.frontiersin.org                      4                                      July 2021 | Volume 8 | Article 690304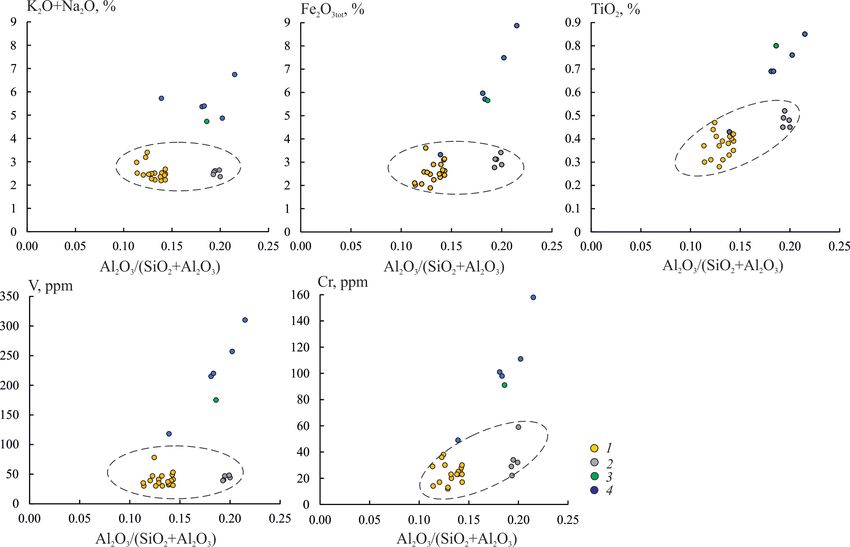
Kravchishina et al.                                                                                        Methane-Derived Authigenic Carbonates

(14 in total) were microscopically detected and micro-drilled             performed using the Delta V+ CF IRMS with the GasBenchII
from carbonates and analyzed as well by the same way.                     option (Thermo Fisher Scientific). For analysis, approximately
Detailed mineralogical identification by XRD was performed                250 µg of powdered bulk carbonate was used. The common
on unoriented prepared specimens analyzed by a Bruker D8                  phosphoric acid technique was applied to liberate CO2 from the
Advance diffractometer (BRUKER AXC, Germany) (Cu Kα                       carbonates. All samples were measured both with and without
with Ni 0.02 filter, 40 kV, 40 mA, with a linear detector                 pre-treatment with 10% H2 O2 solution (boiling for 1 h) to check
LYNXEYE with scanning in a discrete mode with a 0.02◦                     the possibility of organic carbon contamination. Carbonates pre-
steps, exposure 4 s/step in a range of 2.5◦ –70◦ 2θ range)                treated with H2 O2 were washed three times with distilled water
in IO RAS. Mineral identification was performed with an                   and carefully dried at 60◦ C. The accuracy in determining the δ13 C
automatic/manual peak search using BRUKER’s Diffrac EVA 3.1.              and δ18 O values was ±0.04, and ±0.06, respectively.
The PDF4 Mineral database of ICDD and the Crystallographic                    The stable carbon isotope composition (δ13 C-Corg and δ13 C-
Open Database (COD) were used for identification purposes.                CaCO3 values) of “bulk” powder of 18 carbonate (sample
Mineral quantification was performed by Rietveld refinement               OD-I-1) and 9 bottom sediment samples impacted by seepage
using the TOPAS 5 software. The refined parameters included               were determined in Federal Research Center “Fundamentals
background coefficients, sample displacement, scale, and unit cell        of Biotechnology”, RAS (FRC Biotechnology, Russia). For
parameters of all phases, as well as the preferred orientation.           analysis, approximately 250 µg of the bulk carbonate was
Depending on the mineral phase, the lower limit of quantification         used. To analyze the stable carbon isotope ratio of CaCO3 ,
is commonly 1–2 wt. % and the uncertainty 2–3 wt. %. The                  the samples were treated with hot HCl (1: 4) (Yu et al.,
calcite Mg content (MgCO3 mol %) was estimated from the unit              2018), and the released CO2 was absorbed with a concentrated
cell parameter d104 value according to Bischoff et al. (1983)             Ba(OH)2 . The formed BaCO3 precipitate was used to determine
and Zhang et al. (2010).                                                  the isotopic composition of the initial δ13 C-CaCO3 using
   Rock chips were examined using a VEGA-3 sem TESCAN                     a Delta Plus XP mass spectrometer (Thermo, Germany)
(Czech Republic) scanning electron microscopy (SEM) with                  with an accuracy better than ±0.1h. Then, the remaining
an energy dispersive X-ray spectrometer (EDS), Oxford INCA                samples were heated under vacuum and reacted with CuO
Energy 350 (United Kingdom).                                              at 900◦ C to analyze the stable carbon isotope ratio of Corg
                                                                          (Savvichev et al., 2018a). The released CO2 was sealed in
Carbon Content and XRF                                                    glass ampoules and analyzed offline using a Delta Plus XP
The contents of Corg and Ctot were determined by an automatic             mass spectrometer (Thermo, Germany) with an accuracy better
coulometric method using an AN 7560 carbon analyzer (Russia)              than ±0.1h. The carbon isotope composition of methane was
in the same bulk powder of 18 carbonate and 9 bottom                      determined using a TRACE GC gas chromatograph (Thermo
sediment samples impacted by seepage. For the Ctot analysis,              Fisher Scientific, Germany) connected to a Delta Plus mass
approximately 300 mg of the bulk subsample was combusted                  spectrometer in FRC Biotechnology. The accuracy of the δ13 C-
at 1,350◦ C, and the production of CO2 was quantified. For                CH4 values obtained did not exceed ±0.1h. All δ13 C and
Corg determination, approximately 400 mg of the same “bulk”               δ18 O values obtained are reported in conventional delta (δ)
powder was placed in carbon-free pervious ceramic combustion              units relative to the international standard Vienna Pee Dee
boats. The samples were placed on a heating plate at 50◦ C,               Belemnite (VPDB).
and samples treated with 10 vol.% hydrochloric acid (HCl) to
remove inorganic carbon (carbonate) and subsequently rinsed               Gas Analyses and Pore Water
with distilled water and dried in the drying oven prior to analysis       Gas analyses were carried out in surface bottom sediments
in the same manner as Ctot . The results are given in weight              impacted by seepage (stations 5623, 5624, 5625, 5231, and 5224)
percent (wt.%). The accuracy of the method was ±5%. The                   and background surface sediments on the shelf (5216, 5218,
calcium carbonate content was calculated as CaCO3 = (Ctot –               5215, 5223, and 5228) and on the continental slope (5225 and
Corg ) × 8.33.                                                            5226) (Figure 1).
   X-ray fluorescence (XRF) analysis of “bulk” powder of 24                   The dissolved methane concentration in the bottom sediments
carbonate and 5 bottom sediment samples impacted by seepage               (30 samples) was determined using a headspace equilibrium
was performed on a sequential spectrometer with wavelength                degassing method with subsequent measurements using a
dispersion, model PW 2400 (Philips Analytical), and software              gas chromatograph with a Kristall-200-OM flame ionization
(SuperQ, PANalytical). Detrital contents in the carbonate crusts          detector (Russia) with an accuracy of approximately ±1%.
were estimated simply by summing the contents of K2 O, Fe2 O3 ,           The method used in our work was inspired by McAuliffe
SiO2 , TiO2 , and Al2 O3 (Bayon et al., 2009).                            (1971) and was modified to increase the sensitivity and
                                                                          storage of samples prior to analysis (Lapham et al., 2017).
Stable Isotope Analyses                                                   Immediately after sampling the sediment core, 2 cm3 of the
Stable carbon and oxygen isotope analyses of 12 “bulk” powder             sample was transferred into glass serum vials using a syringe
carbonate (samples OD-I-2 and OD-I-3) were performed at                   without a needle holder. Two KOH pellets (approximately
the Laboratory of Isotope Geochemistry and Geochronology in               0.1 g) were added to each vial to stop microbial activity.
Institute of Geology of Ore Deposits, Petrography, Mineralogy,            Filtered seawater (through filters with 0.2 µm pore size) was
and Geochemistry, RAS (IGEM RAS, Russia). The analysis was                added to a sign marking the volume of the tube’s head

Frontiers in Marine Science | www.frontiersin.org                     5                                       July 2021 | Volume 8 | Article 690304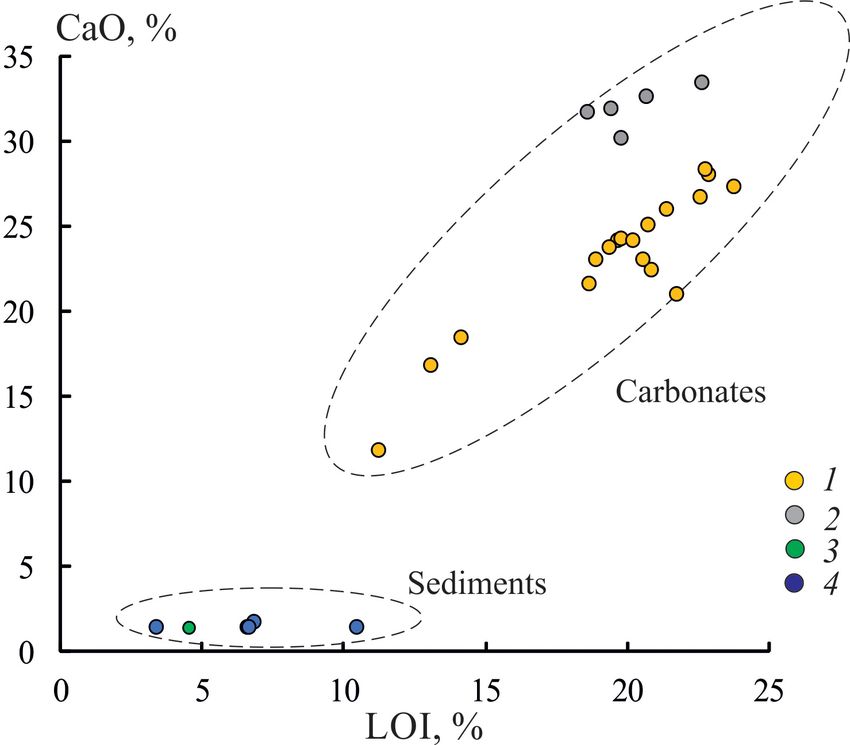
Kravchishina et al.                                                                                      Methane-Derived Authigenic Carbonates

space, and the tubes were hermetically closed with gas-tight            Seabed Observations With the Video
stoppers made of butyl rubber with natural caoutchouc and               Module
crimped with aluminum seals. All samples were stored upside
                                                                        The length of the video transect at Oden was 2,640 m, with a
down at room temperature and analyzed within 1 month for
                                                                        recording duration of 1 h 42 min and 22 s. At C15, the length
CH4 concentrations.
                                                                        of the video-transect reached 1,230 m (with a recording duration
   The sediment samples for pore water analyses were collected
                                                                        of 1 h 17 min 19 s).
using a Niemistö corer within the seepage area (station 5231),
                                                                            Video transects at both sites present examples of methane
adjacent shelf area (stations 5218 and 5224 with depth from
                                                                        seep features on the Laptev Sea outer shelf. The topography
18 to 54 m, respectively), and at the continental slope (stations
                                                                        was generally smooth, with 100% sediment cover along the
5227 and 5225 with depth more than 1900 m). The pore water
                                                                        video transects. The bottom sediments were muds with a brown
was squeezed out onboard by centrifugation and aliquots were
                                                                        (oxidized) surface layer. Only small and local disturbances of
analyzed for chloride (Cl− by direct titration of the sample
                                                                        microrelief were present, such as looseness of sediments in spots
with AgNO3 solution), sulfate (SO2−                    2+
                                   4 ), and calcium (Ca ) using         up to 1 m2 in size, small gouges (grooves) 5–20 cm wide, traces
spectrophotometric methods (Grasshoff et al., 2007).
                                                                        of slumping on the scarp, and dark spots of sediment (apparently
                                                                        reduced) up to 1 m2 .
RESULTS                                                                     Bubble methane discharge was the most prominent evidence
                                                                        of seepage at the Oden and C15 sites (Figure 2F). Methane
                                                                        discharge appeared as bubble chains of different intensities
Seafloor Topography
                                                                        originating from small orifices in the sediment. Methane was
The Oden area of approximately 13 km2 is located on the
                                                                        emitted from a single hole, but more often, a group of three to
outer shelf of the Laptev Sea. The outer shelf begins at a
                                                                        five orifices was observed.
depth of 50 m and is clearly distinguished by an increase in
                                                                            Carbonate crusts of different sizes and shapes provided more
the seafloor slope and its increased roughness compared with
                                                                        notable evidence of long-term methane seepage. Crust shapes
that of the relief of the inner shelf. Roughness manifests itself
                                                                        varied from round to elongated or irregular. Crusts are often
in the form of bottom topography blocks of 2–3 km in size,
                                                                        associated with orifices 2–3 cm in diameter or contain cracks.
separated by small depressions or scarps as large as 4 m high
                                                                        The crust surface color was gray, sometimes white, or dark
(Supplementary Figure 1).
                                                                        gray. Crusts of dark gray color were slightly covered with
   Our bathymetric survey showed that the studied area could be
                                                                        sediment, often with numerous small rounded or angular pieces
divided into two parts based on its morphology. The northern
                                                                        of carbonates around them or at some distance away. It may be
part is located at greater depths than the southern part (68
                                                                        suggested that these crusts were disintegrating and were older
and 62 m, respectively) (Figure 2A). The boundary between the
                                                                        than crusts of white color.
northern and southern parts is a scarp with a length of more than
3 km, which extends in the W-E direction. The height of the scarp
decreases from 3 to 2 m, traveling from east to west. The scarp         Bottom Sediments Lithology and
becomes gentler in the west compared to the east. During the            Sedimentary Environment
hydroacoustic survey, gas flares were only found in the southern        The upper layer (up to 20 cm) of the sediments was investigated
part of the study area.                                                 within the study area. All box core tops consisted of soft silty-
                                                                        pelitic muds. The surface sediments contained approximately
Gas Flares                                                              10–20% fine sand-sized material. The sandy grains were poorly
As a result of the hydroacoustic surveys, the gas flares                sorted. Terrigenous grains (quartz, feldspars, and rock fragments)
(hydroacoustic indications of gas bubble emissions) were                were predominant. They were rounded to varying degrees,
recorded only in the southern Oden area, where they formed a            sometimes with regular faces. The clastic minerals were dominant
cluster of closely spaced flares. The width of the gas flares may       (from 66 to 82% by XRD). Clay minerals (smectite, chlorite,
achieve a few hundred meters; this was determined at several            and illite) and mica (muscovite) were common throughout
crossings of one of the largest gas flares. This cluster is in a        the sediments and did not exceed 29%. Carbonate minerals
field of cold methane seeps. The field is shaped like a band that       are rare and present as dolomite, calcite, and Mg-calcite.
extends in a WSW-ENE direction for approximately 2 km and               Biogenic components (algae cells, detritus, calcareous, and
strikes under an oblique angle to the scarp that separates the          agglutinated benthic foraminifera, sponge spicules, etc.) were
northern and southern study area (Figures 2A,B). The width              found sporadically based on smear slides observations. The
of the gas flares can be as large as a few hundred meters, as           sediments were bioturbated with numerous Siboglinidae tube
it was determined at several crossings of one of the largest gas        worms and burrows (e.g., fossil emplacements of tubeworms).
flares. Gas flares reaching the surface were visually observed             The uppermost brown (oxidized) lithological unit was
from the vessel (Figure 2C). The trawling at station 5623 was           approximately 0.5–2 cm. The underlying dark gray (stations
carried out within the cold methane seeps field, and the trawling       5623 and 5624) to black (st. 5625) muds were reducing. Free
section passed through several gas flares where carbonate crusts        hydrogen sulfide gas was identified in black muds by a typical
and crusts were found during visual observations using a towed          odor. A significant quantity of amorphous particles differing
camera (Figures 2D,E).                                                  in high X-ray intensity for S and Fe was detected at st. 5625.

Frontiers in Marine Science | www.frontiersin.org                   6                                       July 2021 | Volume 8 | Article 690304
Kravchishina et al. Methane-Derived Authigenic Carbonates
FIGURE 2 | (A) Bathymetric map of the Oden site and location of the bathymetric and hydroacoustic tracks (thin lines). Thick lines mark the locations of the
echogram fragments shown in (B,D), gray area indicates the seep field where filled white circles mark the centers of the gas flares, dashed black line with half ticks
marks the scarp. Contour interval is 1 m; (C) gas bubbles in the sea surface, dimension is 2.5 m; (E) seafloor bottom photographs showing the carbonate crusts
(the distance between the red laser points is 20 cm), and (F) gas bubbles marked by arrows.
Sulfide phases (pyrite and hydrotroillite) were observed in the (558 mM). The Cl− concentration in the pore water reached the
reduced muds. Hydrotroillite in contact with air is subjected to lowest value (407 mM) in the seep area. The total alkalinity of the
rapid oxidation. When exposed to the atmosphere for a sufficient pore water within the seep area varied from 6.8 to 17.8 mM from
time (12–48 h), the black hydrotroillite inserts disappeared, the top to the bottom of the core.
and the dark gray sediment changed to a brownish color. The distinct influence of the sulfate reduction process (evident
Authigenic pyrite shows different morphologies: framboids (up by SO2−4 depletion from 24.8 to 16.0 mM) and an increase in total
to 20 µm) and individual grains of a rounded shape or close alkalinity (from 3.7 to 8.0 mM) in pore water was observed in
to the pentagonal dodecahedron form (approximately 5 µm). the shallow-water area throughout the sampling sediment layer
Fine gravel (rounded and not rounded) was occasionally found in (St. 5218). The concentration of Ca2+ decreased from the top
the reduced muds. The transition layer between two lithological to the bottom of the cores from 9.5 to 7.5 µM. The lowest
units (oxidized and reduced) was approximately 1–3 cm with a concentrations of Ca2+ are recorded in the surface sediment
gradual boundary. layer: 7.6 and 5.9 µM at stations 5225 and 5227, respectively.
According to the CTD data, the temperature and salinity
of bottom water in the study area of the Laptev Sea varied
from −1.77 to −1.29◦ C and from 34.11 to 34.18 psu, respectively.
Concentration and Isotopic Composition
Total alkalinity in near-bottom water was 2.3–2.5 mM. of Dissolved Methane in Bottom
The pore water data from several cores collected at the seep Sediments
area and adjacent areas are presented in Figure 3. There was a Table 1 contains data on the dissolved methane concentration
gradual increase in the Cl− ; concentration, from 435 to 455 mM, and carbon isotope composition of methane in the shelf
in the surface sediment layer of the shelf background area within sediments obtained at depths of 10–71 m. The concentrations
the depth changes from 18 m (St. 5218) to 60 m (St. 5224). These of dissolved methane vary from 1 to 51 µM and locally reach
values are much lower than the Cl− ; concentration in seawater to 539 µM in surface layer (0–10 cm) of bottom sediments
Frontiers in Marine Science | www.frontiersin.org 7 July 2021 | Volume 8 | Article 690304Kravchishina et al. Methane-Derived Authigenic Carbonates
FIGURE 3 | Sediment pore water profiles for chloride (Cl− , mM), sulfate (SO2−
4 , mM) and calcium (Ca
2+ , µM) from the background sediments of the Laptev Sea: (A)
st. 5218, depth 18 m, 72◦ 41.00 N, 130◦ 30.00 E; (B) st. 5224, depth 60 m, 77◦ 06.10 N, 130◦ 29.30 E; (C) st. 5225, depth 2,700 m, 78◦ 22.00 N, 130◦ 30.00 E; (D) st.
5227, depth 1,980 m, 78◦ 05.50 N, 130◦ 30.60 E. For station location see Figure 1.
impacted by seepage. In the deeper sediment layer of 30–50 cm it Separate, relatively small carbonate crusts found during the
concentrations range from 300 to 500 µM. Methane δ13 C values washing out of the Sigsbee trawl and seafloor grab samples.
vary from –78.3 to –71.3h VPDB and indicate microbial origin They are represented by semi-rounded dense, porous, cavernous,
of dissolved methane. CO2 δ13 C values range from –24.4 to – carbonate-cemented crusts.
16.3h VPDB. Methane oxidation resulted in formation of CO2 . Carbonate crusts consist of a clastic terrigenous matrix
The dissolved methane concentrations range from 0.03 of host sediments and micritic carbonate cement that is
to 0.09 µM in background bottom sediments of the shelf. microcrystalline calcite precipitating within the host sediments.
The highest concentrations are characteristic of the inner Clay-carbonate and carbonate-clay cements have a micrite (basal,
shelf with a depth of about 20 m or less near the Lena microcrystalline) structure (Supplementary Figure 2). Their
Delta. Dissolved methane concentrations of about 0.02 µM microtexture is very characteristic and is expressed in the
are characteristic of the background bottom sediments of development of structures of a rounded form (burrows of detritus
the continental slope with a depth of 1,500–2,400 m. CO2 feeders), composed of a substantially microgranular carbonate
δ13 C values in background sediments range from –10.3 to – aggregate with a small amount of clastic material. The majority
22.8h VPDB. Methane δ13 C values are absent due to too low of the carbonate crusts had an uneven granular structure with
concentration (Kravchishina et al. Methane-Derived Authigenic Carbonates
TABLE 1 | Dissolved methane concentration and stable carbon isotope composition (δ13 C, h) of methane and carbon dioxide of the bottom sediments in the
Laptev Sea.
Station number Coordinates Depth Layer CH4 δ13 C-CH4 δ13 C-CO2 Sampling tool
N E m cm µM h VPDB
Sediments impacted by seepage
5623* 76◦ 53.650 127◦ 48.200 63 0–1 1.41 –72.0 – van Veen grab
5624 76◦ 50.000 126◦ 39.880 70 0–1 2.95 –78.3 –21.2 van Veen grab
5625 76◦ 46.410 125◦ 49.400 45 0–1 2.87 –77.4 –19.2 van Veen grab
6–7 3.97 –76.6 –24.4
5231* 76◦ 46.340 125◦ 49.750 71 0–1 19.2 –71.6 –2.8 Niemistö corer
2–4 32.7 –74.8 –13.4
8–12 51.4 –68.3 –12.8 Niemistö corer
4–5 12.7 –72.8 – gravity corer
10–11 9.9 –72.6 –14.4
37–38 385 –72.3 –12.0
44–45 467 –79.9 –6.8
1–4 539 –76.8 – box corer
Background sediments of shelf
5228 77◦ 39.000 130◦ 30.500 87 0–2 0.046 – – Niemistö corer
14–16 0.033 – –
5224 77◦ 06.100 130◦ 29.300 57 0–2 0.033 – – Niemistö corer
15–17 0.041 – –
5223 76◦ 28.200 130◦ 30.000 56 0–2 0.038 – – Niemistö corer
16–18 0.042 – –
5215 74◦ 15.400 130◦ 30.500 26 0–2 0.053 – –16.0 Niemistö corer
15–17 0.042 – –10.4
5220 73◦ 20.300 130◦ 29.800 25 0–3 0.090 – – Niemistö corer
10–13 0.068 – –
5218 72◦ 41.000 130◦ 30.000 18 0–3 0.083 – –11.3 Niemistö corer
5–8 0.067 – –10.5
22–25 0.075 – –10.3
Background sediments of continental slope
5225 78◦ 22.000 130◦ 30.000 2385 0–2 0.019 – –14.9 Niemistö corer
9–11 0.023 – –16.3
11–17 0.025 – –22.8
5226 77◦ 49.300 130◦ 30.400 1500 0–2 0.021 – – Niemistö corer
2–5 0.025 – –
–, no data.
*, the host sediments of the authigenic carbonates.
authigenic Mg-calcite: up to 60 wt.% of the entire crystalline (up to 4 wt. %). The re-deposited fine-grained calcite with a
phase (mean 36 ± 11 wt. %, Table 2). Three main identifiable luminescent blue-white glow forms a vein on the surface of
phases of this mineral can be distinguished with typical Mg the crust with a calcite content of 56 wt. % and two phases of
contents of 2–23, 1–18, and 6–7 mol % MgCO3 (Table 2). Mg-calcite of 12 and 32 wt. % (Supplementary Table 1, and
We distinguished the phases in those samples where Mg- Supplementary Figure 5). Calcite (100 wt. %) is present as
calcite XRD peaks are reliably identified and do not overlap bioclasts (colonial sea squirt) as well (Supplementary Table 1).
(Supplementary Figure 4). The detrital fraction of the carbonate crusts was represented
Low-Mg calcite [1–2 mol % MgCO3 according to Crémière by quartz, albite, anorthite, microcline, orthoclase, amphibole
et al. (2016b)] is present in minor quantities and represents group minerals (hornblende), and mica (muscovite and biotite).
the biogenic component which includes foraminiferal tests and The total content of clastic minerals in carbonate crusts (31–73
calcite plates of unidentified species visible in smear slides wt. %) is lower than in sediments (66–82 wt. %). In general, the
(Supplementary Table 1). composition of detrital minerals in the crusts is similar to that
Calcite, dolomite, and siderite clasts were identified within the in the bottom sediments, but there are differences. Dark-colored
silt sand-sized matrix cemented by Mg carbonate in the crust monomineral fractions in the sediments are intergrowths and
(sample OD-I-1). They occurred sporadically in trace amounts aggregates, in which the minerals of the amphibole group are the
Frontiers in Marine Science | www.frontiersin.org 9 July 2021 | Volume 8 | Article 690304Kravchishina et al. Methane-Derived Authigenic Carbonates
aggregate of Mg-calcite with clay minerals. There were areas
composed of only Mg calcite. According to the SEM data, the
admixture of Mg in calcite usually does not exceed 3 wt. %.
Microstructural types of Mg-calcite can be distinguished as fine-
grained (Mg 2–3 wt. %), forming the basis of carbonate cement
(Figure 5); and clearly crystalline (Mg 1–2 wt. %).
Clearly, crystalline modifications of Mg-calcite fill the void
spaces in the cement and burrows of detritus feeders. They also
developed in the space between clastic minerals. The shapes of
the crystals may differ and show signs of partial dissolution and
recrystallization. Several forms were identified (Figure 6).
(1) Scalenohedral crystals are the most common form of
calcite that has already been encountered in the Laptev Sea
(Kravchishina et al., 2017). Crystals (∼30 µm along the
axis) often form druses and twinning.
(2) Fan-shaped crystals that form radial aggregates and druses.
The length of the crystals along the axis is as large as 20–
30 µm.
(3) Rhombohedral crystals (up to 5 microns in size) usually
develop along the first two types of calcite crystals and
form aggregates.
Disulfide group minerals were formed in the structures
during paragenesis with Mg-calcite. The main form of FeS2
is marcasite (Supplementary Figure 7). Marcasite grows as
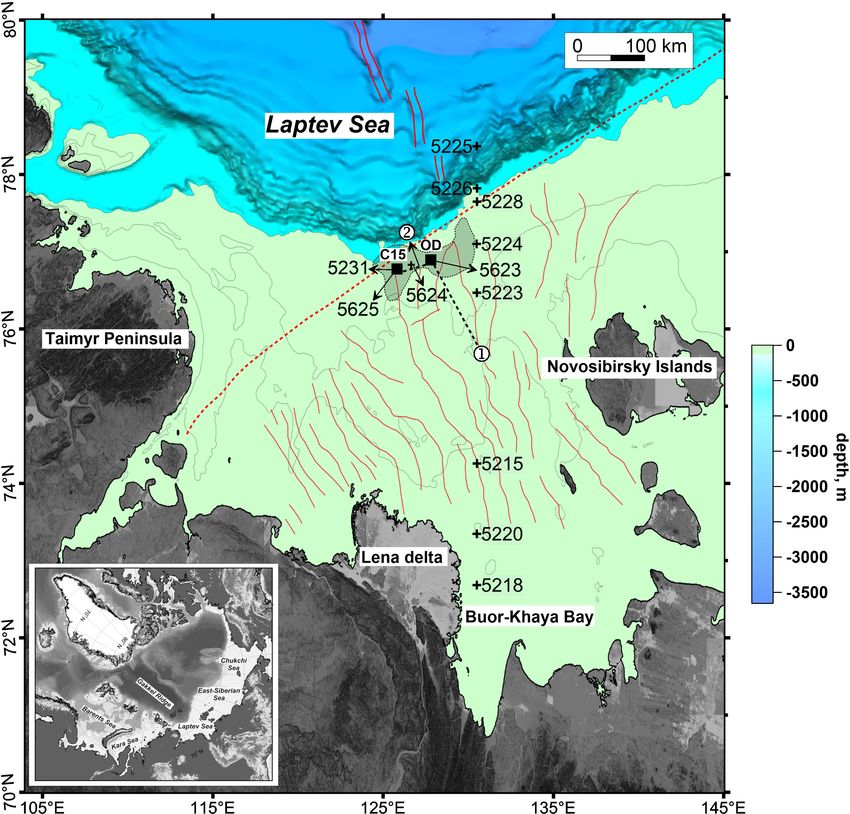
FIGURE 4 | Morphology of the carbonate crust from the Laptev Sea, depth of inclusions (approximately 200–300 µm in diameter) within the
63 m: (A) large carbonate crust sampled from the Oden methane seep area dark stains of clay-rich micrite cement. Its crystals have a tabular
and its division into samples OD-I-1, OD-I-2 and OD-I-3; (B) top view (left) and shape and form radially positioned intergrowths with diameters
bottom view (right) of the sample OD-I-1 with pores and cavities filled with
bottom sediment; (C) lengthwise section (left) and cross-section (right) of the
of 5–10 µm. In contrast to the carbonate crusts, we observed
carbonate crust sample OD-I-1: 1, examples of the dark zones and 2, only pyrite framboids in “host” sediments, while the above
examples of the light zones. intergrowths were not found.
According to the XRD data, Mn hydroxide – todorokites were
formed along the burrows of detritus feeders in association with
main phase. However, the carbonate crusts were enriched with Mg calcite (Figure 6E and Supplementary Figure 8). Evidently,
dark-colored tabular grains and debris of albite-biotite-quartz these hydroxides are formed by the precipitation of Mn from
rock (Supplementary Figure 6). a colloidal solution with the participation of microorganisms.
The content of clay minerals (illite, smectite, kaolinite, and These spherical formations (up to 5 µm in diameter) are often
chlorite) in the crust samples varied from 7 to 23 wt. %. The collected in chains or larger aggregates up to 20 µm in length,
ratio of clay minerals to Mg-calcite largely determines the color overlapping calcite crystals, and forming a continuous cover,
and texture of the crust. The darkest zones of the crusts were which was black when examined under a microscope. The Mn
characterized by a decrease in the carbonate mineral content and content in these formations varied from 20 to 25 wt. %; Mg
an increase in the total content of clay minerals. This was due to and Ca (at a 2–3 wt. %) are among the impurities with high
an increase in the content of all clay minerals and the appearance X-ray intensity.
of new mixed-layered (smectite-chlorite, illite-smectite) minerals
characteristic of the darkest zones. Major Element Composition of Carbonates and
Separate burrows of detritus feeders with previously formed Bottom Sediments
manganese hydroxides on the surface of the burrows were The XRF major element composition of the carbonate samples
observed (Supplementary Figure 3B). According to the XRD (especially in terms of carbonate-free matter) was significantly
data, this is a mineral with a weakly ordered crystal structure different from that of the surface layer of seafloor sediments
and strongest reflection with a d-spacing of 9.6 and 10 (Table 3), collected near and at the Oden seep area. The sediments
Å manganite, which corresponds to diagenetic todorokite were composed of SiO2 (56–72 wt. %).
(Supplementary Table 1). Detrital contents in crusts, inferred from XRF data (Table 3),
ranged between 38 and 72 wt. %, averaging at 49 ± 6 wt. %. The
Electron Microprobe Analysis of Carbonates enrichment of the crusts with elements such as MgO, Stot , and Sr
The microtexture of the carbonate crusts was clearly bioturbated, (average 3.7 ± 0.3 wt. %, 0.7 ± 0.2 wt. %, and 1190 ± 114 ppm,
less often zonal, which generally appears along the burrows respectively) associated with a carbonate material and marcasite
of detritus feeders. The micrite cement is represented by an was noticeable compared to the bottom sediments. The Sr/Ca
Frontiers in Marine Science | www.frontiersin.org 10 July 2021 | Volume 8 | Article 690304TABLE 2 | XRD mineral composition of the carbonate crust and bottom sediments from the Oden cold seep area.
Kravchishina et al.
Sample Sub- Quartz K- Plagio Amphi Clino Smectite Illite- Chlorite Kaolinite Dolomite Calcite Mg-calcites
sample feldspar clase bole pyroxene smectite
wt. % wt. % MgCO3 wt. % MgCO3 wt. % MgCO3
mol % mol % mol %
Carbonate crust
OD-I-1 1 23 10 13 4 2 1 1 46 10
Frontiers in Marine Science | www.frontiersin.org
2 25 6 7 1 2 1 43 13 14 12
3 47 12 17 3 2 1 1 17 7
4 20 10 21 3 3 2 4 24 6 13 1
5 15 10 14 4 4 53 6
6 35 11 22 6 4 21 7
7 24 17 24 3 5 1 1 2 12 13 11 7
8 23 9 15 1 3 4 36 2 9 1
9 41 8 10 2 4 1 1 33 5
10 24 5 17 2 1 2 1 1 27 10 20
11 35 5 11 2 1 4 1 1 27 10 12 7
11
12 35 9 11 3 1 4 2 Traces 22 10 13
13 45 6 9 3 1 3 1 1 16 14 15 12
14 51 10 9 4 1 2 1 1 10 4 11 6
15 53 8 11 4 2 1 1 11 10 9 6
16 37 8 8 2 1 4 2 2 20 7 16
17 28 3 5 1 Traces 2 1 Traces 28 7 32 3
18 41 5 7 2 Traces 2 1 Traces 17 8 12 12 7
OD-I-2 19 26 5 10 1 3 1 1 2 36 11 15 18
20 36 7 11 2 4 1 1 25 11 13 10
21 35 6 9 2 3 1 1 29 20 14 9
OD-I-3 22 46 9 10 2 4 3 1 3 22 12
231 47 9 15 4 5 7 3 2 1 2 5 19
24 37 8 9 2 3 1 1 1 22 23 16 10
Bottom sediments, surface layer (cm)
5623 0–1 34 15 26 3 3 4 8 3 2 1 1
5624 0–2 25 12 24 4 1 5 10 10 4 1 1 2
5625 0–1 36 13 26 3 4 4 8 4 2
231 , bottom sediment sample from cavities of the carbonate crust OD-I-3.
July 2021 | Volume 8 | Article 690304
Methane-Derived Authigenic CarbonatesKravchishina et al. Methane-Derived Authigenic Carbonates
FIGURE 5 | Scanning electron micrographs of the fine-grained type of high-Mg calcite crystals in the micrite cement of the OD-I-1 carbonate crust: (A) the dark part
(left) of the crust and the EDS data (right) for the area highlighted with a white square box; (B) the light part (left) of the crust and EDS data (right) of the mineral grain
highlighted with a white cross.
ratio in the crusts varied in a narrow range from 0.005 to 0.008, VPDB, n = 11, Table 5. This range corresponds to the low-
which was controlled only by the contribution of Sr-rich Mg- temperature precipitation of carbonates from seawater. This
calcite. Mg/Ca ratio in the studied samples of the crusts was range corresponds to the low- temperature precipitation of
constant and amounted to 0.1–0.2 indicating a relatively stable carbonates from the ambient seawater (δ18 O range from –0.2 to –
contribution of Mg-rich carbonate phase with minor input of 0.5h VSMOW, unpublished data). The eq. (1) for Mg-calcite and
Mg-low carbonate phase and detritus. The Mg/Ca ratio varied water can be derived as weighted average fractionation factor for
from 1.2 to 2.0 in the bottom sediments (including sediment magnesite and calcite:
samples collected from the pores and cavities of the crusts – 1.4).
In contrast, the carbonate crusts were deficient in trace α(Mg − Cc − Water) = x · α(Magnesite − Water)+
elements such as V, Zn, Rb, Zr, Ba, and Pb (average content (1 − x) · α(Calcite − Water) (1)
41 ± 7.3, 28 ± 4.1, 56 ± 5.1, 90 ± 30, 353 ± 43, andKravchishina et al. Methane-Derived Authigenic Carbonates
(st. 5623). The Corg content in the crusts was 0.2–0.3 wt. %, rarely
rising to 0.4 wt. % within the gray zone, which was enriched in
clay minerals and depleted in authigenic carbonates (Table 4).
The δ13 C-Corg values of sediments lie within limits
characteristic of terrigenous (allochthonous) organic matter
(OM); on average, the δ13 C-Corg was –27.7 ± 1.5h VPDB
(Table 6). The carbon isotope composition of OM in the
carbonate crusts was significantly depleted in heavy isotopes
compared to the OM in the sediments (average of –34.6 ± 2.2h
VPDB). This suggests the participation of methane-derived
carbon in the formation of OM in the carbonate crusts. Methane-
derived carbon is also involved in the formation of 13 C-depleted
inorganic carbon in carbonates showing values between –27.9
and –34.8h VPDB (Tables 5, 6). This is particularly apparent
from the example of small crusts with smaller clay mineral
contents (δ13 C-CaCO3 up to –40.2 h VPDB) (Table 5).
DISCUSSION
The studied carbonate crusts are nearly monomineral carbonate
phases and detrital materials. On average, carbonate structures
consist of Mg-calcite (inferred from XRD data up to 55%). Their
carbonate cement is composed mostly of high-Mg calcite (up
to 23 mol % MgCO3 ). Low-Mg calcite re-deposited minerals
sometimes form single crystals in the form of thin anisotropic
plates (Kravchishina et al. Methane-Derived Authigenic Carbonates
TABLE 3 | XRF major element composition of the carbonate crust and sediment samples.
Sample Sub-sample LOI Na2 O MgO Al2 O3 SiO2 K2 O CaO TiO2 MnO Fe2 O3tot P2 O5 Stot Total Detrital content
%
Carbonate crusts
OD-I-1 1 20.71 1.04 4.08 6.23 37.23 1.43 25.12 0.39 0.21 2.63 0.22 0.22 99.51 47.9
2 22.85 0.95 4.16 5.39 33.43 1.24 28.02 0.33 0.20 2.35 0.26 0.28 99.46 42.7
3 19.69 1.16 3.32 5.36 41.63 1.35 24.13 0.30 0.16 2.02 0.18 0.22 99.52 50.7
4 19.35 1.07 3.98 6.51 39.55 1.46 23.79 0.40 0.17 2.66 0.23 0.28 99.45 50.6
5 20.86 1.11 3.49 6.41 39.55 1.41 22.48 0.41 0.26 2.90 0.22 0.32 99.42 50.7
6 23.78 1.01 3.60 5.18 33.91 1.21 27.30 0.31 0.20 2.24 0.23 0.38 99.35 42.9
7 11.22 1.57 2.50 8.17 57.50 1.83 11.87 0.47 0.15 3.61 0.14 0.36 99.39 71.6
8 21.74 1.13 3.23 6.20 40.74 1.38 21.06 0.39 0.22 2.90 0.19 0.28 99.46 51.6
9 19.81 1.13 3.60 5.58 40.76 1.30 24.28 0.31 0.18 2.06 0.23 0.24 99.48 50.0
10 18.86 1.09 3.74 6.17 41.69 1.40 23.04 0.37 0.23 2.48 0.21 0.23 99.51 52.1
11 21.37 1.06 3.90 5.78 36.09 1.29 26.02 0.38 0.31 2.49 0.24 0.40 99.33 46.0
12 20.55 1.00 3.89 6.49 39.07 1.42 23.03 0.42 0.19 3.10 0.21 0.19 99.56 50.5
13 22.56 1.02 4.44 5.71 34.18 1.20 26.77 0.35 0.13 2.44 0.24 0.35 99.39 43.9
14 14.11 1.47 3.51 6.54 51.08 1.50 18.42 0.37 0.09 2.10 0.18 0.18 99.55 61.6
15 13.09 1.55 3.49 7.31 52.24 1.64 16.81 0.44 0.13 2.58 0.18 0.14 99.60 64.2
16 18.63 1.24 4.07 6.91 41.37 1.44 21.61 0.42 0.19 3.14 0.23 0.24 99.49 53.3
17 22.74 1.17 4.37 5.01 33.84 1.10 28.39 0.28 0.13 1.89 0.22 0.29 99.43 42.1
18 20.21 1.22 3.97 5.57 38.66 1.24 24.20 0.41 0.14 2.56 0.21 0.67 99.06 48.4
OD-I-2 19 22.61 0.96 3.53 6.69 26.75 1.40 33.45 0.45 0.23 2.89 0.30 0.49 99.75 38.2
20 18.57 0.98 3.61 7.48 30.92 1.63 31.75 0.52 0.25 3.12 0.34 0.57 99.74 43.7
21 19.77 1.03 3.61 7.67 30.83 1.61 30.19 0.48 0.21 3.41 0.37 0.55 99.73 44.0
OD-I-3 22 19.45 1.01 3.56 7.20 30.00 1.55 31.95 0.49 0.16 3.13 0.37 0.85 99.72 42.4
231 4.51 1.64 2.05 14.86 64.98 3.09 1.48 0.80 0.06 5.65 0.14 0.49 99.75 89.4
24 20.70 0.95 3.73 6.86 28.70 1.50 32.67 0.45 0.15 2.77 0.36 0.87 99.71 40.3
Bottom sediments
5623 0–1 3.38 3.20 1.67 11.58 71.67 2.52 1.39 0.43 0.21 3.32 0.15 0.26 99.78 89.5
5624 0–1 10.45 2.39 2.89 14.34 56.57 2.48 1.47 0.76 0.32 7.49 0.21 0.38 99.75 81.6
1–2 6.84 3.98 2.52 15.26 55.71 2.76 1.75 0.85 0.25 8.87 0.17 0.39 99.35 83.5
5625 0–1 6.61 2.79 2.54 13.84 62.55 2.57 1.48 0.69 0.19 5.96 0.20 0.32 99.74 85.6
1–2 6.67 2.75 2.54 14.12 62.84 2.64 1.45 0.69 0.09 5.71 0.18 0.26 99.94 86.0
231 , bottom sediment sample from cavities of the carbonate crust.
the subsurface reduced sediments where methane oxidation rate enriched chromium and vanadium in comparison with surface
were high (Savvichev et al., 2018a). This is an indication of bottom sediments (Figure 8). The horizontal-crust variation of
sulfate-dependent AOM. MDACs are usually formed in sub- major and some trace element compositions reflect the relative
surface sediments at cold seeps due to AOM, resulting from the contributions of Mg-rich carbonate phases and detrital material
microbial oxidation of methane-rich fluids (Paull et al., 1984; from different sources. XRF major element composition and
Bohrmann et al., 1998; Aloisi et al., 2002; Bayon et al., 2009; XRD of the carbonate samples and bottom sediments suggest that
Mazzini et al., 2016). For example, modern carbonate formation the carbonate cementation of the detrital components occurred
with the participation of methane carbon was identified earlier not on the seafloor surface of the studied area and that they were
in sub-surface Holocene sediments of the Laptev Sea shelf within possibly relocated from deeper layers of sediment. We believe
the studied cold seep area (Kravchishina et al., 2017). However, that winnowing is the most possible mechanism of carbonate
the texture and mineralogy of the studied carbonates differed exposure (Peckmann and Thiel, 2004; Smrzka et al., 2019).
significantly from those collected in the sub-surface sediment. The newly discovered carbonate crusts are authigenic. The
The micritic carbonate cements display similar major concept “authigenic mineral” implies that it is formed in situ
composition patterns, regardless of their mineralogy. The within the depositional site in response to geochemical processes.
background sediments are predominantly clayey and contain The studied carbonates, strictly speaking, cannot be attributed
little carbonates (1–2%), or none at all. The clastic material in to the “formed in place” formations. In our case, the binding of
host marine sediments differs significantly compared to clastic authigenic carbonates to a specific sediment type was not obvious.
material within the carbonate crusts (Figure 7). Generally, the It is not known where exactly carbonate precipitation occurred
crust material is less alkaline, depleted of titanium and iron, but in sediments because the formation of carbonate hard pavements
Frontiers in Marine Science | www.frontiersin.org 14 July 2021 | Volume 8 | Article 690304You can also read