How Slow Rock Weathering Balances Nutrient Loss During Fast Forest Floor Turnover in Montane, Temperate Forest Ecosystems - Refubium
←
→
Page content transcription
If your browser does not render page correctly, please read the page content below
ORIGINAL RESEARCH
                                                                                                                                            published: 17 July 2019
                                                                                                                                     doi: 10.3389/feart.2019.00159

                                             How Slow Rock Weathering
                                             Balances Nutrient Loss During Fast
                                             Forest Floor Turnover in Montane,
                                             Temperate Forest Ecosystems
                                             David Uhlig 1*† and Friedhelm von Blanckenburg 1,2‡
                                             1
                                              GFZ German Research Centre for Geosciences, Section Earth Surface Geochemistry, Potsdam, Germany, 2 Institute of
                                             Geological Sciences, Freie Universität Berlin, Berlin, Germany

                             Edited by:
                                             Mineral nutrient cycling between trees and the forest floor is key to forest ecosystem
                 Dionisios Gasparatos,
                  Aristotle University of    nutrition. However, in sloping, well-drained landscapes the forest floor experiences
                  Thessaloniki, Greece       permanent nutrient loss in particulate form by plant litter erosion and as solute after plant
                       Reviewed by:          litter decomposition, solubilisation, and export. To prevent nutrient deficit, a replenishing
                        Beth A. Fisher,
  University of Minnesota Twin Cities,
                                             mechanism must be in operation that we suggest to be sourced in the subsoil and the
                         United States       weathering zone beneath it, provided that atmospheric input is insufficient. To explore
                 Gary E. Stinchcomb,
                                             such a mechanism, we quantified deep (up to 20 m depth) weathering and mineral
Murray State University, United States
                                             nutrient cycling in two montane, temperate forest ecosystems in Southern Germany:
                  *Correspondence:
                          David Uhlig        Black Forest (CON) and Bavarian Forest (MIT). From measurements of the inventories,
                 d.uhlig@fz-juelich.de       turnover times, and fluxes of macronutrients (K, Ca, Mg, P) we found evidence for a fast,
     orcid.org/0000-0002-0954-689X
                                             shallow “organic nutrient cycle”, and a slow, deep “geogenic nutrient pathway”. We found
                  † Present   Address:       that the finite nutrient pool size of the forest floor persists for a few years only. Despite
                            David Uhlig,
     Institute of Bio- and Geosciences
                                             this loss, foliar nutrient concentrations in Picea abies and Fagus sylvatica do not indicate
                    (IBG-3) Agrosphere,      deficiency. We infer that ultimately the biologically available fraction in the deep regolith
    Forschungszentrum Jülich, Jülich,
                                             (CON: 3–7 m, MIT: 3–17 m) balances nutrient loss from the forest floor and is also decisive
                               Germany
        ‡ Friedhelm von Blanckenburg
                                             for the level of the forest trees’ mineral nutrient stoichiometry. Intriguingly, although the
     orcid.org/0000-0002-2964-717X           nutrient supply fluxes from chemical weathering at CON are twice those of MIT, nutrient
                                             uptake fluxes into trees do not differ. The organic nutrient cycle apparently regulates
                    Specialty section:       the efficiency of nutrient re-utilization from organic matter to cater for differences in its
          This article was submitted to
                        Soil Processes,      replenishment by the deep geogenic nutrient pathway, and thereby ensures long-term
                a section of the journal     forest ecosystem nutrition.
             Frontiers in Earth Science
                                             Keywords: mineral nutrients, ecosystem nutrition, chemical weathering, plant litter erosion, dissolved plant
           Received: 26 March 2019
                                             litter export
            Accepted: 05 June 2019
            Published: 17 July 2019

                              Citation:      INTRODUCTION
      Uhlig D and von Blanckenburg F
   (2019) How Slow Rock Weathering
                                             A fundamental feature of forest ecosystems is that for most rock-derived nutritive elements demand
   Balances Nutrient Loss During Fast
     Forest Floor Turnover in Montane,
                                             by forest trees vastly exceeds mineral nutrient supply from chemical weathering and atmospheric
       Temperate Forest Ecosystems.          deposition. Thus, trees have evolved sophisticated nutrition strategies to satisfy their nutrient
               Front. Earth Sci. 7:159.      demand and to prevent nutrient limitation (e.g., Elser et al., 2007; Vitousek et al., 2010; Augusto
       doi: 10.3389/feart.2019.00159         et al., 2017). Several nutrient acquisition, storage and allocation strategies have been suggested

Frontiers in Earth Science | www.frontiersin.org                                  1                                                July 2019 | Volume 7 | Article 159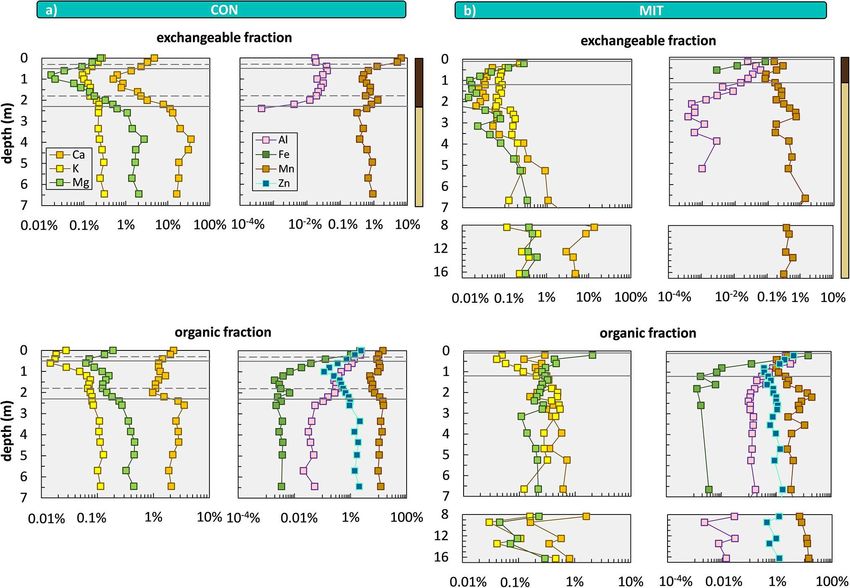
Uhlig and von Blanckenburg                                                                                      Maintaining Forest Nutrition From Subsoil

(Aerts and Chapin, 1999) that all contribute to satisfy nutrient              weathering has been suggested as a further nutrient acquisition
demand through a cycle, that we call here the “organic nutrient               strategy to counterbalance loss from the “leaky” forest floor (e.g.,
cycle”. The most common strategy is efficient re-utilization of               Cleveland et al., 2013). Because this pathway is rock-sourced and
organic-bound nutrients from plant litter in the forest floor (e.g.,          also operates over millennia (Buendía et al., 2010), we here call
Jobbágy and Jackson, 2004; Lang et al., 2016). In fact, the fast              this second mechanism the “geogenic nutrient pathway”. This
turnover of the forest floor ensures forest ecosystem nutrition.              pathway operates as follows: In landscapes that have attained
Because organic-bound nutrients are not directly utilizable by                steady state between the formation of regolith at depth, dissolved
plants (George et al., 2011; Jansa et al., 2011), microbial activity is       loss of nutrients by leaching, and the removal of the remaining
central in ensuring the fast turnover (e.g., Lang et al., 2016). For          nutrient-depleted soil by erosion at the surface, the topmost soil
example, mycorrhizal fungi promote the breakdown of organic                   experiences a continuous renewal of mineral nutrients from the
matter into plant-available inorganic forms that are subsequently             bedrock source that transit upwards from the weathering front
taken up by tree roots (e.g., Chapin et al., 2012).                           into topsoil (e.g., Vitousek et al., 2003; Wardle et al., 2004b;
   But, in sloping, well-drained landscapes that characterize large           Porder et al., 2007; Peltzer et al., 2010). Critical to this concept,
parts of the global land surface, the forest floor experiences                however, is whether these bedrock-sourced mineral nutrients (a)
permanent loss of organic-derived nutrients by plant litter                   have survived mineral dissolution at depth prior to arriving in the
erosion (Scatena and Lugo, 1995; Heartsill Scalley et al., 2012)              rooting zone; (b) are available in the dissolved or readily plant-
and leaching (e.g., Moore et al., 2005; Chaudhuri et al., 2007).              available form after abiogenic mineral dissolution in the rooting
Somehow surprisingly, only very few studies have explored                     zone; (c) are in a mineralogical form that can be directly accessed
erosional nutrient loss. For example, in the well-characterized               by roots and their associated microorganisms. In the simplest
tropical Bisley Experimental Watershed (Luquillo, Puerto Rico),               terms chemical weathering taking place in processes (a) and (b)
erosional plant litter export accounts for the two most plant-                requires water flow and thus porosity (Brantley and Lebedeva,
essential mineral nutrients phosphorus (P) and potassium (K)                  2011), protons supplied by carbonic acid in water, microbial
to 0.04 mg m−2 yr−1 (P) and 0.2 mg m−2 yr−1 (K) (Heartsill                    respiration of CO2 , or sulfide oxidation (Brantley et al., 2007),
Scalley et al., 2012). This estimate is likely too low by some                and sufficient fluid flow to dissolve primary minerals (Maher,
orders of magnitude as compared to temperate, not P-limited                   2010). For process (c) for example, a high amount of mineral
ecosystems, given that in these tropical, frequently P-limited                nutrients in the regolith does not necessarily satisfy nutrient
ecosystems plant litter is often of low quality (low nutrient                 demand of forest trees if the nutrient in question is strongly
concentration) (Chapin, 1980). Much better estimates exist for                bound to solids and hence inaccessible to forest trees (Walker
forest floor leaching fluxes. These amount to about 10–1,000 mg               and Syers, 1976) such as P is frequently occluded to Fe- and
m−2 yr−1 for P and to about 300–4,000 mg m−2 yr−1 for K                       Al-containing sesquioxides (Brady and Weil, 2002) or K that is
(Cole and Rapp, 1981; Yavitt and Fahey, 1986; Qualls et al., 1991;            hosted in potash feldspar with low mineral dissolution kinetics
Cortina and Vallejo, 1995; Berger et al., 2009). Even though these            (Chaudhuri et al., 2007). However, even if abiogenic dissolution
forest floor leachates may be directly re-utilized by plants and              of these minerals is slow, microorganisms such as arbuscular and
thus do not represent export fluxes per se, a substantial fraction            ectomycorrhizal fungi can access such minerals nevertheless (e.g.,
of these solubilised mineral nutrients nevertheless percolates                Jongmans et al., 1997; Parniske, 2008).
downwards into the mineral soil beneath the rooting depth. For                    That bedrock-derived nutrients are important to sustain long-
example, Kaiser et al. (2003) showed that up to about 70% (38 mg              term forest ecosystem nutrition was recently highlighted by
m−2 yr−1 ) of dissolved organic P (DOP) leached from the forest               Houlton et al. (2018) who show that nutrient supply by rock
floor infiltrated to depth. Furthermore, Gorham et al. (1979)                 weathering plays an important role in forest ecosystem nutrition
emphasized the downward movement of dissolved weathering                      even for nitrogen that is otherwise fixed from atmospheric
products beneath the rooting zone, thereby becoming unavailable               sources. Also, bedrock P concentrations exert an ecological
to the ecosystem. Comparing these estimates of nutrient loss                  control (Hahm et al., 2014). Still, compared to the organic
from the forest floor with estimates of their inventory in the                nutrient cycle this bedrock-derived flux is small. Cleveland et al.
forest floor, it becomes apparent that within only a few years this           (2013) for example suggested that geogenic P may supply only
nutrient pool is exhausted (Wilcke et al., 2002).                             as little as 2% P to terrestrial net primary productivity (NPP),
   To replace this loss, atmospheric deposition has been invoked.             the remainder stemming from recycling. Similarly Wilcke et al.
This source is particularly pertinent for tropical, non-eroding               (2017) demonstrated the dominance of the biological over the
ecosystems (Chadwick et al., 1999). But even in some temperate,               geogenic control on nutrient fluxes in tropical forest ecosystems.
eroding forest ecosystems, external atmospheric dry deposition                Thus, weathering-derived nutrients are considered to sustain
has been suggested to represent a significant nutrient source (e.g.,          long-term ecosystem nutrition, even though they present only
Aciego et al., 2017). However, other studies have suggested that              a small fraction of the net nutrient source to forest ecosystems.
in this latter case the nutrient loss flux exceeds the replacement            Consequently, the deep weathering zone gains increasing interest
flux from atmospheric dry deposition by a factor of a few (Uhlig              in advancing our understanding on how chemical and physical
et al., 2017) such that atmospheric inputs fail to prevent the                processes both operating at depth are coupled to biotic processes
development of nutrient limitation.                                           operating in the upper Critical Zone. Yet this field has not
   Thus, a pathway represented by the slow release of “new”                   advanced further because we lacked the means to establish the
mineral nutrients from the mineral soil and bedrock by chemical               budgets involved.

Frontiers in Earth Science | www.frontiersin.org                          2                                            July 2019 | Volume 7 | Article 159
Uhlig and von Blanckenburg                                                                                  Maintaining Forest Nutrition From Subsoil

   Suggesting such novel strategies for quantifying nutrient               requirement is integral to the method used to determine fluxes,
cycling into, from, and within forest ecosystems is the aim of             namely cosmogenic nuclides, and is thus inevitable. But even if
this study. Key to this attempt is introducing metrics designed in         this assumption is not strictly valid, deviation from steady state
weathering geochemistry into the fields of ecology and pedology.           will be minor given the slow response times that are ca. 104 years
As the suite of geochemical metrics presented in this paper                for the geogenic cycle. In contrast, for the organic cycles we do
integrate over timescales that differ substantially from those over        not assume steady state, and thus allow the inbound flux to differ
which ecological properties are measured, we do not draw refined           from the outbound flux for a given compartment. Hence the
conclusions from these comparisons. Rather, we use metrics                 resulting turnover time estimates may depend on the respective
for concept development, and thus evaluate them mainly by                  flux. Still, even for the organic compartments, some form of
comparing orders of magnitude.                                             quasi-steady state is required to prevent ecosystem limitation that
   We provide quantitative means to assess the importance                  might develop if a compartment were to run into depletion.
of the slow “geogenic nutrient pathway” through which fresh
material is uplifted into soil, and that is coupled to the fast            Geogenic Nutrient Pathway
“organic nutrient cycle” on long-term forest ecosystem nutrition           The geogenic nutrient pathway is characterized by the conversion
similar to the conceptual model of Buendía et al. (2010). While            of bedrock into regolith—defined here to comprise weathered
on short timescales the organic nutrient cycle appears to be               rock, saprolite and soil. This pathway encompasses regolith
highly efficient, over millennia, nutrient losses from the organic         production, nutrient release from primary and secondary
nutrient cycle must be balanced by nutrient uptake via the                 minerals by chemical weathering, lateral and vertical transport of
geogenic nutrient pathway. To underpin this hypothesis, we have            dissolved species through the regolith and groundwater aquifers
undertaken a case study to parameterise all components of the              which ultimately drain into a stream or lake, erosion of remaining
system in two mountainous catchments. These sites were chosen              solids, and for the remainder nutrient utilization by forest trees.
because even though they strongly differ in their nutrient supply
                                                                           Fluxes
fluxes through rock weathering, they are characterized by similar
                                                                           At the weathering front unweathered bedrock is converted into
forest primary productivity. We quantified nutrient cycling in
                                                                           regolith by regolith production (RP). At steady state RP is
forest ecosystems across several reservoirs of the Critical Zone:
                                                                           coupled to the total mass loss from the weathering profile (e.g.,
these extend from the unweathered bedrock that was accessed
                                                                           Heimsath et al., 1997; Lebedeva et al., 2010), so as to maintain
at up to 30 m depth by drilling, up to the tissue of trees.
                                                                           a constant thickness of regolith. Total mass loss comprises both
As a prerequisite for the way by which we apply these geo-
                                                                           particulate matter (physical erosion, E) and dissolved material
and biogeochemical measurements for hypothesis evaluation, we
                                                                           (chemical weathering, W), and the combined mass loss flux is
developed a conceptual framework including a series of simple
                                                                           the denudation flux D (Equation 1). This denudation flux can
mass balance equations that combine nutrient fluxes, inventories
                                                                           be determined, for example, by cosmogenic nuclides such as
and turnover times.
                                                                           in situ 10 Be (section Calculation of Fluxes and Inventories in
                                                                           Forest Ecosystems).
CONCEPTUAL FRAMEWORK                                                                             RP = D = E + W                                  (1)

Consider a forest ecosystem extending from the top of the                  An estimate of the time-integrated total amount of elements
vegetation canopy down to unweathered bedrock from a                       (X) in the dissolved form in this process can be made from
conceptual standpoint (Figure 1), a zone now commonly termed               the chemical depletion fraction (CDF). The CDF uses the
the “Critical Zone” (Brantley et al., 2007; Lin, 2010). Each box           relative enrichment of an inert mineral’s refractory element (Xi )
in Figure 1 represents a compartment of the forest ecosystem               compared to parent bedrock to quantify the relative dissolved
comprising a nutrient inventory and a nutrient turnover time.              mass loss in the regolith. For this purpose, we ratio the
The turnover time is calculated as the inventory of a given                concentration of such a chemically immobile element ([Xi ])
compartment divided by a nutrient input or output flux and                 (Merrill, 1906; Barth, 1961) in unweathered parent bedrock (p)
describes the mean time a constituent spends in the respective             to its concentration in weathered regolith (r) (Brimhall and
compartment after entry and before exit (Sierra et al., 2017). In          Dietrich, 1987; Riebe et al., 2003) in Equation (2). A CDF-
explaining the conceptual framework, we follow a given nutrient            value of 0 indicates no chemical depletion, while a CDF-value
from its bedrock source through forest trees to the forest floor. In       of 1 would mean that parent bedrock dissolution has run to
doing so we parameterise nutrient fluxes and inventories in the            completion. In reality, since quartz and secondary precipitates
geogenic nutrient pathway and the organic nutrient cycle to be             remain even in heavily weathered regolith the global observed
able to quantify turnover times. A glossary on the metrics used            maximum CDF approaches a value of 0.5 to 0.7, depending on
throughout this paper is provided in Table 1 and more detailed             bedrock mineralogy (Dixon and von Blanckenburg, 2012).
information on the calculation and limitations of the metrics                                                  [Xi ]p
is given in section Calculation of Fluxes and Inventories in                                     CDF = 1 −                                       (2)
                                                                                                               [Xi ]r
Forest Ecosystems.
   For the geogenic cycles we assume steady state of fluxes                The chemical weathering flux can be disentangled from total
and hence compartment sizes that do not vary with time. This               denudation by multiplying the CDF by D (Riebe et al., 2003)

Frontiers in Earth Science | www.frontiersin.org                       3                                           July 2019 | Volume 7 | Article 159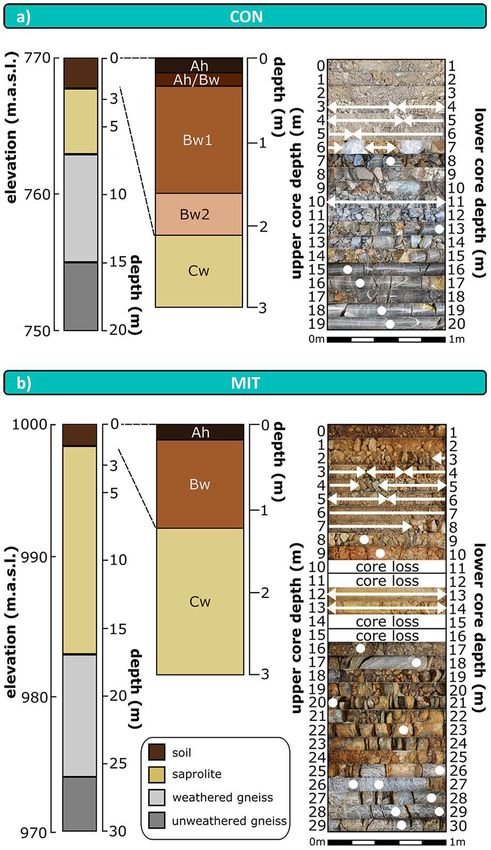
Uhlig and von Blanckenburg Maintaining Forest Nutrition From Subsoil
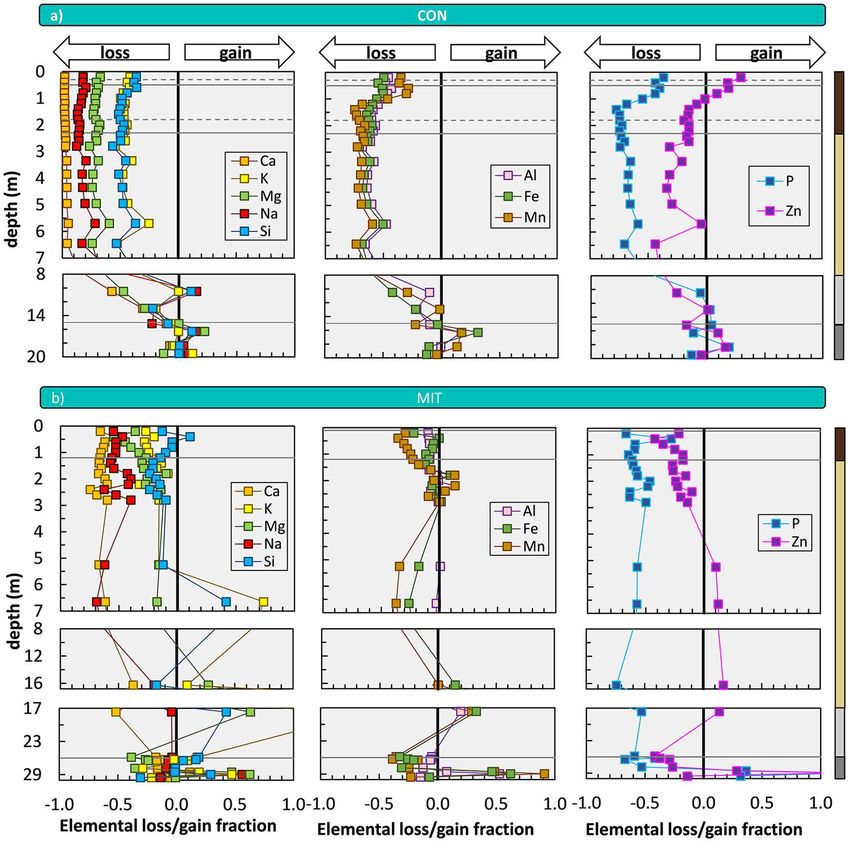
FIGURE 1 | A conceptual forest ecosystem comprising the “geogenic nutrient cycle” which is mainly effected by nutrient release through chemical weathering
X
(Wregolith ) and the “organic nutrient pathway” which is mainly effected by nutrient re-utilization (recycling) from organic matter (RecX ). Individual compartments
are presented as boxes including the metrics used to quantify their properties: nutrient inventory (I) and nutrient turnover time (T) of element X. The first subscript refers
to the ecosystem compartment (“ff” denotes forest floor, “bioav” denotes the biologically available fraction and “regolith” denotes soil, saprolite and weathered rock,
respectively). The second subscript refers to the flux used to calculate the respective turnover time (“U” denotes nutrient uptake, “L” denotes litterfall, “W” denotes
chemical weathering). Compartments are linked by fluxes (arrows), where the thickness of the arrows indicates the relative proportions. Fluxes include nutrient uptake
(U), chemical weathering (W), erosion (E) of soil or organic matter (org), and litterfall (L). “Rec” denotes nutrient recycling. Detailed information on the metrics is
provided in Table 1. Figure is not drawn to scale.
(Equation 3). Accordingly, E can be calculated from the prior to uptake. Specifically, τXXi is the concentration ratio of
difference between D and W (Equations 1, 3). a chemically immobile element ([Xi ]) to a chemically mobile
element of interest ([X]) in parent bedrock and the regolith
W = D · CDF (3) (Equation 5) (Brimhall and Dietrich, 1987; Anderson et al., 2002).
If τXXi is negative, a fraction of element X was lost by mineral
Absolute mass fluxes can be expressed as elemental fluxes, which dissolution. Conversely, if τXXi is positive, a fraction of element X
form the basis to assess the cycling of mineral nutrients between was added by admixing of organic matter or external atmospheric
forest ecosystem compartments. For example, RP is expressed as inputs into the regolith, or by translocation of elements through
RPX by multiplying RP with the concentration of the element of nutrient uplift and recycling. Also, τXXi can be positive if elements
interest (X) in unweathered parent bedrock (Equation 4). (e.g., Al, Fe, Mn) are mobilized as solute or colloid from topsoil
and re-precipitate as secondary precipitates or deposit at depth
RPX = D · [X]rock (4) after vertical translocation (e.g., Brantley and Lebedeva, 2011).
If τXXi is zero, neither loss nor gain occurred, and unweathered
Chemical weathering of bedrock and regolith releases elements
parent bedrock is present, or inputs are balanced by outputs.
dissolved from primary minerals into solution. A dissolved
element X may follow one of three paths: it may be exported [Xi ]p [X]r
as solute via the stream, it may be utilized by forest trees, or it τXXi = · −1 (5)
may be incorporated into or adsorbed onto secondary minerals [Xi ]r [X]p
or (oxy-)hydroxides. An estimate of the time-integrated total X
amount of an individual element following the first two paths can The elemental chemical weathering flux (Wregolith ) provides
be made based on the elemental mass transfer coefficient (τXXi ). τXXi the time-integrated dissolution flux of element X from primary
quantifies the relative loss or gain of element X in the weathering minerals minus the incorporation flux of X into secondary
X
minerals and (oxy-)hydroxides formed in the regolith. Wregolith
zone and provides a maximum estimate of dissolved nutrients
available to forest trees, as some solute can be lost into the stream is inferred from the total denudation flux, the mass transfer
Frontiers in Earth Science | www.frontiersin.org 4 July 2019 | Volume 7 | Article 159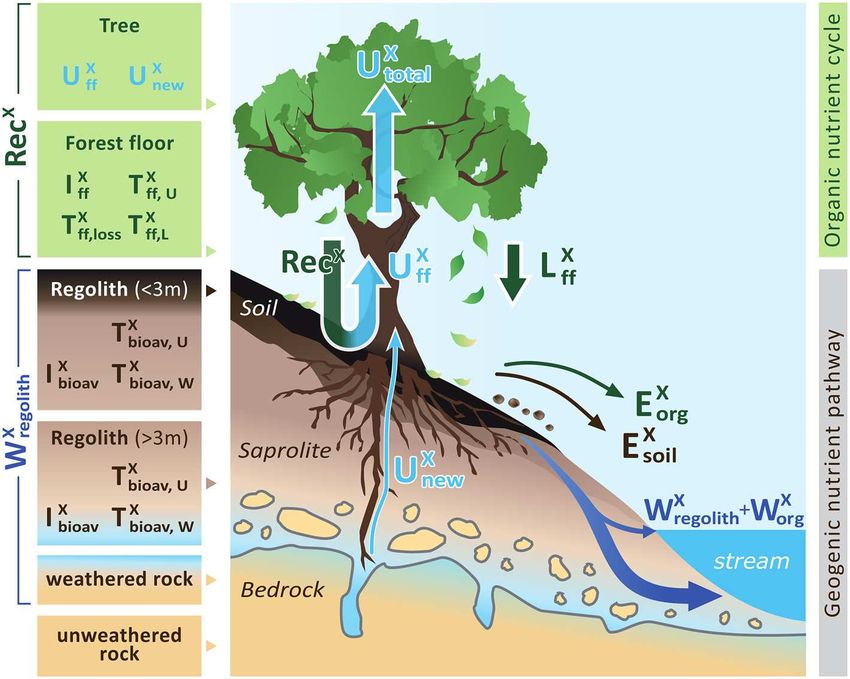
Uhlig and von Blanckenburg                                                                                                              Maintaining Forest Nutrition From Subsoil

TABLE 1 | Glossary of metrics.

TOTAL MASS FLUXES (e.g., in g m−2 yr−1 )
D                           Denudation rate; i.e. the sum of chemical and physical denudation; Equation (1); section Geogenic Nutrient Pathway
E                           Erosion rate; physical removal of primary and secondary minerals and biogenic material; Equations (1, 3), section Geogenic Nutrient Pathway;
                            Figure 1
W                           Weathering rate; chemical release flux from minerals minus the flux of incorporation into secondary minerals and oxides; Equation (3);
                            section Geogenic nutrient pathway; Figure 1
GPP                         Gross primary production; gross carbon input to forest ecosystem; section Organic Nutrient Cycle
NPP                         Net primary production; carbon fixation by the forest ecosystem minus respiration; section Organic Nutrient Cycle
ELEMENTAL FLUXES FX (e.g., in mg m−2 yr−1 )
 X
Wregolith                   Chemical weathering flux of element X; release flux of X from minerals minus the flux of incorporation of X into secondary minerals and
                            oxides; Equation (6); section Geogenic Nutrient Pathway; Figure 1
 X
Eorg                        Litter erosion flux of element X; particulate removal of plant litter from forest floor; section Organic Nutrient Cycle; Figure 1
SXorg                       Plant litter solubilisation flux; flux of element X leached from organic matter in the forest floor; section Organic Nutrient Cycle
 X
Worg                        Dissolved plant litter export flux; export of plant litter after decomposition, solubilisation and rapid transport along preferential flow pathways
                            into the stream; section Organic Nutrient Cycle; Figure 1
LX                          Litterfall flux of element X; nutrient return by leaf litterfall from trees to the forest floor; Figure 1
 X
Utotal                      Total nutrient uptake flux of element X; uptake of X by forest trees at the ecosystem scale; Equation (9); section Organic Nutrient Cycle;
                            Figure 1
UffX                        Nutrient uptake flux of element X from the forest floor; Figure 1
 X
Unew                                                                                                                                                   X and W X ; Equation
                            Nutrient uptake flux of ‘new’ element X from the biologically available regolith fraction to replace the nutrient loss by Eorg    org
                            (13); section Coupling the Geogenic Nutrient Pathway with the Organic Nutrient Cycle; Figure 1
DepXwet                     Atmospheric wet deposition flux of element X in open rainfall
ELEMENTAL MASS FRACTIONS AND ELEMENTAL FLUX RATIO fX (dimensionless)
CDF                         Chemical depletion fraction; fractional mass loss by dissolution of elements from the regolith; Equation (2); section Geogenic Nutrient Pathway
τXX                         Mass transfer coefficient of element X calculated using an immobile Xi (here Zr is used); elemental loss or gain relative to unweathered bedrock;
       i
                            Equation (5), section Geogenic Nutrient Pathway
RecX                        Nutrient recycling factor; number of cycles element X is re-utilized from plant litter after its initial release from rock; Equation (16), section
                            Coupling the Geogenic Nutrient Pathway with the Organic Nutrient Cycle; Figure 1
ELEMENTAL INVENTORIES IX (e.g., in g m−2 )
IffX                        Inventory of element X in the forest floor; Equation (7), section Organic Nutrient Cycle; Figure 1
 X
Ibulk                       Inventory of element X in bulk regolith; Equation (7), section Geogenic Nutrient Pathway
 X
Ibioav                      Inventory of element X in the biologically available fraction; Equation (7); section Geogenic Nutrient Pathway; Figure 1
ELEMENTAL TURNOVER TIMES TX (e.g., in yr)
Ti,jX                       Turnover time of element X in compartment i with respect to input or output flux j; the ratio of total stock of element X in i to input or output flux j.
 X
Tff,L                       Turnover time of element X in the forest floor with respect to litterfall; mean time required to replace one inventory of element X in the forest floor
                            through litterfall; Equation (12); section Organic Nutrient Cycle; Figure 1
 X
Tff,U                       Turnover time of element X in the forest floor with respect to uptake into trees; mean time a nutrient rests in the forest floor before re-utilization
           ff
                            by forest trees; Equation (11); section Organic Nutrient Cycle; Figure 1
 X
Tff,loss                    Turnover time of element X in the forest floor with respect to loss by plant litter erosion and dissolved plant litter export; mean time element X
                            can sustain nutrient uptake before loss into the stream; Equation (10); section Organic Nutrient Cycle; Figure 1
 X
Tbioav,W                    Turnover time of element X in the biologically available fraction in regolith with respect to adsorption onto clay minerals; mean time over which
                            the inventory of the biologically available fraction is replenished by chemical silicate weathering in the absence of other gains or losses;
                            Equation (8); section Geogenic Nutrient Pathway; Figure 1
 X
Tbioav,U                    Turnover time of element X in the biologically available fraction in regolith with respect to uptake into trees; mean time the nutrient rests in the
                new
                            biologically available regolith fraction before transfer into trees in the absence of other gains or losses; Equation (17); section Coupling the
                            Geogenic Nutrient Pathway with the Organic Nutrient Cycle; Figure 1

coefficient (τXXi ) and the concentration of element X in                                      stream or utilized by vegetation, from which it can also be drained
unweathered parent bedrock by multiplying Equation 4 with the                                  into the stream after solubilisation from litter.
negative of Equation 5 (Equation 6).
                                                                                               Inventories
                      WXregolith = D · [X]rock · −τXXi

                                                                                     (6)       The inventory of element X provides a metric on the total stock of
                                                                                               element X in the regolith. This inventory in compartment j (IjX ),
                   X
The fraction of Wregolith which is not involved in secondary                                   where j denotes bulk regolith (bulk), the forest floor (ff), or the
mineral or (oxy-)hydroxide formation is either drained into the                                biologically available fraction of regolith (bioav), is calculated by

Frontiers in Earth Science | www.frontiersin.org                                           5                                                     July 2019 | Volume 7 | Article 159
Uhlig and von Blanckenburg                                                                                    Maintaining Forest Nutrition From Subsoil

the integral of the depth interval’s concentration of element X in        into a total annual dry biomass production flux of the element
compartment j ([X]j ), the soil density (ρ) and the thickness (dz)        of interest.
of the respective depth interval (Equation 7).
                                                                                                           NPP · [X]tree
                                                                                               UXtotal =                                           (9)
                                  Z   z                                                                      [C]tree
                          IXj =           [X]j · ρ · dz        (7)
                                   z=0
                                                                          After nutrient utilization, nutrients are returned to the forest
                                                                          floor by litterfall (LX )–comprising non-woody foliage (leaves
Turnover Times
                                                                          and needles), woody foliage (twigs), dead roots and whole trees
Following the terminology suggested for terrestrial ecosystem
                                                                          after windthrow. Subsequently these nutrients can be utilized
ecology by Sierra et al. (2017) and Spohn and Sierra (2018) the
                                                                          directly from plant litter by animals such as earthworms (Resner
turnover time is a quantification of the capacity of an ecosystem
                                                                          et al., 2014). However, within the context of this study this
to store and cycle an element. In other words, the turnover time of
                                                                          consumption represents a soil-internal cycle that does not impact
element X in compartment j represents the mean time an element
                                                                          fluxes between compartments. In contrast, such flux is generated
X remains in a given compartment before being transferred
                                                                          when nutrients are re-utilized by tree roots after plant litter
from this source compartment into another compartment. In
                                                                          solubilisation (SXorg ), or are lost from the forest ecosystem in
this sense it may be considered analogous to the concept of a
                                                                          particulate form by plant litter erosion (Eorg X ) or in solute form
residence time in hydrology or geochemistry. Turnover time can
                                                                          after plant litter decomposition, solubilisation and export (Worg X ).
thus be defined as the ratio of the inventory of a compartment
(pool) to the input flux into the pool or output flux from the                 In the absence of difficult field-based measurements of the
                                                                          elemental plant litter erosion flux (Eorg  X ), a rough estimate of
pool. We do not require the balance of inbound and outbound
fluxes and thus do not assume the steady state of inventories.            this flux can be calculated from the product of the cosmogenic
Yet, over the timescale of a few turnover times the fluxes must           in situ 10 Be-derived erosion flux (E) in units t km−2 yr−1 , the
attain some balance to avoid total depletion. The total turnover          concentration of element X in the litter layer and a density
time in the compartments we consider is governed by several               ratio of bedrock to plant litter that converts the annual 10 Be-
in- and outbound fluxes. We do not consider total turnover (or            derived mass per area erosion flux of bedrock into an annual
residence) times for these compartments. Rather, we calculate             mass per area erosion flux of plant litter. This estimate likely
turnover times with respect to one specific flux (denoted by the          provides a minimum flux, as the low-density litter is removed
                                      X
second subscript). For example, Tbioav,W     represents the mean          more readily than the higher-density quartz minerals measured
time element X spends in the biologically available inventory             for cosmogenic nuclide-based erosion rates.
with respect to supply from dissolution of primary minerals                    The elemental plant litter solubilisation flux (SXorg ) can be
                                   X
and secondary precipitates (Wregolith   ) (Equation 8). Thereby,          estimated from the product of the inventory of the forest floor
  X
Tbioav,W provides the minimum turnover time estimate, as some             (IffX , Equation 7) and a plant litter decay rate constant (k, yr−1 ),
               X
fraction of Wregolith could be directly drained via groundwater           where 1/k represents the total, non-element specific turnover
                                                                          time of plant litter. However, only a fraction of SXorg is exported
into streams instead of arriving in the biologically available
                                                                          from the ecosystem because some fraction is directly re-utilized
fraction by e.g., adsorption.
                                                                          by forest trees after solubilisation. We term the exported fraction
                                                                                                                     X ). Unfortunately, direct
                                                                          the dissolved plant litter export flux (Worg
                                              IXbioav                     measurements of Worg    X are still lacking. A rough estimate can
                           TXbioav,W =                         (8)
                                            WXregolith                    be obtained by assuming that preferential flow is the primary
                                                                          transport pathway of water and thus for dissolved nutrients from
                                                                          forest soils (e.g., Julich et al., 2017). The high velocity of lateral
Organic Nutrient Cycle
                                                                          subsurface water flow combined with the lack of sorption sites
Put simply, the organic nutrient cycle incorporates nutrient
                                                                          along these pathways prevents the retention of dissolved organic
uptake from forest trees, nutrient return to the forest floor                                                   X can be estimated from the
                                                                          nutrients (Jarvis, 2007). Thus, Worg
followed by either nutrient re-utilization or nutrient export from
                                                                          product of the nutrient concentration in deep lateral subsurface
the forest ecosystem by the stream.
                                                                          water and discharge, provided that deep lateral subsurface flow
Fluxes                                                                    contributes to groundwater recharge which ultimately drains into
The total nutrient uptake flux of the entire forest ecosystem             the stream.
   X ) can be quantified from estimates of gross primary
(Utotal
                                                                          Turnover Times
production (GPP). As GPP includes the release of carbon by
                                                                          The turnover time of element X in the forest floor with respect to
plant mitochondrial respiration, which accounts for 50% of the
                                                                          loss by plant litter erosion and solute export is TffX,loss (Equation
GPP flux (Chapin et al., 2012), GPP must be converted into
net primary productivity (NPP). We determined Utotal      X   from        10). We note that TffX,loss merely presents a rough estimate, as
Equation (9), where [X]tree is the bulk tree nutrient concentration                X nor W X can be estimated with certainty. Also, both
                                                                          neither Eorg        org
in dry biomass and [C]tree is the carbon concentration of bulk tree       parameters depend on the time X is cycled through forest trees
of 50 wt.-%. Equation (9) converts the carbon-based NPP flux              which prevents it from loss (see section Calculation of Fluxes and

Frontiers in Earth Science | www.frontiersin.org                      6                                              July 2019 | Volume 7 | Article 159
Uhlig and von Blanckenburg                                                                                      Maintaining Forest Nutrition From Subsoil

Inventories in Forest Ecosystems).                                             Nutrient Recycling Factor
                                                                               The fraction of nutrient X that is returned to the forest floor by
                                            IX                                 litterfall (LX ) and is neither eroded as plant litter nor lost into
                          TXff,loss   = X ff X                     (10)        the stream after being leached from plant litter can be re-utilized
                                       Eorg + Worg
                                                                               by forest trees. We term this re-utilization process “nutrient
                                                                               recycling” and assess the efficiency of the nutrient recycling loop
The turnover time of element X in the forest floor with respect
                                                                               with the “nutrient recycling factor” (RecX ). RecX is a metric that
to the outbound nutrient uptake flux by forest trees is TffX,U
                                                                      ff       quantifies the efficiency of uptake of a nutrient relative to its
(Equation 11) (where UffX represents the major fraction of the                 release by weathering. We parameterise this nutrient recycling
total nutrient uptake flux, see section Coupling the Geogenic                  factor by the ratio of the total nutrient uptake flux of element X
                                                                                   X ) relative to U X (Equation 15).
                                                                               (Utotal
Nutrient Pathway with the Organic Nutrient Cycle).                                                    new

                                               IXff                                                     UXtotal      Utotal X
                                 TXff,Uff =                        (11)                        RecX =           =                                      (15)
                                              UXff                                                      UXnew     EXorg + WXorg

The turnover time of element X in the forest floor with respect                                                                   X and W X
                                                                               Because over millennia the replacement flux for Eorg           org
to the inbound litterfall flux (LX ), where LX is annual nutrient              must originate from the geogenic pathway we parameterise RecX
return from forest trees to the forest floor, is TffX,L (Equation                            X
                                                                               by dividing Utotal      X
                                                                                                  by Wregolith (Equation 16, Uhlig et al., 2017).
12). We note that LX represents only a minimum estimate of                     This parameterisation of RecX circumvents the impossibility
annual nutrient return, as measurements of LX account mostly                   of measuring Unew X    directly and the challenges involved in
for fine litterfall only, but not for root mortality, branch fall                            X
                                                                               estimating Eorg and Worg  X (see section Calculation of Fluxes
and windthrow.                                                                 and Inventories in Forest Ecosystems). Note that RecX therefore
                                                                               represents a minimum estimate of the number of nutrient uptake
                                              IXff                             and re-utilization cycles of element X through forest trees. This is
                                  TXff,L =                         (12)
                                              LX                               because not all of the weathering release flux may be available
                                                                               to forest trees, if some of this flux is lost, for example, into
Coupling the Geogenic Nutrient Pathway                                         groundwater before nutrient uptake.
With the Organic Nutrient Cycle
Fluxes                                                                                                           UXtotal
In our conceptual forest ecosystem, the fluxes of      X
                                                      Eorg (plant litter                              RecX =                                           (16)
                                                                                                               WXregolith
erosion flux) and WorgX (dissolved plant litter export flux) must be

balanced by a replacement flux to preserve the ecosystem from                  Turnover Times
nutrient limitation that would otherwise develop on the long-                  In a conceptual forest ecosystem in which the organic nutrient
term. Following the terminology in Cleveland et al. (2013) we                  cycle is coupled to the geogenic nutrient pathway, the inventory
term this nutrient uptake replacement flux that stems from fresh               of the biologically available fraction of the regolith represents a
nutrients “new” (UnewX ), as it comprises nutrients that are utilized                                         X . The turnover time of element
                                                                               source for the forest trees’ Unew
by forest trees for the first time and are not re-utilized from the            X in the biologically available fraction of the regolith with
forest floor. Such new nutrients could be sourced from external                                                                           X
                                                                               respect to new nutrient utilization by forest trees is Tbioav,U new
atmospheric wet and dry deposition or, if these external fluxes are            (Equation 17).
                          X
negligible relative to Wregolith         X
                                 , from Wregolith itself. We have no a
                                          X
priori means to assess how much of Wregolith    is used for nutrient                                                  IXbioav
uptake by forest trees, as some of the weathering flux is likely                                     TXbioav,Unew =                                    (17)
                                                                                                                      UXnew
drained via groundwater into the stream. By assuming that Unew   X

at best balances nutrient losses from the organic nutrient cycle,              STUDY SITES
we instead equate UnewX with the sum of nutrient loss from plant

litter erosion and dissolved plant litter export by Equation 13.               Our two study sites are in the uplands of southern Germany:
                                                                               Conventwald (CON) in the Black Forest (Schwarzwald) and
                           UXnew = EXorg + WXorg                   (13)        Mitterfels (MIT) in the Bavarian Forest (Bayerischer Wald).
                                                                               Both are part of the long-term forest ecosystem monitoring
  X in Equation (14), the total uptake flux of X reflects both the
Utotal                                                                         program “International Co-operative Program on assessment
fraction of element X utilized from the forest floor (UffX ) and the           and monitoring of air pollution effects on forests (ICP Forest
                 X ).                                                          Level II)” and are study sites of the DFG priority program
‘new’ nutrient (Unew                                                           SPP 1685 “Ecosystem Nutrition—Forest Strategies for limited
                                                                               Phosphorus Resources”. For details of location, climatic regime,
                         UXtotal = Uff X + Unew X                  (14)        vegetation, geomorphology, and mineralogy at each catchment

Frontiers in Earth Science | www.frontiersin.org                           7                                               July 2019 | Volume 7 | Article 159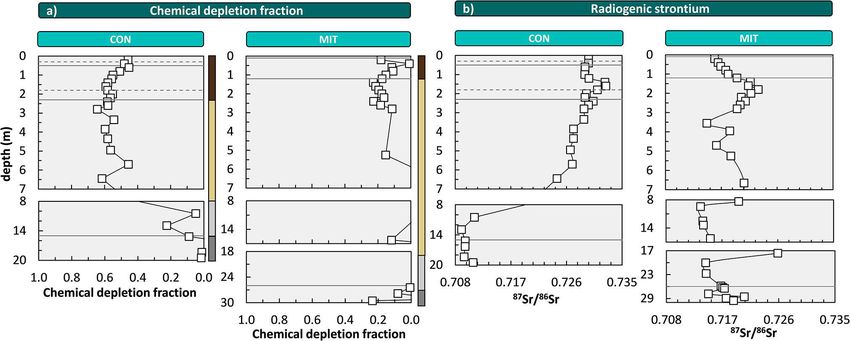
Uhlig and von Blanckenburg                                                                                                  Maintaining Forest Nutrition From Subsoil

TABLE 2 | Characteristics of the study sites in the Black Forest (CON,                     at MIT with DepXwet of K, Ca, and Na all being in the range
Schwarzwald) and the Bavarian Forest (MIT, Bayerischer Wald).                              of 300–600 mg m−2 yr−1 at MIT and 200–300 mg m−2 yr−1 at
Study site                            Conventwald             Mitterfels
                                                                                           CON (Table 3). At MIT the relative elemental abundances do
                                      (CON)                   (MIT)                        not resemble any natural dust source and are most likely caused
                                                                                           by anthropogenic inputs. Thus, we consider wet atmospheric
Longitude1                            48◦ 1.20222′ N          48◦ 58.54860′ N              deposition fluxes to contribute to tree nutrition at MIT only
Latitude1                             7◦ 57.93996′ E          12◦ 52.49388′ E              since industrialization and modern land use. Over the time scales
Altitude (m.a.s.l.)                   733–863                 985–1,037                    of this study (millennia) atmospheric inputs can be considered
Slope (◦ )                            17 (south-facing)       10 (west-facing)             negligible compared to rock weathering sources (Tables 2, 3).
Mean annual temperature (◦ C)2        6.8                     5.5
Mean annual precipitation (mm)2       1,749                   1,580
                                                                                           METHODS
Main vegetation type                  Fagus sylvatica,        Fagus sylvatica,
                                      Picea abies             Picea abies                  Sampling
Soil type (WRB)3                      Dystric Cambisol        Dystric Cambisol             Forest floor samples originate from soil pits sampled by Lang
Lithology                             Paragneiss              Paragneiss                   et al. (2017) nearby and upslope the drill sites at each study site.
Mineralogy of parent bedrock4         Quartz: 12%             Quartz: 20%                  Regolith was sampled at depth increments of 20 cm from a 3 m
                                      Anorthite: 27%          Anorthite: 16%
                                                                                           deep trench. Regolith beyond 3 m depth was sampled from 20 m
                                      Albite: 25%             Albite: 31%
                                      K-feldspar: 12%         K-feldspar: 16%
                                                                                           (CON) and 30 m (MIT) deep drill cores as composite samples
                                      Pyroxene: 9%            Pyroxene: 5%                 collected from about 0.5 m to about 1 m core sections (Figure 2).
                                      bt*, chl*,              bt*                          Diesel-powered wireline core-drilling was required, as thick
                                      crd+ , hbl*                                          regolith containing periglacial slope deposits of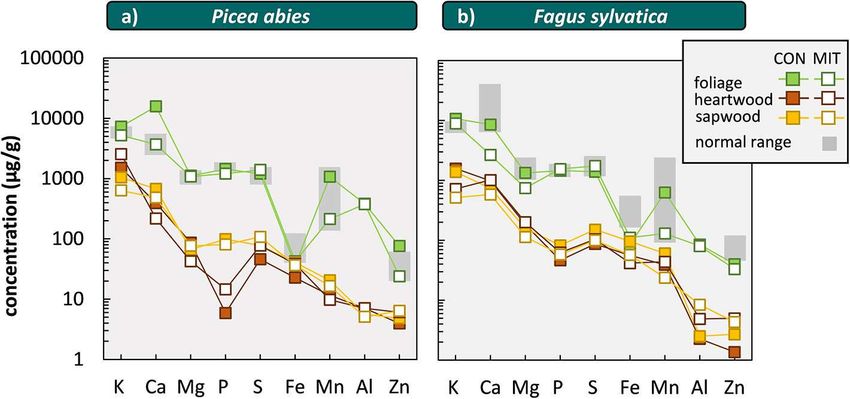
Frontiers in Earth Science | www.frontiersin.org
Uhlig and von Blanckenburg
TABLE 3 | Elemental fluxes at CON and MIT.
K Ca Mg P Na Al Fe Mn Zn
CON MIT CON MIT CON MIT CON MIT CON MIT CON MIT CON MIT CON MIT CON MIT
(mg m−2 yr−1 ) (mg m−2 yr−1 ) (mg m−2 yr−1 ) (mg m−2 yr−1 ) (mg m−2 yr−1 ) (mg m−2 yr−1 ) (mg m−2 yr−1 ) (mg m−2 yr−1 ) (mg m−2 yr−1 )
RPX 2,200 1,300 5,600 1,600 2,900 730 120 110 2,900 1,500 1,2000 5,100 7,000 2,600 120 40 11 7.1
(uncertainty) 320 200 580 280 380 240 27 70 410 200 1,000 610 1,100 770 17 13.0 1.6 2.60
X
Wregolith 1,000 240 5,500 980 2000 400 84 65 2400 780 7,100 280 4,500 160 80 14 2.4 3.0
(uncertainty) 150 130 470 150 210 33 10 12 240 200 860 230 510 190 8.3 1.2 1.2 0.24
X
Wregolith * 1,000 170 5,500 980 2000 180 76 65 2,400 780 6,700 280 4,500 170 70 5.8 1.3 1.2
(uncertainty)* 160 310 480 150 200 130 17 13 230 190 1,000 220 520 270 19 6.8 2.1 1.2
DepX1
wet 160 340 380 580 53 73 7.1 46 290 360 n.d. 48 n.d. 58 10 35 42 n.d.
(uncertainty) 57 220 79 270 11 27 5.5 35 88 180 n.d. 26 n.d. 18 5.1 35 45 n.d.
X
Utotal 6,400 5,000 8,700 2,400 830 650 960 900 48 68 190 150 66 72 600 160 42 23
(uncertainty) 1,200 1,200 2,400 430 87 130 54 120 9.3 70 110 93 24 23 170 39 13 5.1
LX1 1,700 1,700 1,700 1400 430 320 330 410 n.d. n.d. 170 54 110 54 230 180 15 14
(uncertainty) 980 500 280 310 150 100 120 170 n.d. n.d. 66 18 46 16 50 43 0.57 3.2
UffX 5,800 4,400 7,400 1,100 400 240 910 820 n.d. n.d. n.d. n.d. n.d. n.d. 570 120 n.d. n.d.
X
Unew 640 610 1,300 1,300 430 420 51 73 990 990 85 84 36 38 37 38 n.d. n.d.
X
Eorg 150 110 230 220 46 36 28 49 7.7 5.0 24 23 15 17 25 26 n.d. n.d.
9
SXorg 2,800 1,600 4,400 3,100 1,200 820 1,400 1,100 530 380 4,700 4,200 2,400 2,000 390 380 n.d. n.d.
X
Worg 500 500 1,100 1,100 380 380 23 23 980 980 60 60 21 21 12 12 n.d. n.d.
X
RPX = regolith production flux, Wregolith = chemical weathering flux, DepXwet = wet atmospheric deposition flux, Utotal
X = ecosystem nutrient uptake flux, LX = litterfall flux, UffX = forest floor nutrient uptake flux, Unew
X = nutrient uptake flux
X = plant litter erosion flux, SX = plant litter solubilisation flux, W X = dissolved plant litter export flux
from the biologically available fraction, Eorg org org
* Includes the 0–1.4 m depth section in the calculation of W X
regolith .
1 data provided by the Bayerische Landesanstalt für Wald und Forstwirtschaft (LWF) for MIT and the Forstliche Versuchsanstalt Baden-Wuerttemberg (FVA) for CON.
X
Uncertainties of Wregolith X
and Utotal are estimated by Monte-Carlo simulations (see section Calculation of Fluxes and Inventories in Forest Ecosystems) and of RPX by conservative error propagation.
Maintaining Forest Nutrition From Subsoil
July 2019 | Volume 7 | Article 159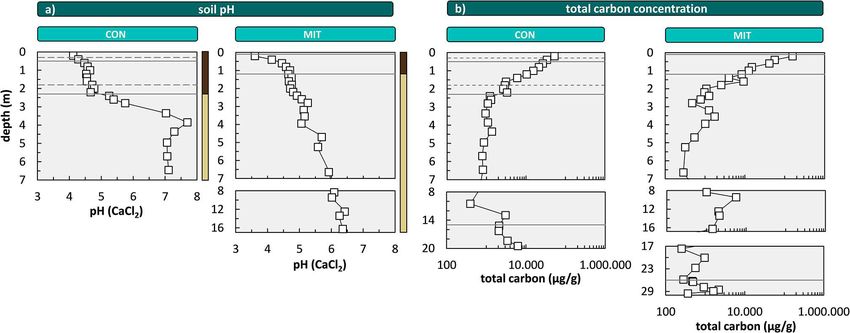
Uhlig and von Blanckenburg                                                                                               Maintaining Forest Nutrition From Subsoil

                                                                                        and respective uncertainties are reported in Uhlig and von
                                                                                        Blanckenburg (2019).

                                                                                        Chemical Composition of Vegetation
                                                                                        Leaves and needles were rinsed in the field with deionised water
                                                                                        (Milli-Q, 18 MΩ) to avoid contamination by dust particles.
                                                                                        All plant tissues were oven-dried (60◦ C, 24 h), crushed and
                                                                                        homogenized. Sections of heartwood (dead part of stem wood)
                                                                                        and sapwood (living part of stem wood) spanning several
                                                                                        consecutive annual rings were sampled from core wood and
                                                                                        cut into pieces of ∼5 cm length. Samples were digested in PFA
                                                                                        vials using a microwave (MLS start) and ultrapure concentrated
                                                                                        acid mixtures comprising H2 O2 , HNO3 , HCl, and HF. The
                                                                                        HF treatment was performed to destroy any Si-containing
                                                                                        precipitates that may have formed after total evaporation of
                                                                                        the dissolved sample. Chemical compositions were analyzed by
                                                                                        inductively coupled plasma optical emission spectrometry (ICP-
                                                                                        OES, Varian 720ES) for major and trace element concentrations,
                                                                                        with relative uncertainties of 10% (see Table S3 in Uhlig and von
                                                                                        Blanckenburg, 2019). The international reference material SRM
                                                                                        1515 (apple leaves, NIST) was processed with each sample batch.

                                                                                        In situ 10 Be Concentrations in Quartz
                                                                                        To determine in situ 10 Be concentrations bedload sediment was
                                                                                        sampled at the outlet of the catchment. This averaged the spatially
                                                                                        heterogeneous in situ 10 Be concentrations of soil over the entire
                                                                                        catchment area and ensured that flux estimates are representative
                                                                                        over all possible topographic positions. Bedload sediment was
                                                                                        sieved to 125–250 µm and this aliquot was purified from matrix
                                                                                        minerals to yield 10 g of pure quartz. Beryllium was separated
                                                                                        from matrix elements by cation chromatography following the
                                                                                        method described in von Blanckenburg et al. (2004), oxidized
                                                                                        and analyzed at the University of Cologne Center for Accelerator
                                                                                        Mass Spectrometry (AMS). Procedural blanks were run with each
                                                                                        sample batch and subtracted from the samples. The 10 Be blank
                                                                                        contribution was about 5%.
 FIGURE 2 | Schematic depth distribution of drill cores and soil profiles (left         Soil pH
 hand side); stacked photographs of drill core sections with labeled sampling
 points and sampled depth intervals (right hand side) at CON (a) and MIT (b).
                                                                                        The pH of soil and saprolite (hereafter termed “soil pH” for
 Arrows and cycles illustrate sampling points and depth intervals, respectively.        ease) was analyzed after suspension in 0.01 M CaCl2 . Specifically,
 Sampled depth intervals were selected to correspond to drill sections and              soil pH was measured in a suspension of 1 g oven-dried
 changes in regolith appearance. Polyethylene bags at CON between 6 and                 (60◦ C, 24 h) bulk soil/saprolite (
Uhlig and von Blanckenburg Maintaining Forest Nutrition From Subsoil differs, a separate procedure was required for P; see below). exchange resin (termed “resin P”), 0.5 M NaHCO3 (termed “P- Sample to extractant ratios of 1:7 were used throughout (14 ml NaHCO3 ”), 0.1 M NaOH (termed “P-NaOH”), and 1 M HCl of reactants to 2 g of dried bulk soil, sieved to
Uhlig and von Blanckenburg                                                                                  Maintaining Forest Nutrition From Subsoil

of von Blanckenburg (2006)]. D was calculated from Equation 18,            Some τZr X -profiles exhibit strong depth dependencies. These

where PROD is the production rate (at g−1 yr−1 ) of cosmogenic             depth dependencies are characteristic for depletion profiles,
10 Be at the Earth surface in quartz, [10 Be]
                                              in situ the measured         depletion-enrichment profiles and biogenic profiles (Brantley
cosmogenic nuclide concentration (at g−1 ), λ is the decay                 and Lebedeva, 2011). For these τZr     X -profiles either the most

constant (yr−1 ) of 10 Be and 3 the cosmic ray absorption mean                        X -values from the shallowest mineral soil sample (for
                                                                           negative τZr
free path (150 g cm−2 ) in rock. To calculate D a PROD of 4.01 at          depletion profiles at MIT) or average τZr X -values from below the

g−1 yr−1 at sea-level high latitude (SLHL) (Lal, 1991; Stone, 2000)        enrichment horizons from 1.4 to 7.0 m depth (for depletion-
was used and scaled for altitude and latitude (Stone, 2000). The           enrichment profiles at CON) were used. In addition, we tested
total denudation rate is reported in Table 2.                              whether including the 0–1.4 m depth section in the calculation of
                                                                           the Weathering profiles’ τZrX -value results in different weathering

                             PROD                                                                   X∗
                                                                           fluxes and call these Wregolith (Table 3). Including these shallow
                   D = 10              −λ 3                    (18)
                          [ Be]in situ                                                                X∗
                                                                           sections has no effect on Wregolith beyond uncertainty for most
Chemical Depletion Fraction (CDF)                                          elements except for Mg, Mn, and Zn at MIT.
The calculation of CDF requires the presence of a chemically
immobile element. We tested the deviation of supposedly                    Ecosystem Nutrient Uptake Fluxes (U Xtotal )
                                                                             X
                                                                           Utotal  was calculated from Equation (9) and fluxes are reported
chemically immobile elements from the weathering enrichment
lines (Hewawasam et al., 2013; Oeser et al., 2018) in                      in Table 3. An elemental bulk tree nutrient concentration
Supplementary Figure 1 that were inferred from unweathered                 was estimated by averaging leaf foliage and wood nutrient
bedrock concentrations. At both study sites Zr is considered the           concentrations in both prevailing tree species (Fagus sylvatica
most chemically immobile element, as its concentration increase            and Picea abies) and reported in Table 4. The sampling and
from unweathered bedrock to regolith is most pronounced.                   analyses of roots was excluded in this study, because of the
Weathered rock or regolith samples that originated from a                  difficulties related to their purification from soil particles, and
chemically distinct parent bedrock were disclosed if their Zr              because the accurate apportionment of elements into different
concentration was lower than the mean of unweathered bedrock               root compartments is notoriously difficult. For example, nutrient
by more than two standard deviations (2SD). Because additions              concentrations in fine roots are substantially higher than in
of mobile elements of such magnitude are unlikely in in situ               coarse roots (Hellsten et al., 2013), but the relative proportions
rock or saprolite, these samples were excluded from further                of fine to coarse roots are largely unknown. However, given the
consideration. Saprolite and weathered rock samples were also              relatively high uncertainty in the bulk tree nutrient concentration
excluded from our dataset if the Cr, Ni, Nb and Ti concentrations          averaged from leaf foliage and wood, we nevertheless suggest
are twice those of unweathered parent bedrock (+2SD). Elevated             that the nutrient content in roots is adequately estimated. Gross
concentrations of these elements indicate the presence of mafic            primary productivity (GPP) was not measured at our study
precursor rock such as present in bedrock enclaves. Finally,               sites. Instead, mean annual (1982–2008) GPP data from a global
mineralogical evidence from X-ray diffraction analyses suggests            empirical upscaling model, based on FLUXNET data were used.
that these regolith samples originate from another source rock             For both study sites this equates to about 1,260 g m−2 yr−1 ± 60
given that primary minerals like cordierite and hornblende are             (SE, N = 360).
present in saprolite and weathered rock at MIT but absent in
                                                                                                 X )
                                                                           Litter Erosion Flux (Eorg
unweathered bedrock (see Supplementary Figure 5). All such
excluded samples are labeled in red in Supplementary Figure 1                X was estimated from the cosmogenic in situ 10 Be-derived
                                                                           Eorg
and are highlighted in Uhlig and von Blanckenburg (2019).                  erosion flux (E), the concentration of element X in the litter layer
   To estimate the profile’s representative chemical depletion             and a density ratio of bedrock to plant litter, and reported in
fraction, each sites CDF value was estimated by averaging the              Table 3. Data on the density of the litter layer was taken from
Zr concentration through the weathering profile from below                 Supplement 2 in Lang et al. (2017). Because the metric Eorg      X

1.4 m depth to the regolith-weathered bedrock interface at 7 m             includes the cosmogenic nuclide derived denudation rate (D)
depth at CON and at 17 m depth at MIT. The topmost 1.4 m                   that integrates over millennia, the litter erosion flux represents
were excluded for this estimate, because there Zr concentrations           an underestimation of EorgX . The reason is that the litter layer is

decrease, which is presumably due to a dilation effect (Brimhall           of lower density than the soil beneath it that contains quartz on
et al., 1992) caused by biota and accumulation of secondary                which D was measured, meaning that the litter layer requires less
precipitates. All CDF-values were calculated from Equation (2)             erosional forces to be eroded than do quartz minerals.
and reported in Uhlig and von Blanckenburg (2019).
                                                                           Litter Solubilisation Flux (SXorg )
                                       X
Elemental Chemical Weathering Fluxes (Wregolith )                          SXorg was estimated from the inventory of the forest floor (IffX ,
 X
Wregolith   was calculated from Equation 6 and reported in Table 3.
                                                                           Equation 7) and a plant litter decay rate constant (k, yr−1 ),
               X
To estimate Wregolith       X -values (calculated from Equation
                      mean τZr                                             and reported in Table 3. Leaf foliage litter decomposition rate
5 and reported in Table S1c in Uhlig and von Blanckenburg,                 constants (k, yr−1 ) from litterbag experiments in 30 to 120 years
2019) were used from the entire depth of soil and saprolite                old pure and mixed stands of Fagus sylvatica and Picea abies from
from τZrX -profiles that exhibit uniform depth distributions.              Albers et al. (2004) were used and converted from unit mo−1 to

Frontiers in Earth Science | www.frontiersin.org                      12                                           July 2019 | Volume 7 | Article 159
Uhlig and von Blanckenburg Maintaining Forest Nutrition From Subsoil
yr−1 . Decomposition rate constants used for non-woody foliage
(µg/g)
unc.
16
11
at pure stands were 0.31 yr−1 for Picea abies and 0.22 yr−1 for
Fagus sylvatica, and at mixed stands 0.29 yr−1 for Picea abies and
0.24 yr−1 for Fagus sylvatica (Albers et al., 2004). This non-woody
(µg/g)
Zn
33
18
foliage derived decomposition rate constants are comparable to
the lower end of litter decay constants of diverse tree species
(µg/g)
calculated from Table 1 in Homann (2012) amounting to 0.39–
unc.
330
110
0.88 yr−1 , but are about one third higher than in situ derived
decomposition rate constants of woody tissue of, for example,
(µg/g)
about 0.10 yr−1 (Johnson et al., 2014).
480
120
Mn
X )
Dissolved Plant Litter Export Flux (Worg
(µg/g)
unc.
38
34
X
Worg was estimated from the product of the nutrient
concentration in deep lateral subsurface water and runoff.
We assumed that most of the nutrient concentration in deep
(µg/g)
Fe
52
57
subsurface water originates from plant material. At CON, lateral
subsurface water was sampled [method see Sohrt et al. (2018)]
(µg/g)
over the course of 1 year. At CON, annual runoff of about
unc.
110
84
600 mm (Sohrt, 2019) was used. Because deep lateral subsurface
water was sampled only at CON, Worg X from CON was also used
(µg/g)
for MIT as both sites are very similar with respect to pedogenesis
150
120
Al
and environmental conditions.
(µg/g)
unc.
Determination of Inventories (IjX )
13
71
IjX was calculated from Equation (7) for each of the
X
(µg/g)
compartments: the biologically available fraction (Ibioav ),
Na
38
54
X
forest floor (Iff ) and bulk regolith including nutrients contained
X ). I X are reported in Table 5.
in fragmented rocks (Ibulk
(µg/g)
j
unc.
540
380
The biologically available fraction comprises the water-soluble
and exchangeable fraction that is weakly adsorbed to soil minerals
and organic matter. In the case of P the biologically available
(µg/g)
760
710
P
fraction refers to the inorganic products of the Hedley sequential
1 GPP data from a global empirical upscaling model based on FLUXNET data from Jung et al. (2011).
P fractionation method, namely resin-P, HCO3 -Pi, and 1M HCl-
(µg/g)
X
Pi. Ibioav was estimated for two depth intervals mainly for reasons
unc.
270
330
of sampling depth resolution and the presence or absence of
periglacial slope deposits: from 0 m to 3 m (called “3 m,” low sampling
(µg/g)
3700
1500
unc.
depth resolution (0.5–1 m depth sections), absence of periglacial
slope deposits). The >3 m depth intervals range from 3 to 7 m at
CON and 3 to 17 m at MIT. However, we believe that both depth
(µg/g)
6900
1900
Ca
intervals are principally accessible to tree roots.
The fine-earth soil density of the soil horizons Ah, Bw and Cw,
(µg/g)
required to calculate the inventory of the biologically available
2000
3700
unc.
X
fraction (Ibioav ) via Equation (7), was taken from Lang et al.
(2017) and reported in Table 5. The bulk soil densities, required
(µg/g)
5100
4000
to calculate the nutrient inventory of bulk regolith including
GPP = gross primary productivity
K
fragmented rocks (Ibulk X ) via Equation (7) were reported in
Table 5 (data from Friederike Lang, personal communication).
(g m−2 yr−1 )
To account for fragmented rocks in Ibulk X the concentration in
GPP1
1260
1260
rock fragments was multiplied by the rock fragment content
(69% at CON, 25% at MIT; Lang et al., 2017); the nutrient
concentration in fine earth multiplied by its percent abundance
(100% minus % rock fragments) was added; this sum was
CON
MIT
then multiplied by bulk soil densities (>2 mm, including rock
Frontiers in Earth Science | www.frontiersin.org 13 July 2019 | Volume 7 | Article 159Frontiers in Earth Science | www.frontiersin.org
Uhlig and von Blanckenburg
TABLE 5 | Inventories (IjX ), turnover times (TjX ), and recycling factors (RecX ) at CON and MIT.
Depth interval K Ca Mg P Na Al Fe Mn Zn
CON MIT CON MIT CON MIT CON MIT CON MIT CON MIT CON MIT CON MIT CON MIT
(m) (kg m−2 ) (kg m−2 ) (kg m−2 ) (kg m−2 ) (kg m−2 ) (kg m−2 ) (kg m−2 ) (kg m−2 ) (kg m−2 )
X 1
Ibulk 34 190 370 18 570 120 300 4.4 40 78 160 680 1,500 360 980 4.4 20 n.d. n.d.
(g m−2 ) (g m−2 ) (g m−2 ) (g m−2 ) (g m−2 ) (g m−2 ) (g m−2 ) (g m−2 ) (g m−2 )
IffX 2 11 6.2 16 12 4.6 3.1 5.2 4.3 2.0 1.4 18 16 9.1 7.6 1.5 1.4 n.d. n.d.
X
Ibioav 3 34 190 840 2,600 15,000 780 860 100 8700 50 220 10 60 7.4 22 13 150 n.d. n.d.
(yr) (yr) (yr) (yr) (yr) (yr) (yr) (yr) (yr)
X
Tff,L 6.2 3.7 10 8.4 11 9.7 16 10 n.d. n.d. 100 290 84 140 6.3 7.8 n.d. n.d.
X
Tff,U 5 1.9 1.4 2.2 11 12 13 5.7 5.2 n.d. n.d. 170 250 300 220 2.6 12 n.d. n.d.
ff
14
X
Tff,loss 17 10 12 9 11 7 100 59 2 1 210 190 260 200 40 40 n.d. n.d.
X
Tbioav,U 3 300 1,400 2,000 12,000 1,800 2,000 2,000 120,000 51 230 110 720 210 600 350 4,000 n.d. n.d.
new
X
Tbioav,W 3 190 5,100 480 16,000 380 4,900 1,300 130,000 21 290 1.4 220 1.7 130 190 26,000 n.d. n.d.
RecX 6.3 21 1.6 2.4 0.41 1.6 11 14 0.02 0.09 0.03 0.53 0.01 0.46 7.5 11 18 7.5
RecX * 6.3 30 1.6 2.4 0.41 3.7 13 14 0.02 0.09 0.03 0.53 0.01 0.43 8.6 27 33 19
X
Ibulk = inventory of element X in bulk regolith, IffX = inventory of element X in the forest floor, Ibioav
X X = turnover time of element X in the forest floor with respect to litterfall,
= inventory of element X in the biologically available fraction, Tff,L
X
Tff,U X
= turnover time element X in the forest floor with respect to uptake into trees, Tff,loss X
= turnover time of element X in the forest floor with respect to loss by erosion and dissolved plant litter, Tbioav,W = turnover time of element X in
ff
Maintaining Forest Nutrition From Subsoil
X
the biologically available fraction in regolith with respect to adsorption onto clay minerals, Tbioav,U = turnover time of element X in the biologically available fraction in regolith with respect to uptake into trees.
new
1 Fine soil density data used to calculate IX was taken from Lang et al. (2017) and are reported here for each soil horizon. MIT: 0.59 g cm−3 (Ah), 0.72 g cm−3 (Ah/Bw), 0.85+ g cm−3 (Bw1/ Bw1Bw2), 1.04 g cm−3 (Cw). CON: 0.375
bioav
g cm−3 (Ah/Bw), 0.65++ g cm−3 (Bw1), 0.71+++ g cm−3 (Bw1, Bw2, Cw).
July 2019 | Volume 7 | Article 159
2 Fine soil density data used to calculate IX was taken from Lang et al. (2017) and reported here. MIT: 0.02 g cm−3 (L), 0.08 g cm−3 (Of, Oh/Of). CON: 0.03 g cm−3 (L), 0.06 g cm−3 (Of, Oh).
ff
3 Bulk soil density data used to calculate IX −3 (Ah), 0.86 g cm−3 (Ah/Bw), 0.98 g cm−3 (Bw), and 1.24 g cm−3 (Cw).
bulk were provided by F. Lang (personal communication) and are reported here for each soil horizon. MIT: 0.73 g cm
CON: 0.67 g cm−3 (Ah/Bw), 1.31 g cm−3 (Bw1), and 1.90 g cm−3 (Bw2, Cw).
4 depth interval ranging from 3 m to the boundary of regolith to weathered bedrock.
5 negative data occur, if the fluxes of E X and W X exceed UX .
org org total
+ average value from the Bw horizon from Lang et al. (2017), ++ from 23-36 cm depth in Lang et al. (2017), +++ from 48-78 cm depth in Lang et al. (2017).
* Additional estimation of T X X X
bioav,W and Rec using Wregolith which includes the 0 - 1.4 m depth section.
n.d.: not determined.You can also read