Characterization of Sub-Regional Variation in Saccharomyces Populations and Grape Phenolic Composition in Pinot Noir Vineyards of a Canadian Wine ...
←
→
Page content transcription
If your browser does not render page correctly, please read the page content below
ORIGINAL RESEARCH
                                                                                                                                             published: 31 August 2020
                                                                                                                                        doi: 10.3389/fgene.2020.00908

                                              Characterization of Sub-Regional
                                              Variation in Saccharomyces
                                              Populations and Grape Phenolic
                                              Composition in Pinot Noir Vineyards
                                              of a Canadian Wine Region
                                              Elaine Cheng 1† , Jonathan T. Martiniuk 1† , Jonah Hamilton 1 , Garrett McCarthy 1,2 ,
                                              Simone Diego Castellarin 1 and Vivien Measday 1*
                                              1
                                                  Wine Research Centre, Faculty of Land and Food Systems, The University of British Columbia, Vancouver, BC, Canada,
                                              2
                                                  Department of Biology, The University of British Columbia, Kelowna, BC, Canada
                         Edited by:
                    Amparo Querol,
                                              Wine is a product of grape juice fermentation by yeast. Terroir is a term that
 Consejo Superior de Investigaciones
           Científicas (CSIC), Spain          encompasses all environmental factors and interactions at a specific geographical site,
                          Reviewed by:        resulting in the development of regional-specific microbial strains and grape metabolites.
              Braulio Esteve-Zarzoso,         In this study we determine the distribution of vineyard-associated wine yeast strains
        Rovira i Virgili University, Spain
                        Patrizia Romano,      and characterize the flavonoid profile of Pinot Noir grapes among 3 sub-regions in the
          University of Basilicata, Italy     Okanagan Valley (OV), a major wine region in British Columbia, Canada. Pinot Noir grape
                  *Correspondence:            samples were collected from 13 vineyards among 3 sub-regions of the OV, namely
                      Vivien Measday
                                              Kelowna (KE), Naramata-Penticton (NP) and Oliver-Osoyoos (OO), within a week prior
                vmeasday@mail.ubc.ca
     † These   authors have contributed
                                              to the winery harvesting date in 2016 and 2017. A total of 156 spontaneous Pinot Noir
                    equally to this work      fermentations were conducted and vineyard-associated Saccharomyces strains were
                                              isolated from fermentations that reached two-thirds sugar depletion. Using microsatellite
                   Specialty section:
         This article was submitted to
                                              genotyping, we identified 103 Saccharomyces cerevisiae strains and 9 Saccharomyces
           Evolutionary and Genomic           uvarum strains. We also identified Saccharomyces paradoxus in one vineyard using ITS
                          Microbiology,
                                              sequencing. We developed a microsatellite database of 160 commercial S. cerevisiae
               a section of the journal
                  Frontiers in Genetics       strains to determine the identity of the isolated strains and we include the database
           Received: 08 April 2020            herein. Commercial strains were widely distributed across the three sub-regions. Forty-
           Accepted: 22 July 2020             two of our 103 S. cerevisiae strains were equivalent or highly similar to commercial
         Published: 31 August 2020
                                              strains whereas the remaining 61 were considered as ‘unknown’ strains. Two S. uvarum
                          Citation:
  Cheng E, Martiniuk JT, Hamilton J,
                                              strains were previously isolated in other OV studies and none matched the S. uvarum
    McCarthy G, Castellarin SD and            commercial strain BMV58. S. cerevisiae population structure was driven by sub-region,
Measday V (2020) Characterization of
                                              although S. cerevisiae populations did not differ significantly across vintages. S. uvarum
            Sub-Regional Variation in
   Saccharomyces Populations and              and S. paradoxus were only identified in the 2017 vintage, demonstrating dynamic
Grape Phenolic Composition in Pinot           wine yeast populations between vintages. We found that the flavonoid profile of Pinot
  Noir Vineyards of a Canadian Wine
       Region. Front. Genet. 11:908.
                                              Noir grapes from the same 13 vineyards was also affected by sub-regional terroir. The
    doi: 10.3389/fgene.2020.00908             anthocyanin content was lower and the proportion of methoxylated anthocyanins and

Frontiers in Genetics | www.frontiersin.org                                           1                                            August 2020 | Volume 11 | Article 908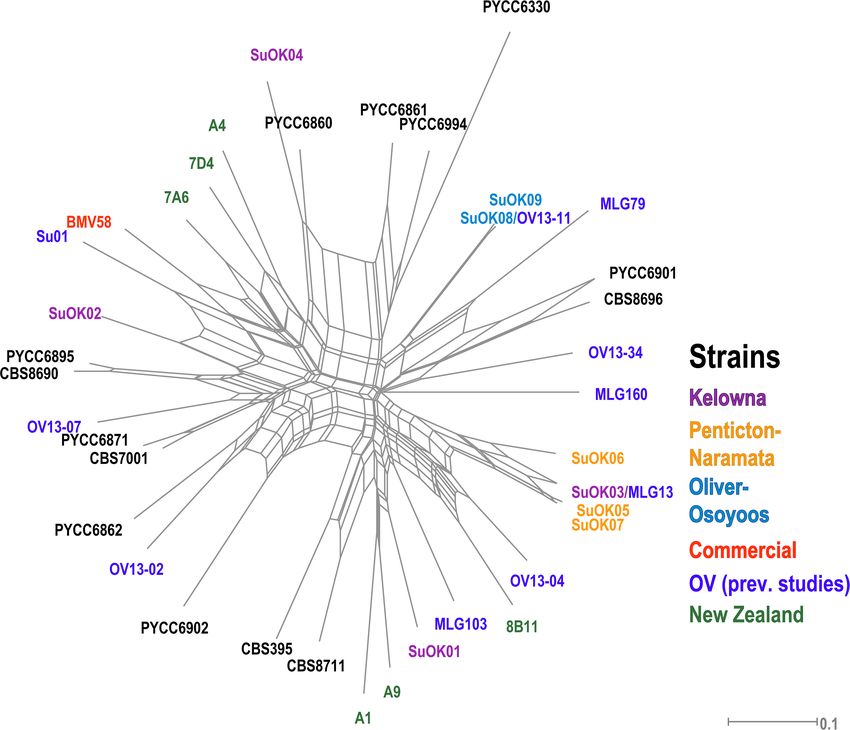
Cheng et al.                                                                                             Saccharomyces Populations and Phenolic Composition

                                              flavonols was higher in Pinot Noir grapes from OO, the warmer sub-region as compared
                                              to KE, the cooler sub-region. Our study demonstrates that both yeast populations and
                                              metabolites associated with the Pinot Noir variety have sub-regional variation within a
                                              viticultural area.
                                              Keywords: anthocyanin, fermentation, flavonol, flavonoid, Saccharomyces cerevisiae, Saccharomyces uvarum,
                                              Vitis vinifera L., wine

INTRODUCTION                                                                       composition (anthocyanins, tannins, flavonols) will constitute
                                                                                   baseline information for investigating the impact of OV terroir
The characteristics of a wine region are believed to influence                     on Pinot Noir wine quality.
the sensory profiles of wines made in these regions, a concept                        Saccharomyces species are essential in winemaking both for
referred to as terroir (van Leeuwen and Seguin, 2006). These                       their roles in alcoholic fermentation and for their influence on
characteristics include abiotic factors such as climate, topography                wine organoleptic profiles through the production or release of
and topology as well as biotic factors such as soil, fruit and                     volatile compounds (Fleet, 2003; Styger et al., 2011; Cordente
vineyard microbiota. While regional abiotic factors have a more                    et al., 2012). Saccharomyces cerevisiae is by far most common
obvious impact on the differentiation of wine characteristics, the                 in wine fermentations, while S. uvarum may also occur in
regional composition and structure of microbial communities                        mixed populations with S. cerevisiae or as the dominant yeast
has been correlated with differences in wine chemical and                          in white wine fermentations (Demuyter et al., 2004; Tosi et al.,
sensory profiles (Knight et al., 2015; Bokulich et al., 2016). In                  2009; Masneuf-Pomarede et al., 2010). There are two strategies
particular, the composition of wine grape phenolic compounds,                      of wine fermentation: inoculated and spontaneous. Inoculated
which are important for red wine quality, can be influenced                        fermentation is initiated by the addition of an industrial
by terroir. Anthocyanins determine the color of the red grape                      Saccharomyces strain to grape must; by our estimation, over
and wine (Gould and Lister, 2005). Tannins confer astringency                      150 industrial S. cerevisiae strains and one S. uvarum strain are
and bitter sensorial notes to grapes and wines, and provide                        available for winemaking purposes. The use of industrial starter
texture to red wines (Flamini and Traldi, 2010). Flavonols                         cultures, of which a diverse array of strains is available, is popular
influence wine quality by forming non-covalent interactions                        amongst winemakers due to the reliability of a rapid fermentation
with anthocyanin molecules. The interaction of flavonols with                      that completes in a timely manner. Spontaneous fermentation,
anthocyanins results in color intensity enhancement of grape                       in contrast, is carried out by yeasts present on grape and winery
skins (Pollastri and Tattini, 2011; Trouillas et al., 2016). Abiotic               surfaces that include various fermentative species from several
factors such as light, temperature, and water availability strongly                yeast genera. Spontaneous fermentations may be initiated by a
affect grape phenolic compounds (Castellarin et al., 2007; Mori                    variety of weakly fermentative yeast species but by the end of
et al., 2007; Cohen et al., 2008; Matus et al., 2009; Savoi et al.,                fermentation are typically dominated by one or often multiple
2017). Arguably, the soil and the above abiotic factors, are                       strains of S. cerevisiae and/or S. uvarum (Pretorius, 2000; Varela
the major components of the terroir that affect the phenolic                       and Borneman, 2017). Wines made by spontaneous fermentation
composition of the grapes and wines (van Leeuwen, 2010;                            may have more complex sensory profiles than those fermented
Willwerth et al., 2010; Ferndandez-Marin et al., 2013; Artem et al.,               by single strain inocula due to the diverse metabolic activity of
2016; Del-Castillo-Alonso et al., 2016).                                           multiple yeast species and strains (Jolly et al., 2014).
   The Okanagan Valley (OV) is a major wine region of Canada.                         Saccharomyces cerevisiae wine strains across global wine
The narrow valley spans from the United States border with                         regions have demonstrated close genetic relatedness; they cannot
Washington State to approximately 250 km north and is marked                       be satisfactorily differentiated by geographical origin but are
by several lakes. The OV climate is considered cool and arid                       distinct from strains in other ecological niches (Legras et al., 2007;
(Senese et al., 2012). Given its great latitudinal range, the OV                   Liti et al., 2009; Schacherer et al., 2009; Almeida et al., 2015;
has many microclimates and diverse soil types, lending itself                      Peter et al., 2018). Nevertheless, S. cerevisiae population structure
to the production of premium wines made from many grape                            has been identified on a smaller scale across various wine
cultivars (Bowen et al., 2005). While the majority of red wine                     regions in France, Portugal, New Zealand and Italy spanning
grapes are grown in the Oliver-Osoyoos (OO) area at the south                      tens to hundreds of kilometers (Gayevskiy and Goddard, 2012;
end of the valley (containing Canada’s only semi-desert), Pinot                    Schuller et al., 2012; Knight and Goddard, 2015; Borlin et al.,
Noir is commonly grown in all areas of OV. However, more                           2016; Rantsiou et al., 2017). A factor confounding analysis of
acres of Pinot Noir are planted in the Naramata-Penticton                          regional S. cerevisiae population structure is the dissemination
(NP, central) and more northern Kelowna (KE) sub-regions.                          of commercial wine strains into the winery and surrounding
Pinot Noir is an early ripening vine and therefore cool climate                    environment. Commercial S. cerevisiae strains may be highly
regions provide ideal viticulture sites to prevent pre-maturation                  abundant or dominate spontaneous fermentations in wineries
of grapes that may cause loss of acidy and aroma. Little                           using commercial strains (Beltran et al., 2002; Hall et al., 2011;
information exists on the microbial populations in OV vineyards                    Tello et al., 2011; Scholl et al., 2016). However, indigenous
and the variation of phenolic accumulation in grape berries.                       strains can dominate spontaneous fermentations and outcompete
Knowledge of the regional variation in Pinot Noir flavonoid grape                  commercial strains when co-inoculated (Tello et al., 2011;

Frontiers in Genetics | www.frontiersin.org                                    2                                        August 2020 | Volume 11 | Article 908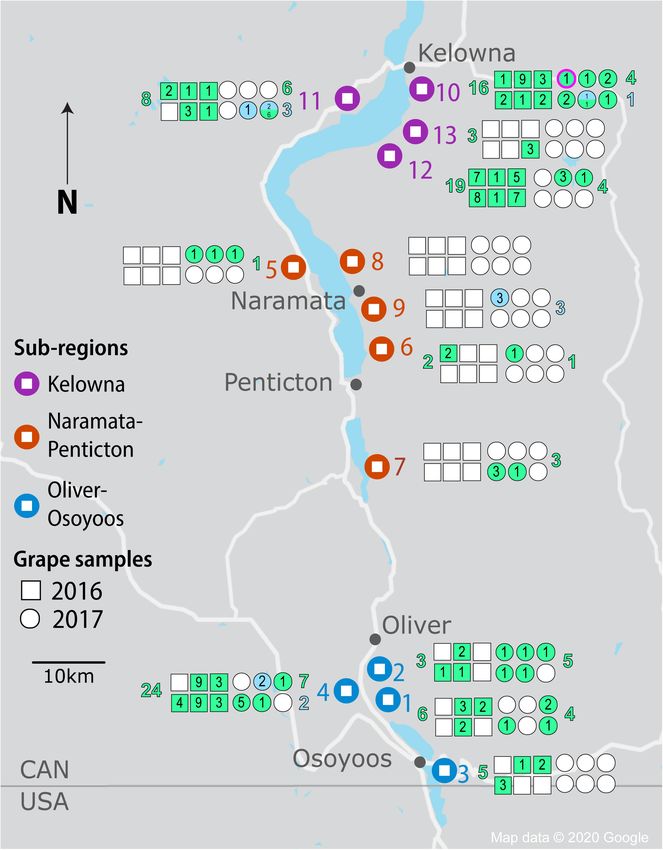
Cheng et al.                                                                                    Saccharomyces Populations and Phenolic Composition

Capece et al., 2019). In large-scale surveys of S. cerevisiae              stations, namely “Oliver STP,” “Penticton A,” and “Kelowna
populations in vineyards and wineries across multiple wine                 UBCO” (Government of Canada, 2020). Growing degree days
regions, commercial strains were found to represent a very                 (GDD) were calculated as base 10◦ C degree-days from 1st April
low proportion of the total yeast population (Gayevskiy and                to 31 October 2017 and cumulative precipitations for the same
Goddard, 2012; Schuller et al., 2012; Knight and Goddard, 2015).           period was identified (Amerine and Winkler, 1944).
However, widespread dissemination of commercial strains was
detected across three Italian wine regions (Viel et al., 2017). The        Grape Sampling and Processing
presence of commercial yeast strains was also found to be a driver         A ∼0.25 hectare area of each Pinot Noir vineyard was selected
of population structure in a small-scale vineyard and winery               for sampling with outer vineyard rows and the first 6 m of each
(Martiniuk et al., 2016). In all cases, identification of commercial       row excluded. Each area was sub-divided into thirty-two 18 m
wine isolates is dependent on access to a database containing the          sections of two rows; six sections were randomly selected for
genetic strain profile of each commercial strain.                          sampling. Each sample consisted of 30 grape clusters aseptically
   In contrast to S. cerevisiae, less information exists on the            harvested within each section. All samples were transported
population structure and genetic diversity of S. uvarum. Sequence          directly to the lab on ice and processed within 24 h of harvest.
analysis of 54 S. uvarum strains revealed three clades including           Each sample was manually crushed for 15 min; 500 mL of
a holoarctic clade comprised of natural isolates and wine-                 juice (excluding skins and seeds) was transferred from each
making strains from North America, Europe and the Far                      sample to a sterile airlock-sealed vessel and fermented aseptically,
East (Almeida et al., 2014). Microsatellite analysis of a larger           for a total of 78 fermentations (six per vineyard) for each
group of S. uvarum strains consisting mostly of European wine              vintage. Fermentations were conducted at 25◦ C and sampled
and cider isolates did not reveal a strong association between             at two-thirds sugar depletion (as determined by weight loss).
genetic relatedness and region of origin (Masneuf-Pomarede                 Fermentations that did not reach two-thirds sugar depletion
et al., 2016). Another clear difference between S. cerevisiae              within 40 days were excluded from further analysis.
and S. uvarum winery and vineyard isolates is that a much                     In 2017, 4 of the 6 sections selected for yeast isolation in each
higher percentage of S. uvarum wine strains are homozygous,                vineyard were randomly selected for grape composition analyses.
suggesting that the species is in-bred (Zhang et al., 2015;                Forty berries per section were randomly picked by hand for total
Masneuf-Pomarede et al., 2016). However, two recent studies                soluble solids (TSS) analyses. Another 40 berries per replicate
identified a highly diverse heterogenous population of S. uvarum           were randomly harvested with scissors for flavonoid analysis by
in spontaneous Chardonnay fermentations from an OV winery                  cutting off the berry at the pedicel level to avoid any damage that
in two separate vintages (Morgan et al., 2019; McCarthy et al.,            could create oxidation to the berry. The grape samples were taken
Unpublished). A subset of the OV S. uvarum strains are                     to the laboratory on dry ice, where they were stored in a −80◦ C
genetically distinct from global S. uvarum strains and have a              freezer until processing.
higher degree of heterozygosity based on microsatellite analyses
(Morgan et al., 2019).                                                     Saccharomyces Isolation and DNA
   Herein, we elucidate the regional population structure
of vineyard-associated Saccharomyces strains among three
                                                                           Extraction
winemaking sub-regions of the Okanagan Valley (KE, NP, and                 At two-thirds sugar depletion, fermentation samples were serially
OO) over two vintages (2016–2017), and compile a database of               diluted in 0.1% peptone and plated in duplicate on yeast
over 150 commercial S. cerevisiae strains to profile commercial            extract-peptone-dextrose (YPD) agar plates containing 0.015%
yeast dissemination across the region. We also denote the                  biphenyl and 0.01% chloramphenicol to inhibit mold and
different flavonol and anthocyanin profiles and seed tannin                bacterial growth, respectively (Singleton and Sainsbury, 1987;
levels of Pinot Noir grapes between the three sub-regions in               Luck and Jager, 1997). For each fermentation sampled, up to
the 2017 vintage. Our work is the first study looking at the               48 Saccharomyces colonies were isolated when possible from
regional-specificity of Pinot Noir grapes in the OV, British               a plate containing 30–300 colonies. Suspected Saccharomyces
Columbia, Canada.                                                          colonies were confirmed by plating on Wallerstein nutrient
                                                                           agar, which differentiates Saccharomyces and non-Saccharomyces
                                                                           yeasts based on colony color, and cross-verified by negative
MATERIALS AND METHODS                                                      growth on lysine agar (Heard and Fleet, 1986; Pallman et al.,
                                                                           2001). All isolates were arrayed in 96-well plates and frozen
Experimental Design                                                        at −80◦ C. Yeast DNA was extracted as previously described
                                                                           and diluted to 25 µg/µl in sterile 10 mM Tris pH 8.0
In autumn 2016 and 2017, we aseptically harvested healthy grape
                                                                           (Martiniuk et al., 2016).
clusters from 13 Pinot Noir vineyards from the OV within a week
prior to the winery harvesting date (Figure 1). The vineyards
spanned a 100 km distance from north to south and included                 Differentiation of S. cerevisiae and
three OV sub-regions – KE in the north, NP in the center, and OO           S. uvarum Isolates
in the south. In total, 4 KE, 5 NP and 4 OO Pinot Noir vineyards           Saccharomyces cerevisiae and S. uvarum were differentiated based
were sampled. Weather data were retrieved from three weather               on polymorphism at the MET2 locus using restriction fragment

Frontiers in Genetics | www.frontiersin.org                            3                                       August 2020 | Volume 11 | Article 908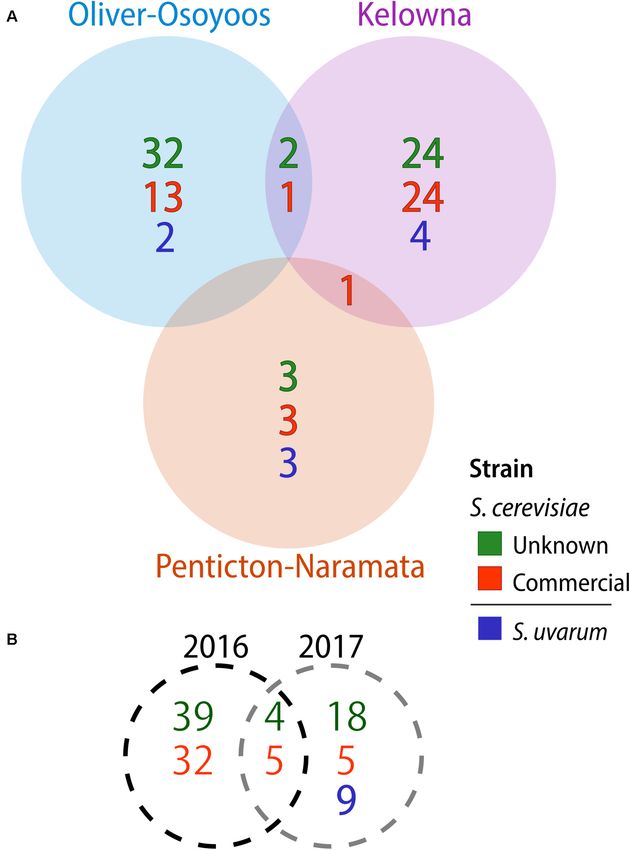
Cheng et al.                                                                                                       Saccharomyces Populations and Phenolic Composition

  FIGURE 1 | Isolation of Saccharomyces yeasts by sample, vineyard, sub-region and vintage from the OV wine region. Vineyard locations are denoted by large
  markers and colored by region (KE-purple, NP-orange, and OO-blue). Squares and circles represent each of 6 spontaneous fermentations conducted for each
  vineyard in 2016 and 2017, respectively. Shaded squares and circles indicate fermentations that reached two-thirds sugar depletion; green shading indicates
  Saccharomyces cerevisiae strains while blue shading indicates Saccharomyces uvarum strains. The number of strains isolated from a spontaneous fermentation is
  noted within each square or circle. The number of S. cerevisiae and S. uvarum strains isolated in total from each vineyard are listed in green and blue, respectively (to
  the left of the vineyard for 2016 fermentations and to the right of the vineyard for 2017 fermentations). The circle outlined in fuschia for vineyard #10 denotes the
  fermentation from which S. paradoxus was isolated.

length polymorphism (RFLP)-polymerase chain reaction (PCR)                               step of 5 min at 94◦ C, 35 cycles of 30 s at 94◦ C, 45 s
(Masneuf et al., 1996). The diluted DNA (1 µl) was added                                 at 50◦ C and 1 min at 72◦ C, and a final elongation step of
into 19 µl of MET2 PCR master mix [20% 5× dNTPs,                                         10 min at 72◦ C. The PCR products were digested separately
10% 10× BioBasic Taq Buffer, 10% MgSO4 (20 mM), 0.6%                                     by EcoRI and PstI at 37◦ C for 30 min, then analyzed by
MET2 forward primer (100 µM), 0.6% MET2 reverse primer                                   electrophoresis on a 1.2% agarose gel. EcoRI digests only the
(100 µM), 0.5% BioBasic Taq Polymerase]. Amplification was                               MET2 gene of S. cerevisiae whereas PstI digests only the MET2
performed under the following conditions: initial denaturation                           gene of S. uvarum.

Frontiers in Genetics | www.frontiersin.org                                          4                                                August 2020 | Volume 11 | Article 908
Cheng et al.                                                                                     Saccharomyces Populations and Phenolic Composition

Identification of Saccharomyces                                             strain collection using a custom R script based on the genetic
paradoxus                                                                   relatedness measure Bruvo Distance (BD) (Bruvo et al., 2004).
                                                                            Isolate MLGs ≤ 0.25 BD from the closest commercial strain
For DNA from isolates with MET2 that could not be digested
                                                                            relative were classified as commercial strains whereas the
with EcoRI or Pst1, internal transcribed spacer (ITS)-PCR was
                                                                            remainder were classified as unknown. S. uvarum isolate MLGs
performed to identify the species. The diluted DNA (1 µl) was
                                                                            were compared against a database of 20 S. uvarum strains
added into 19 µl of PCR master mix [20% 5× dNTPs, 20%
                                                                            previously isolated from around the world, 10 S. uvarum strains
5× Phusion HF buffer, 0.5% ITS1 primer (100 µM), 0.5% ITS4
                                                                            previously isolated in OV wineries and 1 S. uvarum commercial
primer (100 µM), 1% Phusion Taq Polymerase] (Op, De Beeck
                                                                            strain, BMV 58 (Supplementary Table S6). Venn diagrams were
et al., 2014). ITS amplification was performed under the following
                                                                            created in Jvenn to visualize the number of strains isolated in
conditions: initial denaturation step of 2 min at 98◦ C, 35 cycles of
                                                                            each sub-region and each vintage (Bardou et al., 2014). Analysis
10 s at 98◦ C, 30 s at 62◦ C, 30 s at 72◦ C, and a final elongation
                                                                            of molecular variance (AMOVA) was performed in poppr and
step of 10 min at 72◦ C. The ITS PCR products were cleaned
                                                                            Bayesian clustering of MLGs in InStruct (Gao et al., 2007).
by the E.Z.N.A Cycle Pure Kit and sent to Genewiz for Sanger
                                                                            Subpopulation membership in InStruct was determined using the
sequencing. The sequencing data were analyzed by BLAST to
                                                                            admixture model with a burn-in of 50,000 iterations, 200,000
identify the species.
                                                                            iterations per chain with 5 chains per cluster, or K, from K = 3
                                                                            to K = 20. The Instruct analysis was narrowed to K = 7 through
Commercial S. cerevisiae Collection
                                                                            12 with 5 chains of 1,000,000 iterations per K and a burn-in
Compilation                                                                 of 100,000. The optimal K or number of sub-populations was
One hundred and sixty commercial S. cerevisiae strains were                 determined using the Deviance Information Criterion method
generously donated or purchased from various companies and                  (Gao et al., 2011). The InStruct output was aligned in CLUMPP
wineries and from the lab of Dr. Daniel M. Durall, University               using the LargeKGreedy algorithm (Jakobsson and Rosenberg,
of British Columbia, Canada. Strains received on slants were                2007) and visualized in DISTRUCT (Rosenberg, 2004). The
streaked for single colonies on YPD agar, while active dry yeasts           correlation between InStruct inferred population structure and
were rehydrated for 10 min in water and streaked for single                 sub-regions or sub-populations of interest was evaluated in
colonies on YPD agar. Certain commercial strains were sourced               ObStruct (Gayevskiy et al., 2014). Phylogenetic networks were
from multiple locations; in cases where genotypes from the same             produced in SplitsTree 4.14.6 using the Neighbor-Net algorithm
strain differed between sources, all MLGs were included in the              (Bryant and Moulton, 2004; Huson and Bryant, 2006).
database (Supplementary Table S1).
                                                                            Grape Compositional Analysis
Microsatellite Analysis                                                     The berries collected for TSS analysis were weighed and squeezed,
Isolated and commercial S. cerevisiae strains were genotyped                and the juice was analyzed with a digital refractometer (Sper
using ten short tandem repeat (STR) loci selected from previous             Scientific 300017). For flavonoid analysis, the pedicels were
studies (Supplementary Table S2) (Legras et al., 2005; Richards             removed from the berry samples before the weight was taken.
et al., 2009). These loci were amplified according to (Martiniuk            The berries were carefully dissected by a scalpel to separate the
et al., 2016). For S. uvarum, we selected eleven STR loci                   skin and seed materials. Skins and seeds were weighed and kept
that were previously identified (Zhang et al., 2015; Masneuf-               frozen in liquid nitrogen before being ground into a fine powder
Pomarede et al., 2016) (Supplementary Table S3). Each STR                   using mortars and pestles. The fine powder samples of skins and
amplification reaction contained 5 µl of Qiagen Multiplex PCR               seeds were stored in a −80◦ C freezer prior to flavonoid analyses.
Master Mix, 4 µl of primer mix, and 1 µl of diluted DNA.                       Anthocyanin and flavonol extractions were completed as
Primer sequences for S. cerevisiae and S. uvarum microsatellite             described (Downey and Rochfort, 2008). The extraction was
amplification are provided in Supplementary Tables S4, S5,                  performed twice on the skin fine powder (0.180 g samples with
respectively. The PCR was carried out with an initial denaturation          1.8 g solvent in each extraction), then the solution was filtered by
step of 5 min at 97◦ C; 34 cycles of 30 s at 95◦ C, 60 s at                 a 3-mL Luer-Lok Tip syringe coupled with a 0.22 mm × 13 mm
54◦ C, and 120 s at 72◦ C; and a final elongation step of 10 min            PVDF filter, and diluted 10-fold with the extraction solvent.
at 72◦ C. Microsatellite amplicons were analyzed at the UBC                 Diluted extracts were injected into an Agilent 1100 Series
Sequencing and Bioinformatics Consortium on an AB3730 DNA                   LC/DAD/MSD Trap XCT Plus System equipped with an Agilent
Analyzer. GeneMapper software was used to generate a multi-                 ZORBAX SB-C18 Column (1.8 µm, 4.6 × 50 mm). The mobile
locus genotype (MLG) for each amplicon profile. Each unique                 phases were composed of a solvent A (water with 2% formic
MLG was considered as an individual strain.                                 acid) and a solvent B (acetonitrile with 2% formic acid). The
                                                                            binary solvent gradient for the liquid chromatographic separation
Saccharomyces Population Data                                               was achieved as followed: 0 min, 5% solvent B; 6 min, 20%
Analysis                                                                    solvent B; 9 min, 80% solvent B; 10 min, 90% solvent B;
Saccharomyces MLG counts and genetic distance calculations                  11 min, 5% solvent B. The analysis was run at a flow rate of
were performed in R v.3.5.3 using the poppr package v.2.6.0                 1.20 mL/min at a constant temperature of 67◦ C. Anthocyanins
(Kamvar et al., 2014; Kamvar et al., 2015). S. cerevisiae isolate           were examined at 520 nm. Flavonols were examined by the
MLGs were compared against our S. cerevisiae commercial                     mass spectrometer because co-elution occurred at 353 nm.

Frontiers in Genetics | www.frontiersin.org                             5                                       August 2020 | Volume 11 | Article 908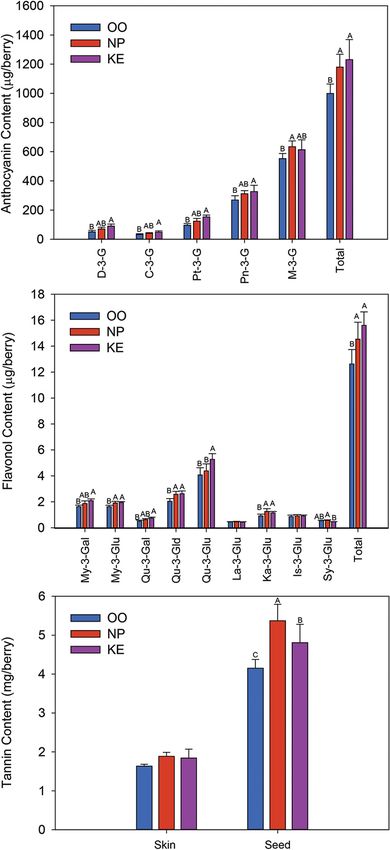
Cheng et al.                                                                                                 Saccharomyces Populations and Phenolic Composition

  FIGURE 2 | Saccharomyces cerevisiae and S. uvarum strains isolated by (A) OV sub-region and (B) vintage. Commercial S. cerevisiae strains are in red, unknown
  strains in green, while S. uvarum strains are blue.

Compound identification was conducted by (i) comparing                              (10 min at 14,000 g), then 1 mL of supernatant was removed
their retention times with those of authentic standards (3-O-                       into a new 2 mL-micro tube, and the acetone was evaporated
glucosides of cyanidin, peonidin, delphinidin, petunidin, and                       via 1 h of speed vacuum. The residual aqueous extract was
malvidin, (ii) matching the mass spectra of identified peaks with                   adjusted to 1 mL with deionised water. After this, tannins were
anthocyanin and flavonol compounds retrieved from published                         measured by the protein precipitation assay (Harbertson et al.,
papers, and (iii) comparing their elution order (Mazza et al., 1999;                2002). Skin and seed tannins were expressed as mg/berry and
Garcia-Beneytez et al., 2003; Castillo-Munoz et al., 2007; Downey                   mg/g of berry fresh weight. Measurement of tannins was carried
and Rochfort, 2008). Anthocyanin and flavonol concentrations                        out in duplicate from each sample, and the two values obtained
were reported in malvidin 3-glucoside and quercetin-3-glucoside                     were averaged.
equivalents, respectively, and expressed as µg/berry and µg/g of                       The general berry and flavonoid data are presented as
berry fresh weight.                                                                 mean ± standard error and analyzed by an ANOVA test where
   For the extraction of skin and seed tannins, 0.18 g of berry                     the effect of the sub-regions (n = 3) on the various parameters
skins or seeds were added to 1.8 mL of acetone/water solution                       was assessed with vineyards (n = 13) considered as nested
(70/30) and shaken gently for 24 h. The sample was centrifuged                      factors within sub-regions. Different letters indicate significant

Frontiers in Genetics | www.frontiersin.org                                     6                                             August 2020 | Volume 11 | Article 908
Cheng et al.                                                                                                 Saccharomyces Populations and Phenolic Composition

TABLE 1 | AMOVA of S. cerevisiae MLGs isolated in this study by vintage and sub-region, with and without commercial MLGs.

                                                                             w/C MLGs                                                 w/o C MLGs

Factor                Hierarchical level                   Variation (%)              8              P              Variation (%)             8                P

Vintage               Between vintages                        −1.44              −0.01             0.6415                0.51                0.01            0.2563
                      Vineyards within vintages                16.71                 0.16
Cheng et al. Saccharomyces Populations and Phenolic Composition
None of the 9 S. uvarum MLGs were equivalent to the commercial from OO (blue circle) and KE (purple circle) were identified.
S. uvarum commercial strain, BMV58 (Lallemand). However, Thus, most of the unknown strains isolated from OO and
2 of our S. uvarum strains had been isolated in previous OV KE were more genetically related to strains isolated from the
studies [(Morgan et al., 2019; McCarthy et al., Unpublished) and same sub-region as compared to strains between sub-regions
unpublished data from this group]. or other commercial strains (Figure 4). Additionally, many
of these strains have >60% membership in the two InStruct
subpopulations not associated with commercial MLGs (K8, K9,
Saccharomyces Population Structure Figure 3). It should be noted that some S. cerevisiae strains
Saccharomyces cerevisiae isolated from KE were closely genetically associated with strains
We conducted hierarchical AMOVAs on S. cerevisiae MLGs to in the OO cluster (e.g., OK221 and OK222). In addition, OK128
elucidate strain population structure across vintages and between and OK140 were isolated in both KE and OO (Figure 4).
sub-regions, both with and without commercial MLGs included. Unexpectedly, we found that two unknown S. cerevisiae strains
Separate AMOVAs were conducted using vintage and sub-region isolated from NP (OK11 and OK12) were genetically closely
as factors, and NP strains were excluded from this analysis due associated with beer strains (Figure 4).
to small sample size (Table 1). In both analyses, within-vineyard
strain populations were most variable. While very few strains Saccharomyces uvarum
were shared between vintages, AMOVA identified no significant Only 9 MLGs were identified from all 164 S. uvarum isolates so
difference between 2016 and 2017 strain populations whether AMOVA could not be performed on the S. uvarum dataset due to
or not commercial strains were included (−1.44%, p = 0.6415; the low number of strains isolated. We compared our S. uvarum
0.51, p = 0.2563), indicating that the populations in each MLGs to 31 S. uvarum strains previously isolated from locations
vintage were genetically similar. In contrast, significant variation in British Columbia (OV wineries, Hornby Island) and other
was found between KE and OO sub-regional populations with regions worldwide and displayed the data using a phylogenetic
commercial strains included (5.44%, p = 0.0278). Notably, the network (Figure 5 and Supplementary Table S6). One S. uvarum
variation nearly doubled when commercial strains were removed MLG from OO (SuOK08) was identical to a strain isolated from
from the analysis (10.40%, p < 0.0295), indicating stronger a previously unpublished OV study that we conducted with
spatial population structure of unknown strains. We further Pinot Gris grapes and named OV13-11. Another S. uvarum
evaluated S. cerevisiae strain population structure using InStruct, MLG from KE (SuOK03) was identical to a strain isolated from
a clustering software optimized for inbred or clonal populations OV spontaneous Chardonnay fermentations and named MLG13
like S. cerevisiae that assigns individuals in a population to a (McCarthy et al., Unpublished). One KE S. uvarum genotype,
given number of statistically determined subpopulations (Gao SuOK04, is closely related to PYCC 6860, a strain previously
et al., 2007, 2011). Instruct analysis identified 10 subpopulations isolated from an oak tree on Hornby Island in British Columbia
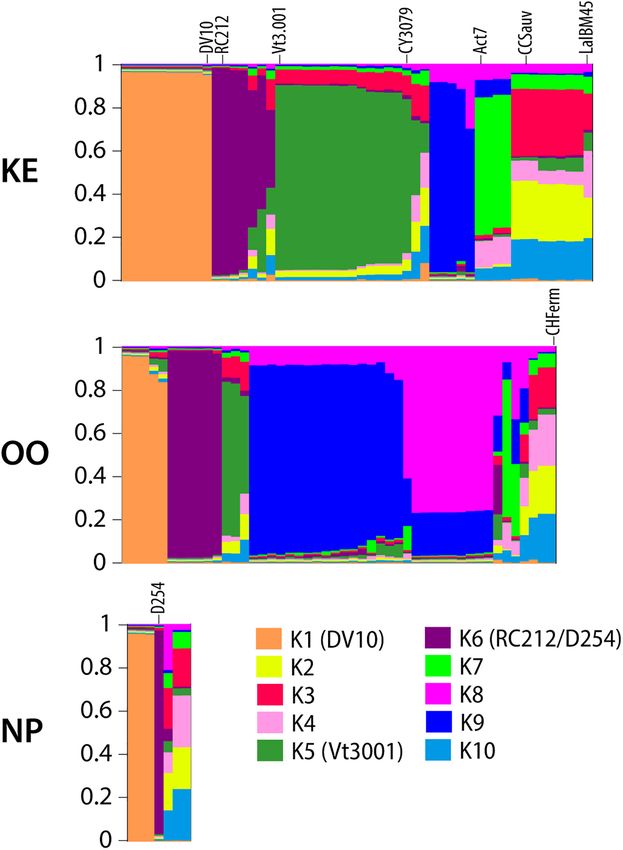
in the S. cerevisiae MLG dataset (K1–K10) and ancestry profiles (Almeida et al., 2014). Two OO S. uvarum strains (SuOK08 and
for each MLG by sub-region were visualized using Distruct SuOK09) and three NP S. uvarum strains (SuOK05, SuOK06, and
(Figure 3). Profiles containing >80% of a particular color SuOK07) are more closely related to each other than between
indicate MLGs belonging to a single subpopulation, while profiles their respective sub-regions. By contrast, S. uvarum strains
consisting of multiple colors indicate admixed or interbred isolated from KE (SuOK01, SuOK2, and SuOK04) are distantly
MLGs. Subpopulations K1, K5, and K6 correspond to S. cerevisiae related to each other. For example, SuOK01 is more closely
commercial MLGs DV10, Vt3.001/CY3079, and RC212/D254, related to two S. uvarum strains isolated from New Zealand (A1
respectively, while other commercial strains are represented and A9) (Zhang et al., 2015).
by admixture of two or more subpopulations (Figure 3). For
example, LalBM45 in KE has a membership coefficient of ∼0.2 in Flavonoid Composition of Pinot Noir
each of K2, K4, and K10 (Figure 3). Two subpopulations, K8 and Grape Berries From OV Sub-Regions
K9, are not associated with any commercial strains; these are most In the 2017 vintage, in addition to performing 6 spontaneous
prevalent in the OO populations (Figure 3). InStruct inferred fermentations from each of 13 OV vineyards, we also sampled the
S. cerevisiae population structure is significantly correlated with Pinot Noir berries from each vineyard to determine how grape
sub-region (R2 = 0.13, p < 0.0001) as determined by ObStruct, berry weight and metabolites may differ in the 3 OV sub-regions.
with OO populations contributing most to sub-region as a In particular, we focused on the three major flavonoid classes:
driver of this structure (Supplementary Table S10). Interestingly, anthocyanins, flavonols, and tannins. We observed that the berry
subpopulation K9 is also a strong driver of population structure weight as well as the number of seeds per berry were affected by
(R2 = 0.06 when K9 is removed), which agrees with the increased the sub-region (Supplementary Table S11). The average berry
differentiation between sub-regions when commercial strains weight and seed number were higher in NP than OO and KE.
were removed (Table 1). The other parameters analyzed – skin weight, seed weight, skin
A phylogenetic network was constructed using a BD matrix to berry ratio, seed to berry ratio, and TSS – did not vary
to visualize the genetic relationships between unknown and among the three OV sub-regions. Importantly, the TSS were not
commercial S. cerevisiae strains (Figure 4). While some of significantly different among all three sub-regions, ensuring that
the strains classified as unknown appear related to commercial we could accurately compare the flavonoid composition in the
strains, two sub-regional clusters of unknown S. cerevisiae strains Pinot Noir berries.
Frontiers in Genetics | www.frontiersin.org 8 August 2020 | Volume 11 | Article 908Cheng et al. Saccharomyces Populations and Phenolic Composition FIGURE 3 | DISTRUCT plots of inferred ancestry profiles of S. cerevisiae strains isolated from KE, OO, and NP sub-regions. Each column represents an ancestry profile for an individual MLG. Each color corresponds to one of ten inferred subpopulations as noted in the legend. The proportion of each color in a column represents the proportion (membership coefficient) of the MLG’s ancestry profile assigned to that subpopulation as measured on the y-axis of each plot. Selected commercial isolate MLG ancestry profiles are labeled on the plot, and subpopulations containing commercial MLGs with membership coefficients >80% are labeled in the legend with the strain name in parentheses. Five anthocyanins were identified and quantified in all the peonidin (Pn-3-G), and malvidin (M-3-G) (Figure 6A). M-3-G Pinot Noir grape samples collected; the monoglucosides of was the most abundant anthocyanin while C-3-G was the least delphinidin (D-3-G), cyanidin (C-3-G), petunidin (Pt-3-G), abundant anthocyanin. The content (expressed as µg/berry) of Frontiers in Genetics | www.frontiersin.org 9 August 2020 | Volume 11 | Article 908
Cheng et al. Saccharomyces Populations and Phenolic Composition
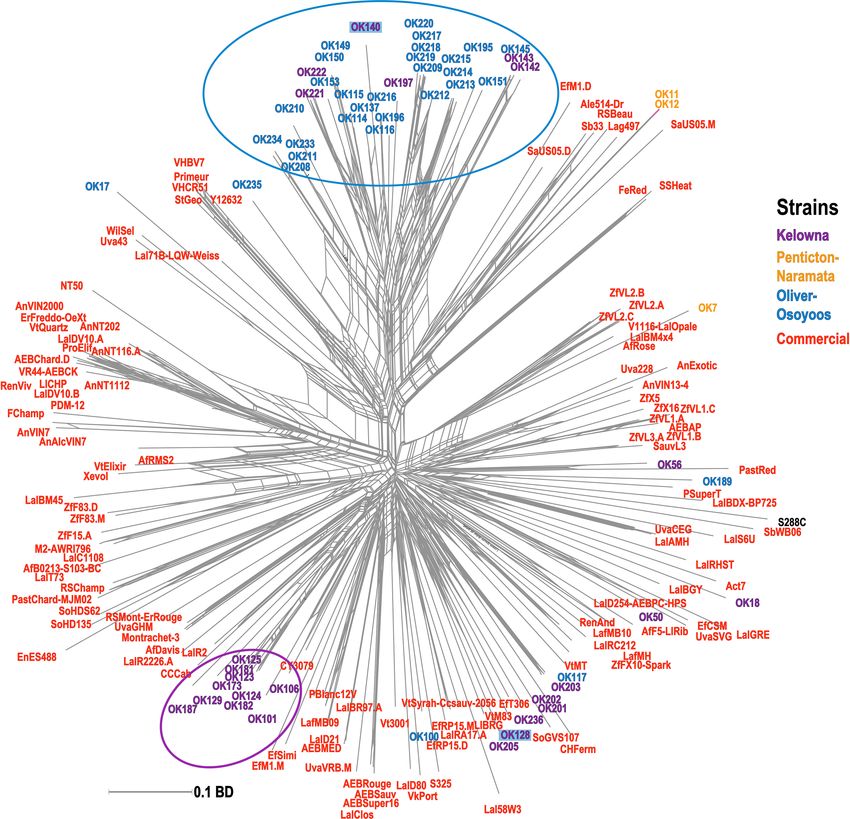
FIGURE 4 | Phylogenetic network of unknown and commercial S. cerevisiae MLGs. The phylogenetic network was built with the Neighbor-Net algorithm using a
pairwise BD matrix. Unknown strains are labeled as OK and are colored by sub-region of origin; strains isolated from multiple sub-regions are highlighted.
Commercial MLGs from the commercial strain collection are in red; the S. cerevisiae reference lab strain S288C is in black. Distinct sub-regional clusters of strains
are circled.
all anthocyanins except M-3-G was higher in KE than OO. NP (Qu-3-Glu), laricitrin (La-3-Glu), kaempferol (Ka-3-Glu),
had intermediate levels of all anthocyanins except M-3-G which isorhamnetin (Is-3-Glu), and syringetin (Sy-3-Glu), the
was higher in NP than OO. The content of total anthocyanins was galactosides of myricetin (My-3-Gal) and quercetin (Qu-3-
higher in KE and NP than OO. The concentrations (expressed Gal), and the glucuronide of quercetin (Qu-3-Gld). Qu-3-Glu
as µg/g berry) of D-3-G, C-3-G and Pt-3-G were greater in KE was the most abundant flavonol compound in the Pinot
than OO berries, while Pn-3-G and M-3-G concentrations were Noir berries while La-3-Glu and Sy-3-Glu were the least
not affected by the sub-region (Supplementary Figure S1). The abundant flavonols identified (Figure 6B). The content
concentration of total anthocyanins was higher in KE than OO (expressed as µg/berry) of all quercetin conjugates was
(Supplementary Figure S1A). higher in KE than OO berries. Qu-3-Glu was also higher
Nine flavonols were identified in Pinot Noir grapes collected in KE than NP berries while Qu-3-Gld was as high in NP
from the three OV sub-regions (Figure 6B). These compounds as KE berries. The content of myricetin conjugates was
were the glucosides of myricetin (My-3-Glu), quercetin also higher in KE than OO berries (Figure 6B). My-3-Gal
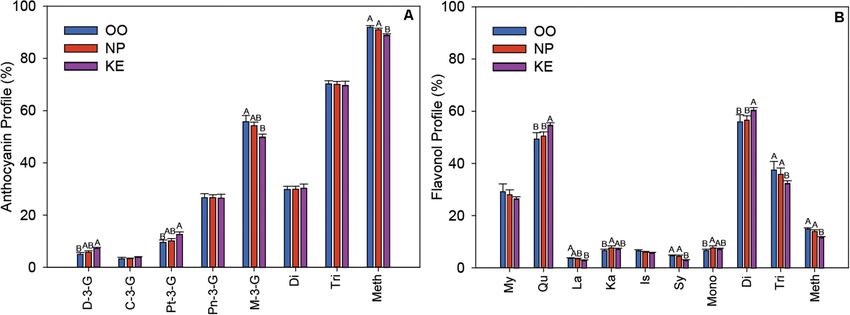
Frontiers in Genetics | www.frontiersin.org 10 August 2020 | Volume 11 | Article 908Cheng et al. Saccharomyces Populations and Phenolic Composition FIGURE 5 | Phylogenetic network of S. uvarum strains. The phylogenetic relationship was established by the Neighbor-Net algorithm based on BD. Newly discovered strains are labeled as “SuOK” and colored according to the region of isolation. SuOK08 and SuOK03 are indicated with strains isolated from the OV in previous studies (OV13-11 and MLG13, respectively, Supplementary Table S6). Green strains were isolated from a study in New Zealand (Zhang et al., 2015), the commercial S. uvarum strain BMV58 is indicated in red and black colored strains are from CBS and PYCC databases (Supplementary Table S6). content was intermediate in NP berries whereas My-3-Glu The profile of the relative abundance of each anthocyanin was content was as high in NP as KE berries. Similar results plotted as a percentage of the total amount of anthocyanins in were observed when the flavonols were reported as a the Pinot Noir grape samples from each sub-region (Figure 7A). concentration (expressed as µg/g berry). The concentration The major anthocyanin was M-3-G in all three sub-regions, of most flavonols were higher in KE than OO and NP generally however, the relative abundance of M-3-G was higher in had intermediate levels (Supplementary Figure S1B). The OO (55.79 ± 2.36%) than KE (49.89 ± 1.13%) berries. In content of total flavonols was higher in KE and NP than OO contrast, the relative abundances of both D-3-G and Pt-3- berries (Figure 6B) and the concentration was higher in KE G were higher in KE than OO berries. We also grouped than OO berries, while NP berries had intermediate levels the anthocyanins into di-substituted, which refers to two (Supplementary Figure S1B). substituted sites (e.g., hydroxylation and methoxylation) at Unlike the anthocyanin and flavonol data, the skin tannin the B-ring (Cy-3-G and Pn-3-G), and tri-substituted, which content and concentration of Pinot Noir grapes did not refers to three substituted sites at the B-ring (D-3-G, Pt- vary among the three OV sub-regions (Figure 6C and 3-G, and M-3-G), groups (Bakowska-Barczak, 2005). We Supplementary Figure S1C). However, the seed tannin content found that the relative abundance of di-substituted and tri- (expressed as mg/berry) and concentration (expressed as mg/g substituted anthocyanins did not change among OV sub-regions berry) were the highest in NP berries and the lowest in OO (Figure 7A). We also considered the level of methoxylation at berries, and at intermediate levels in KE berries (Figure 6C and the B-ring of the anthocyanins. Interestingly, we found that Supplementary Figure S1C). the relative abundance of methoxylated anthocyanins (Pt-3-G, Frontiers in Genetics | www.frontiersin.org 11 August 2020 | Volume 11 | Article 908
Cheng et al.                                                                                                    Saccharomyces Populations and Phenolic Composition

                                                                                           Pn-3-G, and M-3-G) was higher in OO and NP than KE
                                                                                           berries (Figure 7A).
                                                                                               The six aglycones of flavonols, detected in the various
                                                                                           glycoside forms, were myricetin, quercetin, laricitrin, kaempferol,
                                                                                           isorhamnetin, and syringetin and their relative abundances
                                                                                           were plotted as a percentage of total flavonols per OV sub-
                                                                                           region (Figure 7B). Quercetin was the most abundant flavonol
                                                                                           with a higher relative abundance in KE (54.68 ± 0.91) than
                                                                                           NP (50.51 ± 1.58%), and OO (49.40 ± 2.43%) berries. The
                                                                                           relative abundance of laricitrin was higher in OO than KE
                                                                                           berries whereas syringetin was higher in OO and NP than
                                                                                           KE berries. As with the anthocyanins, we compared groups
                                                                                           of mono-, di-, and tri-substituted flavonols across the OV
                                                                                           sub-regions. We found that the relative abundance of mono-
                                                                                           substituted flavonols (kaempferol) was higher in NP than OO
                                                                                           berries, di-substituted flavonols (isorhamnetin and quercetin)
                                                                                           was higher in KE than NP and OO berries, and tri-substituted
                                                                                           flavonols (myricetin, laricitrin, and syringetin) was higher in
                                                                                           OO and NP than KE berries (Figure 7B). Similar to what
                                                                                           we discovered for anthocyanins, the relative abundance of
                                                                                           methoxylated flavonols (laricitrin, isorhamnetin, and syringetin)
                                                                                           was higher in OO and NP than KE Pinot Noir berries (Figure 7B).

                                                                                           DISCUSSION
                                                                                           In this study we surveyed 100 km of a wine region in
                                                                                           British Columbia, Canada for yeast populations and flavonoids
                                                                                           associated with Pinot Noir berries. We sampled from 13
                                                                                           vineyards which were grouped into the northern (KE), central
                                                                                           (NP), and southernmost (OO) sub-regions of the OV. We
                                                                                           performed spontaneous fermentations using grapes sampled
                                                                                           from 13 vineyards for two consecutive vintages for a total
                                                                                           of 156 spontaneous fermentations. Fewer than 50% of the
                                                                                           grape must samples achieved two-thirds sugar depletion within
                                                                                           40 days of fermentation, with little consistency between vintages
                                                                                           (Supplementary Table S7). In part, this may be due to our
                                                                                           method of grape sampling, where grapes were taken from six
                                                                                           discrete vineyard sections, and also due to the relatively low
                                                                                           abundance (0.1%) of S. cerevisiae in the fungal microflora of
                                                                                           a grape berry (Mortimer and Polsinelli, 1999; Tofalo et al.,
                                                                                           2013). Our results reflect those in previous studies where
                                                                                           unpredictability is associated with spontaneous fermentation,
                                                                                           including a dynamic vineyard yeast population between vintages
                                                                                           and geographical locations (Schuller et al., 2012; Knight and
  FIGURE 6 | Anthocyanin (A), flavonol (B), and tannin (C) content (amount per
                                                                                           Goddard, 2015; Rantsiou et al., 2017).
  berry) of Pinot Noir grapes from three sub-regions of the OV (OO, blue; NP,
  red; and KE, purple). D-3-G, delphinidin-3-glucoside; C-3-G,                                The number of fermentations reaching two-thirds sugar
  cyanidin-3-glucoside; Pt-3-G, petunidin-3-glucoside; Pn-3-G,                             depletion from NP in both vintages (8) was markedly lower than
  peonidin-3-glucoside; M-3-G, malvidin-3-glucoside for anthocyanins (A); and              KE (28) and OO (26) (Supplementary Table S7). The fewer wine
  My-3-Gal, myricetin-3-galactoside; My-3-Glu, myricetin-3-glucoside;                      yeasts isolated from NP may be explained by various factors
  Qu-3-Gal, quercetin-3-galactoside; Qu-3-Gld, quercetin-3-glucuronide;
                                                                                           including the proximity to winery facilities, wind and weather
  Qu-3-Glu, quercetin-3-glucoside; La-3-Glu, laricitrin-3-glucoside; Ka-3-Glu,
  kaempferol-3-glucoside; Is-3-Glu, isorahamnetin-3-glucoside; Sy-3-Glu,                   patterns. Two NP vineyards (#5 and #8) are situated over 1km
  syringetin-3-glucoside for flavonols (B). Error bars indicate the standard error         from the nearest known winery, while two others (#6 and #9)
  within each sub-region. An ANOVA was performed to test the effect of the                 are located at least 100 m uphill of wineries, against prevailing
  sub-regions with vineyards considered as nested factors within sub-regions.              wind conditions (Figure 1). NP also has the highest cumulative
  Different letters indicate significant differences (p < 0.05) between sub-regions
  according to a Tukey’s HSD test.
                                                                                           precipitation and lowest cumulative GDD among the 3 OV
                                                                                           sub-regions in both vintages (Government of Canada, 2020).

Frontiers in Genetics | www.frontiersin.org                                           12                                       August 2020 | Volume 11 | Article 908
Cheng et al. Saccharomyces Populations and Phenolic Composition FIGURE 7 | Relative abundance of individual anthocyanins and anthocyanin fractions (A) and individual flavonols and flavonol fractions (B) in the three sub-regions of the OV (OO, blue; NP, red; and KE, purple). C, cyanidin; Pn, peonidin; D, delphinidin; Pt, petunidin; M, malvidin; Di, di-substituted; Tri, tri-substituted; Meth, methoxylated for anthocyanins (A); and My, myricetin; Qu, quercetin; La, laricitrin; Ka, kaempferol; Is, isorhamnetin; Sy, syringetin; Mono, mono-substituted; Di, di-substituted; Tri, tri-substituted; Meth, methoxylated for flavonols (B). Error bars indicate standard error within each sub-region. An ANOVA was performed to test the effect of the sub-regions with vineyards considered as nested factors within sub-regions. Different letters indicate significant differences (p < 0.05) between sub-regions according to a Tukey’s HSD test. Rain and cool temperatures may discourage the development of as S. cerevisiae has a better fermentative competitiveness and S. cerevisiae on fruit as well as the presence of other biological ethanol tolerance at 25◦ C (Alonso-Del-Real et al., 2017; Su et al., vectors (birds and insects) that are involved in the dispersal of 2019; Morgan et al., 2020). S. paradoxus was only identified from wine yeasts (Goddard and Greig, 2015). While very few strains one KE vineyard in a single fermentation that also contained were shared between sub-regions, the most distant sub-regions S. cerevisiae (Figure 1). We isolated 28 colonies of S. paradoxus (OO and KE) had the most strains in common (Figure 2A). but did not carry out strain genotyping, therefore the number Although NP is situated between KE and OO, these two latter of strains is unknown (Supplementary Table S7). Although sub-regions are much larger in size than NP and may have greater S. paradoxus is typically more likely to be isolated from wild trafficking of equipment and personnel between them. OO is environments, multiple studies have identified S. paradoxus in better suited to grow later ripening red grape cultivars due to its vineyards and spontaneous fermentations (Redzepovic et al., warmer climate, and many KE wineries may source grapes from 2002; Valero et al., 2007; Hyma and Fay, 2013; Sipiczki, 2016; or farm vineyards in this sub-region. Vaudano et al., 2019). The isolation of either S. cerevisiae, S. uvarum, or both As found in other wine regions, S. cerevisiae populations species from each vineyard and each vintage had no clear differed among the three sub-regions sampled (Gayevskiy and pattern except that S. uvarum was only isolated in the 2017 Goddard, 2012; Schuller et al., 2012; Knight and Goddard, vintage (Figure 1). This result may correspond to the dynamic 2015). Among the 103 identified S. cerevisiae strains, there composition of vineyard-associated microbiota, which varies were only 4 strains identified in more than one sub-region between vintages due to a variety of factors (Bokulich et al., and no strains identified in all three sub-regions (Figure 2). 2014). In 2017, the number of S. cerevisiae isolates was over AMOVA results further indicate that S. cerevisiae populations are sevenfold higher than for S. uvarum (1,176 vs. 164 isolates, genetically dissimilar between OO and KE sub-regions, which Supplementary Table S7). S. uvarum has lower ethanol and suggests that geography is a driver of population structure temperature tolerance that may result in a stuck fermentation at within the OV wine region (Table 1). Variation was higher 24◦ C (Masneuf-Pomarede et al., 2010). Furthermore, due to its amongst vineyards within the same sub-region and vintage, crytolerant traits, S. uvarum has typically been identified in white rather than sub-regions themselves, highlighting the high wine fermentations at lower temperatures (∼15◦ C) (Demuyter heterogeneity of S. cerevisiae distribution between and within et al., 2004; Masneuf-Pomarede et al., 2010; Lopez-Malo et al., vineyards (Table 1). Viticulture practices among the vineyards 2013; Knight and Goddard, 2015). Therefore, it was surprising to sampled in this study were variable, with several vineyards isolate S. uvarum from a Pinot Noir spontaneous fermentation employing organic practices. Viticulture management techniques carried out at ambient temperature (25◦ C) that may not favor can influence the fungal biota on fruit, which may in turn the growth of S. uvarum. Moreover, although S. uvarum can impact the diversity of S. cerevisiae strains in the vineyard out-compete S. cerevisiae in mixed culture fermentations with environment (Setati et al., 2012; Morrison-Whittle et al., 2017). S. cerevisiae at 12◦ C, S. uvarum was isolated as a minority Our study also systematically profiled S. cerevisiae populations species in fermentations at 25◦ C in this study, which is expected in the same sections of the same vineyards over 2 years, Frontiers in Genetics | www.frontiersin.org 13 August 2020 | Volume 11 | Article 908
Cheng et al.                                                                                      Saccharomyces Populations and Phenolic Composition

enabling a direct comparison of populations between vintages.                because fermentation conditions were not optimized for
Interestingly, while very few MLGs were isolated from both                   S. uvarum enrichment, it is difficult to conclude this. The majority
vintages, no significant difference was found between 2016 and               of the S. uvarum genotypes appear closely related to strains
2017 S. cerevisiae populations (Table 1). It is reasonable to expect         previously isolated from the OV, with the exception of SuOK4,
that yeast populations may remain similar over multiple years,               which is closely related to PYCC6860 (Figure 5). Interestingly,
as S. cerevisiae can reside in soil and in environments proximate            PYCC6860 was previously isolated from an oak tree on Hornby
to vineyards, which act as reservoirs for the yeast during winter            Island off the coast of Vancouver, British Columbia which is
(Knight and Goddard, 2016; Sipiczki, 2016; Gonzalez et al., 2020).           ∼600 km away from the OV (Almeida et al., 2014). The ancestry
    Even though the grapes we sampled never entered a winery,                of S. uvarum strains SuOK01 and SuOK02, which appear more
we still identified a relatively high proportion of commercial               distantly related to the reference S. uvarum strains, are unknown.
MLGs (40.7%) in the dataset (Figure 2). Our previous work                    S. uvarum strains associated with European wine fermentation
in three closely situated OV vineyards also found commercial                 have prevalent and extensive introgressions from Saccharomyces
yeast dissemination into the vineyards and a wider regional                  eubayanus whereas strains isolated from the environment, such
survey in Italy similarly found a high number of commercial                  as PYCC6860, do not (Almeida et al., 2014). Two of our S. uvarum
S. cerevisiae strains in vineyards across multiple sub-regions               strains (SuOK03 and SuOK08) were identical to strains (MLG13
(Martiniuk et al., 2016; Viel et al., 2017). The occurrence of               and OV13-11, respectively) that were isolated from industrial
commercial yeast genotypes within the different sub-regions has              spontaneous fermentations conducted in the OV in previous
a weakening effect on the differentiation of sub-regional yeast              vintages [(McCarthy et al., Unpublished) and unpublished data
populations as observed in AMOVA results, which is consistent                from this group]. The discovery of these previously isolated
with a previous study (Viel et al., 2017). It is very likely that            S. uvarum strains in KE and OO suggests that these strains may
many of the commercial S. cerevisiae strains identified in this              be prevalent in OV vineyards, or that they were introduced from
study originated from the wineries that source grapes from the               the winery via a biological vector.
vineyards we sampled. These strains could be introduced into the                 In the 2017 vintage, we combined our yeast population
vineyard if the winery facility is in close proximity (Valero et al.,        study with a metabolite analysis of Pinot Noir berries from the
2005). Using composted winery waste (e.g., pomace and lees) as               same 13 vineyards. Berries collected from all three OV sub-
fertilizer may also introduce cellar yeast into the vineyard. While          regions contained similar amounts of TSS indicating that grape
we do not have composting data for all participating vineyards,              samples were generally collected at similar developmental stages
at least three vineyards (#1, #7, and #8) composted winery waste             and ripeness among sub-regions (Supplementary Table S11).
in one or both years of this study, however, commercial strains              Therefore, we can exclude ripening effects as a factor influencing
were only isolated from one of these vineyards. It is also possible          our results. Pinot Noir berry weight and seed number were
that other biological vectors such as insects, birds or human                both higher in the NP sub-region than OO and KE which is
activity may have transported these and other strains shared                 probably related to higher number of seeds per berry, which was
between sub-regions (Goddard et al., 2010; Francesca et al., 2012).          also higher in NP than OO and KE (Supplementary Table S11)
Curiously, we also identified 2 unknown strains isolated from                (Keller, 2010).
NP (OK11 and OK12) that are related to commercial beer yeast                     Pinot Noir grapes sampled from OO had lower anthocyanin
strains (Figure 4). OK11 and OK12 may have originated from                   content than NP and KE (Figure 6A). Changes in anthocyanin
a brewery located within NP and were introduced by human or                  accumulation are likely associated with sub-regional differences
other vectors into the vineyard.                                             in anthocyanin biosynthesis and/or degradation rather than to
    InStruct results indicate that there were two clusters of                variation in berry size (Mori et al., 2007). Smaller berry size
S. cerevisiae strains (K8 and K9) that appear unassociated                   often results in a higher skin:berry ratio and can promote
with commercial strains isolated from the various vineyards                  the concentration of anthocyanins and other skin phenolics
(Figure 3). The phylogenetic network of unknown and                          (Roby et al., 2004; Wong et al., 2016). However, in this study
commercial strains compiled for this study further indicates                 we observed no differences in skin:berry ratio among sub-
that there are sub-populations of S. cerevisiae strains that are             regions (Supplementary Table S11). In general, anthocyanin
genetically distinct from commercial strains (Figure 4). There               biosynthesis is affected by biotic and abiotic factors [reviewed
is an intimate genetic association between global S. cerevisiae              in Teixeira et al. (2013)]. Temperature is known to strongly
wine strains and S. cerevisiae wine strain populations in Europe,            affect anthocyanin accumulation in grapes (Spayd et al., 2002;
which implies that European wine strains migrated around                     Yamane et al., 2006; Mori et al., 2007; Nicholas et al., 2011).
the globe and became separate sub-populations (Borneman                      At moderate growing temperatures (i.e., 20–25◦ C) anthocyanin
et al., 2016; Gayevskiy et al., 2016; Peter et al., 2018). Further           accumulation is promoted, while at relatively high temperatures
studies characterizing the genomic similarity between unknown                (30–35◦ C) anthocyanin accumulation is reduced, possibly
OV strains and European wine strains using whole genome                      because of a lower biosynthesis and/or higher rate of degradation
sequencing will be necessary to understand the origin of                     (Yamane et al., 2006; Mori et al., 2007; Artem et al., 2016).
S. cerevisiae strains identified in OV.                                      Therefore, the temperature differences in the OV sub-regions
    None of the 9 identified S. uvarum genotypes were isolated               may have contributed to the observed differences in anthocyanins
from multiple sub-regions. This may indicate that S. uvarum                  (Figure 6A). Among these 3 sub-regions, active heat summation
genotypes were exclusively associated to a sub-region, although              was highest in OO, with 1,513 GDD, followed by KE, with

Frontiers in Genetics | www.frontiersin.org                             14                                       August 2020 | Volume 11 | Article 908
Cheng et al. Saccharomyces Populations and Phenolic Composition
1,263 GDD, and lowest in NP, with 1,157 GDD. Furthermore, Although the proportion of several anthocyanins and
the number of days with the maximum temperature reaching flavonols were significantly different in OV sub-regions, there
35◦ C was greater in OO (12 days) than KE (7 days) and was little consistency among the various compounds. The
NP (2 days). Consistent with the previous studies reported major anthocyanin accumulated in Pinot Noir berries, M-
above, the lowest levels of anthocyanins were observed in the 3-G, was proportionally higher in OO than KE berries and
warmest region (OO). yet, KE and NP berries had the highest total anthocyanin
Aside from temperature, water availability is another factor levels (Figures 6A, 7A). Anthocyanins with a higher number
affecting anthocyanin accumulation because water deficit of methoxylated groups present in the B-ring, such as M-
generally promotes anthocyanin accumulation (Matthews 3-G, are more stable (Yang et al., 2018). Grape berries
and Anderson, 1989; Castellarin et al., 2007; Savoi et al., grown at high temperature (30–35◦ C) normally have a
2017). The OV sub-regions had also different cumulative higher relative abundance of methoxylated anthocyanins
precipitation from April 01 to October 31, 2017. The highest and flavonols in grape skins (Mori et al., 2007; Zhu
was recorded in NP (198 mm), followed by OO (140 mm), et al., 2017; Yan et al., 2020). The higher proportion of
and the lowest in KE (121 mm). Moreover, OO soils are methoxylated anthocyanins in OO than KE berries could be
characterized by a lower water holding capacity than NP and linked to the higher temperatures in OO compared to KE
KE soils (British Columbia Wine Institute, 2020). However, all (Figure 7A, see GDD for these two regions above). Higher
the sampled vineyards were irrigated in order to avoid water temperatures may favor the synthesis of the more stable
deficit events. Therefore, we speculate that precipitation and methoxylated anthocyanins or, alternatively, may favor the
water availability in general had no effect or a limited effect degradation of the non-methoxylated anthocyanins, which
in determining the anthocyanin differences observed among in either scenario would cause a relative increase of the
the OV sub-regions. methoxylated fraction.
Similar to the concentration of anthocyanins, flavonol levels The relative abundance of mono-, di-, tri-substituted flavonols
varied among the three OV sub-regions (Figure 6B). Previous varied by sub-region. We found that the coolest region, KE, had
studies have demonstrated that temperature variation and an increase in di-substituted but a decrease in tri-substituted
water availability have little or inconsistent effects on flavonol flavonols when compared to OO and NP (Figure 7B). Our
accumulation (Price et al., 1995; Spayd et al., 2002; Downey data is consistent with our recent study of Merlot berries
et al., 2004; Azuma et al., 2012). However, a recent study from that demonstrated similar effects of di- versus tri-substituted
our group indicates that, as for anthocyanins, high temperatures flavonols when low temperatures were compared to high
(i.e., 30–35◦ C) impair flavonol accumulation in the berry which temperatures (Yan et al., 2020). Moreover, Pastore et al. (2017)
is consistent with our observations here that the lowest level reported a higher proportion of di-substituted flavonols with
of flavonols is in OO, the warmest region (Yan et al., 2020). increased light exposure of berries. The changes observed in
Studies have shown that sunlight intensity, and particularly the our study are probably driven by the increase in the quercetin
intensity of UV light, positively correlates with flavonol levels conjugates observed in KE berries (Figure 6B). Quercetin,
in grapes (Price et al., 1995; Spayd et al., 2002; Azuma et al., a di-substituted flavonol, is the major flavonol produced in
2012; Martinez-Luscher et al., 2014a,b; Del-Castillo-Alonso et al., Pinot Noir berries and its variable levels in the OV sub-
2016). In this study, radiation levels were not available and a regions might be the major determinant of the shifts in
correlation analysis could not be performed. flavonol profile.
Seed tannin, but not skin tannin content was affected At present, we do not have sufficient data to determine
by the sub-region and the seed tannin data was consistent if there is any correlation between the Saccharomyces strains
with the number of seeds per berry (Figure 6C and isolated from OV sub-regions and the flavonoid profiles
Supplementary Table S11). OO had both a lower seed presented here. It has been shown that grape cultivars may
number per berry and lower seed tannin content than NP. This drive S. cerevisiae population structure, suggesting there may
is consistent with previous results indicating that seed tannin be adaptation or preference of yeasts to certain grape cultivars
content varies with the seed number (Harbertson et al., 2002). (Schuller et al., 2012). S. cerevisiae strains have variable effects
Previous studies on the association of grape tannin content with on final phenolic composition in red wines, which indicates
terroir have yielded inconsistent results (Ferndandez-Marin the potential for interaction between regional yeast populations
et al., 2013; Artem et al., 2016). The effect of environmental and grape phenolic profiles that is reflected in the finished
factors such as temperature and water availability on tannins wine (Carew et al., 2013). Further research is required to
still remains unclear as contrasting results have been reported determine how regional-specific wine yeast strains and the
among studies indicating that the grape variety, as well as the flavonoid profile of Pinot Noir grapes affect the quality of wine
interaction among various environmental factors affect tannin production in the OV.
content (Cohen et al., 2008; Nicholas et al., 2011; Zarrouk et al.,
2012; Genebra et al., 2014; Kyraleou et al., 2017). Based on our
study, high temperature (see GDD for OO above) is likely to DATA AVAILABILITY STATEMENT
reduce seed tannin accumulation in Pinot Noir, while a low
temperature (see GDD for NP above) is likely to enhance seed All datasets generated for this study are included in the
tannin accumulation. article/Supplementary Material.
Frontiers in Genetics | www.frontiersin.org 15 August 2020 | Volume 11 | Article 908You can also read


