The lighting environment, its metrology and non-visual responses - OSF
←
→
Page content transcription
If your browser does not render page correctly, please read the page content below
The lighting environment, its metrology and non-visual responses
Luc J.M. Schlangen1* and Luke L.A. Price2
The authors have contributed equally to the paper
1Intelligent
 Lighting Institute, Department Human-Technology Interaction, Eindhoven University of Technology, Eindhoven,
The Netherlands
2Centre for Radiation, Chemical and Environmental Hazards, Didcot, Oxfordshire, Public Health England, United Kingdom

* Correspondence:
Luc J.M. Schlangen
l.j.m.schlangen@tue.nl

Keywords: melanopsin, intrinsically photosensitive retinal ganglion cell, circadian rhythms, melatonin, visual
perception, non-image-forming effects, light therapy, sleep.

ACCEPTED (February 4th, 2021) FOR PUBLICATION IN: Sleep Disorders, a section of the journal Frontiers in Neurology,
special issue “Translation and Processing of Light by the Non-Image Forming Visual System – Context, Mechanisms and
Applications”.

Tables: 2
Figures:5

ABSTRACT

International standard CIE S 026:2018 provides lighting professionals and field researchers in
chronobiology with a method to characterize light exposures with respect to non-visual photoreception
and responses. This standard defines five spectral sensitivity functions that describe optical radiation for
its ability to stimulate each of the five α-opic retinal photoreceptor classes that contribute to the non-
visual effects of light in humans via intrinsically-photosensitive retinal ganglion cells (ipRGCs). The
CIE also recently published an open-access α-opic toolbox that calculates all the quantities and ratios of
the α-opic metrology in the photometric, radiometric and photon systems, based on either a measured
(user-defined) spectrum or selected illuminants (A, D65, E, FL11, LED-B3) built into the toolbox.

For a wide variety of ecologically-valid conditions, the melanopsin-based photoreception of ipRGCs
has been shown to account for the spectral sensitivity of non-visual responses, from shifting the timing
of nocturnal sleep and melatonin secretion to regulating steady-state pupil diameter. Recent findings
continue to confirm that the photopigment melanopsin also plays a role in visual responses, and that
melanopsin-based photoreception may have a significant influence on brightness perception and aspects
of spatial vision. Although knowledge concerning the extent to which rods and cones interact with
ipRGCs in driving non-visual effects is still growing, a CIE position statement recently used melanopic
equivalent daylight (D65) illuminance in preliminary guidance on applying “proper light at the proper
time” to manipulate non-visual responses. Further guidance on this approach is awaited from the
participants of the 2nd International Workshop on Circadian and Neurophysiological Photometry (in
Manchester, August 2019).

The new α-opic metrology of CIE S 026 enables traceable measurements and a formal, quantitative
specification of personal light exposures, photic interventions and lighting designs. Here, we apply this
metrology to everyday light sources including a natural daylight time series, a range of LED lighting
products and, using the toobox, to a smartphone display screen. This collection of examples suggests
ways in which variations in the melanopic content of light over the day can be adopted in strategies that
use light to support human health and wellbeing.

 1
Schlangen & Price, Lighting metrology and non-visual responses, accepted for publication in Frontiers in Neurology, February 4th, 2021
INTRODUCTION

Light is essential for vision, but starting from the earliest weeks of life (Price et al., 1983;Rivkees et al.,
1997;Morag and Ohlsson, 2013;Vasquez-Ruiz et al., 2014;Fernandez et al., 2020) it also drives
important non-image-forming (NIF) effects that are powerful determinants of sleep (Santhi et al., 2011),
circadian rhythms (Duffy and Czeisler, 2009), alertness (Cajochen et al., 2000;Souman et al., 2018b),
mood (Wirz-Justice et al., 2004) and hormone secretion (Lewy et al., 1980). This paper is intended for
lighting professionals, policy makers and researchers with a practical interest in lights’ eye-mediated
NIF effects, chronobiology and health. It explains and discusses a standardized light metrology (CIE,
2018) that is based on five retinal photoreceptor types, each of which has a distinct spectral sensitivity
and may contribute to non-visual or NIF responses (Lucas et al., 2014). Significantly, melanopsin is the
functional photopigment for one of these five photoreceptor types.
Accumulating evidence (Brainard et al., 2001;Thapan et al., 2001;Santhi et al., 2011;Hommes and
Gimenez, 2015;Nowozin et al., 2017;Souman et al., 2018a;Prayag et al., 2019;Spitschan, 2019b;Brown,
2020) suggests that the spectral sensitivity of melanopsin is the most successful and parsimonious model
to predict responses to medium and long duration exposures to ambient light like circadian phase
shifting, or modulations in pupil-size, alertness and melatonin secretion. However, no single action
spectrum or proxy will ever provide the complete picture (Lucas et al., 2014;Zeitzer, 2018) for all the
testable variations in intensity, timing, duration and patterns of light exposure that can be created in
laboratory settings (Rimmer et al., 2000;Gooley et al., 2010). Moreover, the effects of light in field
settings are often confounded by various uncertainties which may be due to non-photic effects,
interindividual variations in sensitivity to light (Phillips et al., 2019), differences in the populations
studied and the reduced environmental and behavioral control in real-life environments. Whilst
acknowledging these limitations, some examples will be presented to suggest ways in which the
melanopsin-based quantities from the standardized light metrology (CIE, 2018) can already be applied
in practice.
The pineal hormone melatonin is an important, commonly used marker of circadian rhythms and the
effects of light on its nocturnal secretion are well established (Lewy et al., 1980;Zeitzer et al.,
2000;Brainard et al., 2001;Thapan et al., 2001;Khalsa et al., 2003). In humans, melatonin facilitates
sleep initiation and sleep consolidation (Dijk et al., 1997), and is only secreted (resulting in detectable
levels) during the period that we habitually sleep. Nocturnal light exposure acutely suppresses
circulating melatonin levels (Lewy et al., 1980), but being awake, or asleep, by itself has no direct effect
on urinary melatonin (Morris et al., 1990). Under constant dim light conditions, melatonin levels start
rising in the evening and peak at night about 2 h before the core body temperature reaches its nadir
(denoted as CBTmin), with this nadir typically occurring a further 2 h before (habitual) wake-up time
(Shanahan and Czeisler, 1991;Barrett et al., 1993).
The sleep-wake cycle closely follows the 24 h melatonin cycle: habitual bedtime is about 2 h after the
melatonin onset (in dim light), while habitual wake-up typically occurs about 10 h after melatonin onset
(in dim light), with melatonin onset being defined as the time point at which the salivary melatonin
concentration increased to and stayed above either 4 pg/ml or 25% of its fitted amplitude (Duffy and
Wright, 2005;Crowley et al., 2014). Around the habitual wake-up time, melatonin concentrations are
decreasing and drop to undetectable levels, even in dim light conditions. When living outdoors for a
week in summer, camping under natural light and without any electric light exposure, average melatonin
onset () occurs near sunset, while average melatonin offset occurs before wake time, just after sunrise
(Wright et al., 2013). An abrupt change of the sleep-wake cycle leaves the melatonin 24 h profile
(virtually) unaffected (van de Werken et al., 2014), whilst a single laboratory light exposure with the
appropriate timing and duration can shift the phase of the melatonin rhythm by up to 3 h (Khalsa et al.,
2003;Chang et al., 2012). However, negative feedback in the genetic clock mechanism, regulated by
Sik1, limits the phase-shifting effects of light (Jagannath et al., 2013) and in jet-lagged humans and most

 2
Schlangen & Price, Lighting metrology and non-visual responses, accepted for publication in Frontiers in Neurology, February 4th, 2021
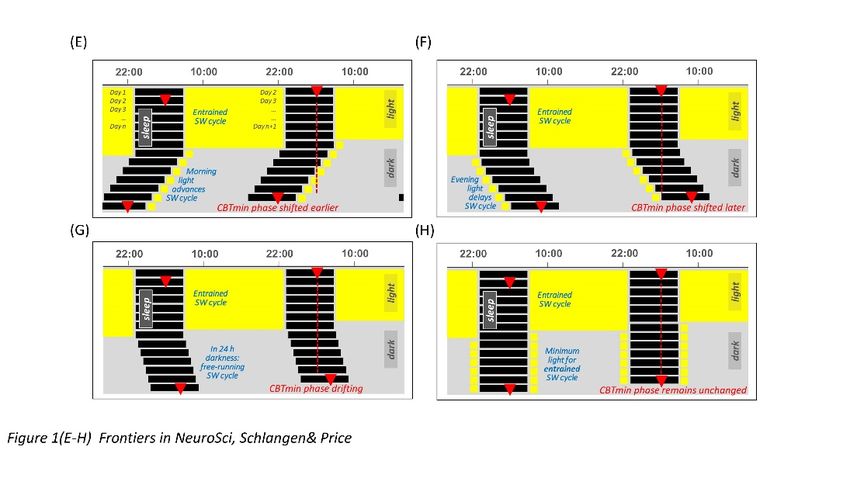
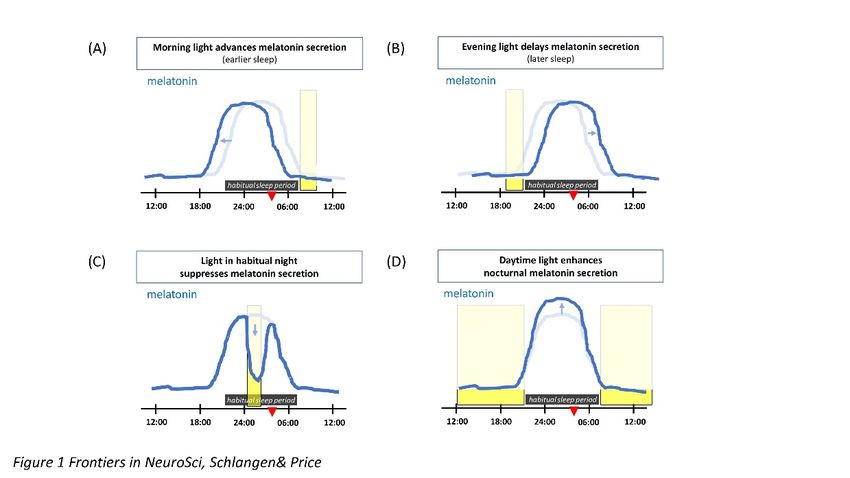
other mammals behavioral phase shifts remain restricted to about 1 h per day (one time zone) (Aschoff,
1981).
The effects of light on the 24 h melatonin profile are shown schematically in Fig. 1(A-D). Morning light
exposure advances the timing of melatonin secretion, facilitating earlier bedtimes and sleep onset, while
evening light exposure postpones melatonin secretion, thus delaying the drive to go to bed (Khalsa et
al., 2003). The circadian system considers light exposure that occurs before the CBTmin to be evening
light, whereas light exposure that occurs during the hours after the CBTmin is considered to be morning
light (Khalsa et al., 2003). Daytime light exposure can enhance nocturnal melatonin secretion (Mishima
et al., 2001), strengthen the body clock and reduce sensitivity to late evening/nighttime light exposures
(Hebert et al., 2002;Smith et al., 2004;Chang et al., 2011;Zeitzer et al., 2011;Chang et al., 2013;Rangtell
et al., 2016). Even a single 2.5 h bright light exposure in the early evening is sufficient to reduce the
acute sleep-disruptive effects of late evening light exposure (te Kulve et al., 2019).
Figure 1(E-F) show the effect of morning and evening light on the sleep-wake cycle within a double-
plotted actogram. When the light-dark cycle has a low amplitude, i.e. insufficient contrast between day
and night, the circadian rhythm is free-running. A person that lives in constant dim light, has a sleep-
wake cycle that shifts slowly to a later time every next day. This is depicted in Fig. 1(G), and is due to
the fact that under dim light the circadian rhythm is free running at its endogenous period, which is on
average about 24.2 h for humans (Carskadon et al., 1999;Czeisler et al., 1999;Kelly et al., 1999;Brown
et al., 2005;van de Werken et al., 2014). The right combination of morning and evening light exposure
entrains the circadian rhythm, so that it remains in sync with the 24 h light-dark cycle, see Fig. 1(H).
Evidence from the US suggests people in modern society may spend around 90% of their time indoors
(Klepeis et al., 2001;Murray et al., 2017;Beyer et al., 2018). The typical human indoor environment
provides relatively little light during daytime, especially compared to the natural light outdoors, where
illuminances may be 1, 2 or even 3 orders of magnitude higher. For instance, the European standard for
lighting of work places (CEN, 2011) specifies minimum values for maintained horizontal illuminance
in offices between 200 lx and 750 lx, depending on the specific task, whereas the horizontal illuminance
outdoors can be as high as 150 klx (IESNA, 2000). In the late-evening hours and at night, the widespread
use of electrical light and luminous display devices results in extended exposures to light (Czeisler,
2013). Through their impact on circadian rhythms, these unnatural lighting conditions enhance
eveningness (Wright et al., 2013). Moreover, modern lifestyles and (unnatural) light exposures are
known to result in more “social jet-lag”, and this has negative consequences for sleep, performance,
wellbeing and health (Roenneberg et al., 2012;Giuntella and Mazzonna, 2019). Evolution shaped us to
live in much brighter daytime conditions than present in our modern indoor life. For a healthy lit
environment, people with a normal diurnal activity pattern (i.e. day-oriented, and usually in bed at night)
need bright white light during the day, and especially in the morning, while they should reduce
prolonged exposures in the late evening and avoid light as much as possible at night (see also CIE
position statement (CIE, 2019)).
Although the introduction concentrates on chronobiology, it should be noted that chronobiological
responses are just a subset of non-visual responses to light. The non-visual metrology tools described in
this paper, and the information presented below, can also be applied to other retinal responses to ambient
light.

 3
Schlangen & Price, Lighting metrology and non-visual responses, accepted for publication in Frontiers in Neurology, February 4th, 2021
RETINAL PHOTORECEPTORS
Early this century a new class of retinal photoreceptor, the intrinsically-photosensitive retinal ganglion
cell (ipRGC), was discovered (Berson et al., 2002). In addition to receiving extrinsic input signals from
rods and cones, this class of photoreceptor expresses melanopsin which gives rise to the intrinsic light
sensitivity after which it is named (Lucas et al., 2014). Fig. 2(A) shows the spectral sensitivities of the
five classes of photoreceptors involved in non-visual photoreception (CIE, 2018), together with the well-
known V(λ) function officially denoted as the spectral luminous efficiency function for photopic vision.
In humans, melanopsin photoreception occurs efficiently across the short wavelength range of the visible
spectrum between 420 nm to 560 nm, with a peak sensitivity in vivo at approximately 490 nm (Lucas
et al., 2014). Melanopsin-based signaling is more sluggish in onset and more sustained than rod or cone
signaling (Gooley et al., 2012;Keenan et al., 2016;Charng et al., 2017). At least six subtypes of ipRGCs,
M1-M6, have been identified in the mammalian retina (M1-M5 to date in humans) (Schmidt et al.,
2011;Zhao et al., 2014;Mure et al., 2019;Quattrochi et al., 2019). Unlike rods and cones, ipRGCs have
photosensitive dendrites that extend transversely across the retina. Melanopsin-based photoreception
predicts both clock-mediated and acute non-visual responses under a range of everyday light exposures
(Brown, 2020). The clock-mediated effects include regulation of the sleep-wake cycle and circadian
phase shifting, whereas melatonin suppression, control of alertness and the steady state pupil diameter
are examples of acute responses to light (Nowozin et al., 2017;Souman et al., 2018a;Spitschan,
2019b;Brown, 2020).
During the first five years after birth, the crystalline lens in the human eye is still transmissive for short
wavelength visible light and even for ultraviolet radiation (UVR) close to 320 nm (Boettner and Wolter,
1962). It becomes opaque to UVR at about an age of 5, and as age increases, the lens transmittance in
the short wavelength range (i.e. violet and blue) of the visible spectrum decreases. Consequently, retinal
photoreceptors receive less light input at older ages, particularly the short-wavelength sensitive
photoreceptors (rods, S-cones and ipRGCs). Although adaptation mechanisms and neural plasticity may
compensate for the age-induced decline in short-wavelength light that actually reaches the retina, the
number of ipRGCs drops with age advancing beyond 50 (Esquiva et al., 2017). This loss of ipRGCs is
accompanied by changes in cell morphology and an observable increase in randomness of the ipRGC
distribution pattern.
It has been suggested that a decline in melanopsin photoreception with age could play a significant,
deteriorating role in sleep and neuro-cognitive effects of ageing (Esquiva et al., 2017), including those
related to dementia as well as general senescence. It is plausible that these effects may be partly mediated
by the negative effects on sleep due to a compromised non-visual circadian regulation with increasing
age (Van Someren, 2000;Van Someren et al., 2002;Riemersma-van der Lek et al., 2008). Partly
corroborating this hypothesis, it has also been observed that more fragmented and less stable sleep-
activity patterns are associated with a higher all-cause mortality (up to ~20%) in the middle-aged and
the elderly, independently of age (Zuurbier et al., 2015).

QUANTIFYING LIGHT FOR LUMINOUS PERCEPTION
Traditional lighting practice primarily targets visual performance, comfort and other aspects of the visual
domain, quantifying lighting designs and installations and light exposures using luminous flux (in
lumens), illuminance (in lux) and other visually related quantities. These quantities describe the
luminous sensation of a light source under photopic conditions (i.e. for luminances above 5 cd/m2 (CIE,
2010)), where cones drive human visual responses. Scotopic vision occurs while the eye is adapted to
very low luminances (below 0.001 cd/m2). Under scotopic conditions, visual responses are driven by
rods. The conversion between luminance and illuminance depends on the apparent source size measured
in steradians, so general scotopic and photopic thresholds cannot be expressed in lux.

 4
Schlangen & Price, Lighting metrology and non-visual responses, accepted for publication in Frontiers in Neurology, February 4th, 2021
Individually, photoreceptors follow the principle of univariance, meaning they cannot discriminate
between a change in intensity and a change in wavelength (Rushton, 1972). As such, the spectral
sensitivities of the human luminous sensation for photopic and scotopic vision can be described by the
spectral luminous efficiency functions V(λ) and V'(λ), respectively, see Fig. 2a. The spectral power of
light, for instance, can be photopically-weighted or scotopically-weighted by multiplying each
wavelength by V(λ) or V'(λ), respectively. Photometric units (such as the lumen, lux or candela) are
obtained after summing the result (which is now a photopically- or scotopically-weighted spectrum)
over all wavelengths and multiplying the result by the corresponding efficacy constants (Km and K'm,
respectively), as described below.
By definition, monochromatic radiation with a frequency of 540 x 1012 Hz, (which corresponds to the
wavelength 555 nm in standard air 1) has a luminous efficacy of 683 lm/W (BIPM, 2019). Since the V(λ)
function reaches its peak value at 555 nm, this is where the maximum luminous efficiency for photopic
vision (denoted by constant Km) equals 683 lm/W. The maximum luminous efficiency for scotopic
vision (denoted by constant K'm) equals 1700 lm/W, which follows from the relationship Km·V(555 nm)
= K'm·V'(555 nm).
The ratio of the luminous output (of a source) as evaluated using the scotopic efficiency function to the
luminous output evaluated using the photopic efficiency function is known as the S/P ratio. The S/P ratio
is a characteristic of the spectral distribution of the light, and by definition, equals 1 for monochromatic
radiation with a frequency of 540 x 1012 Hz, or a wavelength of 555 nm (in air). An S/P ratio above 1
denotes that a light source is more activating to rods per (photopic) lumen than 1 lumen of
monochromatic light at 555 nm.
Mesopic vision occurs while the eye is adapted to light levels that are in between photopic and scotopic
conditions. In this range, i.e. in the mesopic regime, the combined action of rods and cones defines the
human visual response. However, ipRGCs are implicated in retinal adaptation (Hankins and Lucas,
2002) and may be involved in the regulation of mesopic and photopic visual sensitivity (Allen et al.,
2019).
Do and Yau (Do and Yau, 2010) provided an extensive review of ipRGCs and their functions, including
their roles in visual responses. Already in 2002, Hankins and Lucas had demonstrated that adaptations
of the human primary cone visual pathway according to time of day are driven by a non-rod, non-cone
photopigment with a spectral sensitivity profile that matches the standard profile of an opsin:vitamin A-
based pigment with a peak at approximately 483 nm (Hankins and Lucas, 2002). The resulting curve is
now widely accepted as the prototype action spectrum of the photopigment melanopsin and describes
the intrinsic light sensitivity in ipRGCs. Another demonstration that melanopsin can drive visual
perception comes from a case study of a blind individual lacking functional rods and cones who could
report whether a monochromatic light stimulus of 480 nm was on or off, but failed to do so for other
wavelengths (Zaidi et al., 2007).
Recent studies suggest the possibility of further melanopic influences on visual responses. Human
brightness perception can be greater when the light stimulus has a larger melanopic content while being
isoluminant for rods and cones (Brown et al., 2012), and further experiments have quantified the effect
of melanopsin on brightness perception in more detail (Zele et al., 2018;Yamakawa et al., 2019).
Melanopsin effects can increase brightness perception by up to 10%, especially for brightness
discrimination tasks that involve little or no differences in luminance and hue (DeLawyer et al., 2020).
Finally, it is worth noting that melanopsin photoreception can also improve the detectability of coarse
patterns (Allen et al., 2019). Together these results indicate that melanopsin is not only implicated in

1
 For readability, 555 nm will be written instead of λd ≈ 555.016 nm for the wavelength of light corresponding to
a frequency of 540 x 1012 Hz for light in standard air.

 5
Schlangen & Price, Lighting metrology and non-visual responses, accepted for publication in Frontiers in Neurology, February 4th, 2021
non-visual responses and visual adaptation, but may also contribute meaningfully to further visual
responses like brightness perception and pattern recognition. However, proper demonstration of
melanopic influences to vision is methodologically complex and still faces many challenges (Spitschan,
2019a). At present, the relevance of melanopsin-based photoreception for brightness perception beyond
laboratory settings is not yet settled and merits further investigation.

QUANTIFYING LIGHT FOR NON-VISUAL RESPONSES: α-OPIC METROLOGY
As detailed above, the melanopsin-based photoreception of ipRGCs constitutes an important driver of
non-visual responses. In their work, many lighting designers already draw on a wide understanding of
the visual, architectural and psychological aspects of light and lighting. Awareness amongst lighting
professionals is increasing that next to cone-dominated metrics such as correlated colour temperature
(CCT), illuminance and luminance, there is a need to consider melanopsin-based photoreception in
specifications, codes, recommendations and research. All these metrics are useful tools for quantifying
or comparing individual aspects within a lighting scheme, but they cannot replace an experienced
designer’s overall appreciation of the interplay between the diverse effects of light. In addition, NIF
photoreception relates to the light arriving at the eyes from all directions. This requires recommendations
framed in terms of light arriving at eye level - e.g. measured normal to the visual axis in the vertical
plane - rather than with reference to the light falling on the horizontal plane, walls or object surfaces.
No single action spectrum or proxy can describe all eye-mediated non-visual responses to light (Lucas
et al., 2014;Zeitzer, 2018). All five known receptor types can contribute to these responses, and the
relative contribution of each individual photoreceptor type can vary depending on the specific response
and upon light exposure properties such as intensity, spectrum, duration, timing (external and
internal/circadian), prior light history and sleep deprivation state of the individual. Based on the Lucas
et al. review paper (Lucas et al., 2014), the International Commission on Illumination (CIE) - the
worldwide body responsible for developing international standards and reports on light and lighting -
has published CIE S 026:2018 “CIE System for Metrology of Optical Radiation for ipRGC-Influenced
Responses to Light”. This new International Standard defines spectral sensitivity functions, quantities
and metrics to describe optical radiation for its ability to stimulate each of the five retinal photoreceptor
classes that, via ipRGCs, can contribute to the non-visual effects and functions of light in humans.
The Lucas et al. authors used an opsin template and a lens transmittance function to establish five action
spectra that describe the spectral sensitivity of all five known retinal photoreceptors that can contribute
to non-visual responses. The CIE standard adopts the same melanopsin action spectrum as the Lucas et
al. authors. However, for consistency with existing standards and psychophysical data, CIE S 026 adopts
the 10-degree cone fundamentals (CIE, 2006) and the spectral luminous efficiency function for scotopic
vision, V’(λ), to describe the cone and rod action spectra, respectively.

Figure 2(A) shows the five spectral weighting functions or action spectra, sα(λ), for the five retinal
photoreceptor classes: S cone, M cone, L cone, rhodopsin and melanopsin-encoded photoreception of
ipRGCs as defined in CIE S 026. For each of these five (α-opic) photoreceptors, an α-opic irradiance
can be calculated from the spectral irradiance, Ee,λ, of a (test) light source, see Table 1. The α-opic
irradiance of a test light divided by its illuminance, Ev, defines its α-opic efficacy of luminous radiation
(α-opic ELR). The ratio of this α-opic ELR to the α-opic ELR of standard daylight (D65) defines the α-
opic daylight (D65) efficacy ratio (α-opic DER) of the test light.

 6
Schlangen & Price, Lighting metrology and non-visual responses, accepted for publication in Frontiers in Neurology, February 4th, 2021
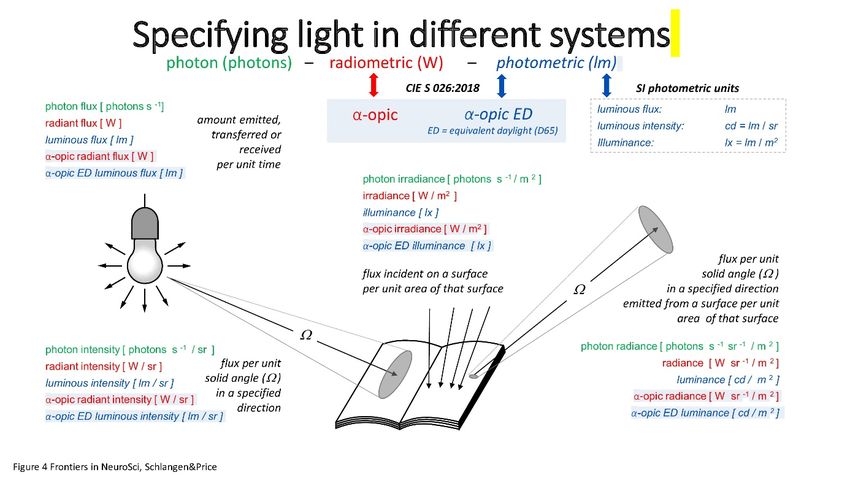
REFERENCE ILLUMINANTS, EQUIVALENT ILLUMINANCES, S/P AND M/P RATIOS
Since daylight is a naturally occurring stimulus under which we evolved, it is an interesting and relevant
point of reference to evaluate and express the properties of human light conditions within the built
environment. The CIE standard illuminant D65 is adopted as the reference illuminant in CIE S 026
(2018) to express each of the five α-opic irradiances as a photometric equivalent quantity 2. These
quantities are the five α-opic equivalent daylight (D65) illuminances (α-opic EDIs). Each α-opic EDI
is expressed in lx and corresponds to the illuminance of D65 radiation that is required to provide an
equal α-opic irradiance as the test light, for a given α-opic photoreceptor. The term “test light” used here
refers to the light being considered, to differentiate it from the reference illuminant.
The photometric equivalent concept adopted in S 026 is not restricted to illuminance (unit lx), and
luminance (unit cd/m2). It can also be applied to other quantities such as light exposure (unit lx⋅h),
luminous energy (unit lm⋅s), and luminous intensity (unit cd) 3.
Returning to CIE S 026, when describing the spectral properties of a test light, the ratio of the α-opic
EDI of a test light to its illuminance defines the α-opic DER of the test light, see Table 1. In other words,
the melanopic DER represents the ratio of the melanopic flux (“M”) per photopic luminous flux (“P”)
of a test light, and this dimensionless quantity can usefully be thought of as the new “M/P ratio”. By
definition, this ratio is normalized to 1 for the reference illuminant D65. The S/P ratio is an established
lighting metric. It equals 1 for monochromatic radiation of 555 nm, as the S/P ratio effectively uses
radiation of 555 nm as its normalizing reference illuminant. In case the melanopic EDI is 30 lx, the test
light has the same activating effect on ipRGCs as 30 lx of radiation conforming to the spectrum of D65
daylight. In the same way, a scotopic illuminance of 30 lx indicates that the test light has the same effect
on rods as 30 lx of radiation at 555 nm.

PHOTOMETRIC AND RADIOMETRIC α-OPIC QUANTITIES

There are three different mainstream metrological approaches for quantifying visible optical radiation:
• radiometry based on spectral energy,
• radiometry based on spectral count of photons, and
• photometry based on spectral luminous efficiency function for photopic vision, V(λ), and the
efficacy constant, Km (or V'(λ) and K'm for scotopic vision).

In the SI system, radiometry is described as “the field of metrology related to the physical measurement
of the properties of electromagnetic radiation, including visible light.” Radiometric quantities can be
unweighted, but photobiological quantities are typically weighted according to a suitable action
spectrum that describes the relative efficiency of radiation as a function of wavelength in producing an
effect.

Energy-based radiometry is often used by physicists, whereas photobiologists and photochemists often
use the photon system, and the light and lighting professions have a strong preference for photometry.
Photometry uses special SI units like cd, lm and lx. Radiometry and photometry and their units are

2
 D65 represents daylight with a colour temperature of approximately 6500 K. Other reference illuminants (like
standard illuminant A or equi-energy illuminant E) could be used instead of D65 to define equivalent
illuminances, but such non-standard quantities should be avoided as much as possible. Lucas et al. adopted the
equi-energy illuminant (E) as the reference illuminant when introducing the “α-opic equivalent illuminance”
concept for non-visual metrology (Lucas et al., 2014; CIE, 2015), but without explicit mention of the reference
illuminant selected.
3
 In the same order, the photometric quantities that correspond to this list are α-opic equivalent daylight (D65)
light exposure [lx⋅h], α-opic equivalent daylight (D65) luminous energy [lm⋅s], and α-opic equivalent daylight
(D65) luminous intensity [cd].

 7
Schlangen & Price, Lighting metrology and non-visual responses, accepted for publication in Frontiers in Neurology, February 4th, 2021
closely related through the current definition of the SI base constant Kcd (Kcd ≈ Km, see earlier) and the
corresponding SI base unit for the photometric quantity luminous intensity, namely the candela. Of the
seven SI base units (and their defining constants) the candela and its defining constant Kcd are unique in
relating to human vision, rather than a fundamental physical phenomenon. The photon system is very
similar to the radiometric system with energy units replaced by number of photons (requiring an
adjustment 4 to spectral weighting functions and quantities), and is often expressed after taking logs, due
to the very large numbers involved.

Figure 3 illustrates the deep connections between these three metrological approaches. The set of
quantities (illuminance, luminous flux, luminance, etc.) in the photometric system has the analogues
photopically-weighted (irradiance, radiant flux, radiance) in the radiometric system and the analogues
photopically-weighted photon (irradiance, flux, radiance) in the photon system. These analogues have
units (lx, lm, cd/m2), (W/m2, W, W/sr/m2) and (m-2⋅s-1, s-1, sr-1⋅m-2⋅s-1), respectively. For melanopic
quantities – with exactly the same units – the respective quantities are (melanopic EDI, melanopic
equivalent daylight (D65) luminous flux, melanopic equivalent daylight (D65) luminance), melanopic
(irradiance, radiant flux, radiance) and melanopic photon (irradiance, flux, radiance). Equally, for the
other four α-opic quantities, the same relationships hold. Under CIE S 026 definitions, melanopic
equivalent daylight (D65) luminance can be abbreviated to melanopic EDL.

α-OPIC TOOLBOX

To calculate α-opic quantities in the radiometric, photon and photometric systems, and convert from one
system to another, CIE has published an interactive ExcelTM spreadsheet, the “CIE S 026 Toolbox” (CIE,
2020b). Access to the Toolbox is free on the CIE website [DOI: 10.25039/S026.2018.TB], and also an
introductory video and a user guide are provided. The Toolbox features include weighting functions,
spectral weighting charts and a concise glossary.

Toolbox users can enter a spectral measurement and calculate all the quantities that are the geometric
analogues of irradiance and radiance, including the illuminance and α-opic EDIs for this spectrum (Fig.
4(A)). Alternatively, even without spectral data, users can familiarize themselves with the links between
the three systems using one of the five built-in spectral distributions selected from the CIE standard
illuminants (A, D65, E, FL11, LED-B3; Fig. 4(B)).

EVERYDAY EXAMPLES

The CIE has proposed “integrative lighting” to be the official term for lighting that is specifically
intended to integrate visual and non-visual effects, producing physiological and psychological effects
on humans that are reflected in scientific evidence (CIE, 2019;2020a). In the context of this promising
new approach, we reconsider the light that people are exposed to in their daily lives. To investigate and
characterize potential light exposures in relation to non-visual responses, a number of measurements of
familiar sources of light were made, where possible re-using information from previous investigations.
The α-opic toolbox was used to evaluate the absolute and relative melanopic content of these sources in
more detail. Taken together, subject to the potential limitations of the melanopic model for predicting
NIF responses to light (see Introduction), the information provides useful context and further evidence
for advice relating to light and health.

4
 The energy, E, of a single photon depends on Planck’s constant, h, the speed of light, c, its wavelength, λ, and
the refractive index of the medium (nair, say), so that for Np photons (as it is expressed in the photon system) at a
given wavelength, the corresponding radiometric energy is Ee = Np⋅h⋅c/λ⋅nair . When converting action spectra
from the photon system to the radiometric energy system, or vice versa, once the adjustment has been applied at
every wavelength, the entire action spectrum must also be renormalized so that its new maximum value is equal
to 1.

 8
Schlangen & Price, Lighting metrology and non-visual responses, accepted for publication in Frontiers in Neurology, February 4th, 2021
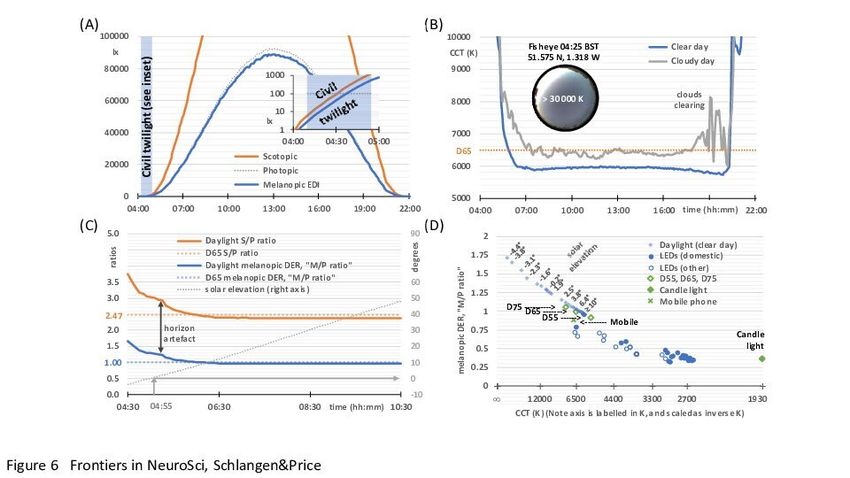
Experimental Methods

All the spectral data were measured using equipment sets subject to secondary calibrations, and traceable
to national standards performed and maintained in-house (Public Health England, Didcot, Oxfordshire,
UK). The data were checked against comparable alternative measurements of the same sources. Spectral
equipment sets consisted of TE-cooled spectroradiometers (BW Tek, Newark, USA), coupled via optical
fibres (Newport Spectra-Physics Ltd., Didcot, UK) to optical diffusers (Bentham, Reading, UK).

Daylight characteristics analyzed relate to a clear day (29 May 2020) and a cloudy day (18 June 2020),
and are based on global spectral irradiance data from a solar monitoring laboratory at (51.575° N, 1.318°
W, altitude 125 m), measured in the horizontal plane at five-minute intervals using in-house acquisition
software (Public Health England, Didcot, Oxfordshire, UK).

The photographic fisheye image taken at 04:25 on 29 May 2020 in Fig. 5(B) is part of a parallel series,
also taken at five-minute intervals, using Q24 hemispheric outdoor camera, (Mobotix AG, Hauptsitz,
Germany), at the same location.

LED spectral irradiance data were measured in temperature-controlled laboratory conditions in two
earlier studies (CIBSE, 2016;O'Hagan et al., 2016): firstly, a modern mobile phone model (from 2016
but still in widespread use in 2021) displaying a white screen at full power at a distance of 150 mm (ID
13, (O'Hagan et al., 2016)) and, secondly, an LED lighting sample which included any 40W-equivalent
GU10 (spots) and any 60W-equivalent BC22 (bayonet light bulbs) general service lighting product types
available to a UK retail consumer in 2015 over a 10-day period either online or through local and
national stores (within an area bounded by Aylesbury, High Wycombe and Oxford). The latter sample
included a number of comparator LED lighting products with different fittings, but excluded colour-
tunable products (CIBSE, 2016).

The simplified spectral emissions of a candle were modelled as arising from a Planckian radiator with a
colour temperature of approximately 1930 K (Walsh, 1926).

Results: Daylight

On an ideal clear day, horizontal illuminance, scotopic illuminance and melanopic EDI follow smooth
bell-shaped curves, and melanopic EDI values are similar to illuminance values (Fig. 5(A)). This close
agreement results from the melanopic EDI-normalization using standard daylight illuminant D65. The
daylight characteristics in Fig. 5 may not correspond exactly to daylight at high altitude, in different
atmospheric conditions, and when measured with different fields-of-view. During the hour preceding
dawn (see Fig. 5(A) inset) , and after sunset, the melanopic EDI increases, but decreases relative to the
visual measure of illuminance, and vice versa after sunset. Other characteristics derived from the spectral
daylight data also progress smoothly on a clear day, but Fig. 5(B) illustrates how a cloudy day introduces
volatility, exemplified here using the visual metric correlated colour temperature (CCT). In contrast, on
the clear day (verified with fisheye photographs such as the one shown in the Fig. 5(B) inset), the CCT
falls rapidly in the hours either side of dawn. The minimum CCT occurs approximately one hour either
after dawn or before sunset, with a small increase in CCT to a local maximum at approximately solar
noon. Atmospheric conditions may give rise to asymmetry in the spectral characteristics on either side
of solar noon.

Earlier studies have analyzed spectral and/or melanopic daylight time-series data averaged over a
number of days (Walmsley et al., 2015;Spitschan et al., 2016;Brown, 2020). However, we are
particularly interested in the results on a clear day and the melanopic daylight (D65) efficacy ratio, that,
as explained earlier, can be thought of as an M/P ratio with similarities to the S/P ratio (see Fig. 5(C)),
both being ratios of the quantities shown in Fig. 5(A). In common with CCT, these ratios are highly
dependent on solar elevation, and hence solar time on any given day. For solar elevations above 10° the
ratios remained stable (i.e. for the main part of the day). For D65, with a CCT of approximately 6500
K, the melanopic DER or M/P ratio equals 1 by definition and the S/P ratio equals 2.47. For solar

 9
Schlangen & Price, Lighting metrology and non-visual responses, accepted for publication in Frontiers in Neurology, February 4th, 2021
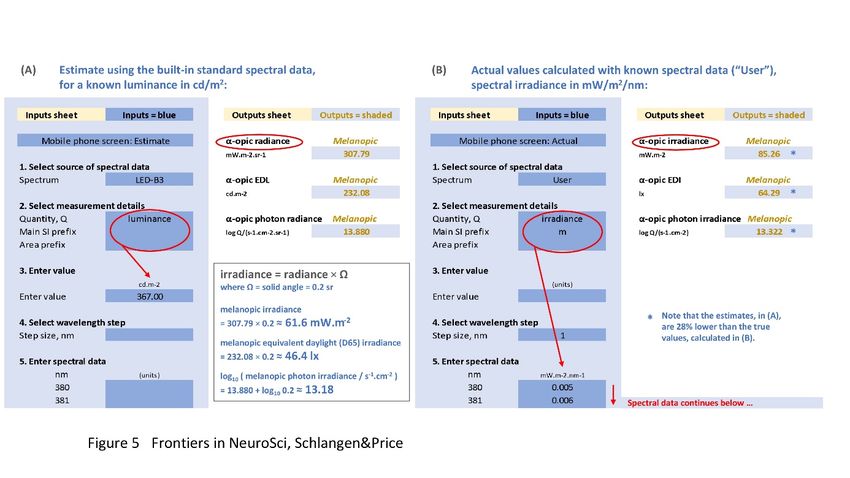
elevations above 10°, the M/P and S/P ratios observed were slightly below 1 (see Fig. 5(C)), which
reflected the difference between the observed CCTs and that of D65 (see Fig. 5(B)). When the sun is
down or low in the sky, an elevated horizon can obscure the brightest part of the sky or the sun. In this
way trees, buildings and the landscape can cause deviations from the smooth curve that would otherwise
be observed. Fig. 5(D) shows the CCT dependence of the melanopic DER for daylight on a clear day.
In the next section we will compare this to white LED lighting.

Results: White LED lighting

Figure 5(D) shows the CCT dependence of the melanopic DER for the non-colour-tunable white LED
lighting (2015 retail products), all of which were based on a blue LED plus yellow phosphor, with the
GU10 and BC22 domestic LEDs shown as a separate series. For the domestic LEDs (n=25), CCT
explained 87% of the variance in melanopic DER, and CCT plus CRI (Color Rendering Index, Ra)
explained 95% (multiple linear regression). This chart shows that this CCT dependence of the melanopic
DER for the LED technology common to this white LED lighting sample does not match the CCT
dependence of the melanopic DER for daylight on a clear day. Further, all the LED lighting in Fig. 5(D)
has a significantly lower melanopic DER than daylight on a clear day, typically by around 25% for a
CCT of 6500 K. At other CCT values the deficit in melanopic DER relative to daylight is higher, and it
remains significant, even after adjusting for the CCT-dependencies within the daylight and LED
melanopic DER series. In other words, this supports the viewpoint that all the LED lights in this sample
were relatively inefficient at producing melanopic light for a given combination of CCT and luminous
flux. The lower melanopic efficiency of white LED lighting with respect to natural daylight has also
been reported previously (Cao and Barrionuevo, 2015;Preciado et al., 2018). In addition to a reduced
illuminance, a lower melanopic DER may be appropriate at night and within spaces designed to be
restful, whereas in active workplaces a higher melanopic DER and an elevated illuminance may
engender a healthier daytime environment.

Results: Mobile Phone Screen - Toolbox Example

To further illustrate the α-opic metrology and the S 026 Toolbox, we will consider the melanopic EDI
(in lx) produced by a typical modern mobile phone (plotted as a green cross in Fig. 5(D)). There is some
concern about the effects on sleep of using display screen equipment before bedtime, including the use
of mobile phones and tablets in bed, because of the light they emit (Chang et al., 2015;van der Lely et
al., 2015;Rangtell et al., 2016), so the data we present here will provide a relevant and helpful example
to place the α-opic quantities in context. Indeed, a number of groups have directly studied the effects
that different light exposures can have on sleep (Zeitzer et al., 2000;van der Lely et al., 2015;Phillips et
al., 2019),

There are two approaches for performing calculations available in the Toolbox. The first is a simplified
approach using the spectra from the five built-in standard illuminants (A, D65, E, FL11, LED-B3). The
second approach requires the user to enter the actual spectral data of the test light in consideration. These
two approaches are chosen to illustrate why using the simplified approach (i.e. generalizing results from
standardized spectral distributions) will not always be appropriate, and may cause errors.

 10
Schlangen & Price, Lighting metrology and non-visual responses, accepted for publication in Frontiers in Neurology, February 4th, 2021
Simplified Approach. For a white mobile phone screen at full power backlit with an LED, the luminance
is 367 cd/m2 (O'Hagan et al., 2016). If the spectral data are not known, the Toolbox might still be used
if it can be assumed that the light emission of this phone conforms to the CIE illuminant LED-B3 built-
in into the Toolbox (however, as will be shown, this assumption is not tenable). On this tentative basis,
the melanopic radiance, the melanopic equivalent daylight (D65) luminance (melanopic EDL) and the
melanopic photon irradiance can be calculated with the toolbox (see Fig. 4(A)). As the screen subtends
an angle of approximately a 5th of a steradian at a viewing distance of 150 mm, the melanopic irradiance,
melanopic EDI and melanopic photon irradiance can be obtained as follows:

 melanopic irradiance = melanopic radiance × solid angle ≈ 308 mW/sr/m2 × 0.2 sr = 61.6 mW/m2

 melanopic EDI = melanopic EDL × solid angle ≈ 232 cd/m2 × 0.2 sr = 46.4 lx

 log10 melanopic photon irradiance/(cm-2⋅s-1) ≈ 13.88 + log10(0.2) ≈ 13.18

However, we may not be able to rely on the above estimates. We assumed that the spectrum of the
mobile phone conforms to LED-B3. This is likely to cause problems, as the spectrum from mobile
phones may have a higher blue content and, unlike LED-B3, is produced by three or more single colour
LEDs rather than by using a blue LED in combination with a yellow phosphor. In order to replace the
above estimates with accurate figures, we need to use the actual spectral data.

Spectral Data Approach. When using the Toolbox with the spectral irradiance data collected for the
selected LED screen (ID 13, (O'Hagan et al., 2016)), the Toolbox output sheet (see Fig. 4(B)) gives the
following results:

 melanopic irradiance ≈ 85 mW/m2

 melanopic EDI ≈ 64.3 lx

 log10 melanopic photon irradiance/(cm-2⋅s-1) ≈ 13.32

This spectral analysis shows that the simplified approach with the assumption that the phone’s light
emission conforms to LED-B3 resulted in underestimating the melanopic irradiance and EDI by almost
30%.

Exposure at 150 mm distance from a phone screen (at full white power) is a plausible worst-case scenario
for mobile screen use in children and young adults, but it is unlikely that the screen would be used in its
brightest setting only. The mix of light and dark within the images displayed on the screen will reduce
the spatially-averaged screen brightness as well as the time-averaged melanopic EDI measured at the
user’s eye. The brightness and the blue emissions may also be reduced in power in the evening using a
suitable app. Finally, holding the phone at a further distance reduces the average melanopic EDI incident
at the eye, by reducing the “visual” field occupied by the screen.

In preliminary guidance on applying “proper light at the proper time”, and in the absence of a formal
consensus, a CIE position statement (CIE, 2019) recently recommended using melanopic EDI as an
interim approach to manipulate non-visual responses. Further guidance on this approach is awaited from
the participants of the 2nd International Workshop on Circadian and Neurophysiological Photometry
(held in Manchester, August 2019), and this is expected to take the form of a scientific publication with
melanopic-EDI centered recommendations for healthy indoor light exposures. Further research may be
needed to investigate the potential limitations of using melanopic EDI in such recommendations and to
explore the correlations between the α-opic quantities and non-visual responses in more detail. While
this knowledge develops, and acknowledging the considerations set out in the introduction, the
melanopic action spectrum can be considered a good model for predicting melatonin suppression
responses: a melanopic EDI below 4 lx results in minimal responses (< 25% of maximum melatonin
suppression) and a melanopic EDI above 300 lx strongly suppresses salivary melatonin (>75% of the

 11
Schlangen & Price, Lighting metrology and non-visual responses, accepted for publication in Frontiers in Neurology, February 4th, 2021
maximum), depending on the exposure duration and experimental context (Brown, 2020). Furthermore,
dose-response relationships are subject to a large interindividual variability, for instance the human
sensitivity to light for melatonin suppression (i.e. the melanopic EDI needed to produce 50% of
maximum melatonin suppression) is reported to vary between individuals by more than one order of
magnitude, based on the 95% confidence interval (Phillips et al., 2019). Together with the melanopic
EDI values in Table 2, these findings provide inconclusive evidence whether the melatonin suppression
induced by mobile phone light emissions in the evening are at levels that raise practical concerns.
However, the possibility still remains that prolonged evening use of indoor electric lighting may result
in light exposures that are relevant for melatonin suppression.

Furthermore, whilst the studies mentioned above suggested that mobile phone screens can have
statistically significant effects on sleep, a more representative comparison (Chang et al., 2015)
demonstrated that a four-hour exposure to an e-reader compared to a printed book (when repeated on
five consecutive nights with a scheduled 06:00 am morning wake-up time) only resulted in an average
reduction of 5 minutes in total nightly sleep duration and 12 minutes in REM sleep duration, so these
effects of light may be less significant in a practical sense. Insufficient exposure to light during the day
in modern (indoor) lifestyles may be of greater concern, and, as set out earlier, daytime light exposures
increase the robustness of circadian rhythms and reduce the disruption caused by light exposures in the
evening, see the Introduction section and Fig. 1(D).

CONCLUDING REMARKS

Daily variations in the light environment are important for sleep, wellbeing and long-term health. The
knowledge base concerning the contributions and interactions of retinal photoreceptors in driving non-
visual effects is becoming more mature. Although the science is by no means complete, measures of the
environment expressed in terms of melanopic EDI are now thought to have ecological validity. New
recommendations for future building and lighting standards are therefore expected to incorporate both
minimum thresholds for daytime melanopic EDI and maximum thresholds for evening melanopic EDI.
These recommendations should be carefully integrated with the visual components within existing
lighting codes. One way of limiting evening melanopic EDI would be by recommending dimmer
lighting, and this is more effective when simultaneously lowering melanopic DERs (i.e. reducing M/P
ratios). Another recommendation could be to strive for near darkness wherever people are expected to
sleep at night. The CIE S 026 Toolbox has been introduced, partly to support this expected shift in
lighting practice, and partly to enable researchers to expand the evidence base for future lighting
standards, guidance and health advice.

Figure 5(D) shows that the melanopic DER for daylight on a clear day is significantly greater than the
melanopic DER within a recent sample of white LED lighting with a range of CCTs. This supports the
viewpoint that the LEDs sampled are relatively inefficient at producing melanopic light for a given
combination of CCT and luminous flux, in agreement with others (Cao and Barrionuevo, 2015;Preciado
et al., 2018). New lighting products, including those with tunable M/P ratios, may help to address this.
Higher M/P ratios, similar to daylight, might be considered a beneficial characteristic for the daytime
indoor environment. Daylight entry within the built environment is a good way to achieve this.

If the aim is to minimize melanopic light exposures, the lighting used at night for navigation and
perceptions of safety should be restricted to lower M/P ratios. Increased daytime light exposures can
reduce the adverse effects of evening light, and daytime light exposure may be as important as avoiding
bright light before bedtime. During the day, indoor electric lighting could reproduce the melanopic light
exposures (and other facets) of the outdoor environment, although this entails greatly increased indoor
illuminances. Nevertheless, daylight is an excellent, natural, energy-efficient source of melanopic-rich
light, and public health policies should encourage a daytime (natural) light-seeking lifestyle, especially
during the first morning hours after bed and starting from the very first days after birth.

 12
Schlangen & Price, Lighting metrology and non-visual responses, accepted for publication in Frontiers in Neurology, February 4th, 2021
CONFLICT OF INTEREST
LJMS’s full time position at Eindhoven University of Technology is partially funded by Signify. Both
authors have contributed extensively to the grey literature on this topic in unpaid voluntary roles,
including (CIE, 2015;2018;2019;2020b).

AUTHOR CONTRIBUTIONS
Both authors have contributed equally to the paper.

ACKNOWLEDGMENTS
Marina Khazova (PHE) is thanked for her generous help with the measurements.

DATA AVAILABILITY
The data used in this article is UK Crown copyright.

 13
Schlangen & Price, Lighting metrology and non-visual responses, accepted for publication in Frontiers in Neurology, February 4th, 2021
FIGURES

Figure 1. (A-D) Schematic representation of the effects of light on the 24 h melatonin profile. This
profile marks the circadian rhythm and the habitual sleep period. The latter is indicated by the horizontal
dark rectangle, the light blue line represents the corresponding melatonin profile for an individual in 24
h dim light conditions. The red triangle indicates the time at which the core body temperature reaches
its nadir at about 2 h before (habitual) wake-up time. The vertical rectangles denote a particular light
exposure. (A) Light exposure in the morning advances the timing of melatonin secretion (i.e. supports
earlier bedtime and awakening). (B) Light exposure in the evening delays the timing of melatonin
secretion. (C) Light exposure during the habitual sleep period acutely suppresses melatonin secretion.
(D) Daytime light exposure strengthens subsequent nocturnal melatonin secretion. (E-H) Double-
plotted actograms schematically showing patterns of the human sleep-wake (SW) cycle resulting from
different light exposures, each starting with several days in 16L:8D and with light restricted on
subsequent days. (E) Light restricted to1 h in the morning on waking, (F) light restricted to 1 h in the
late evening light. (G) In complete darkness (a D:D cycle), since the intrinsic period of the circadian
rhythm in humans slightly exceeds 24 h, the timing of the SW cycle drifts later and later across days.
(H) A theoretical example with sufficient light each morning and evening to entrain the SW cycle.

 14
Schlangen & Price, Lighting metrology and non-visual responses, accepted for publication in Frontiers in Neurology, February 4th, 2021
Figure 2. (A) The α-opic action spectra for non-visual metrology (CIE, 2018), sα(λ); S-cone opic (α=sc),
M-cone-opic (α=mc), L-cone opic (α=lc), rhodopic (α=rh) or melanopic (α=mel), where srh(λ) is defined
to be equal to the spectral luminous efficiency function for scotopic vision, V'(λ). The spectral luminous
efficiency function for photopic vision, V(λ), is also plotted. (B) The relative densities of the rods, cones
and ipRGCs by angular eccentricity from the central fovea (Curcio et al., 1990;Dacey et al., 2005). There
are no ipRGCs in the central visual field, but outside this field their density falls off to a steady value.
The maximum density of the ipRGCs is approximately 20-25 cells∙mm-2, 4 orders of magnitude lower
than the maximum densities of the rods or cones.

 15
Schlangen & Price, Lighting metrology and non-visual responses, accepted for publication in Frontiers in Neurology, February 4th, 2021
Figure 3. The three approaches to metrology and the α-opic quantities corresponding to these
approaches.

 16
Schlangen & Price, Lighting metrology and non-visual responses, accepted for publication in Frontiers in Neurology, February 4th, 2021
Figure 4. Representations of the CIE S 026 Toolbox: “Inputs” (areas with blue background) and
“Outputs” (areas with white background) with numbers relating to the melanopic quantities for a mobile
phone with a white screen at maximum brightness and an observer at 150 mm from the screen. (A) based
on the known luminance of 367 cd/m2, assuming the emitted spectrum conforms to CIE illuminant LED-
B3, and (B) based on the actual measured spectral irradiance (O'Hagan et al., 2016) with the same
luminance.

 17
Schlangen & Price, Lighting metrology and non-visual responses, accepted for publication in Frontiers in Neurology, February 4th, 2021
Figure 5. Daylight characteristics on a clear day (29 May 2020, sunrise 04:55, sunset 21:10, times in
BST), based on horizontal global spectral irradiance data from a solar monitoring laboratory in Didcot,
Oxfordshire, UK. (A) Illuminance (dotted grey line), scotopic illuminance (orange line) and melanopic
EDI (blue line), with an inset semi-log graph spanning the end of twilight (04:10) and sunrise. (B) The
correlated colour temperature (CCT) on a clear day (blue line, as above from 29 May 2020) and a cloudy
day (grey line, 18 June 2020, sunrise 04:50, sunset 21:25), with an inset 2π-fisheye image of the sky at
04:25. (C) The melanopic daylight (D65) efficacy ratio (melanopic DER, or M/P ratio, blue line), S/P
ratio (orange line) and solar elevation (dotted grey line), with the melanopic DER and S/P ratio for
standard daylight illuminant D65 for comparison (coloured dotted lines). The vertical arrow indicates
artefacts likely to be due to the slightly elevated local horizon. (D) Melanopic DER, or M/P ratio, plotted
against an inverse-CCT axis (labelled by CCT), with solar elevation labels next to selected pairs of data
points. Also plotted are CIE standard daylight illuminants (D55, D65 and D75; open diamonds), candle
light (1930 K blackbody; filled diamonds), a mobile phone (plus symbol, details given in Experimental
Methods), domestic LEDs (filled circles, n=25, details given in Experimental Methods), selected office
LEDs and selected street light LEDs (combined as open circles, n=16, also taken from (CIBSE, 2016)).

 18
Schlangen & Price, Lighting metrology and non-visual responses, accepted for publication in Frontiers in Neurology, February 4th, 2021
TABLES

Table 1. Glossary of α-opic metrology (CIE, 2018), where sα(λ) refer to the α-opic action spectra shown
in Fig. 2(A), α,v is the “α-opic stimulus per lumen”, α,v calculated for D65 (i.e. the α-opic ELR for
 D65
D65, α,v ) is a normalization constant. There are two ways to calculate the α-opic DER: α-opic DER
= α-opic ELR / α-opic ELR for D65 = α-opic EDI / illuminance.

 Quantity Abbreviation Formula Meaning Unit

 Weighted spectral
 α-opic irradiance irradiance,
 - α = � e, ( ) α ( )d W·m-2
 see note 1 e, , integrated over
 wavelength
 α-opic efficacy Quotient of α-opic
 of luminous α-opic ELR α,v = α ⁄ v irradiance, W·lm-1
 radiation α , and illuminance, v
 Illuminance level of
 α-opic
 D65 D65 daylight (D65),
 equivalent v,α = α ⁄ α,v
 α-opic EDI producing an equal α- lx
 daylight (D65) see notes 2 & 3
 opic irradiance, α , as
 illuminance
 the test light
 Ratio of the α-opic ELR
 α-opic daylight D65 D65 of the test light, α,v , to
 α,v = α,v ⁄ α,v
 (D65) efficacy α-opic DER -
 see note 2 the α-opic ELR of
 ratio D65
 daylight (D65), α,v
 Note 1. The α-opic photoreceptor types are denoted by five subscripts: S-cone opic (α=sc), M-cone-opic (α=mc), L-
 cone opic (α=lc), rhodopic (α=rh) and melanopic (α=mel), and the spectral weighting functions α ( ) are shown in Fig.
 2(A).
 D65
 Note 2. The five normalization constants, α,v D65
 , are sc,v
 D65
 = 0.8173 mW·lm−1, mc,v
 D65
 = 1.4558 mW·lm−1, lc,v =
 D65 D65
 1.6289 mW·lm−1, rh,v = 1.4497 mW·lm−1 and mel,v = 1.3262 mW·lm−1.
 Note 3. The non-standard quantity “melanopic equivalent illuminance” (often referred to as EML) can be converted
 into the melanopic EDI by a multiplication with 0.9058 (i.e. the α-opic DER of illuminant E). The other “α-opic
 equivalent illuminances” have no such linear relationship with their α-opic EDI analogues, as CIE S 026 and Lucas et
 al. use slightly different action spectra for the rods and cones.

 19
Schlangen & Price, Lighting metrology and non-visual responses, accepted for publication in Frontiers in Neurology, February 4th, 2021
You can also read


