Deafness Weakens Interareal Couplings in the Auditory Cortex - Andrej Kral
←
→
Page content transcription
If your browser does not render page correctly, please read the page content below
ORIGINAL RESEARCH
                                                                                                                                         published: 21 January 2021
                                                                                                                                    doi: 10.3389/fnins.2020.625721

                                            Deafness Weakens Interareal
                                            Couplings in the Auditory Cortex
                                            Prasandhya Astagiri Yusuf 1,2,3 , Peter Hubka 2,3 , Jochen Tillein 2,3,4,5 , Martin Vinck 6,7 and
                                            Andrej Kral 2,3,8*
                                            1
                                             Department of Medical Physics/Medical Technology Core Cluster IMERI, Faculty of Medicine, University of Indonesia,
                                            Jakarta, Indonesia, 2 Institute of AudioNeuroTechnology, Hannover Medical School, Hanover, Germany, 3 Department
                                            of Experimental Otology of the ENT Clinics, Hannover Medical School, Hanover, Germany, 4 Department
                                            of Otorhinolaryngology, Goethe University, Frankfurt am Main, Germany, 5 MedEL Company, Innsbruck, Austria, 6 Ernst
                                            Strüngmann Institut for Neuroscience in Cooperation with Max Planck Society, Frankfurt, Germany, 7 Donders Centre for
                                            Neuroscience, Radboud University, Department of Neuroinformatics, Nijmegen, Netherlands, 8 Department of Biomedical
                                            Sciences, School of Medicine and Health Sciences, Macquarie University, Sydney, NSW, Australia

                                            The function of the cerebral cortex essentially depends on the ability to form
                                            functional assemblies across different cortical areas serving different functions. Here
                                            we investigated how developmental hearing experience affects functional and effective
                                            interareal connectivity in the auditory cortex in an animal model with years-long and
                          Edited by:        complete auditory deprivation (deafness) from birth, the congenitally deaf cat (CDC).
                     David K. Ryugo,
Garvan Institute of Medical Research,       Using intracortical multielectrode arrays, neuronal activity of adult hearing controls and
                             Australia      CDCs was registered in the primary auditory cortex and the secondary posterior auditory
                        Reviewed by:        field (PAF). Ongoing activity as well as responses to acoustic stimulation (in adult
                       David R. Moore,
                                            hearing controls) and electric stimulation applied via cochlear implants (in adult hearing
Cincinnati Children’s Hospital Medical
                 Center, United States      controls and CDCs) were analyzed. As functional connectivity measures pairwise phase
               Benjamin D. Auerbach,        consistency and Granger causality were used. While the number of coupled sites was
   University at Buffalo, United States
                          Dexter Irvine,    nearly identical between controls and CDCs, a reduced coupling strength between
          Monash University, Australia      the primary and the higher order field was found in CDCs under auditory stimulation.
                   *Correspondence:         Such stimulus-related decoupling was particularly pronounced in the alpha band and
                           Andrej Kral
                                            in top–down direction. Ongoing connectivity did not show such a decoupling. These
          kral.andrej@mh-hannover.de
                                            findings suggest that developmental experience is essential for functional interareal
                  Specialty section:        interactions during sensory processing. The outcomes demonstrate that corticocortical
        This article was submitted to
    Auditory Cognitive Neuroscience,
                                            couplings, particularly top-down connectivity, are compromised following congenital
               a section of the journal     sensory deprivation.
            Frontiers in Neuroscience
                                            Keywords: congenital deafness, predictive coding, bottom-up, top–down, cochlear implant, synchronization
      Received: 03 November 2020
      Accepted: 30 December 2020
       Published: 21 January 2021
                                            INTRODUCTION
                             Citation:
           Yusuf PA, Hubka P, Tillein J,
                                            The auditory cortex is composed of a number of cortical areas with different functional roles
  Vinck M and Kral A (2021) Deafness
        Weakens Interareal Couplings
                                            (Malhotra et al., 2004; Winer and Lee, 2007). Together, these areas form a functional unit that
                in the Auditory Cortex.     allows constructing and perceiving sensory objects (Kral and Sharma, 2012; Bizley and Cohen,
          Front. Neurosci. 14:625721.       2013). Only limited information exists on how these areas interact during such processes (Valentine
     doi: 10.3389/fnins.2020.625721         and Eggermont, 2001), and it remains unclear how this interaction develops after birth. While it

Frontiers in Neuroscience | www.frontiersin.org                                   1                                        January 2021 | Volume 14 | Article 625721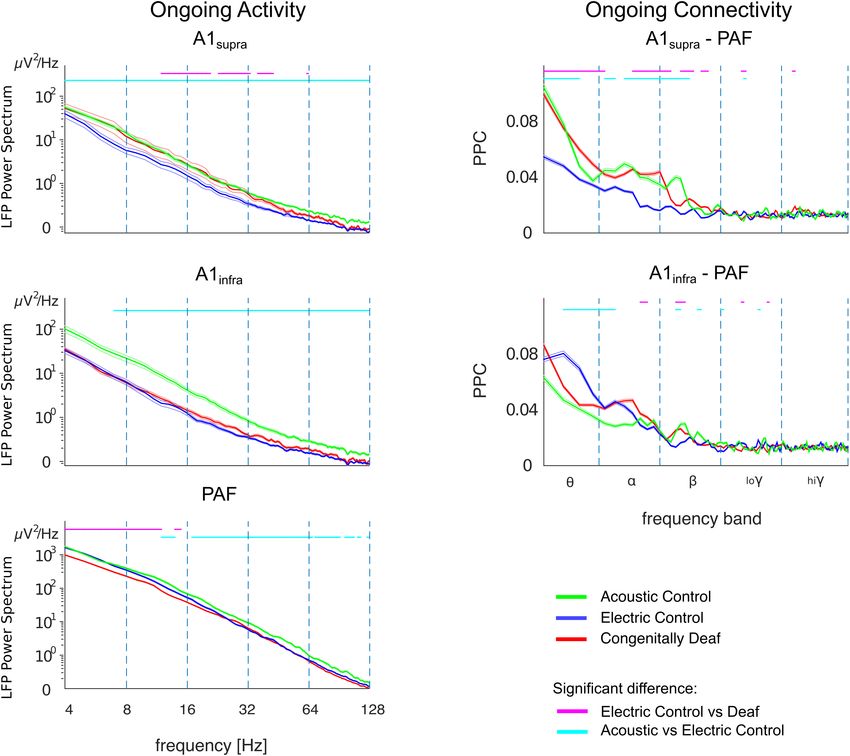
Yusuf et al.                                                                                                Interareal Couplings in Congenital Deafness

has been demonstrated that developmental hearing experience                      Effective connectivity defines the influence one neural
shapes the functional properties of individual brain areas (e.g.,                system has on another, either at synaptic or at population
Klinke et al., 1999; Chang and Merzenich, 2003; Fallon et al.,                   level, and is directional. Directional measures such
2009), the role of experience for integration of cortical areas into             as Granger causality (GC) are used to quantify the
a functionally unified auditory cortex is unclear. Despite a lot of              effective connectivity.
effort in investigation of brain connectome (defined as the totality
of all connections of the brain), only rudimentary information                 Structural connectivity provides a scaffold for functional
exists on its developmental constraints.                                   connectivity, but structural and functional connectivity correlate
    The question of developmental auditory experience is of                only weakly (Suárez et al., 2020) since functional connectivity
particular relevance given that cochlear implants (CIs) restore            additionally captures the dynamics of interactions over time, and
hearing in congenitally deaf children (Kral and O’Donoghue,                involves synaptic efficacy and responsiveness of target structures
2010). Developmental absence of hearing is accompanied by                  to patterns stored in the network (Avena-Koenigsberger et al.,
severe deficits in stimulus feature perception if hearing is               2018). Furthermore, functional connectivity may result from
restored late in life (Busby and Clark, 1999; Wei et al., 2007).           common inputs that direct structural connections do not reveal
On the other hand, CIs can compensate the deficits and                     but are functionally relevant for processing (Suárez et al., 2020).
provide access to spoken language with remarkable outcomes                     Since the structural connectivity between A1 and PAF is
if implantations are performed within an early critical period             generally preserved in both directions in CDCs (Barone et al.,
(Manrique et al., 1999; Ponton and Eggermont, 2001; Sharma                 2013; Butler et al., 2017), the aim of the present study was to
et al., 2002, 2005; Niparko et al., 2010). Later implantations are         compare functional and effective connectivity between A1 and
typically not successful because, in addition to the loss of (high)        PAF in hearing and deaf cats.
juvenile plasticity, congenital deafness strongly interferes with              An efficient way to quantify functional connectivity is using
cortical development (review in Kral and Sharma, 2012; Kral                the proxy of synchronization of band-specific neuronal activity
et al., 2019): it (i) leads to delays in functional synaptogenesis         (Fries, 2005; Womelsdorf et al., 2007; Buzsáki, 2009). Local
and augmentation of functional synaptic ‘pruning,’ (ii) reduces            field potentials allow such analysis (Fontolan et al., 2014;
the computational power of cortical networks and (iii) yields              Kornblith et al., 2016). In auditory and visual system, increased
abnormally functioning cortical microcircuits. Furthermore,                synchronization of activity in theta and gamma bands contributes
some cortical areas undergo a cross-modal reorganization                   to bottom–up interareal influences, while the increase in alpha
(Rauschecker, 1995).                                                       and beta bands contribute to top–down influence (Fontolan et al.,
    Cats have 2 primary and 11 higher-order auditory cortical              2014; van Kerkoerle et al., 2014; Bastos et al., 2015; Michalareas
areas (Rouiller et al., 1991; Winer and Lee, 2007). The posterior          et al., 2016). The influence of congenital deafness on such
auditory field (PAF) is one of the secondary auditory fields               synchronization is unknown.
(Stecker et al., 2003; Lee and Middlebrooks, 2013). It is part of              As a higher-mammal model of complete sensory deprivation,
the “where” pathway as defined in cats, primates and humans                congenitally deaf (white) cats (CDCs) were used here (Kral
(Rauschecker and Tian, 2000; Lomber and Malhotra, 2008). Both              and Lomber, 2015). The organization of the auditory cortex in
bottom–up (e.g., from primary field A1 to secondary field PAF)             CDCs has been defined functionally and anatomically, including
and top-down (e.g., from PAF to A1) information flow are                   detailed functional maps of fields A1 and the anatomically
involved in its function (review in Hackett, 2011). The absence            surrounding fields (e.g., Kral et al., 2006, 2009; Berger et al., 2017).
of hearing from birth leads to cross-modal reorganization of PAF,          Auditory responses in PAF of CDCs have been characterized
which becomes responsible for supranormal peripheral visual                previously, too (Yusuf et al., 2017). The present study takes
localization in congenitally deaf cats (CDCs) (Lomber et al.,              advantage of these previous observations.
2010). Primary field A1, on the other hand, is not involved                    In the present study, we compare invasive cortical recordings
in visual or somatosensory reorganizations (Kral et al., 2003;             with multielectrode arrays in three groups of animals: adult
Lomber et al., 2010). A plausible hypothesis is therefore that A1          hearing cats stimulated acoustically (acoustic controls, ACs),
and PAF show an interareal decoupling in congenital deafness               adult CDCs stimulated electrically with CIs, and adult hearing
(Kral and Sharma, 2012). Here we test this hypothesis.                     cats likewise stimulated with CIs (electric controls, ECs)
    Several measures of connectivity have been described (Friston,         following acute destruction of hair cells to prevent electrophonic
2011; Avena-Koenigsberger et al., 2018):                                   responses (Sato et al., 2016). These results in two possible
                                                                           comparisons: (i) Whereas CDC and EC receive the same
    1. Structural connectivity is provided by the anatomical               stimulus, they differ in their developmental sensory experience.
       presence of connections (fiber tracts) between the                  (ii) AC and EC differ in the stimulus but have the same
       structures of interest. Structural connectivity is typically        developmental sensory experience and thus a “similar brain.”
       analyzed by tracer studies in animals or diffusor tensor            This latter comparison thus provides information on the
       imaging in humans.                                                  influence of stimulus modality (acoustic vs. unknown electric) on
    2. Functional connectivity defines statistical dependence              the stimulus response.
       among remote physiological events, as frequently analyzed               Phase coherence measures and GC were used to quantify
       using amplitude correlations or phase coherence, the latter         the connectivity strength and the directionality of A1 – PAF
       being less dependent on individual response properties.             interaction in response to auditory stimulation. Phase coherence

Frontiers in Neuroscience | www.frontiersin.org                        2                                     January 2021 | Volume 14 | Article 625721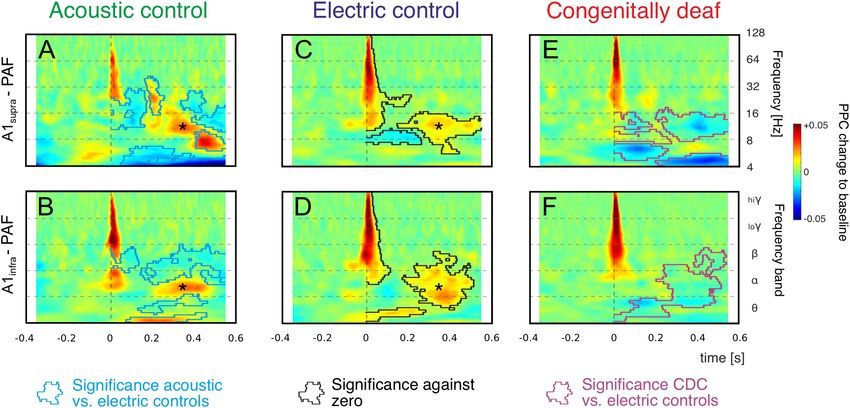
Yusuf et al.                                                                                             Interareal Couplings in Congenital Deafness

is independent of response power (amplitude). Using these                 status also involved blood gas concentration measurements,
connectivity measures we tested the hypotheses whether the                pH, bicarbonate concentration and base excess, glycemia and
artificial electric stimulus generates less interareal interaction        oxygen saturation determined in capillary blood. A modified
than the known acoustic stimulus, and whether CDCs show                   Ringer’s solution containing bicarbonate and plasma expander
fundamentally reduced interareal interaction as a consequence of          was infused i.v. through a venous catheter to supply volume
the total absence of hearing.                                             with additional bicarbonate depending on the acid-base status.
                                                                          Use of a higher mammal allows guaranteeing a constant (stable)
                                                                          overall condition of the animal by monitoring and correction
MATERIALS AND METHODS                                                     of the acid-base balance performed every 12 h throughout the
                                                                          experiments (48–72 h). Furthermore, continuous monitoring of
Subjects                                                                  the electrocardiogram, electroencephalogram, breathing pressure
Fifteen cats, ten adult hearing cats (hearing controls) and five          and capnometry ensured optimal vital state throughout the
adult CDCs were used in the present study. The details of the             whole experiment.
experimental procedure were described in previous publications                Following tracheotomy, placement of venous and urine
(e.g., Yusuf et al., 2017) and will be briefly recapitulated here.        catheter, and removal of both pinnae in order to directly
The CDCs were selected from a colony of deaf white cats on                access the tympanic membrane for closed-system acoustic
the basis of absence of auditory brainstem responses at 120 dB            stimulation, the animal’s head was fixed in a stereotactic frame
SPL in a hearing screening after birth (Heid et al., 1998; Kral and       (Horsley-Clarke). Both bullae and ear canals were subsequently
Lomber, 2015). Each animal’s hearing status was confirmed at the          exposed. To record auditory brainstem responses (ABRs), a
beginning of the acute experiments in all animals (for details, see       small trephination was drilled at the vertex of the skull and a
e.g., Berger et al., 2017).                                               silver-ball electrode (diameter 1 mm) was attached epidurally.
   To activate the auditory system in CDCs, the auditory                  The indifferent electrode used for the recordings was inserted
nerve was stimulated electrically using a custom-made CI. As              medially into the neck muscles.
a control for the deaf group, hearing animals were acutely                    Hearing status was verified using ABRs with 50 µs
deafened prior to cochlear implantation (intracochlear neomycin           condensation clicks applied through a closed system directly to
application) to prevent responses from healthy hair cells (known          the tympanic membrane using a calibrated speaker (DT48, Bayer
as electrophonic hearing, Sato et al., 2016, 2017). Additionally,         Dynamics, Germany) at levels up to 120 dB SPL. Brainstem
acoustically stimulated hearing animals were included so that             evoked signals were recorded using an epidural vertex electrode
the natural connectivity elicited by acoustic stimuli could be            against a reference at the midline of the neck, were preamplified
investigated. Thus, the study included three animal groups: ACs           (60 dB, Otoconsult V2 low-impedance amplifier), amplified
(n = 6), ECs (n = 6), and CDCs (n = 5). Of the hearing                    at a second stage (40 dB, Otoconsult Amplifier-Filter F1,
animals, two were first stimulated acoustically and subsequently          filters 0.010–10 kHz) and recorded using National Instruments
stimulated electrically in order to confirm, at the individual            MIO cards (National Instruments, Munich, Germany). The
level, the effects observed in the group data. Consequently, while        signals were averaged (200 sweeps, repetition rate 33 Hz,
6 animals were in both control groups, only 10 hearing cats               Audiology Lab, Otoconsult, Frankfurt am Main, Germany).
were used in total.                                                       Absence of acoustically evoked brainstem responses (including
   The experiments were approved by the local state authorities           wave I, generated within the auditory nerve) to clicks above
and were performed in compliance with the Guidelines                      120 dB SPL verified complete deafness. In hearing cats, the
of the European Community for the care and use of                         thresholds were less than 40 dB SPL before the animals were
laboratory animals (EUVD 86/609/EEC) and the German Animal                deafened by slow instillation of 300 µl of neomycin sulfate
Welfare Act (TierSchG).                                                   into the scala tympani (within 5 min.). The Neomycin was
                                                                          left in place for a further 5 min. and subsequently washed
Experimental Procedures                                                   out by slow instillation of Ringer’s solution. Total absence
All animals were premedicated with 0.25 mg atropine i.p. and              of brainstem evoked responses verified that the deafening
initially anesthetized with ketamine hydrochloride (24.5 mg/kg,           procedure was successful. For electrical stimulation, hearing cats
Ketavet, Parker-Davis, Germany) and propionyl promazine                   and CDCs were implanted with a CI inserted via the round
phosphate (2.1 mg/kg, Combelen, Bayer, Germany). They were                window. The implant consisted of a medical-grade silicone
then tracheotomized and artificially ventilated with 50% O2               tube with five intrascalar contacts: a small golden sphere at
and 50% N2 O, with the addition of 0.2–1.5% concentration                 the tip (diameter 0.8 mm) and four golden rings, the distance
of isoflurane (Lilly, Germany) to maintain a controlled depth             between all electrodes being 1 mm. The intrascalar part of the
of anesthesia in desynchronized cortical state identified by              implant was tapered in the apical direction from a diameter
suppression index values within between 1 and 3, by absence               of 1.6 mm to 0.8 mm. The extracochlear silicone tube had
of burst-suppression periods and absence of spindles/bursting             a diameter of 1.6 mm. The gold contacts were connected to
(Land et al., 2012). End-tidal CO2 was continuously monitored             a seven-strand Teflon-coated stainless-steel braided wire. The
and maintained at 4%, and the core temperature was kept                   stimulation mode was wide bipolar (most apical vs. the fourth
at 37.5 – 38.0◦ C using a homeothermic blanket connected                  intracochlear electrode in the basal direction; distance between
to a rectal temperature probe. Monitoring of the animal’s                 active electrodes was thus 3 mm).

Frontiers in Neuroscience | www.frontiersin.org                       3                                  January 2021 | Volume 14 | Article 625721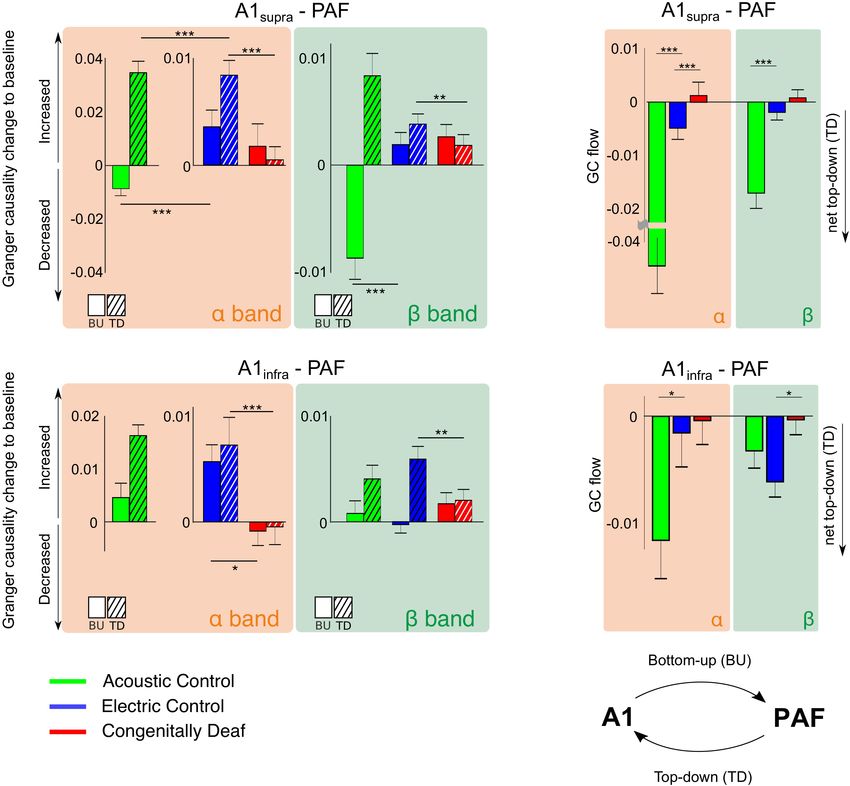
Yusuf et al.                                                                                            Interareal Couplings in Congenital Deafness

   Electrically evoked auditory brainstem response (E-ABR) to            ∼500 µm in the dorsoventral direction. All manipulation was
single biphasic pulses was recorded and the lowest current levels        performed using micromanipulators (precision ∼1 µm) and
evoking a brainstem response (E-ABR-threshold currents) were             under visual control through the operating microscope (OPMI1-
determined. For this purpose, charge-balanced biphasic pulses            H, Zeiss Deutschland, Oberkochen, Germany). Recorded signals
(200 µs/phase, repetition rate 33 pps) were applied to the CI            were bandpass filtered (1–9000 Hz) and amplified 5,000 times
using wide bipolar stimulation (most apical and most basal               (Neuralynx Cheetah, Bozeman, MT, United States). The data
electrode). Stimulation was performed with optically isolated            were digitized using a NI PCIe 6259 MIO card at a sampling
current sources (CS1, Otoconsult, Frankfurt am Main, Germany).           rate of 25 kHz per channel. During these recordings, the cortex
                                                                         was stabilized by means of a modified Davies chamber (Tillein
Stimulation and Recording                                                et al., 2010). The reference for both probes was the vertex silver-
Trephination was performed above the auditory cortex and the             ball electrode placed epidurally. Off-line, bipolar derivation of
dura was removed. The cortex was photographed to document                the signals in A1 before connectivity analysis ensured that the
the recording positions. Using an ORIEL motorized x-y-z                  reference did not influence connectivity results.
micromanipulator (1 µm precision in all directions), a silver-              The ACs were stimulated acoustically using three
ball macroelectrode (diameter 1 mm) was positioned at a regular          condensation clicks (50 µs duration at 500 pps) at different
raster of nine cortical positions on the primary auditory cortex         sound pressure levels. The ECs and CDCs were stimulated
(field A1). The dorsal end of the posterior ectosylvian sulcus was       using a custom-made CI inserted into the scala tympani
used as a reference point. Signals (local field potentials, LFPs)        through the round window. The stimulus was a train of charge-
recorded in response to an electric biphasic pulse applied through       balanced biphasic pulses (200 µs/phase, repetition rate 500 pps,
a CI were preamplified (60 dB, Otoconsult V2 low-impedance               three pulses in the train applied). Stimulation was in wide
amplifier), amplified at a second stage (20 dB, Otoconsult               bipolar configuration. The acoustic and electric stimuli were
Amplifier-Filter F1, filters 0.010–10 kHz), recorded using MIO           applied at a repetition rate of 1/1537 ms, with 30 stimulus
cards and averaged (100 sweeps, repetition rate 1.97 Hz). The            repetitions per condition (level). Stimulus increased in 10 dB
signals were stored and threshold current levels were evaluated          increments in acoustic stimulation and in 1–2 dB increments in
at all recording positions with a precision of ±1 dB.                    electric stimulation. Stimulus artifacts were removed by linear
    In order to determine the extent of the cortical activated           interpolation of the 6 ms period during stimulation. In a previous
region, a Ringer-filled glass microelectrode (impedance < 6 M)          study we ensured that this did not introduce any artifacts into
was used for mapping the field A1. LFPs on the cortical surface          frequency-specific signals used (Yusuf et al., 2017).
were recorded at 75–150 cortical positions during stimulation               The stimulation levels for connectivity analysis were chosen
with the CI, using single biphasic pulses (200 µs/phase, wide            according to input–output level functions (levels that reach
bipolar stimulation at both the ipsilateral and contralateral ear,       the saturation of evoked response). Analyses reported in the
stimulation current 10 dB above the lowest cortical threshold            present study were performed at 40 dB (acoustic) above ABR
determined using the macroelectrode). The stimuli were applied           threshold, while electrical stimulation was administered to ECs
at a repetition rate of ∼2 pps. Recorded signals were bandpass           and CDCs using three biphasic electric charge-balanced pulses at
filtered (10–9000 Hz) and amplified 5000 times (Neuralynx                6 dB (electric) above the electrically evoked auditory brainstem
Cheetah, Bozeman, MT, United States). The data were digitized            response (E-ABR) threshold.
using a NI PCIe 6259 MIO card at a sampling rate of 25 kHz
per channel. Fifty responses were averaged to obtain evoked LFPs.        Histology
Amplitudes of these middle-latency responses (peak to baseline)          For each animal, at least one penetration for each field was
were used to construct cortical activation maps and determine the        marked by a fluorescent dye (DiI, 1,10-dioctadecyl-3,3,30 ,30 -
most responsive region in A1, the “hot spots” (Kral et al., 2009).       tetramethylindocarbocyanine perchlorate; Invitrogen). Since the
    Simultaneous recordings from the right A1 and PAF were               probe attachment to the stereotactic frame was constant
performed contralateral to the stimulated ear. In A1, using a            throughout the experiment, it was possible to extrapolate all
micromanipulator the cortex was penetrated perpendicular to the          penetrations directions from the stained and reconstructed
surface in the ‘hot spot’ (responses with >300 µV amplitude,             tract. In PAF, histological reconstructions confirmed the correct
Kral et al., 2009) with a single-shank Neuronexus probe (16              location within this field in all animals reported.
contacts, 150 µm spacing, around 1–2 M impedance). The                     After the experiments, the animals were transcardially
probe was inserted so that the last contact just disappeared             perfused in deep anesthesia. Following thoracotomy, 0.5 ml
into the cortex (penetration depth ∼2400 µm). Since PAF                  heparin (Heparin Natrium, Ratiopharm, Ulm, Germany) was
is hidden in a sulcus, the recording electrode could not be              injected into the both ventricles. Two liters of 0.9% NaCl
inserted radially as in A1. To cover the complete PAF, we                solution and two liters of fixative (4% paraformaldehyde) and
recorded the LFP signals from two penetration depths (electrode          one liter of 10% sucrose were infused transcardially. The
tip depth at 5,000 and 2,500 µm penetration depth) using a               perfusion pressure was kept constant at 120–150 mmHg and
second Neuronexus probe with the same characteristics as the             monitored using the Perfusion One system (Leica Biosystems,
first (Figure 1). This was performed through the dorsoventral            Buffalo Grove, IL, United States). If required, the brain was
extent of this field parallel to the course of the posterior             postfixated in 4% paraformaldehyde and 10% sucrose overnight.
ectosylvian sulcus with a penetration-to-penetration distance of         For cryoprotection, each brain was placed in 30% sucrose

Frontiers in Neuroscience | www.frontiersin.org                      4                                   January 2021 | Volume 14 | Article 625721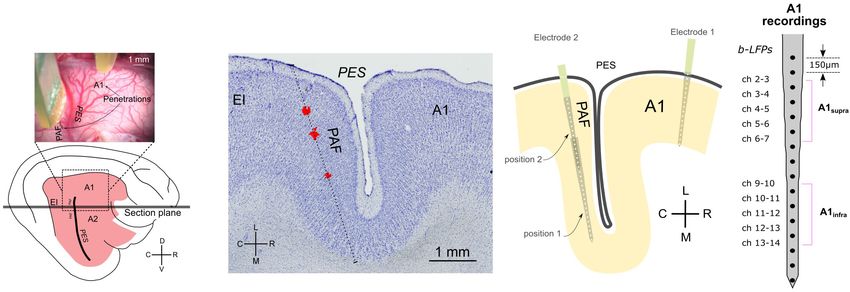
Yusuf et al.                                                                                                                        Interareal Couplings in Congenital Deafness

     FIGURE 1 | Methodology and recording positions. (A) Top: photograph of feline cortex after trephination, revealing the penetration sites in A1 and PAF. Bottom:
     illustration of entire brain from the same perspective. (B) Reconstruction of penetration of the DiI stained probe in a Nissl-stained section. The sectional plane is
     shown in (A). The stained images were stacked and aligned to reconstruct the penetration. The red deposits shown (DiI) were extracted from several successive
     florescence images from the same region of the cortex and projected onto the Nissl-stained section. The reconstructed direction of penetration is shown as a dotted
     line. (C) Schematic illustration of electrode penetrations in A1 and PAF. In PAF, dense mapping allowed capture of auditory responses in each animal. Using two
     recording depths, each penetration includes 32 recording sites in total. (D) Channels of bipolar derivation LFP (b-LFP) in A1 recordings, grouped into supragranular
     (A1supra ) and infragranular (A1infra ) layers. A1, primary auditory cortex; EI, intermediate area of the posterior ectosylvian gyrus; PAF, posterior auditory field; PES,
     posterior ectosylvian sulcus; V, ventral; D, dorsal; R, rostral; C, caudal; L, lateral; M, medial.

solution until it sank. Subsequently, the brain was blocked,                                 components by subtracting the time domain averaged signal from
frozen at −80◦ C and cut at −20◦ C using a Leica Cryostat                                    each trial, allowing the analysis of the non-phase-locked part only
CM3050S (Leica Microsystems GmbH, Wetzlar, Germany) in                                       (Donner and Siegel, 2011; Siegel et al., 2012). In the following, all
section 50 µm thick. The sections were first photographed to                                 connectivity analyses were computed from the non-phase-locked
reveal the DiI in fluorescent mode using a Keyence BZ-9000                                   signals of bipolar derivation LFPs in A1 and non-phase-locked
microscope and subsequently stained using Nissl staining and                                 unipolar LFPs in PAF.
SMI-32. For reconstruction, native fluorescence images were
combined with the same Nissl-stained sections.                                               Spectrum Analyses
    Layers in A1 were grouped into supragranular, granular and                               Hanning-tapered Fourier transformation was computed based on
infragranular based on the reconstructions of penetrations. The                              the LFP data in the prestimulus/baseline time window (−400
Nissl staining reveals the border of layer IV to layer V (Berger                             to −1 ms) and in the late-latency poststimulus time window
et al., 2017). Additionally, current source density measures                                 (200–600 ms). Frequencies from 1 to 128 Hz with 1 Hz linear
(CSDs) that show a typical sequence of middle source in layer                                increments were subsequently analyzed. Power spectra were
III and deep sink in layer V, with an initial sink followed by a                             generated by taking the absolute square of the transformation.
source in layer IV between them (Kral et al., 2006), confirm this                               Time-frequency representations (TFRs) were computed by
differentiation.                                                                             means of complex wavelet analysis (using Morlet wavelet, m = 6)
                                                                                             with 56 logarithmic frequency increments from 4 to 128 Hz, thus
Time Domain Analysis                                                                         capturing the theta (4–8 Hz), alpha (8–16 Hz), beta (16–32 Hz),
All data processing and analyses mentioned in this section                                   low-gamma (32–64 Hz), and high-gamma (64–128 Hz) frequency
were performed offline using the FieldTrip toolbox1 (Oostenveld                              bands, in an equal number of bins (Hipp et al., 2011).
et al., 2011) and custom-made MATLAB scripts (Mathworks
Inc., Aachen, Germany). Occasional noisy recordings caused by                                Functional Connectivity
unstable probe contacts, channels with artifacts and occasional                              We computed the phase coherence between A1 and PAF
trials with spindles were not included in the analyses.                                      electrodes using debiased weighted phase-lag index (Vinck et al.,
    Discrete Fourier transformation (DFT) filters at 50 and                                  2011) (WPLId) and pairwise phase consistency (Vinck et al.,
100 Hz were applied to remove power line artifacts. The detrend                              2010) (PPC). These methods are insensitive to sample size bias
(demean) procedure was applied to the LFP signals to remove                                  (WPLId) or unbiased to sample size (PPC), which fits with the
any possible DC shift in the recordings. We reduced the far-field                            availability of 30 trials in this study. The values range from zero
components in A1 by subtracting every two adjacent channels                                  (negative values due to limited sampling were corrected to zero)
within an electrode shank from each other, yielding the bipolar                              to one (maximum coherence).
derivation LFP (b-LFP) signals. We removed the transient evoked                                 As WPLId includes only the imaginary part of the cross-
                                                                                             spectrum, it is sensitive only to the true interaction between two
1
    http://www.ru.nl/fcdonders/fieldtrip/                                                    signals but not to the common reference and far-field (volume

Frontiers in Neuroscience | www.frontiersin.org                                          5                                           January 2021 | Volume 14 | Article 625721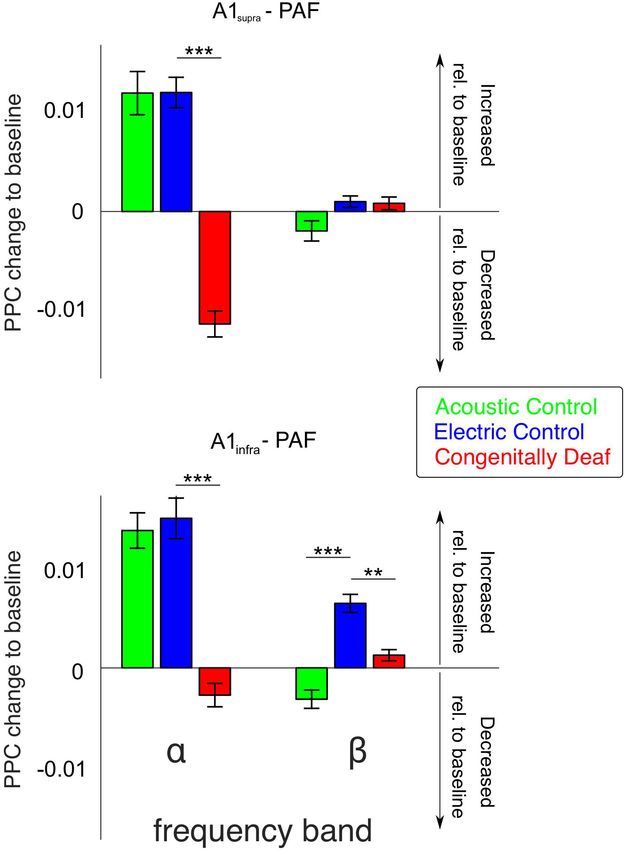
Yusuf et al.                                                                                                                  Interareal Couplings in Congenital Deafness

conduction) signals (Vinck et al., 2011). A higher signal-to-                            order for autoregressive computation (as in the parametric GC),
noise ratio is also found in comparison with other connectivity                          but has a drawback: cross-spectral density yields a smoothened
measures based on the imaginary component of the cross-                                  shape (Bastos and Schoffelen, 2016). GC values are presented as
spectrum (Phillips et al., 2014; Babapoor-Farrokhran et al., 2017).                      change to baseline, subtracting the late-latency poststimulus time
Due to its sensitivity in detecting true interaction, here WPLId                         GC with the prestimulus time GC.
was used for defining significant coupling. The WPLId value was                              Directionality (GCflow ) was computed as GCA1→PAF minus
z-score normalized to its standard deviation (Nolte et al., 2008),                       GCPAF→A1 . Consequently, positive values represent the
estimated by the applying leave-one-out jackknife procedure                              domination of bottom-up interaction (A1→PAF) while negative
(Richter et al., 2015) from the multiple observations (trials), as                       values represent the domination of top–down interaction
follows                                                                                  (PAF→A1).
                                                                                             We computed reversed-time GC to check for any false GC
                                                                                         analysis results due to the presence of correlated and uncorrelated
                                           wPLId
                          wPLIdz =                                             (1)       noise in the signal (Vinck et al., 2015). Time reversal of the
                                        std(wPLId)                                       signal prior to GC computation should consequently reverse the
   This enables phase coherence to be reliably indexed using                             domination of directionality (GCflow ). The presence of noise in
z-scores. The significantly coupled channel pairs were computed                          the signal will not change this flow domination, i.e., from a
by thresholding the couplings with maximum z-score values                                positive to a negative, or from a negative to a positive value
exceed the equivalent of p < 0.05 (Bonferroni corrected).                                (Vinck et al., 2015). Therefore, time-reversing the signal is an
Subsequently, we recomputed the functional connectivity                                  effective procedure for confirming the directionality from GC
using the PPC method, only including channel-pairs with                                  analysis. We excluded channel pairs from the grand average
significant coupling. PPC yields results proportional to true angle                      computation where the requirement for ‘flipped directionality’ in
distribution and therefore we focused on this method (WPLId                              the reversed-time GC was not satisfied.
results are available and were consistent in outcome with PPC).
   The PPC method computes the vector dot product (i.e., the                             Statistics
projection of one vector onto another) for all given trial pairs                         We compared acoustic and ECs to reveal the influence
of relative phases. The higher the phase consistency across trials,                      of stimulation mode, and ECs with CDCs to reveal the
the smaller the angular distance, and hence the higher the dot                           effect of congenital sensory deprivation. ACs could not be
products for each pair. The PPC value is defined as the average                          directly compared with CDCs due to several biasing factors:
of the dot product across all available pairs [0.5 ∗ N ∗ (N-1),                          they differed not only in developmental sensory experience
where N denotes number of trials] (Vinck et al., 2010). Unless                           but also in the mode of stimulation (acoustic vs. electric)
specifically mentioned, all PPC values are presented in change to                        and in the presence of hair cells generating spontaneous
baseline, subtracting the late-latency poststimulus time PPC with                        activity. Thus, differences would be equivocal with respect to
the prestimulus time PPC.                                                                several factors.
                                                                                             The differences between each pair of groups (CDCs vs. ECs
Effective Connectivity                                                                   and acoustic vs. electric controls) for the spectrum-based analyses
Effective connectivity was computed using the non-parametric                             were tested using the Wilcoxon rank-sum test, corrected with
GC (Dhamala et al., 2008). GC analysis is useful for quantifying                         false discovery rate procedure (Benjamini and Yekutieli, 2001).
bidirectional interaction, i.e., separately quantifying GC influence                     For the TFR-based analyses, we used non-parametric cluster-
from A1 to PAF (GCA1→PAF ) and the influence from PAF                                    based permutation statistics (Maris and Oostenveld, 2007) with
to A1 (GCPAF→A1 ). GC spectra were obtained by computing                                 1,000 random permutations under the null hypothesis (cluster
Geweke’s frequency domain GC (Geweke, 1982) and the                                      α threshold 0.5%, two-tail significant α value = 0.25%) – (i)
spectral factorization technique was used for complex cross-                             compared against zeros for significant increase and decrease
spectral density, obtained from the Fourier transformation. Non-                         in each site-pair and group and (ii) compared between groups
parametric GC is advantageous since it does not require model                            yielding pair comparison in each site-pair.

TABLE 1 | Cortical depths for each electrode of the probe in A1 over the range of deviations between 0◦ and 14o from perpendicular as observed in the
present experiments.

                            Layer border [µm]                                   Unipolar                                                      Bipolar

                                                              Channel #                  Cortical depth [µm]               Channel #                Cortical depth [µm]

Supragranular                    150–900                        2 to 7                       ∼146–900                      2–3 to 6–7                     218–825
Granular                         900–1150                          8                         1019–1050                     7–8 to 8–9                    946–1125
Infragranular                     >1150                         9 to 16                        >1164                         >9–10                         >1237

In total, we analyzed 470 sites in supragranular and 663 sites in infragranular layers of acoustic controls, 787 sites in supragranular and 711 in infragranular layers in
electric controls, and 1147 sites in supragranular and 1342 sites in infragranular layers of CDCs.

Frontiers in Neuroscience | www.frontiersin.org                                      6                                        January 2021 | Volume 14 | Article 625721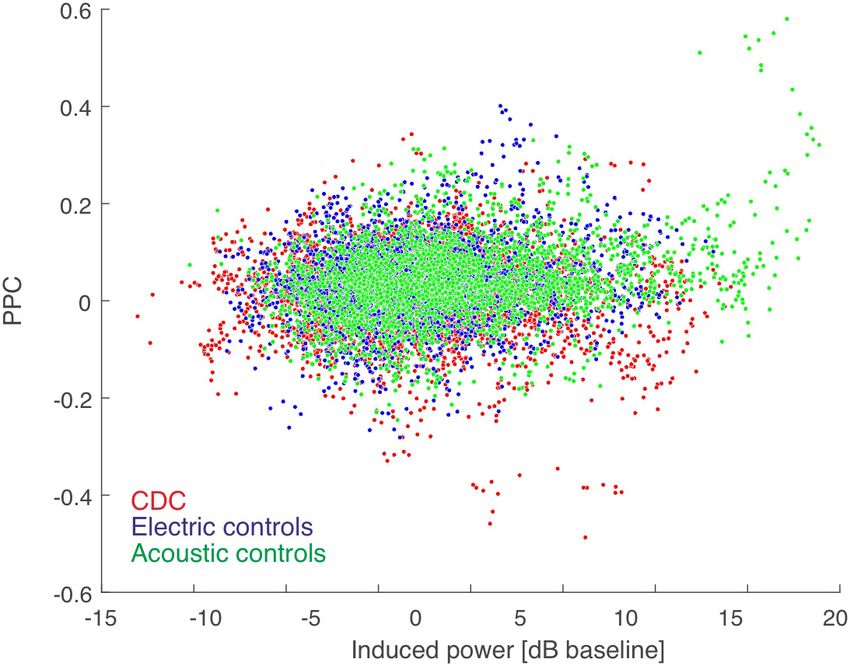
Yusuf et al. Interareal Couplings in Congenital Deafness
RESULTS sources of LFPs to individual layers, off-line signal subtraction
between neighboring channels (bipolar derivation LFP) in A1
Local field potentials (LFPs) in primary auditory cortex (A1) and was calculated (Figure 1D). We determined the cortical depth
the posterior auditory field (PAF) were recorded in the cortex of each channel and grouped them to the corresponding
contralateral to the stimulated ear. The cortex was penetrated layers within A1 (Table 1, see Berger et al., 2017). In the
perpendicularly to the cortical surface at the most responsive following, we combined A1 recordings within supragranular
area of A1 (the hot spot, same as in Tillein et al., 2010, 2016; layers and within infragranular layers (denoted as A1supra and
Yusuf et al., 2017) with a multielectrode array. Recordings in A1infra ). Layer IV in A1 was excluded from the subsequent
PAF were performed throughout the entire dorsoventral extent statistical analysis because long-range corticocortical connections
of the field parallel to the posterior ectosylvian sulcus using are not present in layer IV of A1: its inputs originate in
another multielectrode array at up to 10 penetrations in PAF of the thalamus (Mitani and Shimokouchi, 1985; Markov et al.,
each animal (Figure 1). This resulted in layer-specific recordings 2014). In PAF, due to the tangential course of penetration,
in A1 and tangential recording tracks in PAF (Figures 1B,C). precise identification of recorded layers was not possible for
To minimize the contribution of volume conduction effect on all electrode contacts. The use of unipolar signals allowed
connectivity analysis between A1 and PAF, and to localize the additionally increasing the sensitivity for coupling by capturing
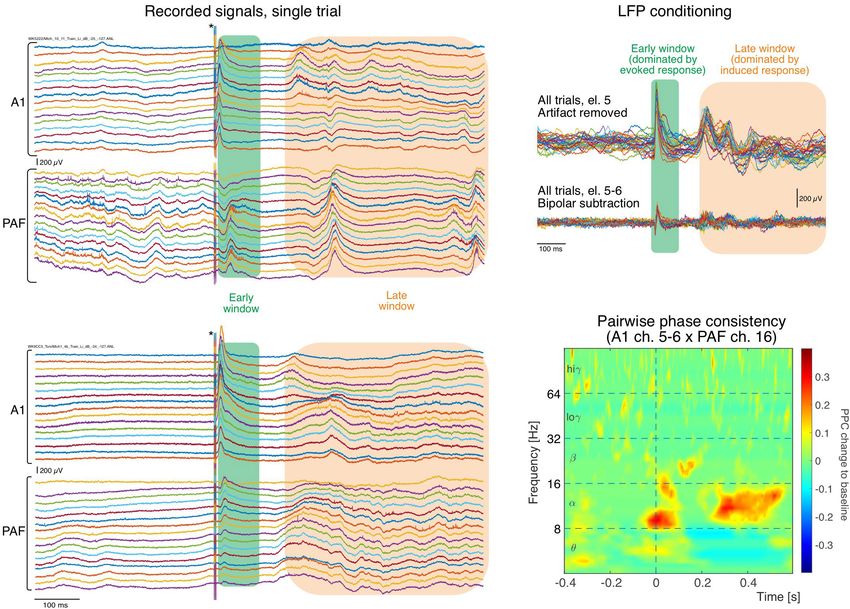
FIGURE 2 | Single raw trace LFP examples recorded simultaneously in different cortical positions (in both fields arranged from surface to deep) during stimulation.
(A) In an electric control, the electric stimulus generates a large artifact that is discernible in all recordings that lasts throughout the 6 ms of stimulus duration
(asterisk). Following the stimulus a short latency response (green rectangle) is observed in all traces of recordings, larger in A1 and smaller in PAF. Two hundred ms
after the stimulus, some increased activity can be observed that is less well synchronized to the stimulus than the early response (orange rectangle). (B) In the
congenitally deaf cats, similar activity in both windows is observed in A1 and PAF (for systematic differences, see Yusuf et al., 2017). (C) Example of trial-to-trial
variability for one electrode following stimulation artifact removal, obtained from the A1 recording shown in (A). The early window response shows higher trial-to-trial
consistency than the late response, corresponding to the previous description of an evoked response caused by thalamic input. In the late window the responses
vary between trials in latency/phase and amplitude, typical for induced responses resulting from interaction of activity caused by the stimulus with corticocortical
inputs. After bipolar derivation, far-field and common reference influences are eliminated and amplitudes decrease, but early and late responses are preserved.
(D) Example of pairwise phase consistency computed from recording pair of electrodes 5–6 (bipolar) in A1 and electrode 16 in PAF [the 32nd trace in (A)]. There is a
strong synchronization of activity in the alpha band and the late window, documenting a stimulus-related coupling of these sites.
Frontiers in Neuroscience | www.frontiersin.org 7 January 2021 | Volume 14 | Article 625721
Yusuf et al.                                                                                                      Interareal Couplings in Congenital Deafness

signals from sources not directly within the penetration in PAF.
Thus for determining the coupling we used local sources in A1
and less local sources in PAF.
    An example of the original registered activity (before artifact
elimination and bipolar derivation) at 6 dB above threshold in
both investigated fields is shown in Figure 2. In the individual
trials, both in the hearing animal (Figure 2A) and in the CDC
(Figure 2B), fast responses following the stimulus within a time
window of 200 ms termed late window here).
When a single recording contact is considered, the reduced
synchronization relative to stimulus onset in the late window
                                                                             FIGURE 3 | PPC-based connectivity is not a direct consequence of induced
becomes apparent (Figure 2C). The synchronized response,                     power (summed for the pair). Color code shown in the inset. The Spearman
predominantly observed in the early window, will be called                   correlation coefficient was very low (rho = 0.071 for acoustic controls,
evoked response and the response that is not synchronized,                   rho = 0.017 for electric controls, and rho = 0.002 for CDCs, all p < 0.05) and
predominantly observed in the late window, will be called                    thus induced power contributed minimally to the PPC result. There was no
                                                                             difference between the three groups of animals in power-PPC relation.
induced response (for previous detailed analysis, see Yusuf et al.,
2017). Using such signals pairwise phase consistency can be
computed in a frequency-specific manner (Figure 2D). The
peak PPC increases after the stimulus reached values of up to               in exact timing and frequency between the pairs, but the grand
0.4. In some recording positions, peaks in coupling were more               means reflect the most common features of the couplings and are
pronounced in the early window.                                             appropriate for robust statistical comparisons.
                                                                                We concentrated on the increases in PPC relative to baseline,
                                                                            since these reflect stimulus-related functional coupling between
Stimulus-Related Connectivity:                                              the sites. Both acoustic and electric controls, irrespective of the
Congenital Deafness Reduces                                                 recorded layer, showed an increase in coupling in beta and
Top–Down Interactions                                                       gamma bands in the early window (Figures 4A–D). Increased
We first identified individual simultaneously recorded site-pairs           coupling was also observed in the alpha band, but this finding
that showed significant couplings at any frequency (z-score                 was limited to some layer groups only. A second period of
estimation using jackknife procedure, see section “Materials and            alpha coupling appeared in the late window (asterisk, see also
Methods”), being around half of all compared electrode pairs                Figure 2), discernible in both control groups and both layer
in all three groups (ACs: 61%; ECs: 49%; CDCs: 53%). This                   groups. These coupling increases were significantly different
corresponds to the observation of similar anatomical connectivity           from zero (shown in Figures 4C,D as black lines, cluster-
between these two cortical areas between deaf and hearing cats              based permutation test, two-tail significant α = 0.25%). In both
(Barone et al., 2013; Butler et al., 2017). Only these coupled site         control groups we observed also variable desynchronizations in
pairs were used for further analysis.                                       the late window.
   Next we confirmed that our measure of functional                             Statistical analysis of the differences between the two control
connectivity, i.e., PPC, is not dependent on response strength.             groups is shown by the blue lines in Figures 4A,B (cluster-based
We compared the PPC as a function of the sum of the power of                permutation test, two-tail significant α = 0.25%). In general, the
the induced responses at the two corresponding positions in all             early connectivity as well as the late connectivity (asterisk) were
coupled pairs (Figure 3). The very small correlations show that             not different. However, smaller “islands” of desynchronization,
PPC is not dependent on induced power. This further means                   together with a beta and theta coupling in the late window, were
that the results of connectivity analysis are (as expected) not the         larger in amplitude in ACs. This observation may be related to
consequence of differences in signal power. Thus, differences               spontaneous activity from the hearing cochlea.
in signal power in CDCs compared to ECs, as observed in                         Consistently, in grand means of both acoustic and electric
a previous study (Yusuf et al., 2017), did not determine the                controls and both layer groups, there was (i) an increase in beta
coupling results of the present study.                                      and gamma coupling after the stimulus in the early window and
   Stimulus-related coupling increases were observed in both the            (ii) an increase in alpha coupling in the late window.
early and late windows in both control groups. Grand mean                       In CDCs, only the early couplings were preserved. The early
averages for all three groups investigated are shown in Figure 4.           synchronization in beta and gamma band was not different
The mean values underestimate the PPC increases observed in                 from ECs, but in contrast to ECs the early as well as late alpha
individual recording pairs (as in Figure 2D) due to differences             synchronization disappeared in CDCs (Figures 4E,F; significance

Frontiers in Neuroscience | www.frontiersin.org                         8                                         January 2021 | Volume 14 | Article 625721
Yusuf et al. Interareal Couplings in Congenital Deafness
FIGURE 4 | Grand mean averages of time-frequency-based functional connectivity between A1 and PAF computed using pairwise phase consistency (PPC).
Functional connectivity computed separately for supragranular layers in A1 (A1supra – PAF, top) and infragranular layers in A1 (A1infra – PAF, bottom) reveal onset
responses (near 0 ms) and late responses (>200 ms). Warm (yellow and red) colors represent an increase in synchronization relative to baseline, i.e., a
stimulus-related functional connection. (A,B): Acoustic controls: Regions with significant differences to electric controls are outlined with blue lines (non-parametric
cluster-based permutation statistical testing, two-tail significant α value = 0.25%). (C,D) Electric controls: Regions of significant PPC change to zero are outlined by
black lines (comparison to zero, two-tail significant α value = 0.25%), statistical differences to acoustic controls are shown in (A,B) as blue lines (non-parametric
cluster-based permutation statistical testing, cluster α threshold 0.5%, two-tail significant α value = 0.25%). Alpha band synchronization in the late window (asterisk)
is observed in both control groups consistently. (E,F) In CDCs, only onset couplings are preserved, all late (>200 ms) couplings disappeared. Regions with significant
differences to electric controls are outlined with magenta lines (non-parametric cluster-based permutation statistical testing, two-tail significant α value = 0.25%).
to ECs shown by magenta lines, cluster-based permutation test, Granger causality was used to determine the directionality
two-tail significant α = 0.25%). Thus, CDCs differed greatly of the alpha and beta A1-PAF interactions in the late window,
from the controls: a part of the early coupling as well as all late where PPC differences were found. Both A1 to PAF bottom-
coupling between A1 and PAF following an auditory stimulus in up interactions and PAF to A1 top–down interactions were
the alpha band, consistently found in both controls and all layers, quantified. Previous work has shown that alpha (van Kerkoerle
disappeared in CDCs (Figure 4E). et al., 2014; Michalareas et al., 2016) and beta (Bastos et al., 2015;
The most extensive effect of developmental experience was Michalareas et al., 2016; Richter et al., 2018) bands are associated
observed in the late window. In order to further quantify overall with stimulus-related top–down feedback between sensory areas.
effects we pooled the couplings over the entire late poststimulus In keeping with these findings, auditory stimulation induced a
time window (>200 ms) in the conventional frequency bands. prominent increase (relative to baseline) of alpha- and beta-band
The theta band, while showing mixed effects in controls and top–down GC in ACs (Figures 6A,B). Also in ECs the increase
only desynchronizations in CDCs (Figure 4) has to be treated in top–down GC was larger than the increase in bottom–up GC
with caution due to the temporal windows available (prestimulus (Figures 6A,B). Importantly, the CDCs did not show this effect,
400 ms) that are at the limit of the temporal requirements rather top–down was smaller or same as bottom–up GC, and
for this band, particularly when relative-to-baseline measures overall the GC change was small for both supragranular and
are used. Therefore it was not analyzed further. In gamma infragranular layers of A1.
bands no effects were observed in the late window. Alpha To establish the overall dominant direction of the information
coupling increased following a sensory stimulus in the late flow, we computed the difference between top–down and
window in acoustic and electric controls, whereas it decreased bottom–up GC, resulting in the Granger flow measure (Fontolan
in CDCs (Figure 5; p = 3.234 ∗ 10−17 for A1supra -PAF and et al., 2014; Babapoor-Farrokhran et al., 2017). Negative Granger
p = 1.013 ∗ 10−9 for A1infra -PAF, Wilcoxon rank-sum test). flow signifies predominantly top–down-directed interaction,
Weaker and less consistent effects were observed in the beta whereas positive Granger flow indicates predominantly bottom–
band, where particularly ACs showed the alternating periods up-directed interaction. The results demonstrate that the
of synchronization and desynchronization (Figures 4A,B), stimulus-related change in interaction was a shift toward
leading to a mean desynchronization if summed over time top–down interaction in both hearing acoustic and electric
(Figures 5A,B, green bars). group (i.e., net top–down interaction). In A1supra -PAF coupling,
Frontiers in Neuroscience | www.frontiersin.org 9 January 2021 | Volume 14 | Article 625721Yusuf et al. Interareal Couplings in Congenital Deafness
In total, these findings show that the stimulus mode is affecting
the connectivity measures. That observation demonstrates that
our methods are sensitive to changes in stimulus properties
and that functional connectivity can change if the stimulus
changes - even in the brain with same anatomic connectivity
and same membrane properties of the cortical neurons involved.
Absent developmental hearing experience (electric controls vs.
congenitally deaf cats) eliminated the stimulus-related coupling
increase in the late time window. The results demonstrate that
top–down connectivity is substantially involved in the reduced
effective connectivity observed in CDCs.
Ongoing Activity and Connectivity Reveal
Layer-Specificity of Deafness Effects
Finally, we tested whether the stimulus-related connectivity
could be a mere consequence of resting-state (i.e., ongoing)
connectivity. We analyzed ongoing extracellular LFP activities to
reveal the power-spectral activity and phase-based connectivity
in the absence of an auditory stimulus. It is of importance
to emphasize that the groups differed regarding the state of
the organ of Corti: whereas ACs had an intact cochlea, in
ECs the hair cells were destroyed by intrascalar neomycine
injection. Similarly, CDCs did not have surviving hair cells.
This is of substantial relevance, because hair cells are the
main driver of spontaneous activity in the auditory nerve,
providing a tonic drive to the auditory pathway (and auditory
cortex; see also discussion). Furthermore, trials containing
bursts of activity and spindles were eliminated from the
FIGURE 5 | Bar plots of average alpha- and beta-band functional connectivity analysis since they may confound connectivity measures (e.g.,
within the late poststimulus time window for all three groups, separately for
A1supra – PAF (A) and A1infra – PAF (B) couplings. Data shown correspond to
Valentine and Eggermont, 2001).
the change in PPC relative to baseline (baseline PPC subtracted from The LFP power spectrum revealed a level of ongoing activity
poststimulus PPC). Positive (negative) values indicate increased (decreased) significantly higher in ACs than in ECs in almost all frequency
functional connectivity relative to pre-stimulus baseline, respectively. Group bands in A1supra , A1infra , and PAF (Figures 7A–C). Since these
pairwise comparisons were computed using the two-tailed Wilcoxon
two control groups differ with regard to surviving hair cells and
rank-sum test. **P < 0.01; ***P < 0.001.
hence spontaneous activity in the auditory nerve, this outcome
suggests that, up to the level of the secondary auditory cortex,
spontaneous activity in the auditory nerve is possibly a significant
Granger flow in ACs was significantly more negative than in factor driving cortical ongoing activity.
ECs (Figure 6C, p = 1.321 ∗ 10−9 in the alpha band and The CDCs, in a part of the A1 data, exhibited significantly
p = 6.684 ∗ 10−8 in the beta band, Wilcoxon rank-sum test). higher ongoing LFP power than ECs in A1supra for the alpha- and
Granger causality showed weaker top–down connectivity beta-band (Figure 7A, p < 0.001, false discovery rate corrected
in ECs compared with ACs in all investigated layers of A1 Wilcoxon rank-sum test). This phenomenon was layer specific:
(Figures 6C,D). Additionally, PPC revealed subtle differences in it was not observed in the infragranular layers of A1 (Figure 7B,
connectivity between acoustic and electric controls (Figure 5). compare anatomical outcomes in Berger et al., 2017). It was also
We interpret these observations as a consequence of the artificial absent in PAF, where the power was in fact significantly lower in
electrical stimulus highly synchronizing the auditory nerve firing. CDCs than in ECs in the theta/alpha bands (Figure 7C, p < 0.001,
Congenitally deaf cats, on the other hand, lost the top- false discovery rate corrected Wilcoxon rank-sum test).
down flow observed in ECs in the alpha band (Figure 6C, The ongoing functional connectivity between A1 and PAF,
p = 4.642 ∗ 10−4 , Wilcoxon rank-sum test). Beta band, where quantified by the pairwise phase consistency (PPC), also revealed
also ECs showed small effects, was not significant (Figure 6C, layer-specific differences. There was higher baseline phase
p = 0.276, Wilcoxon rank-sum test). Remember, in beta band also coherence between A1supra and PAF in ACs compared with ECs
the PPC outcomes revealed minimal effects (Figure 5). In A1infra - which was significant in theta/alpha/beta bands (Figure 7D;
PAF coupling, ECs showed stronger net top–down Granger flow p < 0.001, false discovery rate corrected Wilcoxon rank-sum
in beta-band than CDCs (Figure 6D, p = 0.017, Wilcoxon rank- test). This was consistent with the higher ongoing power in
sum test) – in-line with the largest beta connectivity found in PPC ACs, but remember that PPC is power independent (comp.
in A1infra -PAF (Figure 5). Figure 3). The infragranular layers, despite higher ongoing power
Frontiers in Neuroscience | www.frontiersin.org 10 January 2021 | Volume 14 | Article 625721Yusuf et al. Interareal Couplings in Congenital Deafness
FIGURE 6 | Stimulus-related effective connectivity difference across groups. (A,B) Bar plots of alpha and beta band effective connectivity for A1supra – PAF (A) and
A1infra – PAF (B) couplings for all three groups in the late window. Bottom-up (BU) represents connectivity from A1 to PAF while top–down (TD) represents
connectivity from PAF to A1. Data shown represent Granger causality (GC) change to baseline (poststimulus GC minus baseline GC). Positive (negative) values
indicate increased (decreased) effective connectivity relative to baseline. Solid bars are bottom–up interactions, hatched bars represent top-down interactions. (C,D)
Barplots of alpha- and beta-band GC flow for A1supra – PAF (C) and A1infra – PAF (D) couplings for three groups. Data shown are GC flow change to baseline
(poststimulus GC flow minus baseline GC flow). GC flow was computed as bottom–up GC minus top–down GC; positive (negative) GC flow values represent
domination of bottom–up (top–down) connectivity. Bar plot colors: acoustic control (green), electric control (blue), and congenitally deaf (red) groups. Group pair
comparisons were computed using the two-tailed Wilcoxon rank-sum test. *P < 0.05; **P < 0.01; ***P < 0.001. (E) Illustration of bottom–up (BU) connectivity from
A1 to PAF and top–down (TD) connectivity from PAF to A1.
in ACs, had a different coupling pattern, with lower baseline This unexpected finding demonstrates that the stimulus-related
coherence between A1infra and PAF in ACs than in ECs; the desynchronization is specific to the auditory stimulus, and
effect that was most prominent in the theta band (Figure 7E; further indicates some form of brain adaptation to deafness.
p < 0.001, false discovery rate corrected Wilcoxon rank- Recordings in auditory nerve of CDCs reveal a severely reduced
sum test). to absent spontaneous activity (Hartmann et al., unpublished
In congenital deafness, the outcomes differed significantly observations; for neonatally deafened cats, see Shepherd and
from ECs particularly for supragranular layers of A1, where Javel, 1997), consequently this rules out a cochlear origin of the
CDCs had stronger ongoing coupling to PAF than ECs. difference to ECs.
Frontiers in Neuroscience | www.frontiersin.org 11 January 2021 | Volume 14 | Article 625721Yusuf et al. Interareal Couplings in Congenital Deafness FIGURE 7 | Ongoing LFP power and functional connectivity in A1 and PAF in controls and congenitally deaf cats in absence of stimulation. (A) Average LFP power spectra in supragranular A1 (A1supra ), comparison between acoustic controls with intact cochlea (ACs, green), electric controls with acutely deafened cochlea (ECs, blue), and congenitally deaf cats (CDCs, red) in absence of a stimulus. Data computed from bipolar derivation LFPs. Trials with bursting and spindles were removed before analysis (see section “Materials and Methods”). (B) Same as A for infragranular layers in A1 (A1infra ). (C) Average LFP power-spectra in PAF computed from unipolar LFPs. Note the LFP power scale difference. (D) A1supra – PAF functional connectivity in absence of stimulation, computed using pairwise phase consistency (PPC). (E) Same as D for A1infra – PAF functional connectivity. (A–E) Shaded areas represent standard errors of the mean. Statistical pairwise comparisons are shown for electric control vs. deaf (magenta line above the graph) and animals with intact cochleae vs. acutely deafened cochleae (cyan line above the graph) using the two-tailed Wilcoxon rank-sum test (false discovery rate corrected, p < 0.001). It is notable that the ongoing and stimulus-related DISCUSSION connectivity revealed different outcomes: whereas in stimulus- related connectivity, CDCs showed weakened couplings between The present study directly demonstrates reduced functional PAF and AI with no sign of synchronization increase in the and effective stimulus-related connectivity following congenital late time window (Figures 4E,F), in ongoing connectivity and deafness that is specific to the late processing window (>200 ms supragranular layers they showed a connectivity similar to post stimulus). Particularly top–down interactions were affected the ACs (Figure 7D). This dissociation demonstrates that the by congenital deafness. stimulus-related changes are not a mere consequence of ongoing In hearing cats, auditory input synchronized the activity changes. Furthermore it indicates that CDCs partly compensated between the areas early in the gamma and beta bands and the effect of absent ongoing drive from the cochlea. later (>200 ms) in the alpha and (partly) in the beta band Frontiers in Neuroscience | www.frontiersin.org 12 January 2021 | Volume 14 | Article 625721
You can also read


