The Acute Effects of Time-Varying Caloric Vestibular Stimulation as Assessed With fMRI
←
→
Page content transcription
If your browser does not render page correctly, please read the page content below
ORIGINAL RESEARCH
                                                                                                                                       published: 09 August 2021
                                                                                                                                 doi: 10.3389/fnsys.2021.648928

                                           The Acute Effects of Time-Varying
                                           Caloric Vestibular Stimulation as
                                           Assessed With fMRI
                                           Robert D. Black 1* , Ryan P. Bell 2 , Kristal M. Riska 3 , Christopher Spankovich 4 ,
                                           Richard W. Peters 1 , Christopher D. Lascola 5 and Christopher T. Whitlow 6
                                           1
                                            Scion NeuroStim, LLC, Durham, NC, United States, 2 Department of Psychiatry & Behavioral Sciences, Duke University
                                           School of Medicine, Durham, NC, United States, 3 Department of Head and Neck Surgery & Communication Sciences, Duke
                                           University School of Medicine, Durham, NC, United States, 4 Department of Otolaryngology & Head and Neck Surgery,
                                           University of Mississippi Medical Center, Jackson, MS, United States, 5 Department of Radiology and Neurobiology, Duke
                                           University School of Medicine, Durham, NC, United States, 6 Department of Radiology, Wake Forest School of Medicine,
                                           Winston-Salem, NC, United States

                                           We describe preliminary results from the application of time-varying caloric vestibular
                                           stimulation (tvCVS) to volunteers during a continuous blood oxygen level dependent
                                           (BOLD) functional MRI (fMRI) acquisition, recording baseline, during-tvCVS and post-
                                           tvCVS epochs. The modifications necessary to enable the use of this novel device in
                                           a 3-Tesla magnetic field are discussed. Independent component analysis (ICA) was
                                           used as a model-free method to highlight spatially and temporally coherent brain
                                           networks. The ICA results are consistent with tvCVS induction being mediated principally
                                           by thermoconvection in the vestibular labyrinth and not by direct thermal effects.
                                           The activation of hub networks identified by ICA is consistent with the concept of
                          Edited by:
                    Anna Wang Roe,         sensory neuromodulation, which posits that a modulatory signal introduced to a sensory
            Zhejiang University, China     organ is able to traverse the regions innervated (directly and indirectly) by that organ,
                      Reviewed by:         while being transformed so as to be “matched” to regional neuronal dynamics. The
                       Brian E. Russ,
            Independent Researcher,
                                           data suggest that regional neurovascular coupling and a systemic cerebral blood flow
       Orangeburg, NY, United States       component account for the BOLD contrast observed. The ability to modulate cerebral
                 Glenn D. R. Watson,       hemodynamics is of significant interest. The implications of these initial findings for the
             LivaNova, United States
                                           use of tvCVS therapeutically are discussed.
                *Correspondence:
                    Robert D. Black        Keywords: caloric vestibular stimulation, sensory neuromodulation, non-invasive neuromodulation device, BOLD
         rblack@scionneurostim.com         imaging, independent component analysis, vestibular system

         Received: 02 January 2021
            Accepted: 14 July 2021        INTRODUCTION
         Published: 09 August 2021
                            Citation:     Non-invasive neuromodulation devices (NIND’s) are being evaluated for use in treating
         Black RD, Bell RP, Riska KM,     neurological disease (Bain et al., 2015). A subset of NIND’s focus on stimulation of cranial
           Spankovich C, Peters RW,       nerves (Adair et al., 2020) in order to purposefully modulate an endogenous network, versus
  Lascola CD and Whitlow CT (2021)
                                          a narrowly defined target in the brain stimulated by an implanted electrode (e.g., deep brain
   The Acute Effects of Time-Varying
     Caloric Vestibular Stimulation as
                                          stimulation, DBS) or methods like transcranial magnetic stimulation (TMS) and transcranial direct
                 Assessed With fMRI.      or alternating current stimulation (tDCS, tACS) that apply currents to large areas of the brain,
   Front. Syst. Neurosci. 15:648928.      primarily in the neocortex (Danilov et al., 2015). Devices that modulate the 8th cranial nerve, the
    doi: 10.3389/fnsys.2021.648928        vestibulocochlear, are of two primary types: galvanic (GVS) and caloric (CVS). The former, GVS,

Frontiers in Systems Neuroscience | www.frontiersin.org                         1                                        August 2021 | Volume 15 | Article 648928
Black et al.                                                                                                Time-Varying Caloric Vestibular Stimulation

has been used in numerous research studies (Fitzpatrick and                 Hemodynamic Oscillations—Integral to
Day, 2004 and references therein). It is generally accomplished             Brain Function
by applying direct or alternating current to the electrodes placed
                                                                            Cerebral autoregulation is well-studied and is recognized as being
on the mastoid bones behind the ears. This creates a voltage
                                                                            fundamental for maintaining dynamic brain function (McHenry
bias between the right and left side vestibular organs. The latter,
                                                                            et al., 1974; Strandgaard and Paulson, 1984; Giller, 1990; Flammer
caloric vestibular stimulation, is best known as a diagnostic
                                                                            and Mozaffarieh, 2008; Reinhard et al., 2008; Greene and
method used in balance clinics (Fitzgerald and Hallpike, 1942).
                                                                            Lee, 2012; Horsfield et al., 2013). Unsurprisingly, dysfunction
CVS involves irrigating the external auditory canal with water
                                                                            of cerebral autoregulation has been noted in patients with
or air, above or below body temperature. The thermal gradient
                                                                            neurological disease (Czosnyka et al., 2001; Eames et al., 2002;
leads to altered firing rates of the vestibular hair cells. Recently,
                                                                            Haubrich et al., 2003; Claassen and Zhang, 2011; Gommer et al.,
a device that delivers time-varying CVS (tvCVS) has been
                                                                            2012; Medow et al., 2014; Shekhar et al., 2017), but not necessarily
developed to explore the potential of this form of cranial nerve
                                                                            as a consequence of normal aging (Carey et al., 2000). Cerebral
neuromodulation for therapeutic purposes (Black et al., 2016).
                                                                            autoregulation is a dynamic phenomenon and encompasses a
Time variation of the thermal stimulus avoids adaptation to the
                                                                            range of processes, including so-called B wave oscillations and
stimulus that will occur with a constant temperature stimulus
                                                                            neurovascular coupling (NVC), as described below.
and is crucial for delivering CVS over extended periods of
                                                                                Time-varying caloric vestibular stimulation was shown, using
time. Controlling the time-rate-of-change of temperature also
                                                                            transcranial Doppler sonography, to be capable of inducing
mitigates side effects that can be produced by rapid changes in
                                                                            oscillations in pulsatility index and CBFv in the so-called B wave
temperature during diagnostic CVS procedures.
                                                                            frequency range, which is broadly defined at 0.5–3.0 cycles per
   Our central aim is to provide preliminary, proof-of-concept
                                                                            minute or 0.008–0.05 Hz (Lundberg, 1960). B waves may play
results from a study evaluating acute effects of tvCVS as measured
                                                                            an important role in dynamic autoregulation (Lemaire et al.,
with BOLD (blood oxygen level dependent) functional MRI
                                                                            2002), representing a characteristic frequency range relevant to
(fMRI). This work was motivated by the observation of the
                                                                            successful homeostatic control and illustrating the relevance of
induction of cerebral blood flow velocity (CBFv) oscillations with
                                                                            hemodynamic oscillations in achieving such control. Previously,
tvCVS in prior work (Black et al., 2016). That earlier study was
                                                                            the effects of vestibular stimulation on CBFv have been reported.
based on the insonation of the basilar artery and therefore did
                                                                            Constant temperature CVS (Tiecks et al., 1996; Heckmann et al.,
not provide any details on which brain regions were modulated.
                                                                            1999) was found to alter (reduce or increase) CBFv in major
By running a continuous (40-min long) BOLD scan we were able
                                                                            cerebral arteries. Oscillations in CBFv were not induced, however,
to gather data during a baseline period, during the time tvCVS
                                                                            because the application of constant temperature CVS creates
was being delivered and for a period after the device was turned
                                                                            a unidirectional change in flow rate. Serrador et al. (2009)
off again. The organization of this report is as follows: (1) We
                                                                            invoked vestibular responses by moving subjects with a high-
start with a review of cerebral autoregulation and spontaneous
                                                                            torque hydraulic-powered tilt chair and observed corresponding
flow oscillations in order to provide context for the observation
                                                                            oscillations in CBFv (middle cerebral artery) and blood pressure
of low frequency CBFv oscillations induced by tvCVS. (2) Next
                                                                            (BP). The tilt chair was actuated in a frequency range between
we provide a short overview of the study of spontaneous low
                                                                            0.03125 and 0.5 Hz. The CBFv and BP changes seemed to
frequency oscillations in BOLD imaging. (3) We then describe
                                                                            have been induced with little or no time lag once the chair
the means by which the tvCVS device was integrated into the
                                                                            started moving. The authors proposed two pathways from the
MRI environment and discuss the particular image analysis
                                                                            vestibular nuclei to effects on cerebral vessels. The first pathway
methods used. (4) We discuss how induced tvCVS effects seem
                                                                            was through the nucleus tractus solitarius. The second was via
to propagate through the vestibular system in a way that is
                                                                            the fastigial nucleus in the cerebellum, which is a pathway
consistent with the concept of sensory neuromodulation (Black
                                                                            studied by Reis et al. (1991). [It is worth noting that Reis
and Rogers, 2020) and how that model might explain clinical
                                                                            and collaborators extensively researched electrical stimulation of
tvCVS study data. (5) Finally, we talk about how the results from
                                                                            the fastigial nucleus as a means of providing neuroprotection
this exploratory study might inform future work.
                                                                            (Glickstein et al., 2003; Zhou et al., 2005; Golanov et al., 2017)].
                                                                            Cohen et al. (2011) used sinusoidal GVS to induce vasovagal
BACKGROUND                                                                  responses in a rat model. The authors measured sinusoidal heart
                                                                            rate and BP changes resulting from the application of sinusoidal
It is important to highlight a finding that has been reported               GVS over a frequency range of 0.008–0.5 Hz, thus very similar
in multiple studies involving vestibular stimulation: cyclic                to the range used by Serrador et al. (2009). GVS is thought
modulation of systemic and cerebral blood flow. The creation                to act primarily via irregular afferents (Goldberg et al., 1984),
of CBFv oscillations by tvCVS, as described below, may be                   which constitute roughly 25% of the total population (regular
important in explaining clinical results that have been reported            afferents comprising the balance). CVS, by comparison, is capable
using this method. Additionally, it is important to review past             of stimulating both regular and irregular afferents.
fMRI studies that characterize cerebral blood flow changes,                     Taken together, these results show that time-varying vestibular
oscillatory behavior in particular, so that the effects of tvCVS on         stimulation in the B wave frequency range can result in induced
flow can be put into context.                                               oscillations in hemodynamic variables, including CBFv. We have

Frontiers in Systems Neuroscience | www.frontiersin.org                 2                                    August 2021 | Volume 15 | Article 648928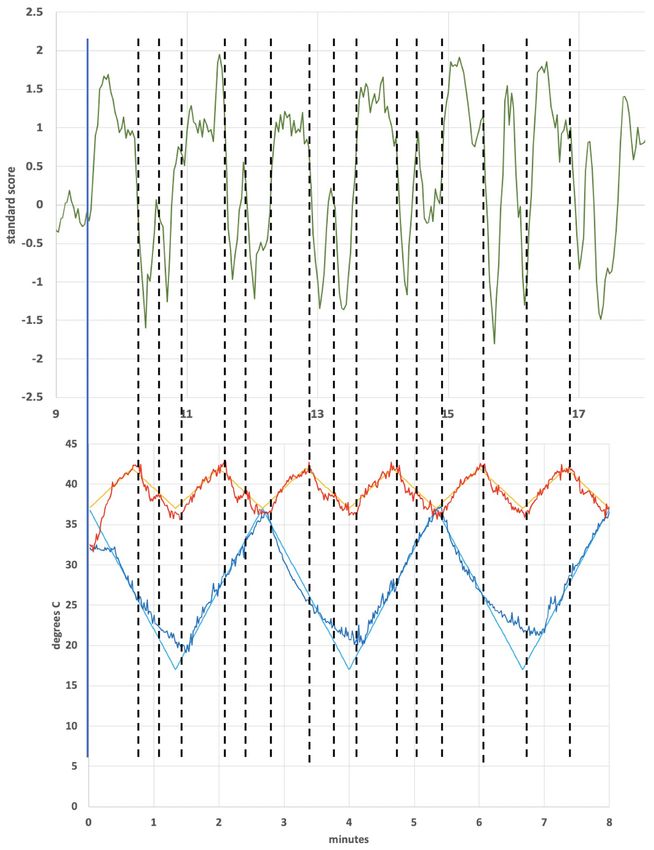
Black et al. Time-Varying Caloric Vestibular Stimulation
consciously emphasized the range of frequencies covered by fMRI study, delivering tvCVS to four volunteers during a
the “B wave” definition in part because that term does not continuous BOLD acquisition.
typically appear in imaging studies of slow wave oscillations in
neuronal activity in the brain. Our goal is to argue that systemic
blood flow oscillations and oscillations in neural network activity MATERIALS AND METHODS
need to be considered in concert since even if they arise from
independent mechanisms, overlaps in frequency can lead to tvCVS Used With MRI
mutual interactions (oscillatory coupling). For example, cerebral A closed-cycle CVS device, using circulating water at a constant
autoregulation, generally viewed as a systemic process, ensures temperature, has previously been developed for MRI studies
that NVC, a localized process, can function properly (Azevedo (Frank and Greenlee, 2014). However, for the current study, it
et al., 2007; Fritzsch et al., 2010). was important to use the same time-varying CVS method that has
been used in clinical trials of migraine headache (Wilkinson et al.,
Slow BOLD Oscillations 2017) and Parkinson’s disease (Wilkinson et al., 2019). A standard
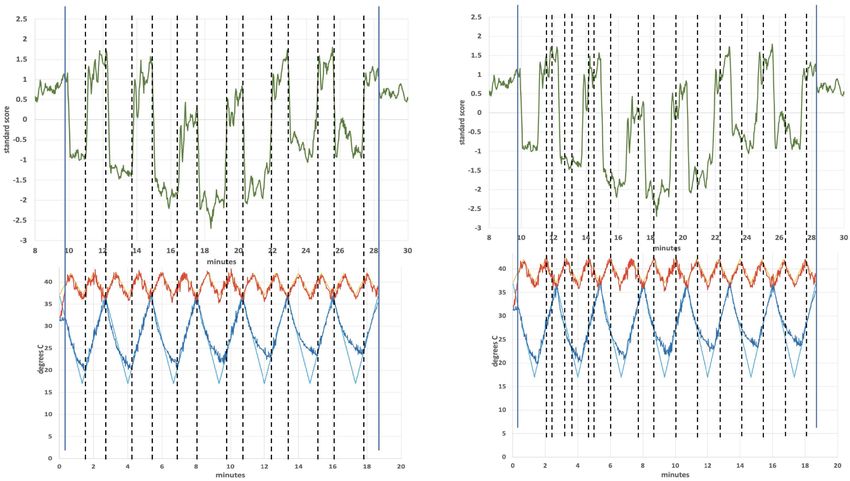
Slow oscillations in BOLD signal have been observed in resting device headset (Figure 1) has ferrous metallic hardware and
state fMRI studies and understanding their origins is an ongoing cooling fans, making it unsuitable for use in a strong magnetic
area of research. Studies of the default mode network are typically field. To accommodate the tvCVS device to an MRI setting it
focused on the frequency range ∼0.01–0.1 Hz (Zuo et al., 2010; Lv was modified to remove ferromagnetic components and reduce
et al., 2018). Changes in resting state functional connectivity, the eddy currents generated by the aluminum heat sink, the largest
term given to measurements of temporal correlations within this remaining metallic element. Initial tests showed significant image
frequency range, have proven to be a productive tool in analyzing artifacts created by the heat sinks and so cuts were made from the
changes in the default mode network as a function of neurological edges of the heat sink to the center (Figure 1B) in order to shrink
disease (see Raichle et al., 2001; Raichle, 2015). Recently Tong the diameter of induced eddy currents that create susceptibility
et al. (2019) analyzed contributions to BOLD oscillations in the artifacts. Other components of this modified device that are
∼0.01–0.15 Hz range and provided evidence that in addition subjected to the magnetic field are the aluminum earpiece,
to a signal component generated by neuronal activity via NVC, a Peltier thermoelectric cooler and a thermistor (temperature
there was a systemic component due to blood flow changes varying resistor). These components are secured together into
responsible for at least 30% of the signal seen in gray matter. one assembly with thermally conductive epoxy. This assembly is
Tong et al. (2019) refer to this as a non-neuronal signal when, referred to as the thermal stack. In a standard headset, the thermal
more particularly, they mean a signal that was not caused by stack also consists of a printed circuit board that controls the
regional NVC (ultimately, the flow changes will of course have a current to the Peltier device and monitors the resistance of the
central and/or peripheral neuronal interface). The systemic signal thermistor. On the modified device, a cable 25 feet in length was
component was found, as expected, to have a phase lag between used to connect the thermal stack to the printed circuit board,
anatomically separate regions due to the finite speed of the flow allowing the device electronics to be positioned outside the MRI
changes (Murphy et al., 2013; Aso et al., 2017). Proposals for scanner room. The individual conductors in the cable are coaxial
the origins of NVC-mediated slow oscillations include alterations with a signal wire surrounded by a braided shield to reduce noise
in autonomic tone, fluctuations in the partial pressure of CO2 , induced into the signal wires by time-varying magnetic fields.
blood pressure regulation, vasomotor oscillations, low frequency To further reduce noise that could potentially be induced into
“neuronal waves,” and gastric motility (Tong et al., 2019; Drew the signal wires of the cable, low pass filters were added to the
et al., 2020). signal inputs on the printed circuit board. Additionally, transient
Are the slow frequency oscillations reported in BOLD resting- voltage suppressors were added to each signal input to protect
state studies related to slow oscillations in CBFv? Whittaker electronic circuits from voltage spikes induced into the cable by
et al. (2019) consider the possible links between dynamic cerebral the magnetic field gradients. The amount of noise introduced into
autoregulation and low frequency oscillations in resting-state the cable by the magnetic field gradients of the MRI scanner was
fMRI. At this time, it’s not possible to provide a detailed measured during initial testing to confirm the cable shielding,
answer about causality and mechanistic origins of all of the input filtering and voltage suppression limited the size of induced
different neuronal and hemodynamic processes that have been noise. A rubber baffle (Figure 1D) was added to reduce the
discussed as giving rise to low frequency oscillations. However, as amount of scanner noise experienced by the subjects. The tvCVS
previously stated, even if oscillations arise from different origins, devices were held in place on subjects’ heads by an elastic cloth
they can interact due to the overlap of their frequency ranges band (Figure 1E) prior to the insertion of the subject’s head
(Buzsáki, 2006; Gohel and Biswal, 2015; Black and Rogers, 2020). into a head coil.
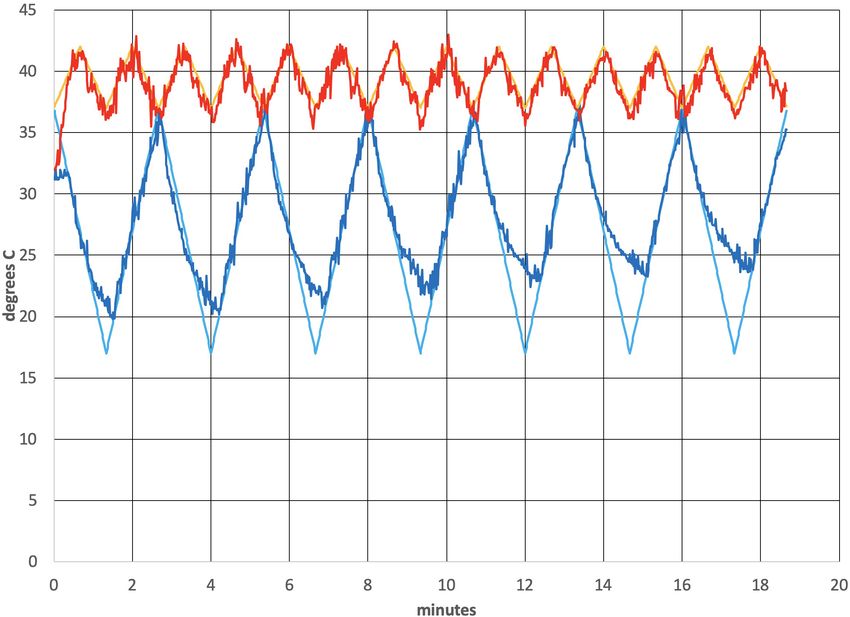
For example, a non-local CBFv oscillatory process will interact Figure 2 shows the thermal waveforms measured during an
with a regional NVC-driven oscillatory process since both affect actual run. Two simultaneous thermal waveforms were delivered:
flow and blood vessel compliance concurrently. In this regard, a cold triangular pattern that went from 37 to 17 ◦ C with a
they should not be viewed as truly independent processes since period of 2.67 min and a warm triangular pattern that went
their effects can feed back on each other. from 37 to 42◦ C with a period of 1.33 min (exactly 1/2 of the
To see how previously observed oscillations in CBFv might be cold period). Thermistors in the earpieces measure the actual
manifested in an imaging context, we performed a preliminary temperature and those data are overlaid on the target temperature
Frontiers in Systems Neuroscience | www.frontiersin.org 3 August 2021 | Volume 15 | Article 648928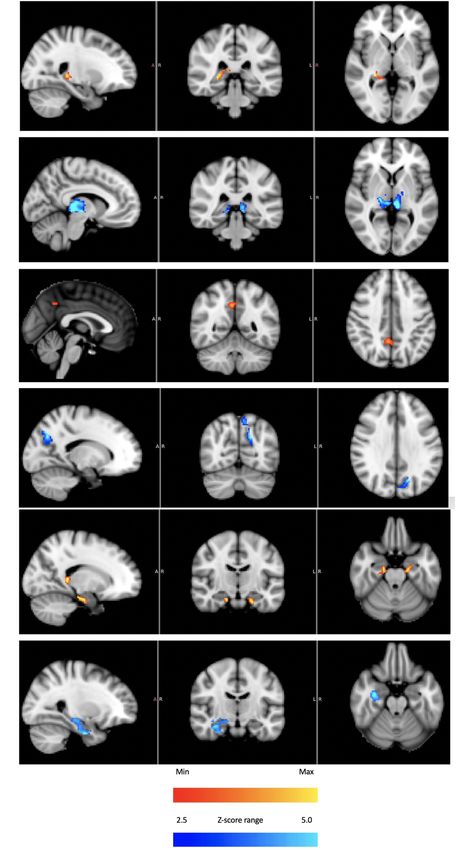
Black et al.                                                                                                               Time-Varying Caloric Vestibular Stimulation

  FIGURE 1 | (A) A tvCVS device (Scion NeuroStim, Durham, NC); (B) The earpiece/Peltier device/heat sink thermal stack; (C) Side view of the thermal stack; (D) A
  baffle used to reduce acoustic noise during the BOLD scan; (E) A schematic showing the environment of the imaging runs.

values. There is some noise evident in the tracking of actual                         All subjects were right-handed. The acquisition sequence is listed
temperature to the target values. It is also apparent that as the                     in Figure 3. No adverse events were reported by the subjects. Each
run progressed, the ability of the cold waveform to reach 17◦ C,                      subject was imaged once.
the target value (smooth blue line in Figure 2), was reduced.                             Data were acquired on a 3.0T Siemens Skyra whole-body
The mismatch is due to a rise in the heat sink temperature,                           scanner using a 32 channel, 9-inch diameter head coil. High-
which is exacerbated by the removal of the cooling fans that are                      resolution T1-weighted (T1w) images were recorded using
normally present and by the elevated temperature in the bore of                       MPRAGE-GRAPPA2 sequence [repetition time (TR) = 2,300 ms,
the magnet. This particular waveform combination was chosen                           echo time (TE) = 3 ms, field of view (FOV) = 240 × 256,
to be consistent with previous clinical studies using the tvCVS                       240 × 240 matrix, 9◦ flip angle, interleaved slices of 1mm
device (Wilkinson et al., 2017, 2019).                                                thickness, 192 slices]. Whole-brain BOLD images were collected
                                                                                      using T2∗ -weighted echo-planar imaging with the following
Subjects and Image Acquisition                                                        parameters: TR = 2,000 ms; in-plane matrix size = 96 × 104;
A study protocol entitled “BOLD fMRI Study of Cerebral Blood                          slice thickness = 2 mm; FOV = 864 × 936, voxel size of
Flow Patterns Associated with the Induction of Time-Varying                           2 mm × 2 mm × 2 mm, TE = 30 ms, flip angle = 52◦ , 72 slices.
Caloric Vestibular Stimulation” was approved by the Wake                                  Independent component analysis (ICA) was used to enable
Forest Baptist Medical Center Independent Review Board (IRB                           a model-free exploration of the BOLD data (Beckmann and
00055459). Four volunteer subjects provided informed consent.                         Smith, 2004). ICA identified brain networks that exhibited both

Frontiers in Systems Neuroscience | www.frontiersin.org                           4                                         August 2021 | Volume 15 | Article 648928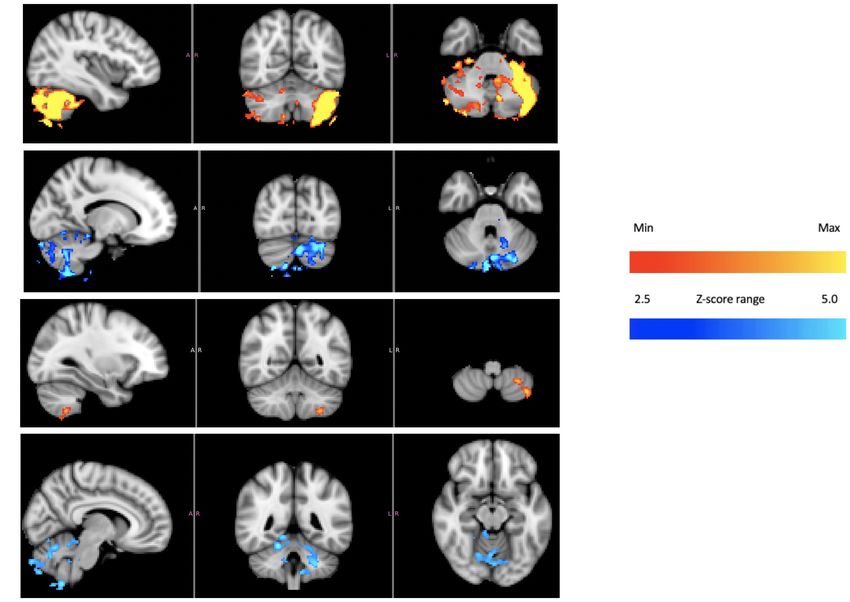
Black et al.                                                                                                                   Time-Varying Caloric Vestibular Stimulation

  FIGURE 2 | Temperature profile from an actual run (subject 4). All subjects had L-ear cold stimulation. The smooth lines are the target temperature profiles.

  FIGURE 3 | The sequence of events during the BOLD runs.

spatial and temporal coherence and provided the principal                               the mean value. Y-values above the mean have positive standard
framework for our analyses. It is important to note that not                            scores, while those below the mean have negative standard
all regions or all subjects generated the spatial and temporal                          scores. Conceptually, the y-axis values represent BOLD signal
signal coherence needed to be identified using ICA, but this                            magnitude. The results of the ICA analysis were then used to
does not necessarily mean that BOLD contrast resulting from                             inform follow-up analyses. After conducting the ICA analyses, we
time-varying CVS induction was absent. That is, incoherent                              were interested in how multimodal processing regions responded
BOLD signals would not be identified by ICA. We found it to                             to tvCVS. BOLD images using anatomic masks were created for
be easier to present an unbiased report on these preliminary                            the cerebellum, hippocampus, thalamus and precuneous. Finally,
data by focusing first on model-free ICA networks. We specified                         we investigated neural activation in a frontoparietal network
that 30 independent components should be selected, ensuring                             during the baseline, device-active and device-off time periods
that each subject would have the same number of components.                             so as to better understand how tvCVS influences higher-order
This number of components has commonly been utilized for                                neural activation.
analyses utilizing Multivariate Exploratory Linear Optimized
Decomposition into Independent Components (MELODIC).
ICA traces in the Results section follow the baseline, tvCVS                            RESULTS
induction and post-tvCVS periods. The y-axis of the ICA plots
shows the standard score (also called z-value), which is the                            Figure 4 is an ICA response from subject 4, identified as
number of standard deviations by which a value is above or below                        originating from the cerebellum. The Harvard-Oxford cortical

Frontiers in Systems Neuroscience | www.frontiersin.org                             5                                           August 2021 | Volume 15 | Article 648928
Black et al.                                                                                                                 Time-Varying Caloric Vestibular Stimulation

  FIGURE 4 | (A) Cerebellar independent component, subject 4, overlaid with the thermal waveforms. The dotted lines are drawn to match features in the cold
  waveform to the ICA trace. For example, the two leftmost dotted lines are aligned with the first low point of the cold waveform and the subsequent high point. Those
  dotted lines align with the transitions between plateaus and troughs in the ICA trace; (B) Cerebellar independent component, subject 4, highlighting the warm
  waveform. The dotted lines match features in the warm waveform to the ICA trace, suggesting that the warm waveform may cause additional structure in the
  plateaus and troughs, even though the cold waveform creates the dominant effect on the ICA trace.

and subcortical structural atlas (part of the FSL software package                     and cold CVS decreases the firing rate. Therefore, plateaus
used for analyses) was utilized to identify neuroanatomical                            correspond to faster firing (warming) and troughs correspond
regions within the functional connectivity networks. Specifically,                     to slower firing (cooling). The plateaus and troughs of the
the functional connectivity networks were visualized using                             cerebellar independent component square wave pattern have
FSLview and the Harvard-Oxford cortical and subcortical                                additional features suggesting a possible perturbation, perhaps
structural atlas was used to pinpoint neuroanatomical regions                          due to the warm waveform (applied simultaneously to the right
with a minimum probability of 90%. The subject’s corresponding                         ear). Figure 4B shows dotted lines connecting features in the
time-varying CVS waveform is superimposed, highlighting the                            warm waveform to corresponding features in the cerebellar
cold pattern (applied to the left ear) in Figure 4A. The relative                      independent component. As in Figure 4A, alignment of the two
starting times for the ICA response and the thermal waveforms                          traces was accomplished by stretching the ICA trace to provide
can’t be known precisely. We drew dotted lines corresponding                           the best overlap with its features. There appears to be alignment
to the high and low temperature values (again, for the cold                            between the features of the warm waveform where a slope change
waveform in Figure 4A) and then stretched the ICA trace to                             occurs and points of inflection in the independent component
provide the best overlap with its features. That all of the dotted                     trace. We are not able to prove that there is a causal correlation
lines match thermal waveform features to ICA features so well                          between the slope changes in the warm waveform and inflection
suggests a stimulus-response relationship. As the run progresses,                      points in the ICA trace, however, a hypothesis for the correlation
the width (time) of the cooling phase of the waveform lengthens                        is presented in the section “Discussion.”
and the warming phase shortens. This developing asymmetry as                               Based on the square-wave appearance of the ICA time series,
the run progresses is reflected in the ICA pattern. In the section                     we decided to explicitly model the plateau periods and the
“Discussion” we will present a hypothesis as to why the triangular                     trough periods during the device-on condition to further explore
thermal stimulus pattern results in a square wave ICA response.                        cerebellar activation in subject 4 using a block design (see
    The plateaus (relatively flat regions in Figure 4 with higher                      Supplementary Material). We also modeled the plateaus and
y-axis values) and troughs (relatively flat regions in Figure 4                        troughs of the square wave in the other three subjects to see if
with lower y-axis values) represent higher and lower, respectively,                    similar neural activations were present in the cerebellum. Subject
BOLD intensity, which is proportional to neuronal firing rate                          4 had an exceptionally strong cerebellar ICA response and our
(firing rate of the vestibular hair cells). As described in the                        goal was to assess whether the other subjects had consistent, albeit
Discussion section, warm CVS increases hair cell firing rate                           smaller, responses. Specifically, we utilized an anatomic mask

Frontiers in Systems Neuroscience | www.frontiersin.org                            6                                          August 2021 | Volume 15 | Article 648928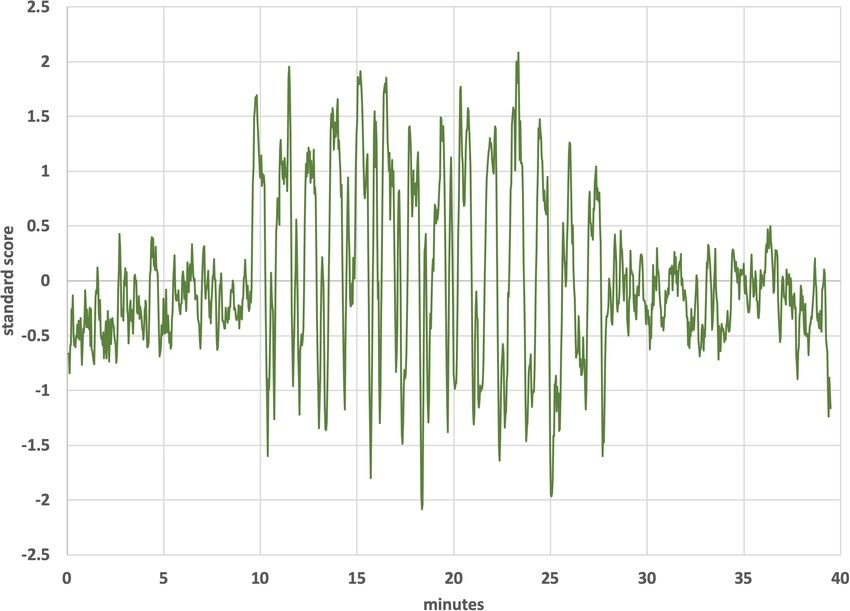
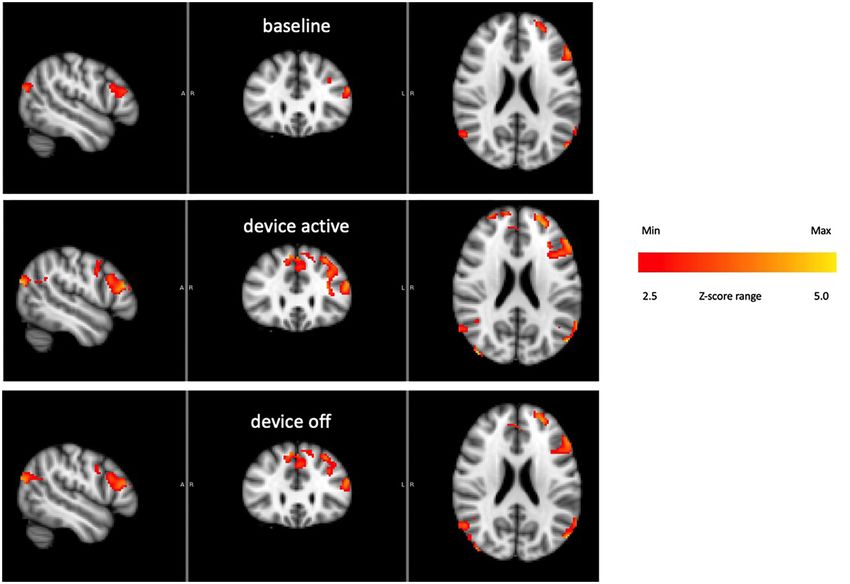
Black et al.                                                                                                              Time-Varying Caloric Vestibular Stimulation

  FIGURE 5 | Cerebellum of subject 4 [(A) plateaus dominant, (B) troughs dominant]; cerebellum of subjects 1–3 averaged together [(C) plateaus dominant, (D)
  troughs dominant]. The color bars show relative z-score values. The orange/red and blue/aqua color bars are not related to each other.

of the cerebellum and performed a block experimental design                          subject 4, the period of which was dominated by the cold
procedure, average across the other three subjects.                                  waveform period, the period the independent component from
   Figure 5 shows BOLD intensity images reconstructed to                             the operculum of subject 1 is dominated by the warm waveform
emphasize the contrast for subject 4 due to the plateaus dominant                    period. Figure 7 shows the alignment of features in the warm
(Figure 5A) and troughs dominant (Figure 5B), individually,                          waveform with corresponding features in the independent
based on the square wave pattern seen in Figure 4 (from the ICA                      component. The low and high temperature points in the warm
analysis). Different regions in the cerebellum respond to reduced                    waveform correspond to sharp vertical edges in the independent
hair cell firing rate, troughs dominant, and increased firing rate,                  component, as before with subject 4. But it also appears that
plateaus dominant (Supplementary Material). As noted, the                            features in the warm waveform that appear due to imprecise
other three subjects did not show a similarly large signal-to-noise                  tracking control give rise to smaller plateaus in the independent
ICA response in the cerebellum and it is not wholly clear why                        component. We present a hypothesis that may explain this
subject 4 was a “super responder” (see section “Discussion”).                        behavior in the section “Discussion.”
However, using the fit to the ICA pattern from subject 4 to model                        To understand better how multimodal processing regions
the BOLD image data from subjects 1–3 produced Figures 5C,D.                         may have responded during the plateau and trough periods,
The images from subject 4 alone and the averaged images from                         we examined activation in known hub regions including the
subjects 1–3 display a qualitatively similar pattern, in particular                  thalamus, hippocampus and precuneous. This was accomplished
BOLD intensity lateralized to the left posterior cerebellum for                      by utilizing anatomic masks of these regions and performing a
the plateaus dominant state and a less lateralized, more central                     block experimental design, averaging across subjects. Finally, we
intensity pattern for the troughs dominant state.                                    identified the ICA of a frontoparietal network and modeled the
   Figure 6 shows an independent component from subject 1                            baseline, device-on and device-off time periods to examine the
that lies in the operculum. The operculum is a multimodal                            character of neural activation, averaging across all subjects.
processing region and so would be more closely identified                                Figure 8 provides initial evidence consistent with modulation
with second-order sensory processing. It also encompasses the                        of structures that process vestibular sensory input. Using subject 4
parieto-insular vestibular cortex (Frank and Greenlee, 2018).                        as an exemplar, BOLD responses from the thalamus, precuneous
Unlike the case for the cerebellar independent component of                          and hippocampus are shown. In all cases, plateaus dominant

Frontiers in Systems Neuroscience | www.frontiersin.org                          7                                         August 2021 | Volume 15 | Article 648928
Black et al.                                                                                                         Time-Varying Caloric Vestibular Stimulation

  FIGURE 6 | Independent component from operculum of subject 1. The trace was smoothed by averaging each point with 4 nearest neighbors.

and troughs dominant images are included. Subjects 1–3 had                        amount of variance from the overall BOLD signal. The ICA
corresponding responses, but as in the case of the cerebellar IC,                 analysis splits the data into separate components, which are
these subjects did not have the highly coherent BOLD intensity                    then assigned variance percentages, which describe the amount
recorded in subject 4.                                                            of variance of the original spatio-temporal maps. Specifically,
   Figure 9 shows the BOLD response identified by a block                         this component accounted for 6.12% of explained variance
design in a frontoparietal network (averaging all subjects).                      (discrepancy between a model and actual data).
Notice that the signal persists after tvCVS stimulation stops.                        We also directly measured the electrical current output of
This is unlike the previous independent components presented                      the tvCVS device as it advanced through the generation of cold
where the strongest modulation was seen during the device-                        and warm waveforms to rule out artifacts. The temperature
active period. As can be seen in Figure 10, the frontoparietal                    controller uses a pulse-width-modulation scheme that switches
independent component showed a buildup in intensity and a                         at 1.3 kHz. The polarity of the current supplied to the Peltier
shift in spectral character that was delayed past the start of the                devices (one on each side of the headset) switches in order to keep
device-active period and persisted through the device-off period.                 the actual temperature matched to the target values. The current
                                                                                  patterns switched many times during each temperature cycle.
Assessment of Potential Artifacts                                                 Therefore, the pattern of the current output, and the magnetic
As part of the preprocessing pipeline for the BOLD data, a non-                   field it would generate, cannot explain the square wave shape of
aggressive ICA-based Automatic Removal of Motion Artifacts                        Figure 4, for example.
(AROMA) was used to denoise the data (Pruim et al., 2015). This
efficient software is very effective in estimating and eliminating
artifactual data that may be caused by movements. We also                         DISCUSSION AND CONCLUSION
utilized MELODIC v3.0 for the ICA analysis. This software
decomposes the data into separate functional network and                          There have been previous imaging studies involving irrigation-
artifact components. One of us (RPB) has extensive experience                     based CVS (Karnath and Dieterich, 2006; Dieterich and Brandt,
using this methodology and was able to visually assess the                        2008; Lopez et al., 2012) and Klingner et al. (2013) used ICA
components and classify them as either functional networks or                     to identify multiple networks that were affected by CVS. Time-
artifacts. The components listed in the manuscript did not have                   varying CVS is fundamentally different from fixed temperature
any classical signatures associated with scanner or biologically                  irrigations that are used diagnostically and that have been used
produced artifacts. Each component is associated with some                        in most previous CVS studies. For example, as discussed above,

Frontiers in Systems Neuroscience | www.frontiersin.org                       8                                       August 2021 | Volume 15 | Article 648928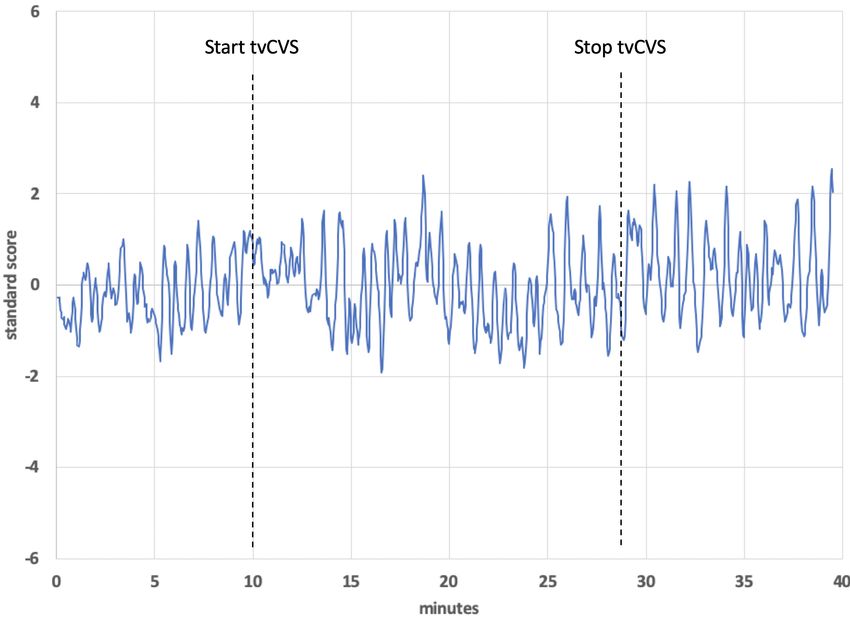
Black et al.                                                                                                                   Time-Varying Caloric Vestibular Stimulation

  FIGURE 7 | Subject 1 warm waveform (first 6 cycles) and independent component localized in the operculum. The dotted lines match features in the warm
  waveform to the ICA trace. For example, the leftmost and third-from-left dotted line align with a high point on the warm waveform and a low point, respectively.
  These lines align with a trough in the ICA trace. The second-from-left dotted line was added to highlight a small, retrograde feature in the warm waveform that aligns
  with a peaked feature in the ICA.

Frontiers in Systems Neuroscience | www.frontiersin.org                             9                                           August 2021 | Volume 15 | Article 648928
Black et al.                                                                                                              Time-Varying Caloric Vestibular Stimulation

  FIGURE 8 | For subject 4: thalamus [(A) plateaus dominant, (B) troughs dominant]; precuneus [(C) plateaus dominant, (D) troughs dominant]; hippocampus [(E)
  plateaus dominant, (F) troughs dominant]. The color bars show relative z-score values. The orange/red and blue/aqua color bars are not related to each other.

Frontiers in Systems Neuroscience | www.frontiersin.org                          10                                        August 2021 | Volume 15 | Article 648928
Black et al. Time-Varying Caloric Vestibular Stimulation
FIGURE 9 | Frontoparietal network activity over the three phases of the BOLD run (all subjects). The color bar show relative z-score values.
tvCVS showed evidence for the induction of CBFv oscillations, buoyant and moves the cupula from its equilibrium position,
whereas constant temperature CVS did not induce oscillations. resulting in an increased firing rate of hair cells above their
tvCVS is able to maintain consistent activity over time, unlike equilibrium rate (of about 100 Hz). Cold CVS has the opposite
fixed temperature CVS that shows a decay in induced effects effect, leading to a decreased firing rate. How accurately and
after a few minutes (Bock et al., 1979). The present work was completely the thermoconvection model describes the action
motivated by a desire to understand how tvCVS might be enacted of CVS has been debated and limited data from astronauts
in an MRI environment and to produce preliminary BOLD data (Scherer and Clarke, 1985) seemed to demonstrate that the CVS
showing the effects of tvCVS on the brain so as to inform future phenomenon can occur in zero gravity, which is not consistent
imaging studies. Additionally, this study provided an opportunity with the basic thermoconvection model (since “buoyancy”
to evaluate the concept of sensory neuromodulation (Black and only makes sense in a gravitational field). Various alternative
Rogers, 2020) and how it might support future randomized explanations have been summarized (Kassemi et al., 2005; Hood,
controlled trials evaluating tvCVS therapy. 1989; McGeoch, 2010). Minor and Goldberg (1990) estimated
that ∼75% of the effects of CVS result from thermoconvection.
Evidence for Thermoconvection There is also evidence that hair cells other than those innervating
It is important to know how the tvCVS device induces changes the horizontal canal have altered firing rates during CVS (Tsuji
in neuronal activity. The data collected in this study align et al., 1990, 1994; Shen et al., 2013). Our observations using ICA
with the dominant observed effects being consistent with the seem to support thermoconvection as the principle means for
original Barany model. The thermoconvection model of CVS, neuromodulation, as described below.
first suggested by Barany and Wittmaack (1911), describes how Figure 4 shows the independent component located in the
endolymph in the segment of the horizontal semicircular canal cerebellum (subject 4) superimposed with the applied thermal
along the inner ear wall, where heat transfer first occurs during waveform. It is clear that the cold waveform period matches
CVS, can become buoyant relative to the more distal segment the period of the square wave, which represents the cerebellar
of the canal when a warm stimulus is applied. (During CVS independent component (the dotted lines in Figure 4A are
induction, the subject is nearly supine so that the horizontal canal included to emphasize the alignment). The ICA output was
is actually in a vertical orientation. This acts to maximize the compared to known noise components to rule out alternative
CVS induction effect.) The warmed endolymph becomes more explanations for the ICA results. It is particularly noteworthy
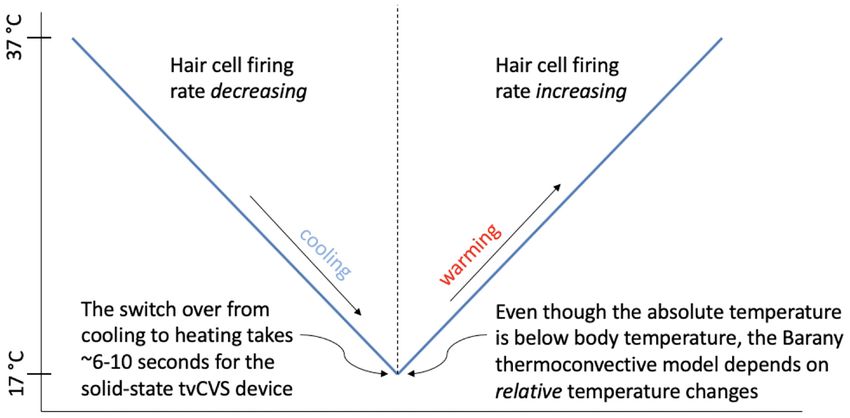
Frontiers in Systems Neuroscience | www.frontiersin.org 11 August 2021 | Volume 15 | Article 648928Black et al. Time-Varying Caloric Vestibular Stimulation FIGURE 10 | Time series from a frontoparietal independent component, subject 1. The dotted lines show the start and stop points of the tvCVS delivery. that the transition from the plateau to the trough of the or less: effectively a constant temperature in terms of thermally independent component occurs over a very short time (
Black et al.                                                                                                                     Time-Varying Caloric Vestibular Stimulation

  FIGURE 11 | Depiction of the transition between hair cell firing rate states as a function of the direction of the temperature ramp.

to induce different resonant responses in different brain regions                         in a single individual vary with thermal waveform choice and
and in different individuals. We might speculate that the position                        from day-to-day. The clinical data acquired using the thermal
of the cupula becomes metastable as a result of the time-varying                          waveform of Figure 2 (Wilkinson et al., 2017, 2019) suggest that
thermal stimulus delivered by tvCVS. The ICA data from this                               this waveform can be clinically effective in a broad population
study suggest the possibility that small deformations of the cupula                       and so it would be a mistake to conclude that strong ICA
away from its equilibrium position can result in a nearly binary                          signals, for example, are crucial for clinical utility. It may be
switching between low firing and high firing states.                                      that the periodic stimulation induced by these particular thermal
   A notable observation from Figures 4, 7 is that the response                           waveforms creates a strong resonance in individuals who have
in the cerebellum persists for the entire period the device is on                         natural network frequencies that are well matched to the applied
(∼18.5 min) without diminution. Using constant temperature                                stimulus (Black et al., 2016). It is well known that individuals
CVS, partial adaptation occurs within minutes (Bock et al.,                               show variability in the magnitude of response to standard CVS
1979). Time-varying CVS does not allow the vestibular hair                                diagnostic protocols (Patki et al., 2016) and therefore some of the
cells to adapt, since the applied stimulus is constantly changing.                        observed differences in this study may result from the underlying
Therefore, tvCVS enables longer duration run times when                                   receptivity to CVS induction. We re-emphasize that the data in
considering its use for therapeutic applications. The time rate of                        the current study should be viewed as proof-of-concept only and
change of temperature is slow relative to irrigation CVS and this                         that significant work remains before making any firm conclusions
has been found to significantly reduce the induction of dizziness                         about how a given subject responds acutely to tvCVS.
and nausea that can accompany the diagnostic CVS procedure.
   Knowing that the fMRI signal analyzed in this study is                                 Activity in Network Hubs
consistent with a vestibular origin is an important starting point                        The innervation of the vestibular system is extensive (Kirsch
before considering activity in other sensory network hubs like the                        et al., 2015) and one goal of the current study was to gather
thalamus, hippocampus and precuneous. Below, we discuss how                               preliminary data on how different brain regions respond to
the broad activation seen in Figure 8 is consistent with the idea                         tvCVS. There is a rich literature documenting the connectivity
of sensory neuromodulation, which proposes that a modulatory                              between the vestibular nuclei and the cerebellum (Rochefort et al.,
signal that enters through a sensory organ is carried along the                           2013; Hilber et al., 2019), the thalamus (Lopez and Blanke, 2011),
endogenous network innervated by that organ.                                              the precuneous (Dieterich et al., 2003; Petit and Beauchamp,
   An important question is why subjects responded differently.                           2003; Falconer and Mast, 2012; Gottlich et al., 2014), and the
Subject 4 exhibited a strong cerebellar response as seen in                               hippocampus (Vitte et al., 1996; Smith, 1997; Cuthbert et al., 2000;
Figure 4 (correlated ICA signal) and Figure 5 (BOLD intensity                             Stackman et al., 2002; Smith et al., 2010; Tai and Leung, 2012;
relative to the other three subjects). Since we worked to eliminate                       Hitier et al., 2014). The PIVC (parieto-insular vestibular cortex)
artifacts in the data, results from subject 4 cannot be ignored,                          is a multisensory convergence area that tends to be dominant
but neither can they be generalized without collecting data from                          in the non-dominant hemisphere (Dieterich et al., 2003) and
additional subjects in the future. Subject 4 had exceptionally                            it has been extensively studied in protocols involving artificial
strong responses in the cerebellum; subject 1 showed a strong                             vestibular stimulation (Petit and Beauchamp, 2003; Ferrè et al.,
ICA response in the operculum (Figure 7); all four subjects                               2012; Frank and Greenlee, 2014; Shinder and Newlands, 2014).
showed similar BOLD responses in the frontoparietal network                                  As argued above, the applied thermal waveform effectively led
(Figure 9, discussed below). It is possible that these observations                       to two different states: hair cells firing above the equilibrium
are signs of individualized responses in the context of this                              rate or below it. That two-state behavior is reflected in BOLD
particular experimental protocol. It is also possible that responses                      response localized to the thalamus (Figures 8A,B), precuneous

Frontiers in Systems Neuroscience | www.frontiersin.org                              13                                           August 2021 | Volume 15 | Article 648928
Black et al.                                                                                                    Time-Varying Caloric Vestibular Stimulation

(Figures 8C,D), and hippocampus (Figures 8E,F). These regions                 (Black et al., 2016). We posit that it is this persistent activity that
are generally understood to be “rich club” areas (van den Heuvel              accounts for the sustained contrast effects in Figure 9 (device-
and Sporns, 2011, 2013) that process and distribute sensory                   off). It is notable that the spectral power tends to show a
information to create a comprehensive representation of sensory               narrow range of frequencies once the driving effect of tvCVS
perceptions. As was the case with the cerebellar independent                  is removed, versus what can be a more complex admixture of
component, the thalamus, hippocampus and precuneous showed                    frequencies when tvCVS, with two different frequency thermal
activity immediately when the tvCVS stimulation started. It is                waveforms that interact, is driving the BOLD activity. The
not surprising to see evidence of coherent BOLD activity in                   frontoparietal network is removed from direct processing of
these hub regions. These hubs are implicated in the anatomy                   incoming sensory information and this may be why its temporal
of brain disorders (Crossley et al., 2014) and are therefore of               response characteristics are different from those seen in the
particular interest.                                                          sensory processing areas.

Frontoparietal Network
Recognizing that the results presented here are preliminary,                  Neurovascular Coupling and Systemic
nonetheless the fact that one brain region responds to                        Flow
one stimulus frequency and another region responds to a                       In summary, the study results support several tentative
different (yet concurrent) frequency is noteworthy. This is                   propositions:
the sort of finding one expects from the concept of sensory
neuromodulation since the underpinning framework is that
input to sensory organs is transformed as it travels over the                     1 The principal means by which tvCVS modulates brain
endogenous sensory network. Such transformations allow brain                        activity is consistent vestibular stimulation induced by
regions remote from the sensory organs to properly interpret                        thermoconductive effects and not by direct thermal
and act on the input stimulus. This is categorically different                      effects on hair cells, other nerve bodies or non-neuronal
from neuromodulation methods that seek to impose an externally                      structures. The small amount of data collected does not
applied, common stimulus without regard to local neuronal                           allow for a definitive conclusion on this point, however.
dynamics (Danilov et al., 2015).                                                  2 Brain regions involved in vestibular sensory processing
   The BOLD time series for the frontoparietal independent                          respond primarily to the time-varying stimulus in the
component (Figure 9) does not follow the pattern found in the                       manner expected: the BOLD signal resulting from NVC.
brain regions already discussed. For the cerebellum, thalamus,                      In particular, the modulatory effect of tvCVS occurs when
precuneous, hippocampus, and operculum, the modeled data                            the device is active and the alternations in the thermal
showed increased activity as the stimulation period started and                     waveforms drive BOLD contrast patterns.
that activity effectively stopped when the stimulation ended.                     3 In addition to NVC, there is evidence of a systemic blood
The frontoparietal independent component shows onset that                           flow effect that dominated the response characteristics in
is delayed with respect to the time stimulation starts and it                       a frontoparietal network. That both NVC and systemic
persists into the post-stimulus period (Figure 10). In the earlier                  effects can change BOLD contrast has been established
transcranial Doppler sonography study evaluating the effects of                     (Tong et al., 2019).
tvCVS (Black et al., 2016), the effects on CBFv also showed a                     4 The fMRI results are consistent with the concept of sensory
delayed onset (after the start of tvCVS) and a persistent effect after              neuromodulation since there is evidence that different
the end of tvCVS. In that case, it was hypothesized that CBFv                       brain regions respond differently to the tvCVS stimulus,
oscillations were due to the entrainment of a pontine pacing                        reflecting a transformation of the incoming stimulus
network that controls B wave activity. The delay in the onset                       pattern as it propagates through the vestibular sensory
of the CBFv response can be understood as resulting from time                       network.
for entrainment of a pacing system that acts to modulate flow
from the heart to the brain and back. The concept of neuronal                    We have provided evidence for the modulation of cerebral
entrainment and its role in brain function more generally has                 blood flow, both via NVC and systemic flow effects, by
been recently summarized (Lakatos et al., 2019).                              tvCVS and we have reviewed the critical importance of
   The frontoparietal independent component time series for                   hemodynamics in maintaining brain health and function.
each subject was analyzed using a fast Fourier transform                      Multiple forms of vestibular neuromodulation (tilt/rotation,
algorithm (StatPlus, AnalystSoft, Inc.) in order to gain insight              sinusoidal GVS, tvCVS) have been used to induce low frequency
about the post-tvCVS activity, in particular. In all subjects, the            oscillations in hemodynamic variables. We are not aware of
principal spectral peaks in the post-tvCVS epoch represented                  other neuromodulation device studies that produce such effects.
periods of 50–85 s. Those values are consistent with blood                    However, the exercise literature, in particular studies of high
circulation times (Morris et al., 2009). We hypothesize, therefore,           intensity interval training, does contain examples of time-varying
that the spectral peaks represent evidence of the entrainment                 modulation of hemodynamics (Klein et al., 2019). The well-
of blood flow that persisted after the end of the tvCVS                       known benefits of aerobic exercise on brain health (Barnes, 2015)
stimulus, consistent with the conclusions reached in the                      makes it an interesting model for comparison as we address
transcranial Doppler study that evaluated tvCVS entrainment                   future clinical work utilizing tvCVS.

Frontiers in Systems Neuroscience | www.frontiersin.org                  14                                     August 2021 | Volume 15 | Article 648928
Black et al.                                                                                                                        Time-Varying Caloric Vestibular Stimulation

Conclusions, Limitations, and Future                                                          et al., 2011) and tvCVS (Black et al., 2016) have all demonstrated
Work                                                                                          the ability to induce oscillations in hemodynamic parameters
                                                                                              and this is a capability that has not been demonstrated with
This work is limited in terms of enabling conclusive statements
                                                                                              other neuromodulation approaches. Hemodynamic modulation
about the acute effects of tvCVS on BOLD contrast in multiple
                                                                                              informs current hypotheses of the mechanism of action of tvCVS
brain regions. Our primary purpose was to provide a proof-of-
                                                                                              in a therapeutic context (Black and Rogers, 2020).
concept demonstration that tvCVS can be performed in a fMRI
imaging experiment. A short listing of questions that remain
unanswered:
                                                                                              DATA AVAILABILITY STATEMENT
     1 Why did subject 4 have such a large cerebellar response
       and subject 1 have a large response in the operculum? We                               The raw data supporting the conclusions of this article will be
       hypothesize that the answer lies in a resonant response of                             made available by the authors, without undue reservation.
       a “metastable cupula,” a proposal that is bolstered by the
       apparent sensitivity to small temperature changes evident
       in Figures 4, 7. All subjects showed comparable BOLD                                   ETHICS STATEMENT
       effect sizes in the frontoparietal network data, suggesting
                                                                                              The studies involving human participants were reviewed and
       robust CVS induction in all subjects.
                                                                                              approved by Wake Forest Baptist Medical Center, Wake Forest,
     2 Why do the plateaus and troughs, e.g., in Figure 4,
                                                                                              NC, United States. The patients/participants provided their
       lead to different BOLD contrast in Figure 5? Presumably
                                                                                              written informed consent to participate in this study.
       this reflects the manner in which the brain stem and
       cerebellum process changes in the afferent firing rate from
       the horizontal semicircular canal.
                                                                                              AUTHOR CONTRIBUTIONS
     3 More generally, what gives rise to the lateralized effects
       seen in the ICA-delineated BOLD images? The applied                                    RDB: primary author, corresponding author, and primary
       tvCVS waveforms are inherently lateralized, of course. But                             interpretation of results. RPB: secondary author and
       if the BOLD contrast seen in Figure 9 is due to a systemic                             image reconstruction and analysis. KR and CS: editor for
       blood flow effect, why does there seem to be a left-sided                              vestibular neuroscience content. RP: built and tested the
       dominance? This may be due to an inherent bias in activity                             vestibular neuromodulation device. CL: editor for radiological
       in the network for right-handed subjects.                                              interpretation. CW: editor for radiological interpretation and
     4 How might these results be interpreted for the purpose of                              designed fMRI scan sequence. All authors contributed to the
       titrating tvCVS in a therapeutic context if, for example,                              article and approved the submitted version.
       the frequency of the stimulus waveform plays a role in
       the strength of response? Future work must evaluate the
       effects of changing the laterality and frequency of thermal                            FUNDING
       stimulation waveforms.
     5 It is beyond the scope of this report, but tvCVS is a                                  Scion NeuroStim paid for MRI scanner time at Wake Forest
       potentially interesting probe of resting state brain function                          Baptist Medical Center. Study subjects were not compensated.
       since it can act in the low-frequency regime commonly
       used to study the default mode network (Raichle, 2015;
       Demertzi et al., 2019) and it is a task-neutral perturbation.                          ACKNOWLEDGMENTS
   The widespread brain responses to tvCVS, especially in                                     The authors wish to thank Dr. Kristen Ade for contributions to
the frontoparietal network, is interesting in terms of current                                the study design and data interpretation.
theories about vestibular cognition (Smith, 2017; Ferrè and
Haggard, 2020). Clinically, the widespread activation patterns
are potentially meaningful in explicating recent tvCVS clinical                               SUPPLEMENTARY MATERIAL
results that show evidence of broad efficacy across symptoms
that involve dysfunction in multiple brain networks (Wilkinson                                The Supplementary Material for this article can be found
et al., 2019). Vestibular neuromodulation approaches including                                online at: https://www.frontiersin.org/articles/10.3389/fnsys.
rotary chairs (Serrador et al., 2009), sinusoidal GVS (Cohen                                  2021.648928/full#supplementary-material

REFERENCES                                                                                    Aso, T., Jiang, G., Urayama, S. I., Fukuyama, H., and Resilient, A. (2017).
                                                                                                 Non-neuronal source of the spatiotemporal lag structure detected by
Abraham, A., Pedregosa, F., Eickenberg, M., Gervais, P., Mueller, A., Kossaifi,                  bold signal-based blood flow tracking. Front. Neurosci. 11:256. doi:
  J., et al. (2014). Machine learning for neuroimaging with scikit-learn. Front.                 10.3389/fnins.2017.00256
  Neuroinform. 8:14. doi: 10.3389/fninf.2014.00014                                            Avants, B. B., Epstein, C. L., Grossman, M., and Gee, J. C. (2008). Symmetric
Adair, D., Truong, D., Esmaeilpour, Z., Gebodh, N., Borges, H., Ho, L., et al. (2020).           diffeomorphic image registration with cross-correlation: evaluating automated
  Electrical stimulation of cranial nerves in cognition and disease. Brain Stimul.               labeling of elderly and neurodegenerative brain. Med. Image Anal. 12, 26–41.
  13, 717–750. doi: 10.1016/j.brs.2020.02.019                                                    doi: 10.1016/j.media.2007.06.004

Frontiers in Systems Neuroscience | www.frontiersin.org                                  15                                          August 2021 | Volume 15 | Article 648928
Black et al. Time-Varying Caloric Vestibular Stimulation Azevedo, E., Rosengarten, B., Santos, R., Freitas, J., and Kaps, M. (2007). Interplay Eames, P. J., Blake, M. J., Dawson, S. L., Panerai, R. B., and Potter, J. F. (2002). of cerebral autoregulation and neurovascular coupling evaluated by functional Dynamic cerebral autoregulation and beat to beat blood pressure control TCD in different orthostatic conditions. J. Neurol. 254, 236–241. doi: 10.1007/ are impaired in acute ischaemic stroke. J. Neurol. Neurosurg. Psychiatry 72, s00415-006-0338-1 467–472. Barany, R., and Wittmaack, K. (1911). Funktionelle prufung des Esteban, O., Markiewicz, C. J., Blair, R. W., Moodie, C. A., Isik, A. I., vestibularapparates (functional testing of the vestibular apparatus). Otol. Erramuzpe, A., et al. (2019). fMRIPrep: a robust preprocessing pipeline Ges. 20, 184–238. for functional MRI. Nat. Methods 16, 111–116. doi: 10.1038/s41592-018-0 Barmack, N. H. (2003). Central vestibular system: vestibular nuclei and posterior 235-4 cerebellum. Brain Res. Bull. 60, 511–541. doi: 10.1016/s0361-9230(03)00055-8 Falconer, C. J., and Mast, F. W. (2012). Balancing the mind: vestibular induced Barnes, J. N. (2015). Exercise, cognitive function, and aging. Adv. Physiol. Educ. 39, facilitation of egocentric mental transformations. Exp. Psychol. 59, 332–339. 55–62. doi: 10.1152/advan.00101.2014 doi: 10.1027/1618-3169/a000161 Beckmann, C. F., and Smith, S. M. (2004). Probabilistic independent component Ferrè, E. R., Bottini, G., and Haggard, P. (2012). Vestibular inputs modulate analysis for functional magnetic resonance imaging. IEEE Trans. Med. Imaging somatosensory cortical processing. Brain Struct. Funct. 17, 859–864. doi: 10. 23, 137–152. doi: 10.1109/TMI.2003.822821 1007/s00429-012-0404-7 Bell, A. (2019). What Barany’s caloric test might have overlooked: the primary Ferrè, E. R., and Haggard, P. (2020). Vestibular cognition: state-of-the-art and factor may be the middle ear muscles. J. Hear Sci. 9, 9–22. doi: 10.17430/ future directions. Cogn. Neuropsychol. 37, 413–420. doi: 10.1080/02643294. 1003537 2020.1736018 Black, R. D., and Rogers, L. L. (2020). Sensory neuromodulation. Front. Syst. Fitzgerald, G., and Hallpike, C. S. (1942). Studies in human vestibular function: Neurosci. 14:12. doi: 10.3389/fnsys.2020.00012 observations on the directional preponderance of caloric nystagmus resulting Black, R. D., Rogers, L. L., Ade, K. K., Nicoletto, H. A., Adkins, H. D., and from cerebral lesions. Part 1. Brain 65, 115–137. doi: 10.1093/brain/65.2.115 Laskowitz, D. T. (2016). Non-invasive neuromodulation using time-varying Fitzpatrick, R. C., and Day, B. L. (2004). Probing the human vestibular system with caloric vestibular stimulation. IEEE J. Trans. Eng. Health Med. 4:2000310. doi: galvanic stimulation. J. Appl. Physiol. 96, 2301–2316. doi: 10.1152/japplphysiol. 10.1109/JTEHM.2016.2615899 00008.2004 Bock, O., von Koschitzky, H., and Zangemeister, W. H. (1979). Vestibular Flammer, J., and Mozaffarieh, M. (2008). Autoregulation, a balancing act between adaptation to long-term stimuli. Biol. Cybern. 33, 77–79. doi: 10.1007/ supply and demand. Can J. Ophthalmol. 43, 317–321. doi: 10.3129/i08-056 bf00355256 Fonov, V. S., Evans, A. C., Mckinstry, R. C., Almli, C. R., and Collins, L. (2009). Buzsáki, G. (2006). Rhythms of the Brain, Vol. xiv. Oxford; NY: Oxford University Unbiased nonlinear average age-appropriate brain templates from birth to Press, 448. adulthood. NeuroImage 47:S102. Carey, B. J., Eames, P. J., Blake, M. J., Panerai, R. B., and Potter, J. F. (2000). Frank, S. M., and Greenlee, M. W. (2014). An MRI-compatible caloric stimulation Dynamic cerebral autoregulation is unaffected by aging. Stroke 31, 2895–2900. device for the investigation of human vestibular cortex. J. Neurosci. Methods doi: 10.1161/01.str.31.12.2895 235C, 208–218. doi: 10.1016/j.jneumeth.2014.07.008 Claassen, J. A., and Zhang, R. (2011). Cerebral autoregulation in Alzheimer’s Frank, S. M., and Greenlee, M. W. (2018). The parieto-insular vestibular cortex disease. J. Cereb. Blood Flow Metab 31, 1572–1577. doi: 10.1038/jcbfm.2011.69 in humans: more than a single area? J. Neurophysiol. 120, 1438–1450. doi: Cohen, B., Martinelli, G. P., Ogorodnikov, D., Xiang, Y., Raphan, T., Holstein, 10.1152/jn.00907.2017 G. R., et al. (2011). Sinusoidal galvanic vestibular stimulation (sGVS) induces a Fritzsch, C., Rosengarten, B., Guschlbauer, B., Weiller, C., Hetzel, A., and Reinhard, vasovagal response in the rat. Exp. Brain Res. 210, 45–55. doi: 10.1007/s00221- M. (2010). Neurovascular coupling and cerebral autoregulation in patients 011-2604-4 with stenosis of the posterior cerebral artery. J. Neuroimaging 20, 368–372. Cox, R. W. (1996). AFNI: software for analysis and visualization of functional doi: 10.1111/j.1552-6569.2009.00424.x magnetic resonance neuroimages. Comput. Biomed Res. 29, 162–173. doi: 10. Giller, C. A. (1990). The frequency-dependent behavior of cerebral autoregulation. 1006/cbmr.1996.0014 Neurosurgery 27, 362–368. doi: 10.1097/00006123-199009000-00004 Crossley, N. A., Mechelli, A., Scott, J., Carletti, F., Fox, P. T., McGuire, P., et al. Glickstein, S. B., Ilch, C. P., and Golanov, E. V. (2003). Electrical (2014). The hubs of the human connectome are generally implicated in the stimulation of the dorsal periaqueductal gray decreases volume of anatomy of brain disorders. Brain 137(Pt. 8), 2382–2395. doi: 10.1093/brain/ the brain infarction independently of accompanying hypertension and awu132 cerebrovasodilation. Brain Res. 994, 135–145. doi: 10.1016/j.brainres.2003.0 Cuthbert, P. C., Gilchrist, D. P., Hicks, S. L., MacDougall, H. G., and Curthoys, I. S. 8.001 (2000). Electrophysiological evidence for vestibular activation of the guinea pig Gohel, S. R., and Biswal, B. B. (2015). Functional integration between brain regions hippocampus. Neuroreport 11, 1443–1447. doi: 10.1097/00001756-200005150- at rest occurs in multiple-frequency bands. Brain Connectivity 5, 23–34. doi: 00018 10.1089/brain.2013.0210 Czosnyka, M., Smielewski, P., Piechnik, S., Steiner, L. A., and Pickard, J. D. (2001). Golanov, E. V., Regnier-Golanov, A. S., and Britz, G. W. (2017). Integrity of Cerebral autoregulation following head injury. J. Neurosurg. 95, 756–763. doi: cerebellar fastigial nucleus intrinsic neurons is critical for the global ischemic 10.3171/jns.2001.95.5.0756 preconditioning. Brain Sci. 7:121. doi: 10.3390/brainsci7100121 Danilov, Y., Kaczmarek, K., Skinner, K., and Tyler, M. (2015). “Cranial nerve Goldberg, J. M., Smith, C. E., and Fernandez, C. (1984). Relation between discharge noninvasive neuromodulation new approach to neurorehabilitation,” in Brain regularity and responses to externally applied galvanic currents in vestibular Neurotrauma: Molecular, Neuropsychological and Rehabilitative Aspects, eds nerve afferents of the squirrel monkey. J. Neurophysiol. 51, 1236–1256. doi: F. H. Kobeissy and S. W. Hoffman (Boca Raton, FL: CRC Press), 606–627. 10.1152/jn.1984.51.6.1236 Demertzi, A., Tagliazucchi, E., Dehaene, S., Deco, G., Barttfeld, P., Raimondo, F., Gommer, E. D., Martens, E. G., Aalten, P., Shijaku, E., Verhey, F. R., Mess, W. H., et al. (2019). Human consciousness is supported by dynamic complex patterns et al. (2012). Dynamic cerebral autoregulation in subjects with Alzheimer’s of brain signal coordination. Sci. Adv. 5:eaat7603. doi: 10.1126/sciadv.aat7603 disease, mild cognitive impairment, and controls: evidence for increased Dieterich, M., Bense, S., Lutz, S., Drzezga, A., Stephan, T., Bartenstein, P., peripheral vascular resistance with possible predictive value. J. Alzheimers Dis. et al. (2003). Dominance for vestibular cortical function in the non-dominant 30, 805–813. doi: 10.3233/JAD-2012-111628 hemisphere. Cereb. Cortex 13, 994–1007. doi: 10.1093/cercor/13.9.994 Gorgolewski, K., Burns, C. D., Madison, C., Clark, D., Halchenko, Y. O., Waskom, Dieterich, M., and Brandt, T. (2008). Functional brain imaging of peripheral and M. L., et al. (2011). Nipype: a flexible, lightweight and extensible neuroimaging central vestibular disorders. Brain 131(Pt. 10), 2538–2552. doi: 10.1093/brain/ data processing framework in python. Front. Neuroinform. 5:13. doi: 10.3389/ awn042 fninf.2011.00013 Drew, P. J., Mateo, C., Turner, K. L., Yu, X., and Kleinfeld, D. (2020). Ultra- Gottlich, M., Jandl, N. M., Wojak, J. F., Sprenger, A., der Gablentz, J., Munte, slow oscillations in fMRI and resting-state connectivity: neuronal and vascular T. F., et al. (2014). Altered resting-state functional connectivity in patients with contributions and technical confounds. Neuron 107, 782–804. doi: 10.1016/j. chronic bilateral vestibular failure. Neuroimage Clin. 4, 488–499. doi: 10.1016/j. neuron.2020.07.020 nicl.2014.03.003 Frontiers in Systems Neuroscience | www.frontiersin.org 16 August 2021 | Volume 15 | Article 648928
You can also read