Lateral thermokarst patterns in permafrost peat plateaus in northern Norway - The Cryosphere
←
→
Page content transcription
If your browser does not render page correctly, please read the page content below
The Cryosphere, 15, 3423–3442, 2021
https://doi.org/10.5194/tc-15-3423-2021
© Author(s) 2021. This work is distributed under
the Creative Commons Attribution 4.0 License.

Lateral thermokarst patterns in permafrost peat plateaus
in northern Norway
Léo C. P. Martin1,2 , Jan Nitzbon3,4 , Johanna Scheer1,5 , Kjetil S. Aas1 , Trond Eiken1 , Moritz Langer3,4 , Simon Filhol1 ,
Bernd Etzelmüller1 , and Sebastian Westermann1,6
1 Department  of Geosciences, University of Oslo, Blindern, 0316 Oslo, Norway
2 Faculty of Geosciences, Utrecht University, Utrecht, The Netherlands
3 Alfred Wegener Institute Helmholtz Centre for Polar and Marine Research, Telegrafenberg A45, 14473 Potsdam, Germany
4 Geography Department, Humboldt-Universität zu Berlin, Unter den Linden 6, 10099 Berlin, Germany
5 Technical University of Denmark, Anker Engelunds Vej 1, Lyngby, Denmark
6 Center for Biogeochemistry in the Anthropocene, Oslo, Norway

Correspondence: Léo Martin (leo.doug.martin@gmail.com) and Sebastian Westermann (sebastian.westermann@geo.uio.no)

Received: 13 November 2020 – Discussion started: 22 December 2020
Revised: 5 May 2021 – Accepted: 8 June 2021 – Published: 22 July 2021

Abstract. Subarctic peatlands underlain by permafrost con-       subsurface water and heat, as well as ground subsidence due
tain significant amounts of organic carbon. Our ability to       to melting of excess ice. By performing a sensitivity test
quantify the evolution of such permafrost landscapes in nu-      for snow depths on the plateau under steady-state climate
merical models is critical for providing robust predictions of   forcing, we obtain a threshold behavior for the start of edge
the environmental and climatic changes to come. Yet, the ac-     degradation. Small snow depth variations (from 0 to 30 cm)
curacy of large-scale predictions has so far been hampered       result in highly different degradation behavior, from stabil-
by small-scale physical processes that create a high spa-        ity to fast degradation. For plateau snow depths in the range
tial variability of thermal surface conditions, affecting the    of field measurements, the simulated annual volume changes
ground thermal regime and thus permafrost degradation pat-       are broadly in agreement with the results of the drone sur-
terns. In this regard, a better understanding of the small-      vey. As snow depths are clearly correlated with ground sur-
scale interplay between microtopography and lateral fluxes       face temperatures, our results indicate that the approach can
of heat, water and snow can be achieved by field monitor-        potentially be used to simulate climate-driven dynamics of
ing and process-based numerical modeling. Here, we quan-         edge degradation observed at our study site and other peat
tify the topographic changes of the Šuoššjávri peat plateau      plateaus worldwide. Thus, the model approach represents a
(northern Norway) over a three-year period using drone-          first step towards simulating climate-driven landscape devel-
based repeat high-resolution photogrammetry. Our results         opment through thermokarst in permafrost peatlands.
show thermokarst degradation is concentrated on the edges
of the plateau, representing 77 % of observed subsidence,
while most of the inner plateau surface exhibits no detectable
subsidence. Based on detailed investigation of eight zones of    1   Introduction
the plateau edge, we show that this edge degradation corre-
sponds to an annual volume change of 0.13 ± 0.07 m3 yr−1         Observations show that permafrost is warming at a global
per meter of retreating edge (orthogonal to the retreat direc-   scale (Biskaborn et al., 2019). Its thawing has major con-
tion).                                                           sequences on arctic and boreal ecosystems and landscapes
   Using the CryoGrid3 land surface model, we show that          (Beck et al., 2015; Farquharson et al., 2019; Liljedahl et al.,
these degradation patterns can be reproduced in a model-         2016) and potentially represents an important climate feed-
ing framework that implements lateral redistribution of snow,    back through the decomposition of thawed organic matter
                                                                 (Koven et al., 2015; Schuur et al., 2009, 2015). Carbon emis-

Published by Copernicus Publications on behalf of the European Geosciences Union.
3424                L. C. P. Martin et al.: Lateral thermokarst patterns in permafrost peat plateaus in northern Norway

sions from permafrost regions towards the atmosphere are          ward (Thibault and Payette, 2009) and peat plateau degrada-
already observed (Natali et al., 2019); field measurements        tion is observed in North America (Jones et al., 2016; Mamet
show that these emissions are influenced by the timing of         et al., 2017; Payette et al., 2004), Fennoscandia (Borge et al.,
the active layer deepening (Morgalev et al., 2017) and by the     2017; Sannel and Kuhry, 2011) and western Siberia (Jones et
state of degradation of the permafrost terrains (Langer et al.,   al., 2016; Sherstyukov and Sherstyukov, 2015). In northern
2015; Nwaishi et al., 2020; Serikova et al., 2018). In par-       Norway, the analysis of aerial imagery showed a decrease
ticular, abrupt thawing of ice-rich permafrost is expected to     between 33 % and 71 % (depending on the site) in the lat-
become a significant factor for carbon emissions, potentially     eral extent of the peat plateaus since the 1950s (Borge et
offsetting the negative feedback by increased ecosystem pro-      al., 2017), with the largest lateral changes since the 2000s.
ductivity that is expected for gradual thaw (McGuire et al.,      These results suggest that “lateral erosion” of plateau edges
2018; Turetsky et al., 2020).                                     (as coined by Borge et al., 2017), plays a crucial role in per-
   As such, our ability to quantify and represent the physical    mafrost degradation. In this study, we use the term “lateral
evolution of permafrost landscapes is critical to provide ro-     thermokarst” instead of lateral erosion to highlight that the
bust predictions of the environmental and climatic changes        lateral shrinkage of peat plateaus is governed by thermokarst
to come (Aas et al., 2019; Andresen et al., 2020; Teufel and      processes.
Sushama, 2019). While permafrost affects about 14 million            The ongoing degradation of Fennoscandian peat plateaus
square kilometers in the Northern Hemisphere (Obu et al.,         is a potential analogue for the future of much larger peat
2019), the ground thermal response to climatic signal and         plateau areas found in Russia, Canada and Alaska. It pro-
morphological changes of permafrost are governed by pro-          vides the opportunity to conduct field measurements and test
cesses occurring within a spatial scale of a few meters (Gis-     process-based model approaches to further understand the lo-
nås et al., 2014; Jones et al., 2016; Martin et al., 2019; Way    cal drivers of permafrost peatland dynamics. Both field mea-
et al., 2018). Indeed, lowland permafrost landscapes (such as     surements and numerical modeling experiments have con-
peat plateaus and polygonal tundra) are characterized by low      tributed to our understanding of how microtopography drives
amplitude (0–3 m vertically) and high frequency (10–100 m         the lateral fluxes of heat, water and snow and impacts the
horizontally) spatial variations of their topography, often re-   ground thermal regime (Martin et al., 2019; Sannel, 2020;
ferred to as microtopography (French, 2018). This microto-        Sannel et al., 2016; Sjöberg et al., 2016). Transport of snow
pography drives the lateral redistribution of snow, liquid wa-    and water from the plateau to the surrounding mire are crit-
ter and heat, which can dramatically modify the ground ther-      ical factors leading to lower ground temperatures in the peat
mal regime and water content (Martin et al., 2019). In many       plateaus (mean annual temperature at 1 m depth is 2 to 3 ◦ C
cases, the microtopography results from the presence of ex-       colder than in the mire; Martin et al., 2019), which enables
cess ice in the ground, i.e., the volume of ice that exceeds      the presence of permafrost even in regions where the mean
the total pore volume that the ground would have under un-        annual air temperature is above 0 ◦ C (Jones et al., 2016; Mar-
frozen conditions (NSIDC glossary), so permafrost thawing         tin et al., 2019; Sannel and Kuhry, 2011). However, a com-
results in surface subsidence (“thermokarst”; Göckede et al.,     prehensive model that can simulate the landscape evolution
2017, 2019; Nitzbon et al., 2019, 2020). In models, the rep-      (including observed lateral thermokarst patterns) in a quanti-
resentation of this feedback between small-scale fluxes and       tative and process-based fashion is lacking.
dynamical topography is still in its infancy and large-scale         In this study, we quantify volume changes of a peat plateau
permafrost modeling studies usually lack these processes          in northern Norway using repeat digital elevation models
(Park et al., 2015). Robust predictions of the physical state     compiled from drone aerial imagery. Using photogramme-
of permafrost landscapes thus require further field observa-      try, the surface topography of the plateau was reconstructed
tions and model development to improve our understanding          and compared for the years 2015 and 2018. Subsequently, we
of these phenomena.                                               adapt the laterally coupled, tiled version of the CryoGrid3
   Peat plateaus are permafrost landforms covering exten-         model (Langer et al., 2016; Nitzbon et al., 2019; Wester-
sive regions throughout the boreal and arctic realms that         mann et al., 2016) to reproduce observed patterns of micro-
store nearly 200 Pg of carbon (Lindgren et al., 2018). They       topography change, including an analysis of model sensitiv-
are mainly located in the sporadic permafrost zone (Sep-          ity towards snow depth. The work presented here builds on
pälä, 1972; Sollid and Sørbel, 1998) and are typically as-        field observations and simulations for peat plateaus in north-
sociated with a climatic envelope characterized by a mean         ern Norway (Martin et al., 2019) and other arctic landscapes
annual ground temperature around 0 ◦ C and precipitation be-      (Aas et al., 2019; Nitzbon et al., 2019, 2020, 2021).
low 800 mm yr−1 (Aalto et al., 2017; Parviainen and Luoto,
2007). Thus, permafrost underneath peat plateaus is rela-
tively warm and its distribution is highly sensitive to climate
changes (Aalto et al., 2014, 2017; Fronzek et al., 2010; Luoto
et al., 2004). The limit of continuous and discontinuous per-
mafrost in the Northern Hemisphere is already moving north-

The Cryosphere, 15, 3423–3442, 2021                                                  https://doi.org/10.5194/tc-15-3423-2021
L. C. P. Martin et al.: Lateral thermokarst patterns in permafrost peat plateaus in northern Norway                                3425

2     Study area: the Šuoššjávri peat plateaus

The Šuoššjávri peat plateau (69.38◦ N, 24.25◦ E, around
310 m a.s.l.; Fig. 1) is situated in Finnmarksvidda, northern
Norway and extends over approximately 23 ha. A detailed
description of the Šuoššjávri peat plateaus can be found in
Martin et al. (2019), and a map detailing the geomorphologi-
cal context around the study site is presented in Appendix A2
(Fig. A2). The climate of Finnmarksvidda is continental. The
Cuovddatmohkki station nearby the site shows that in the
last decade, mean annual air temperatures ranged from −2 to
0 ◦ C, with yearly precipitation from 350 to 500 mm (Fig. 1).
The average air temperature is −2.0 ◦ C for the 1967–2019
period, −1.0 ◦ C for the 2010–2019 period and −0.1 ◦ C for
the 2015–2016 hydrological year (the year used for model-
ing in this study). The average yearly precipitation is 392 mm
for the 1967–2019 period, 453 mm for the 2010–2019 period
and 472 mm for the 2015–2016 hydrological year.
   The Šuoššjávri site consists of a laterally incised peat
plateaus and smaller peat mounds surrounded by wet mires
and ponds. These peat bodies extend over meters to several
tens of meters with irregular geometries and rise 1 to 3 m
above the surrounding wet mire (Fig. 2). At many locations,
the peat plateau edges show signs of advanced degradation
and lateral erosion.

3     Material and methods
                                                                  Figure 1. (a) Location of Šuoššjávri in northern Norway.
3.1    Field measurements                                         (b) Monthly data of the model forcing to simulate the hydrologi-
                                                                  cal year 2015–2016. (c) Yearly data from the Cuovddatmohkki sta-
We used drone-based structure from motion photogrammetry          tion located at 286 m a.s.l., 7 km east from Šuoššjávri (310 m a.s.l.).
to compute a high-resolution digital elevation model (DEM)        The green bar and point indicate the hydrological year 2015–2016.
of the Šuoššjávri peat plateau. Aerial imagery was acquired       Panel (a) is modified from Martin et al. (2019); a Landsat image is
by a NIKON COOLPIX A digital camera mounted on a                  used for the background.
Camflight C8 drone during two flights in September 2015
and 2018 (2 September 2015 and 5 September 2018). Aerial
surveys were conducted from an altitude of 120 m above the        to 40 cm of snow, with most of the values between 10 and
ground, with a side overlap of 40 % and a forward overlap of      30 cm (Fig. 3). We used these observations to design numer-
80 %. Horizontal and vertical coordinates of 54 natural and       ical simulations with four idealized snow scenarios in which
artificial ground control points were acquired with a differ-     maximum snow depth on the plateau is limited to 0, 5–10,
ential GPS (dGPS) to support georeferencing and DEM gen-          10–20 and 20–30 cm (Sect. 3.3.2).
eration using the Agisoft Photoscan software (version 1.2.6).
The final DEMs have a grid resolution of 0.1 m. The average       3.2   Quantification of lateral thermokarst patterns
elevation difference between ground control points and the
DEM is 2.6 cm. To guarantee a meaningful subsidence sig-          Our drone-based photogrammetric approach (Sect. 3.1) en-
nal, we only considered subsidence values exceeding 5 cm in       abled us to derive repeat DEMs of the peat plateau for
this study.                                                       September 2015 and 2018. We computed the elevation dif-
   Measurements of snow depths for winter 2016, as pre-           ference (elevation from 2018 minus elevation from 2015)
sented in Martin et al. (2019), were extended to the winters of   to quantify the spatial pattern of elevation changes through-
2017 and 2018 for selected points on the plateau top. Snow        out the plateau. From this elevation difference map, we se-
depths were measured at the end of March with an avalanche        lected eight degrading zones (referred to as edge transect ar-
probe at the same points in all years using a dGPS system         eas) with 10–30 m length and roughly straight lateral extent
to define the locations within 5–10 cm accuracy. In March,        for comparison with modeling results (Sect. 3.3). Based on
the elevated peat plateaus are commonly covered with 10           the elevation changes and lateral extent of the plateau be-

https://doi.org/10.5194/tc-15-3423-2021                                                   The Cryosphere, 15, 3423–3442, 2021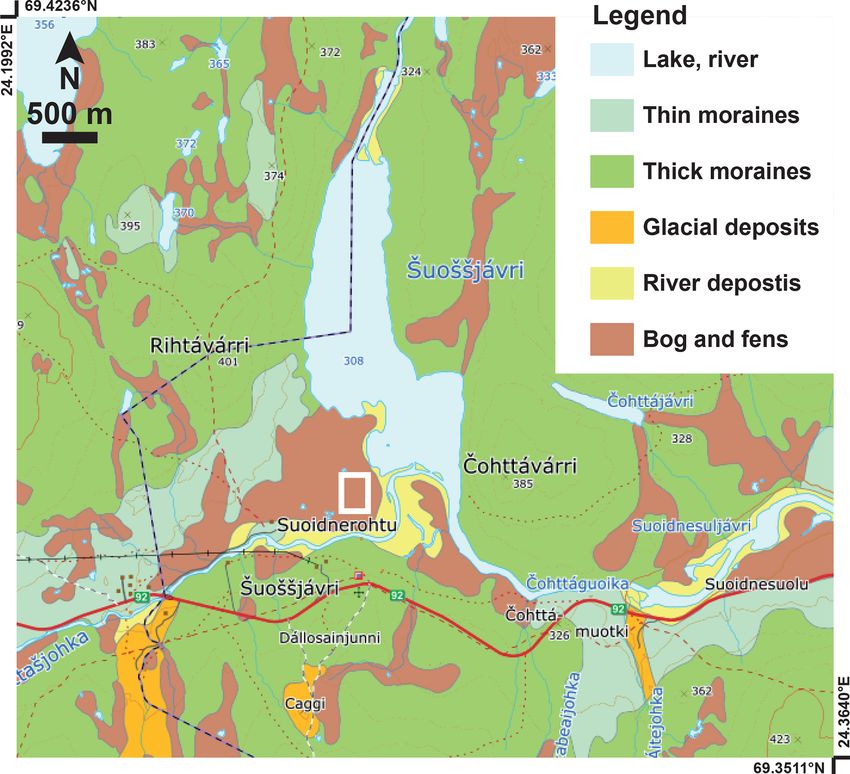
3426                 L. C. P. Martin et al.: Lateral thermokarst patterns in permafrost peat plateaus in northern Norway

Figure 2. (a) Orthophoto of the peat plateau (transparent white shading applied to the mire to better distinguish it from the plateau). The
white dots indicate the location of snow measurements presented in Fig. 3. (b) Digital elevation model of the plateau in 2018. The edge
transect areas on which this study focuses are indicated by white boxes. The black lines indicate the profiles used to derive the edge retreat
metric described in Sect. 3.2.

                                                                            Permafrost degradation in peatlands creates different sub-
                                                                         sidence patterns depending on the size of the ice-rich fea-
                                                                         tures. Small structures like palsas tend to sink uniformly from
                                                                         the edge to the top, while peat plateaus show stability of their
                                                                         top part and pronounced lateral retreat. To distinguish be-
                                                                         tween these two types of thermokarst patterns, we introduce
                                                                         a so-called horizontal vs. vertical (HvsV) shape index that
                                                                         we can apply to both field observations and model results.
                                                                         The basic concept of the HvsV index is illustrated in Fig. 4.
                                                                         To compute the HvsV index, the plateau edge elevation is av-
                                                                         eraged over five points, from its base (z1 ) to the point where
Figure 3. March snow depth distribution on top of the Šuoššjávri         its flat top is reached (z5 ). The elevation difference between
peat plateau for 2016, 2017 and 2018. Data for 2016 are from Mar-
                                                                         2015 and 2018 (1z) for z1 , z2 , z4 and z5 is then used as fol-
tin et al. (2019). Measurement locations are displayed in Fig. 2.
                                                                         lows:
                                                                         HvsV shape index =
tween 2015 and 2018, we used the eight edge transect areas
                                                                           1 − 1z4 +1z5

(Fig. 2) to calculate the normalized annual volume change                      1z1 +1z2  if 1z4 + 1z5 ≤ 1z1 + 1z2
                                                                                                                  .                       (1)
(the annual volume change normalized by the length of the                  0             otherwise
retreating edge orthogonal to the retreat direction; in units
of m3 yr−1 m−1 ). Because elevation changes occurred in the              For the field observations, the HvsV index was obtained by
mire due to water level variations between the two dates, we             first laterally averaging the slope of each edge transect area
relied on an estimation of the elevation of the plateau edge             using five to 14 parallel elevation profiles across the zone
inflection point (around 309.7–309.8 m a.s.l.; yellow color in           for the 2015 and 2018 DEMs (Fig. 1). For these synthetic
Fig. 2b) to delineate the plateau from the mire and thus iden-           elevation profiles, the points z1 to z5 were determined so that
tify elevation changes associated with the plateau.                      the HvsV index could be calculated based on the elevation
                                                                         differences.

The Cryosphere, 15, 3423–3442, 2021                                                            https://doi.org/10.5194/tc-15-3423-2021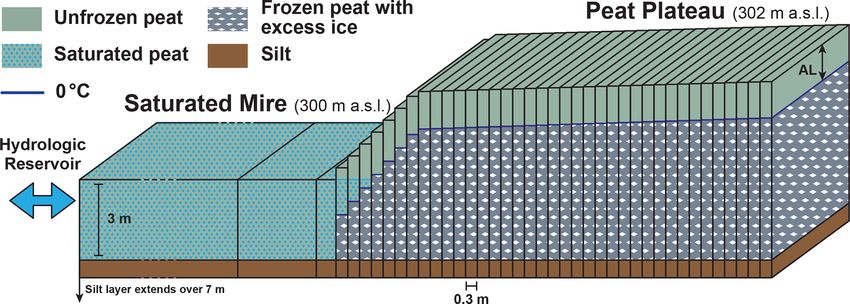
L. C. P. Martin et al.: Lateral thermokarst patterns in permafrost peat plateaus in northern Norway                              3427

                                                                       Nitzbon et al. (2019, 2020, 2021) to represent the transient
                                                                       evolution of polygonal tundra landscapes for different future
                                                                       climate scenarios. In the present study, this scheme is adapted
                                                                       to simulate microtopography changes and thermokarst pat-
                                                                       terns of the Šuoššjávri peat plateau.
                                                                          Following Nitzbon et al. (2019, 2020), CryoGrid3 includes
                                                                       a parallel framework to simultaneously compute several 1D
                                                                       tiles that can exchange water, snow and heat at defined time
                                                                       steps. This approach, denoted as laterally coupled tiling, al-
Figure 4. Schematic representation of the HvsV index used to quan-
                                                                       lows us to couple 1D tiles with different stratigraphies or
tify the observed and simulated thermokarst patterns. The index
ranges from 1, when the plateau undergoes pure lateral edge retreat
                                                                       topographies to simulate the effect of microtopography and
(subsidence restricted to the areas at contact with the mire), to 0,   spatial heterogeneity within a landscape. With this method,
when it experiences uniform subsidence.                                the spatial variability within polygonal tundra (Nitzbon et
                                                                       al., 2019) or the stratigraphy differences between Yedoma
                                                                       and Holocene deposits (Nitzbon et al., 2020) have been sim-
   For the simulation results (Sect. 4.2), a 10 m long win-            ulated. The scheme can capture lateral fluxes of snow, sub-
dow was used to capture the topography from the base of                surface water and heat at the meter scale, all of which are key
the plateau to its flat top. For these 10 m profiles, the five re-     drivers of the ground thermal regime and thermokarst pat-
quired points were determined and the HvsV index was com-              terns. As described in detail in Nitzbon et al. (2019), the lat-
puted over three-year-long time periods.                               eral heat flux calculation is based on the temperature gradient
                                                                       between neighboring cells of different tiles. If topographic
3.3     Modeling climate-induced changes of peat plateau               differences expose the side of a tile, lateral heat fluxes be-
        topography                                                     tween the tile and the atmosphere are not taken into account.
                                                                          The snow depth is a major control for the ground ther-
3.3.1    The CryoGrid3 model                                           mal regime (Gisnås et al., 2014; Martin et al., 2019; San-
                                                                       nel, 2020; Sannel et al., 2016). Strong wind redistribution of
We simulate the ground thermal regime and related topo-                snow from the plateau to the lower-lying mire leads to a shal-
graphic evolution of the Šuoššjávri peat plateau using the             low snow cover on the plateaus (Sect. 3.1). In the laterally
CryoGrid3 model (Westermann et al., 2016). CryoGrid3 is a              coupled tiling approach of CryoGrid3, wind drift of snow
land surface model designed for permafrost modeling, which             is not computed in a physically based way. Instead, fresh
consists of a physically based description of 1D heat transfer         snow is redistributed at regular time intervals between all
in the soil column, including freeze–thaw processes of soil            tiles based on the relative surface elevations of the snow cov-
water or ice. The model features a simple snowpack mod-                ered tiles. Tiles gain or loose snow proportional to the differ-
ule, which includes heat conduction, dynamic buildup, melt,            ence between their surface elevation and the average surface
sublimation, water infiltration and refreezing. At the upper           elevation of all tiles in a mass-conserving scheme. Thereby,
boundary, the model uses the surface energy balance mod-               snow is redistributed between all the tiles without taking their
ule to calculate the ground surface temperature. The turbu-            relative location into account. To represent immobile snow
lent fluxes of sensible and latent heat are calculated using           trapped by vegetation and/or rough surfaces, snow is only
a Monin–Obukhov approach (Monin and Obukhov, 1954).                    considered movable if its depth exceeds the “immobile snow
Computation of dynamic soil moisture is accomplished with              height”, which can be adjusted as a model parameter. In the
a bucket scheme (Martin et al., 2019, Nitzbon et al., 2019) in         setup used for this study, the elevation difference between the
which each grid cell can hold water up to its field capacity,          plateau and the mire leads to complete redistribution of snow
while excess water is moved to the next grid cell until a water        that exceeds the immobile snow height from the plateau to
table on top of the permafrost (or bedrock layer) is reached.          the mire. The immobile snow height can therefore be used to
Evapotranspiration is adjusted by soil moisture availability           adjust the overall snow depth on the plateau in our modeling
and the water loss is distributed vertically, so it decreases ex-      experiments.
ponentially with depth.
   CryoGrid3 can represent ground subsidence resulting                 3.3.2   Model setup
from the melt of the excess ice in the ground (see Wester-
mann et al., 2016). The subsidence calculation is based on             The present-day topography of the peat plateau is clear ev-
soil stratigraphy, in particular volumetric ice content and nat-       idence that the long-term evolution is not only governed
ural porosity, i.e., the porosity of the soil matrix in unfrozen       by lateral thermokarst at the plateau edges but also by
conditions. When excess ice melts in a grid cell, the grid cell        thermokarst processes in the interior of the plateau, with
size shrinks accordingly. This excess ice scheme was first             pond formation and drainage as well as drainage gully de-
implemented by Westermann et al. (2016) and later used in              velopment and deepening. As a fully 3D simulation of these

https://doi.org/10.5194/tc-15-3423-2021                                                      The Cryosphere, 15, 3423–3442, 2021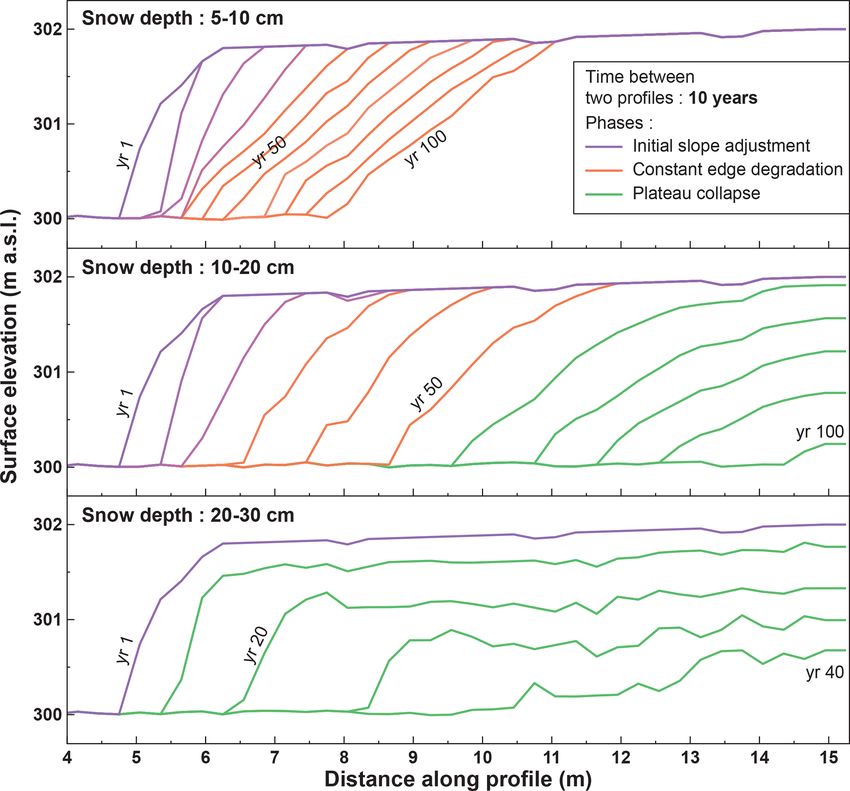
3428                   L. C. P. Martin et al.: Lateral thermokarst patterns in permafrost peat plateaus in northern Norway

Table 1. Field observations at the eight edge transect areas pre-       While this is clearly an idealized setup, it is still possible
sented in Fig. 2. Elevation changes and surface measurements are     to compare the magnitudes of modeled volumetric plateau
derived from the digital elevation models. The normalized an-        degradation with field observations for sufficiently straight
nual volume changes are obtained by dividing the annual volume       sections of the plateau edge (Sect. 3.2, Fig. 2). As field ob-
changes by the length of the retreating edge in the zone. The        servations of snow depth show a considerable spread of snow
HvsV shape index (Fig. 4) was calculated according to Eq. (1). See
                                                                     depths on the plateau (that cannot be reproduced by model-
Sect. 3.2 for more details.
                                                                     ing), we investigate model sensitivity towards snow depths
                Peat     Retreating      Normalized                  on the plateau by adjusting the immobile snow height using
             plateau           edge    annual volume   HvsV          four different values within a realistic range. In each config-
    Zone      height         length           change   index         uration, the same immobile snow height was applied to all
               (cm)             (m)   (m3 yr−1 m−1 )      (–)        tiles. During the simulations, the snow depth on the plateau
                                                                     varied within ranges of 5–10 cm due to snow fall, snow drift
    1           200             25            0.295     0.74
                                                                     and snow melt. Therefore, we named the scenarios based on
    2           130             16            0.100     0.64
    3           120             16            0.074     0.68
                                                                     their snow depth range, i.e., 0 cm snow, 5–10 cm snow, 10–
    4           140             13            0.132     0.81         20 cm snow and 20–30 cm snow.
    5           120             25            0.045     0.94
    6           180             30            0.232     0.75         3.3.3   Model parameters
    10          220             13            0.124     0.81
    11          145             11            0.052     0.84         As described in Martin et al. (2019), field measurements
                             Mean             0.132     0.78
                                                                     from the Iškoras peat plateau (40 km east of the site of the
                              SD              0.078     0.08         present study) were used to establish the soil stratigraphy.
                                                                     The peat layer in the mire has total volumetric contents of
                                                                     5 % mineral and 15 % organic material and a porosity of
                                                                     80 %. It is underlain by a saturated mineral silt layer with
phenomena is beyond the capability of our model approach,            50 % porosity above a mineral bedrock layer (3 % porosity,
we focus on the simplified situation of a laterally homoge-          as in Westermann et al., 2013). Over the Šuoššjávri plateau,
nous peat plateau edge, for which all fluxes in the third spa-       the soil stratigraphy features a significant spatial variability.
tial dimension are assumed zero (translational symmetry).            The stratigraphy assumed in the model matches the western
For this purpose, we couple 40 tiles in a linear configura-          parts of the plateau, where strong subsidence is observed and
tion, with subsurface water and heat transfer only allowed be-       from where annual volume changes for model comparison
tween neighboring cells (Fig. 5). The wet mire is divided into       are obtained. In the eastern and southern parts (Fig. 2), the
three tiles with widths of 50, 2 and 0.5 m at a surface eleva-       organic soil thickness is only shallow with morainic deposits
tion of 300 m a.s.l. They are composed of a 3 m thick layer of       close to the surface. This part is comparably stable and not
unfrozen saturated peat above a 7 m thick silty mineral layer        targeted by our modeling.
that also extends below the plateau. The outermost mire tile            Snow and soil parameters are based on the field measure-
is linked to a hydrologic reservoir (Nitzbon et al., 2019) at        ments and the sensitivity tests from Martin et al. (2019).
300 m a.s.l. to ensure a stable water level with permanently         The simulations use a snow density of 230 kg m−3 , consis-
water-saturated conditions. The peat plateau tiles are 0.3 m         tent with measurements on top of the peat plateaus. Similarly,
wide so the initial width of the plateau amounts to 11.1 m.          the soil field capacity used for the simulations is set to 55 %.
They contain the same total amount of peat above the min-            Peat soil field capacity can display a pronounced variability
eral base layer as the mire tiles but include additional excess      (20 % to 60 % of the volumetric content; Walczak and Rov-
ice, which increases their surface elevation. In line with ob-       dan, 2002), and our value is consistent with field observa-
servations (Table 1), the initial excess ice content is adjusted     tions, e.g., from southern Siberian peatlands (Motorin et al.,
so that the flat top of the plateau is located 2 m above the wet     2017). All other parameters (e.g., the surface energy balance
mire at 302 m a.s.l. The excess ice is initially distributed ho-     parameterization) were selected as in Martin et al. (2019) and
mogeneously between the mineral base layer and the bottom            are presented in Appendix A4.
of the active layer (assumed 0.7 m deep). The selected peat
and excess ice stratigraphy implicitly ensures that the plateau      3.3.4   Steady-state climatic forcing and model spin-up
surface reaches the surface elevation of the mire when the
excess ice has fully melted. Our setup leads to an initial ex-       As presented in Martin et al. (2019), we use model forcings
cess ice content of 47 % (volume of excess ice/volume of             for the hydrological year 2015–2016 that have been com-
unfrozen soil) in the plateau, which is in the range of com-         piled by dynamical downscaling of the ERA-Interim reanal-
monly reported field values (Bockheim and Hinkel, 2012;              ysis (Dee et al., 2011) with the Weather Research and Fore-
Kokelj and Burn, 2003; Lacelle et al., 2013; Morse et al.,           casting model (WRF v.3.8.1; Skamarock and Klemp, 2008).
2009; Subedi et al., 2020).                                          The WRF model was run in two nested domains with 15

The Cryosphere, 15, 3423–3442, 2021                                                      https://doi.org/10.5194/tc-15-3423-2021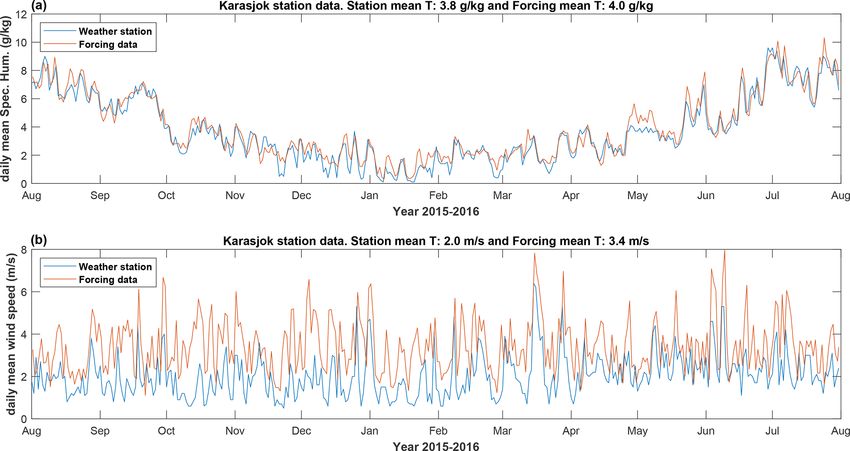
L. C. P. Martin et al.: Lateral thermokarst patterns in permafrost peat plateaus in northern Norway                                        3429

Figure 5. Setup used to simulate peat plateau degradation. We coupled 40 CryoGrid3 tiles to reproduce the contact between the mire and
the peat plateau. The surface elevation was linearly interpolated between 300 and 302 m a.s.l. over a lateral distance of 2.4 m to represent
a typical geometry of peat plateau edge. AL stands for active layer. We linearly interpolated them between 0.9 (leftmost tile) and 0.7 m
(rightmost tile). The model implements lateral fluxes of snow, subsurface water and heat between the tiles as well as ground subsidence due
to excess ice melt. The bottom part of the setup has been truncated because it consist of silt over 7 m for all tiles. This setup is an idealized
setup derived from our field observations. It does not aim to represent one particular natural setup of the edge transect areas detailed in this
study.

Figure 6. Left: subsidence over the Šuoššjávri peat plateau. The black lines indicate the profiles used to derive the edge retreat metric
described in Sect. 3.2 (HvsV index). Note that the color scale is truncated for subsidence values higher than 40 cm and lower than 0 cm
(which corresponds to an increase in surface elevation, generally due to vegetation change between the two years). Right: edge transect areas
of the plateau used to compare observed and simulated lateral thermokarst patterns (Sect. 3.2).

and 3 km grid spacings from August 2015 to July 2016. To                   ing data are looped to generate a 100-year time series with
generate the model forcing for CryoGrid3, we used 3-hourly                 steady-state climate forcing. To also achieve a realistic initial
output from the nearest grid point in the 3 km domain. The                 temperature profile in deeper layers, a 100-year spin-up is
other model parameters for WRF were selected as in Aas                     performed for all simulations using the /textit0 cm snow sce-
et al. (2016), with the exception of slightly higher vertical              nario for which the peat plateau is stable (Sect. 4.2). Note that
resolution (45 model layers compared to 40) and excluding                  the other snow scenarios cannot be used for model spin-up,
the climatic mass balance glacier module. The one-year forc-               as the plateau edge starts to retreat instantly so a true steady

https://doi.org/10.5194/tc-15-3423-2021                                                            The Cryosphere, 15, 3423–3442, 2021
3430 L. C. P. Martin et al.: Lateral thermokarst patterns in permafrost peat plateaus in northern Norway
state cannot be reached. As shown in Fig. 1, the hydrologi-
cal year 2015–2016 was relatively warm. It is 0.9 ◦ C warmer
and 4 % wetter than the decadal average from 2010 to 2019
(Sect. 2).
4 Results
4.1 Measurements of microtopography evolution
The topographic changes of the Šuoššjávri peat plateau be-
tween September 2015 and September 2018 are presented Figure 7. Subsidence distribution for the Šuoššjávri peat plateau.
in Fig. 6. From the DEM difference, we found that 19 % of The edge is taken as the outermost 2 m of the plateau. Only sub-
the plateau displays 5 cm or more subsidence (i.e., the sen- sidence values greater than 0.05 m are considered in this graph to
sitivity threshold of the measurements), which consequently guarantee a meaningful subsidence signal. Data are derived from
implies that 81 % of the plateau is stable during the observa- the topography difference between 2015 and 2018. The percentages
tion period. The mean subsidence value (considering values indicate which proportion of the total area (whole plateau or plateau
larger than 5 cm) is 17±15 cm (1σ ) and the median is 12 cm, edge) is affected by a subsidence higher than or equal to (in abso-
with 1.2 % of the total plateau surface subsiding by more than lute value) a given subsidence value (e.g., 36 % of the edge exhibits
40 cm. The maximum observed subsidence is a 1 m2 patch in a subsidence higher than or equal to 5 cm).
Zone 6, showing between 1.5 and 1.7 m of subsidence over
the 3 years.
We extracted the outermost 2 m of the plateau edge which notable differences in profile evolution between simulations.
corresponds to one third of the total plateau surface but rep- While the plateau fully degrades at the end of the 100 years
resents 77 % of the total subsidence (including the rims of of the simulation for the 10–20 cm snow simulation, it occurs
the depressions within the plateau). The distribution of sub- within 40 years for the 20–30 cm snow simulation.
sidence values for the whole plateau and the 2 m edge zone From the evolution of the idealized topography in the three
are presented in Fig. 7. simulations, we can identify three different types of simu-
Due to the spatial variability in the peat plateau stratig- lated lateral thermokarst. For both the 5–10 cm snow and 10–
raphy described in Sect. 3.3.3, the west side of the plateau 20 cm snow simulations, the plateau degradation first shows a
features higher subsidence values than the east side. On the phase of slope adjustment during which the slope angle grad-
east side, ground subsidence is lower due to the limited thick- ually decreases over time. We denote this phase as the “initial
ness of the peat layer, with mineral soils at a depth of less slope adjustment” (ISA; Figs. 8 and 9). This phase lasts for
than 1 m below the surface. A description of the eight edge 40 years in the 5–10 cm snow simulation and 30 years for
transect areas and their subsidence between 2015 and 2018 the 10–20 cm snow simulation. Following the initial slope
is presented in Table 1. For these eight zones, the normalized adjustment, lateral thermokarst affects the slope in a more
annual volume change is 0.13±0.08 m3 yr−1 m−1 . The mean uniform way in these two simulations, and the plateau edge
HvsV shape index (Sect. 3.2) is 0.78 ± 0.08, which suggests retreats at a constant rate without changes of the slope angle.
a dominance of edge degradation over uniform ground sub- We denote this phase the “constant edge degradation” (CED;
sidence. Figs. 8 and 9), which lasts for 60 years for the 5–10 cm and
for 20 years for the 10–20 cm snow simulation. During the
4.2 Simulations of microtopography evolution second half of the 10–20 cm snow simulation, both the edge
and the top of the plateau subside. We denote this phase as
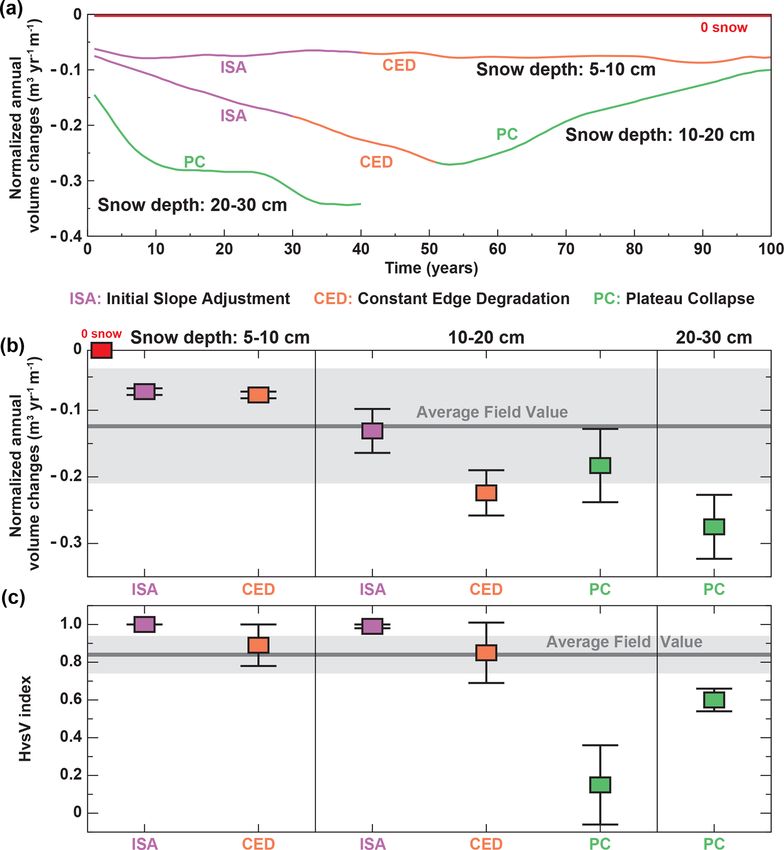
Results from the model simulations are presented in Fig. 8. “plateau collapse” (PC; Figs. 8 and 9). Contrary to the 10-
The temporal evolution of the peat plateau microtopography 20 cm snow simulation, the 20—30 cm snow simulation does
shows an edge retreat, while a large part of the plateau is sta- not show the phases of initial slope adjustment and constant
ble, as is observed in the DEM difference (Sect. 4.1). The edge degradation but only the plateau collapse phase.
temporal evolution and patterns of simulated edge retreat The top panel of Fig. 9 presents the normalized annual
show a pronounced dependence on the snow depth on the volume change. For the 5–10 cm snow simulation, this vol-
peat plateau. The 0 cm snow simulation (with complete trans- ume change is constant at around 0.06 to 0.08 m3 yr−1 m−1 .
port of the snow from the plateau towards the mire) shows For the 10–20 cm snow simulation, the volume change
no lateral thermokarst of the plateau, whereas the simula- during the initial slope adjustment and the constant edge
tion with the thinnest snow depth (5–10 cm snow) triggers degradation phases show a steady increase from 0.08 to
an edge retreat of 4 to 5 m over the 100 years of the simula- 0.28 m3 yr−1 m−1 . During the plateau collapse phase, this
tion. For the 10–20 cm snow and 20–30 cm snow simulations, volume change steadily decreases to 0.12 m3 yr−1 m−1 at the
the plateau fully degrades within the simulation time, with end of the simulation. For the 20–30 cm snow simulation, the
The Cryosphere, 15, 3423–3442, 2021 https://doi.org/10.5194/tc-15-3423-2021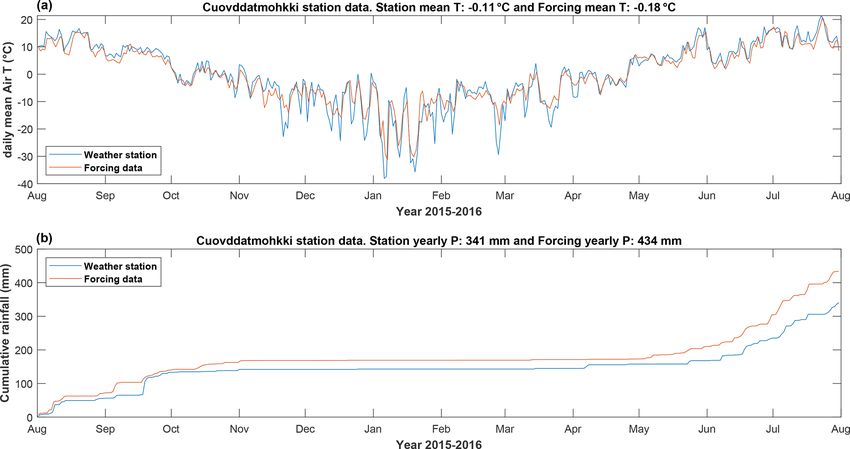
L. C. P. Martin et al.: Lateral thermokarst patterns in permafrost peat plateaus in northern Norway                                     3431

Figure 8. Surface elevation profiles of the peat plateaus as simu-
lated with CryoGrid3 for different snow depths on top of the plateau
in time increments of 10 years. Three phases are identified (see
text): initial slope adjustment (slope modifications along time), con-   Figure 9. (a) Normalized annual volume changes for the three snow
stant edge degradation (slope conserved) and plateau collapse (sub-      scenarios. (b) Comparison of volume changes and shape index be-
sidence over the full plateau). Note that the /textit0 cm snow simu-     tween observations and simulations. Observations (gray line and
lation (not shown) did not produce any changes to the initial topog-     shading) are means and standard deviations of the variables in the
raphy.                                                                   eight edge transect areas presented in Table 1. The values derived
                                                                         from simulations are mean and standard deviations taken over the
                                                                         different periods of the simulations. See Fig. 8 and Sect. 4.2. for a
volume change reaches 0.28 m3 yr−1 m−1 in the first decades              description of the three degradation phases. No subsidence occurred
and stabilizes at this value for 10–20 years before increasing           for the 0 snow simulation (red square).
rapidly to 0.35 m3 yr−1 m−1 , at which point it stabilizes until
the end of the simulation. A comparison between simulated
and measured ground surface temperatures (time series from               volume changes than the average field value (between 0.1
Martin et al., 2019) is presented in Appendix A1 (Fig. A1),              and 0.25 m3 yr−1 m−1 ). The 20–30 cm snow simulation dis-
showing an overall good agreement.                                       plays volume losses substantially higher than the field values
                                                                         (> 0.25 m3 yr−1 m−1 ).
                                                                            For the HvsV shape index, the initial slope adjustment
4.3   Comparison of model results and topographic
                                                                         phases for both the 5–10 cm snow and the 10–20 cm snow
      measurements
                                                                         simulations show values of 1, slightly larger than the field-
                                                                         derived value (0.84 ± 0.09). Both constant edge degradation
A comparison of the Šuoššjávri peat plateau lateral
                                                                         phases are in line with field observations with a larger spread
thermokarst patterns between field data and simulations is
                                                                         within the simulations than the field values. Because both
presented in the two bottom panels of Fig. 9. Field values
                                                                         are characterized by simultaneous edge degradation and sub-
represent average and standard deviation of the field mea-
                                                                         sidence of the entire plateau surface, the two plateau collapse
surements of the measured variables (Sect. 3.3 and Table 1).
                                                                         phases (for the 10–20 cm snow and 20–30 cm snow simula-
For each simulation, we average the volume loss and shape
                                                                         tions) feature HvsV values significantly smaller than the field
index over the ISA, CED and PC phases(Sect. 4.2).
                                                                         values (< 0.6).
   Overall, field-based and simulated volume changes are
in a similar range. The mean field value of 0.13 ±
0.08 m3 yr−1 m−1 is compatible with the different degrada-               5     Discussion
tion phases observed for the 5–10 cm snow and 10–20 cm
snow simulations. The 5–10 cm snow simulation shows lit-                 5.1    Field measurements
tle spread and smaller values than the average field value
(< 0.1 m3 yr−1 m−1 in absolute value), whereas the 10–                   Based on dGPS measured ground control points, the verti-
20 cm snow simulation displays a greater spread and larger               cal accuracy of the drone-based DEMs is estimated at 2.6 cm

https://doi.org/10.5194/tc-15-3423-2021                                                         The Cryosphere, 15, 3423–3442, 2021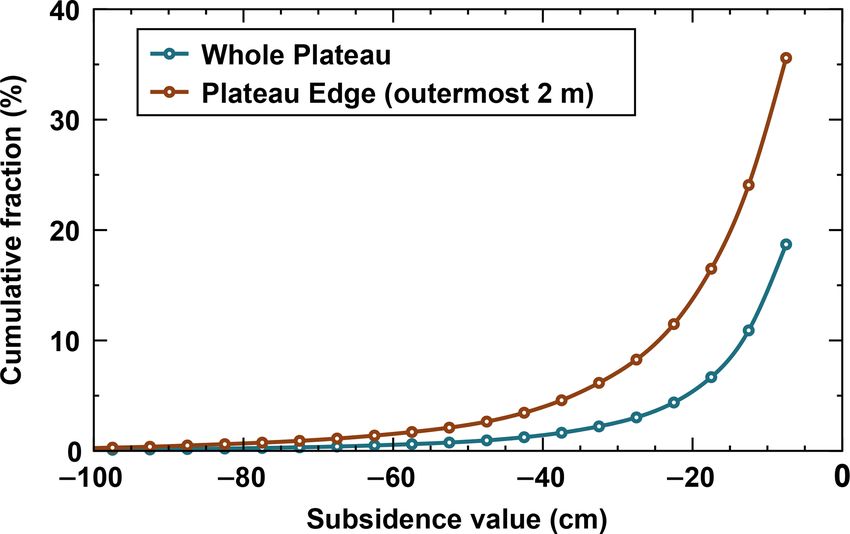
3432                L. C. P. Martin et al.: Lateral thermokarst patterns in permafrost peat plateaus in northern Norway

(Sect. 3.1), but shadows, changing cloudiness or strong re-         et al. (2016) who reported that 85 % of the degradation of
flectance contrasts near water bodies can create artifacts in       forested permafrost plateaus was due to lateral degradation
the acquisitions, which locally might cause larger deviations.      along the margins. Between 2015 and 2018, we find that
When comparing elevation differences between two DEMs,              the Šuoššjávri plateau lost 3.2 % of its surface area. Apply-
vegetation growth, the presence or absence of leaves and wa-        ing Eq. (A1) (Appendix A5), the aerial change corresponds
ter level variations can add noise to the results. To account       to an average annual rate of surface loss of 1.1 % yr−1 . Re-
for these possible flaws when computing elevation differ-           constructing the Šuoššjávri peat plateau extent from 1956 to
ences, we only considered variations higher than 5 cm, which        2011 with aerial imagery, Borge et al. (2017) observed an-
is double that of the mean difference between the elevation of      nual loss rates with the peat plateau extent of the year 1956
the ground control points (measured with a dGPS) and their          as reference. Using Eq. (A1), we compute the average an-
counterpart on the DEMs (2.6 cm). This value finds good             nual rate of surface loss from their data to be 0.5 % yr−1 from
consistency with values from the literature (Forlani et al.,        1956 to 1982, 0.8 % yr−1 from 1982 to 2003 and 1.4 % yr−1
2018; Jaud et al., 2016). In comparison, our results show that      from 2003 to 2011. Hence, the retreat rate found in this study
actively degrading zones of the plateau are associated with         rate is in good agreement with the long-term retreat rates.
subsidence values higher than 20 cm that can reach 1 m and          Note that Borge et al. (2017) also included small palsas in
more. These values are significantly higher than the 2.6 cm         the surrounding area in their assessments, which show faster
average discrepancy between the DEMs and dGPS measured              degradation rates than the peat plateau, so the two values can-
ground control points, so the DEM accuracy does not affect          not be compared in a strict sense.
the volume changes strongly (Table 1). Yet, the evaluation
of elevation accuracy derived from this technique will ben-         5.2     Model results
efit from additional studies confirming these results. Addi-
tionally, as described in Sect. 3.2, we acquired the volume         5.2.1    Simulated plateau degradation through lateral
changes for the plateau based on an estimation of the el-                    thermokarst
evation of the inflection point of its edge, from which we
                                                                    Our modeling framework relies on an idealized geometry
derived its contour in the 2015 and 2018 DEMs. In case of
                                                                    and steady-state climate forcing, so the full variety of the
high vegetation and uneven or gentle slopes, this method to
                                                                    observed thermokarst patterns cannot be reproduced. How-
delineate the peat plateau contours can introduce additional
                                                                    ever, the comparison between model results and observations
uncertainty. However, we carefully checked that this was not
                                                                    clearly shows that the numerical model framework can cap-
the case for the sections analyzed in Table 1.
                                                                    ture the correct order of magnitude of the degradation pro-
   At the western edge of the Šuoššjávri plateau, subsidence
                                                                    cesses, while also reproducing key patterns in the observed
is highly variable, ranging from 0 to more than 1 m within
                                                                    ground temperature regime (Appendix A1, Fig. A1).
3 years. This pattern highlights the highly complex and irreg-
                                                                       Among the different degradation phases (initial slope ad-
ular behavior of ice-rich permafrost landscapes (Nitzbon et
                                                                    justment, constant edge degradation and plateau collapse),
al., 2019; Osterkamp et al., 2009). When an initial perturba-
                                                                    the CED phase is most relevant for the comparison to field
tion, for example intense rainfall or above-average snow ac-
                                                                    observations, as it is characterized by steady edge retreat in
cumulation, triggers subsidence (Seppälä, 1988, 2011), both
                                                                    response to the steady-state climate forcing while the bulk
the snow redistribution and the subsurface drainage towards
                                                                    of the peat plateau remains stable. On the other hand, the
the mire are affected, which creates warmer surface condi-
                                                                    ISA phase is essentially an adjustment to the change in snow
tions and, in return, results in more subsidence. Consider-
                                                                    depth conditions from the no snow scenario used for initial-
ing the complex geometry of the Šuoššjávri plateau edges,
                                                                    ization to the scenarios with non-zero snow depth, which are
meter-scale variability of the snow and hydrological condi-
                                                                    characterized by edge retreat. The PC phase corresponds to
tions likely contribute to observed variability of ground sub-
                                                                    the sustained collapse of a plateau with ground subsidence
sidence. Furthermore, heat transfer between the wet mire
                                                                    in all parts, which is not observed for the Šuoššjávri peat
and the plateau is likely influenced by the geometry of the
                                                                    plateau but regularly occurs for smaller circular palsas in the
plateau-mire interface. As an example, zones 1, 2, 4 and 6
                                                                    vicinity. As palsas are often small rounded peat bodies, the
belong to convex features of the plateau edges and show par-
                                                                    assumption of translational symmetry inherent in our model
ticularly high subsidence rates. Finally, the distribution of the
                                                                    setup (Fig. 5) is not valid. For these features, simulations
excess ice in the ground plays an important role for the timing
                                                                    should be performed for cylindrical symmetry, which better
and magnitude of subsidence. Heterogeneous excess ice dis-
                                                                    describes the geometry of small palsas (as done in simula-
tribution throughout the plateau may be an important driver
                                                                    tions by Aas et al., 2019). This suggests that our simulations
of the observed spatial variability of the edge degradation.
                                                                    are indeed most realistic during the CED phase, whereas
   Our results confirm that edge degradation is a major
                                                                    changes of the overall geometry of the peat plateau must be
degradation pathway of peat plateaus with 77 % of the to-
                                                                    taken into account to model the final stages of degradation.
tal subsidence occurring within the outermost 2 m of the
Šuoššjávri plateau. This result shows consistency with Jones

The Cryosphere, 15, 3423–3442, 2021                                                    https://doi.org/10.5194/tc-15-3423-2021
L. C. P. Martin et al.: Lateral thermokarst patterns in permafrost peat plateaus in northern Norway 3433
5.2.2 Sensitivity of lateral thermokarst to snow depth PACK (Bartelt and Lehning, 2002). Yet, even these models
show limitations to reproduce the thermal characteristics of
Our simulations confirm the crucial role of snow on the snow deposited in Arctic regions as they do not account for
ground thermal regime and peat plateau degradation. They the vapor fluxes in the snow pack, which significantly affect
show that a stability threshold is crossed between zero (sta- the snow thermal conductivity profile (Domine et al., 2016).
bility) and 10 cm snow depth (lateral thermokarst). Even
though the absolute value of this threshold cannot be gener- 5.3 Implications for simulations of climate-driven
alized due to our simplistic snow model and the interplay of changes of permafrost landscapes
climatic parameters, it is broadly consistent with field experi-
ments involving human-made snow clearance in permafrost- 5.3.1 Sensitivity to climate forcing and perturbations
free mire areas in northern Scandinavia, which resulted in the
formation of new palsas (Seppälä, 1982, 1995). However, it In this study, we demonstrate that the snow depth on the
is possible that our simulations slightly overestimate the sen- plateau exerts a strong control on subsidence patterns. Our
sitivity of edge retreat to snow depth variations, with the true experiment shows that snow depth alone can drive important
stability threshold at higher snow depths. While measured surface temperature changes and permafrost disappearance.
March snow depths in 2015–2018 regularly exceeded 20– This result illustrates that permafrost disappearance is not
30 cm (Fig. 3), our simulations show higher than measured only a function of temperature (Chadburn et al., 2017) and
volume changes for the 20–30 cm snow scenario (Fig. 9). that plateau systems can react sensitively to different climatic
This behavior could at least be partly related to above aver- parameters affecting surface temperature. As such, snow pre-
age air temperature of the hydrological year 2015–2016 used cipitation and wind speed variations (which both affect snow
to force the model (Fig. 1), which should be clarified with pack buildup) should also be regarded as important drivers
transient simulations in future studies (Sect. 5.3.2). of the evolution of peat plateaus. In this regard, future pre-
Our idealized model approach assumes snow depths to cipitation patterns are expected to show an increase of rain-
be constant on the entire peat plateau, which does not cap- fall, partially at the expense of snowfall because of atmo-
ture the significant spatial and interannual variability of snow spheric warming (Bintanja and Andry, 2017). Yet at the re-
depths on the plateau observed in measurements (Fig. 3). In gional level, these changes are highly uncertain (O’Gorman,
particular, the complex geometry of snow drift patterns along 2014) but must be taken into account when projecting the
the plateau edges, with snow drifts forming on lee sides, is future evolution of peat plateaus in the subarctic.
not captured by the simple snow redistribution model im- The presented model approach (including excess ice and
plemented in CryoGrid3. Field observations show that snow small-scale representation of lateral fluxes) is clear evidence
drifts along the plateau edges feature considerably higher of the importance of a small-scale thaw feedback mechanism
snow depths than the surrounding wet mire, thus introducing on permafrost degradation. The feedback between the dy-
additional winter warming in the zone of maximum change. namic microtopography and the lateral fluxes of water, heat
Additionally, persistent wind patterns can strongly influence and snow shows how a limited increase in snow cover (e.g.,
the distribution of snowdrifts. In CryoGrid3, on the other from the 10–20 cm snow to the 20–30 cm snow scenario) re-
hand, snow removed from the plateau is evenly distributed sults in a strongly increased degradation rate. This sensitivity
over the entire mire, not taking edge effects into account. to small perturbation has been observed in a range of per-
Furthermore, our model assumes a fixed snow density and mafrost settings when artificially increasing snow depth with
thus snow thermal properties, while snow densities in reality a fence (Hinkel and Hurd, 2006), when building linear road
vary with, e.g., snow depth and time. A density increase from infrastructures (Schneider von Deimling et al., 2021) or due
200 to 300 kg m−3 may correspond to a doubling of ther- to heavy vehicle traffic in Alaskan lowlands (Raynolds et al.,
mal conductivity, depending on the snow type (Sturm et al., 2020).
1997). Measurements of snow density in Šuoššjávri showed
that the snow on top of palsas is slightly less dense than 5.3.2 Future model improvements
in the mire. This could be due to a thinner snowpack lead-
ing to greater kinetic metamorphism (snow metamorphism Our simple approach is not able to capture the complex pat-
driven by strong temperature gradient in the snowpack) and terns of different subsidence rates that are observed around
the formation of depth hoar crystals, which are character- the edges of the plateau (Fig. 6). In addition to small-scale
ized by high porosity and low effective thermal conductiv- variations of ground stratigraphy, excess ice content and
ity (Colbeck, 1982; Schneebeli and Sokratov, 2004). A thin- plateau heights, our observations suggest that the irregular
ner snowpack also implies a lower overburden pressure and plateau outline with both concave and convex shapes affects
therefore less compaction. Such limitations could be moder- the lateral fluxes of heat, water and snow, which in turn exert
ated by using more sophisticated snow models taking snow a control on the edge dynamics (Sect. 5.1). While computa-
microphysics and the transient evolution of snow density into tionally demanding, our multi-tile approach could be embed-
account, such as CROCUS (Vionnet et al., 2012) or SNOW- ded in an ensemble framework to represent a range of edge
https://doi.org/10.5194/tc-15-3423-2021 The Cryosphere, 15, 3423–3442, 20213434 L. C. P. Martin et al.: Lateral thermokarst patterns in permafrost peat plateaus in northern Norway
geometries and other critical parameters, yielding a range of represent the temperature and soil moisture gradients across
different degradation scenarios and therefore capture the high the plateau edges, which causes excess ice melt to only oc-
spatial variability of subsidence at the plateau scale. Further cur in a narrow zone at the plateau edge, in agreement with
sensitivity tests with steady-state climate forcing should fo- observations. Over longer timescales, on the other hand, this
cus on the role of air temperature (colder or warmer), total process leads to the reshaping and finally the complete col-
precipitation and excess ice content on peat plateau stability lapse of the entire peat plateau. In Earth system model frame-
and lateral thermokarst patterns. works, implementing a multi-tile approach for the land sur-
In our experiment, the modeling scheme shows a sensi- face scheme is challenging due to its complexity and com-
tivity of the plateau retreat to different surface temperatures putational demands. Yet, parameterized approaches could
resulting from the different prescribed snow depths. Because eventually be developed based on sensitivity tests with fu-
other climatic parameters than snow depth can affect surface ture generations of higher-complexity multi-tile frameworks
temperature, this indicates that our scheme may also be able (Sect. 5.3.2). In particular, future studies should investigate
to simulate the plateau response to a temperature increase, to what extent the two-tile approach demonstrated by Aas
paving the way for climate change simulations. Transient et al. (2019) can emulate the results of a multi-tile model,
simulations should ideally be initialized with a model spin- especially when not only applied to single sites, but to the
up for a period during which the peat plateau is stable; other- entire sub-Arctic where peat plateaus occur today. However,
wise, lateral thermokarst will already occur during the model our multi-tile setup clearly produces different thaw dynam-
spin-up phase. For Scandinavia, the ideal period would be the ics at the scale of individual sites, which might affect the
Little Ice Age, when most of the present-day peat plateaus modeled carbon balance. To investigate this issue further, a
were formed (Kjellman et al., 2018). Future studies should multi-tile model coupled to a carbon cycling scheme would
therefore investigate if the simple multi-tile setup can cap- be required.
ture changes in peat plateau stability in the transition from
the Little Ice Age to the warmer conditions of the 20th cen-
tury during which peat plateaus in Finnmark likely entered 6 Conclusion
their current state of accelerating degradation (e.g., Borge et
al., 2017). Further benchmark simulations with the multi-tile We present field measurements and numerical modeling of
model could focus on peat plateau areas in colder climates lateral thermokarst patterns of the Šuoššjávri peat plateau
that are still stable today. A significant challenge, in particu- in northern Norway. We use high-resolution digital eleva-
lar for model simulations on long timescales (e.g., extending tion models derived from drone-based photogrammetry to
to the Little Ice Age), is to obtain accurate enough model quantify changes of surface elevations of the plateau between
forcing, as biases in the model forcing could shift or even September 2015 and 2018. The study shows that the edges of
mask climatic thresholds for peat plateau stability. the peat plateau are hot spots for thermokarst, where 77 % of
the total measured volume change occurred, while most of
5.3.3 Permafrost modeling with Earth system model the total plateau surface does not show detectable changes in
land surface schemes surface elevation. Lateral thermokarst is therefore the main
pathway for the degradation of the peat plateau. We show
Most land surface models (LSMs) that simulate the future that this retreat corresponds to a normalized annual volumet-
response of permafrost to climate change rely on simplified ric loss of 0.13 ± 0.07 m3 yr−1 m−1 for the zones we studied.
1D implementations of permafrost thaw dynamics, which ig- Using the CryoGrid3 land surface model we show that
nore subsidence and only reflect gradual top-down thawing these thermokarst patterns can be reproduced numerically
of the frozen ground (Andresen et al., 2020; Burke et al., in a framework that implements lateral redistribution of
2020). Excess ice melt and the resulting microtopography snow, subsurface water and heat, as well as excess ice-melt-
changes exert a major control on the evolution of hydro- triggered subsidence. Overall, the modeled annual volume
logic conditions, which in turn strongly influence the tim- changes are on the same order of magnitude as the measure-
ing of permafrost degradation, as demonstrated for polyg- ments. Based on a steady-state climate forcing, our simula-
onal tundra (Nitzbon et al., 2019, 2020). Aas et al. (2019) tions demonstrate the importance of the shallow snow cover
presented a similar approach for peat plateaus in northern on the plateau due to wind drift of snow to the lower-lying
Norway. It is based on two tiles (one for the wet mire, one mire areas. The modeled peat plateau is fully stable when
for the plateau) and reproduces both climate-induced stabil- all snow on its top is removed towards the mire (0 cm snow
ity and degradation. However, in this approach, the plateau depth on the plateau), whereas its edges retreat at increas-
subsides as a whole when a climate-related threshold is ex- ing rates with increasing snow depths. For the model forcing
ceeded and excess ice begins to melt. This contrasts with applied in our simulations, a maximum of 5–10 cm of snow
our field observations, which show ongoing edge retreat on on the plateau only triggers an edge retreat of 4–5 m within
decadal timescales, while the plateau interior is largely sta- 100 years. A snow cover of 10–20 cm depth fully degrades
ble. Our approach uses a larger number of tiles to explicitly the plateau (assumed 11 m wide) in 100 years, while this time
The Cryosphere, 15, 3423–3442, 2021 https://doi.org/10.5194/tc-15-3423-2021You can also read