Cdc4 phospho-degrons allow differential regulation of Ame1CENP-U protein stability across the cell cycle
←
→
Page content transcription
If your browser does not render page correctly, please read the page content below
RESEARCH ARTICLE

                                   Cdc4 phospho-degrons allow differential
                                   regulation of Ame1CENP-U protein stability
                                   across the cell cycle
                                   Miriam Böhm1, Kerstin Killinger1, Alexander Dudziak1, Pradeep Pant2,
                                   Karolin Jänen1, Simone Hohoff1, Karl Mechtler3,4,5, Mihkel Örd6, Mart Loog6,
                                   Elsa Sanchez-Garcia2, Stefan Westermann1*
                                   1
                                     Department of Molecular Genetics I, Faculty of Biology, Center of Medical
                                   Biotechnology, University of Duisburg-Essen, Essen, Germany; 2Department of
                                   Computational Biochemistry, Faculty of Biology, Center of Medical Biotechnology,
                                   University of Duisburg-Essen, Essen, Germany; 3IMP - Research Institute of
                                   Molecular Pathology, Vienna, Austria; 4Institute of Molecular Biotechnology of the
                                   Austrian Academy of Sciences (IMBA), Vienna Biocenter (VBC), Vienna, Austria;
                                   5
                                     Gregor Mendel Institute (GMI), Austrian Academy of Sciences, Vienna BioCenter
                                   (VBC), Vienna, Austria; 6Institute of Technology, University of Tartu, Tartu, Estonia

                                   Abstract Kinetochores are multi-subunit protein assemblies that link chromosomes to
                                   microtubules of the mitotic and meiotic spindle. It is still poorly understood how efficient,
                                   centromere-dependent kinetochore assembly is accomplished from hundreds of individual protein
                                   building blocks in a cell cycle-dependent manner. Here, by combining comprehensive
                                   phosphorylation analysis of native Ctf19CCAN subunits with biochemical and functional assays in the
                                   model system budding yeast, we demonstrate that Cdk1 phosphorylation activates phospho-
                                   degrons on the essential subunit Ame1CENP-U, which are recognized by the E3 ubiquitin ligase
                                   complex SCF-Cdc4. Gradual phosphorylation of degron motifs culminates in M-phase and targets
                                   the protein for degradation. Binding of the Mtw1Mis12 complex shields the proximal phospho-
*For correspondence:               degron, protecting kinetochore-bound Ame1 from the degradation machinery. Artificially
Stefan.Westermann@uni-due.de       increasing degron strength partially suppresses the temperature sensitivity of a cdc4 mutant, while
Competing interests: The           overexpression of Ame1-Okp1 is toxic in SCF mutants, demonstrating the physiological importance
authors declare that no            of this mechanism. We propose that phospho-regulated clearance of excess CCAN subunits
competing interests exist.         facilitates efficient centromere-dependent kinetochore assembly. Our results suggest a novel
                                   strategy for how phospho-degrons can be used to regulate the assembly of multi-subunit
Funding: See page 27
                                   complexes.
Received: 09 February 2021
Preprinted: 16 February 2021
Accepted: 24 July 2021
Published: 26 July 2021

Reviewing editor: Silke Hauf,
                                   Introduction
Virginia Tech, United States       Kinetochores form a dynamically regulated binding interface between chromosomes and the mitotic
                                   spindle, a connection that is essential to partition the genetic material equally during cell division
   Copyright Böhm et al. This
                                   (Biggins, 2013). As chromatin-bound multi-protein complexes, kinetochores assemble exclusively at
article is distributed under the
                                   centromeres. Biochemical experiments have elucidated the connectivity between multiple subcom-
terms of the Creative Commons
Attribution License, which         plexes in the context of an assembled kinetochore (Musacchio and Desai, 2017), and structural biol-
permits unrestricted use and       ogy has started to define the organization of these building blocks at atomic resolution
redistribution provided that the   (Hinshaw and Harrison, 2019; Yan et al., 2019). It is, however, still poorly understood how kineto-
original author and source are     chore proteins first assemble into stable subcomplexes and then associate into higher-order struc-
credited.                          tures with the correct stoichiometry specifically at the centromere.

Böhm et al. eLife 2021;10:e67390. DOI: https://doi.org/10.7554/eLife.67390                                                       1 of 30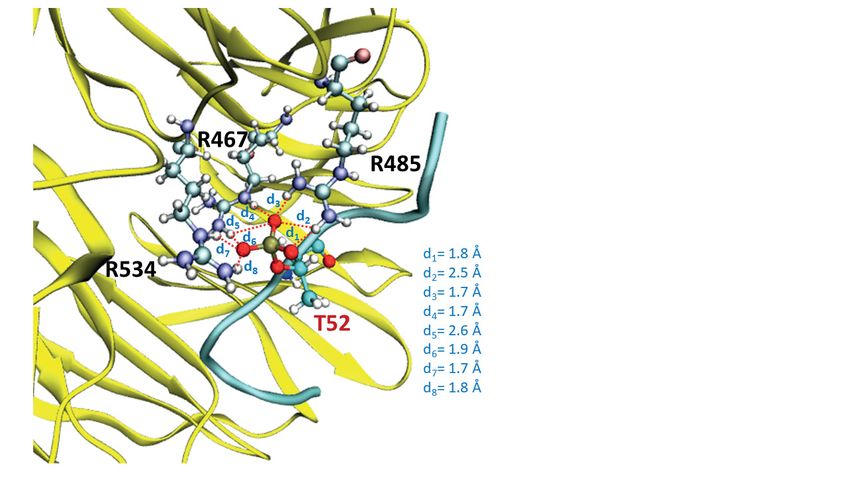
Research article                                                                 Cell Biology Chromosomes and Gene Expression

                                       Budding yeast centromeres are attached to kinetochore microtubules during almost the entire
                                   vegetative cell cycle. Upon replication, kinetochores assemble quickly on both sister chromatids to
                                   ensure effective bi-orientation. Live cell imaging experiments suggest that kinetochore assembly
                                   upon replication of centromere DNA occurs rapidly and is completed within 10–15 min
                                   (Tanaka et al., 2007). This is remarkable as even the relatively simple kinetochores in budding yeast
                                   consist of more than 40 different proteins. These protein subunits assemble in two layers: the inner
                                   kinetochore comprises 16 subunits, which are collectively called the constitutive centromere-associ-
                                   ated network (CCAN, or Ctf19CCAN in budding yeast). The CCAN contains the essential protein
                                   Mif2CENP-C, which contacts and organizes many other subunits of the CCAN (Klare et al., 2015)
                                   and, among other subcomplexes, the COMA complex, which consists of the conserved subunits
                                   Ctf19CENP-P, Okp1CENP-Q, Mcm21CENP-O, and Ame1CENP-U, of which Ame1 and Okp1 are essential
                                   for cell viability in budding yeast (Hornung et al., 2014). The CCAN directly binds to a specialized
                                   nucleosome by recognizing the histone H3 variant Cse4CENP-A via the Mif2 and Ame1-Okp1 subunits
                                   (Anedchenko et al., 2019; Fischböck-Halwachs et al., 2019; Killinger et al., 2020).
                                       The outer kinetochore forms a microtubule-binding layer with the KMN network at its core. As
                                   this network lacks DNA-binding proteins, it relies on the CCAN for centromere recruitment. The
                                   Knl1c (Spc105c in yeast), Mis12c (Mtw1c in yeast), and Ndc80c subcomplexes are necessary to effi-
                                   ciently couple dynamic microtubules to centromeres (Cheeseman et al., 2006; Musacchio and
                                   Desai, 2017) and also form a regulated recruitment platform for components of the spindle assem-
                                   bly checkpoint (SAC) (Joglekar, 2016; London et al., 2012). The outer yeast kinetochore also
                                   includes a ring-forming protein complex called the Dam1c, which is required for robust coupling of
                                   the KMN network to dynamic microtubules (Lampert et al., 2013; Tien et al., 2010).
                                       A number of control mechanisms for kinetochore assembly have been described, and the best
                                   studied examples have defined the regulation of the histone H3 variant Cse4CENP-A. High levels of
                                   Cse4CENP-A lead to its mis-incorporation into non-centromeric loci (Heun et al., 2006;
                                   Ranjitkar et al., 2010; Van Hooser et al., 2001) and can promote the formation of ectopic kineto-
                                   chores and genetic instability (Amato et al., 2009; Hildebrand and Biggins, 2016). In budding
                                   yeast, Cse4CENP-A protein levels are controlled via regulated proteolysis involving the E3 ubiquitin
                                   ligase Psh1, which prevents mis-incorporation of Cse4 into chromosome arms (Ranjitkar et al.,
                                   2010). Additional links between the ubiquitin-proteosome system and kinetochore assembly in bud-
                                   ding yeast are provided by the Mub1/Ubr2 E3 ligase complex, which regulates the level of the Dsn1
                                   subunit (Akiyoshi et al., 2013). Whether similar regulatory systems operate for other kinetochore
                                   subunits and how they may contribute to kinetochore assembly is currently not known.
                                       Phospho-regulation plays an important role for multiple aspects of kinetochore function. The
                                   Ipl1AuroraB kinase regulates kinetochore-microtubule attachments during error correction to ensure
                                   sister chromatid bi-orientation, and it also promotes kinetochore assembly by phosphorylating the
                                   Mis12c subunit Dsn1 (Dimitrova et al., 2016). The major regulator of the mitotic cell cycle
                                   Cdc28Cdk1, on the other hand, promotes outer kinetochore assembly in human cells by stimulating
                                   the phospho-dependent recruitment of Ndc80 via CENP-T (Huis In ’t Veld et al., 2016;
                                   Nishino et al., 2013). By contrast, in budding yeast the Cnn1-Ndc80c interaction is negatively regu-
                                   lated by Mps1 phosphorylation (Malvezzi et al., 2013). Apart from these examples, however, it is
                                   still unclear how phospho-regulation is linked to cell cycle progression and which aspects of kineto-
                                   chore function may be affected.
                                       Here we set out to define mechanisms of phospho-regulation in the context of the budding yeast
                                   inner kinetochore. We identify multiple Cdk1 substrates in the yeast Ctf19CCAN complex and demon-
                                   strate that a subset of these sites constitute phospho-degron motifs that are activated in a cell cycle-
                                   dependent manner and recognized by the SCF-Cdc4 E3 ubiquitin ligase complex. Our results reveal
                                   a molecular link between the core cell cycle machinery and key protein subunits of the inner kineto-
                                   chore that serves to couple kinetochore subunit turnover to cell cycle progression.

Böhm et al. eLife 2021;10:e67390. DOI: https://doi.org/10.7554/eLife.67390                                                         2 of 30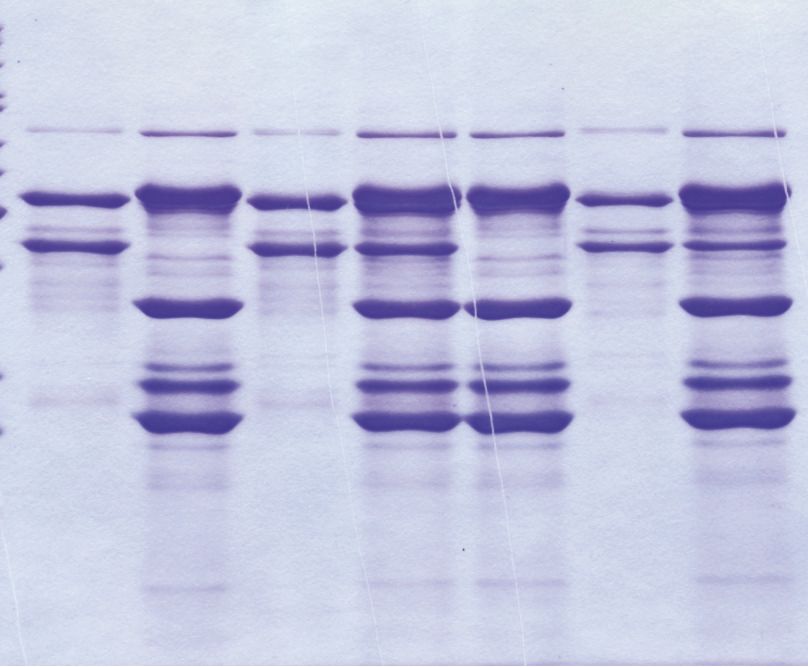
Research article                                                                          Cell Biology Chromosomes and Gene Expression

Table 1. Analysis of Ctf19CCAN phosphorylation in yeast extracts.
Native constitutive centromere-associated network (CCAN) phosphorylation sites detected after purification of TAP-tagged kineto-
chore subunits from yeast extracts. For details, see Figure 1—source data 1.
S.c.CCAN subunit     Human homolog     % sequence coverage    Total P-sites detected   Minimal Cdk1 sites detected (S/T)P   Full Cdk1 sites detected (S/TP_K/R)

Ame1                 CENP-U            79                     8                        4 (T31, S41, S45, S53)               -

Okp1                 CENP-Q            85                     6                        -                                    -

Mcm21                CENP-O            92                     3                        -                                    1 (S139)

Ctf19                CENP-P            80                     1                        -                                    -

Nkp1                 -                 97                     3                        -                                    1 (S222)

Nkp2                 -                 89                     -                        -

Chl4                 CENP-N            98                     3                        1 (S281)                             -

Iml3                 CENP-L            95                     -                        -                                    -

Ctf3                 CENP-I            75                     -                        -                                    -

Mcm22                CENP-H            97                     -                        -                                    -

Mcm16                CENP-K            93                     -                        -                                    -

Cnn1                 CENP-T            90                     17                       2 (T42, S192)                        2 (T21, S177)

Mhf1                 CENP-S            93                     3                        1 (T34)                              -

Mhf2                 CENP-X            95                     1                        1 (S60)                              -

                                     Results
                                     Mapping of native phosphorylation sites identifies multiple candidate
                                     Cdk1 substrates in the yeast CCAN
                                     To investigate the phosphorylation status of native yeast CCAN subunits, we affinity-purified TAP-
                                     tagged components representing major CCAN subcomplexes (Chl4CENP-N-TAP, Mcm16CENP-H-TAP,
                                     Cnn1CENP-T-TAP, Mhf1CENP-S-TAP, Mhf2CENP-X-TAP) from log-phase yeast extracts and identified
                                     phosphorylation sites by mass spectrometry. In total, this analysis detected more than 70 phosphory-
                                     lation sites on nine different CCAN subunits (Table 1, Figure 1—source data 1). Of these sites, nine
                                     followed the minimal consensus motif for Cdk1 phosphorylation (S/TP), while four sites (in the subu-
                                     nits Mcm21CENP-O, Nkp1, and Cnn1CENP-T) followed the full Cdk1 consensus (S/TP_K/R). While Cdk1
                                     phosphorylation of Cnn1 has been described before (Bock et al., 2012; Schleiffer et al., 2012), our
                                     analysis identified Ame1 as a candidate Cdk1 target, with a cluster of four minimal Cdk1 sites being
                                     phosphorylated in the N-terminus of the protein.

                                     The essential CCAN subunit Ame1CENP-U is a Cdk1 substrate in vivo and
                                     in vitro
                                     Since Ame1 was the only essential protein among the candidate Cdk1 substrates and the cluster of
                                     Cdk1 phosphorylation sites is located close to the Mtw1c binding domain, we focused our analysis
                                     on this subunit (Figure 1A). We phosphorylated recombinant Ame1-Okp1 complex (AOc) with puri-
                                     fied Cdc28-Clb2 (M-Cdk1) or Cdc28-Clb5 (S-Cdk1) in vitro and mapped phosphorylation sites by
                                     mass spectrometry (Figure 1—source data 2). Ame1 displayed a noticeable shift in migration in
                                     SDS-PAGE upon phosphorylation with Cdc28-Clb2, but less so with Cdc28-Clb5 (Figure 1B). Quanti-
                                     tative phosphorylation analysis confirmed that in the Ame1-Okp1 complex Clb2-Cdk1 preferentially
                                     phosphorylated Ame1, whereas Clb5-Cdk1 preferred Okp1. The phosphorylation of the Ame1-Okp1
                                     complex was dependent on the hydrophobic patch, a known substrate docking region in Clb5 and
                                     Clb2 cyclins, and a slightly stronger docking potentiation was seen in case of Okp1 (Figure 1—fig-
                                     ure supplement 1A).
                                        The mapped phosphorylation sites closely corresponded to the sites detected on native Ame1, in
                                     particular phosphorylation of the residues Thr31, Ser41, Ser45, and Ser52/Ser53 was both detected
                                     in vivo and in vitro (Figure 1C). In case of Ser52/Ser53 either one, or both adjacent sites may be
                                     phosphorylated. Conservation of these phospho-sites can be detected in the most closely related

Böhm et al. eLife 2021;10:e67390. DOI: https://doi.org/10.7554/eLife.67390                                                                           3 of 30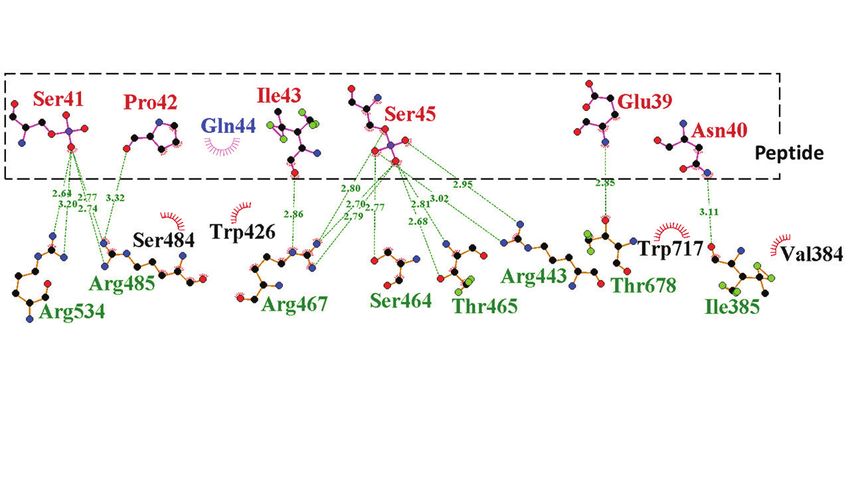
Research article Cell Biology Chromosomes and Gene Expression
A
Mtw1c Mtw1
7A or 7E complex
COMA-complex
1 15 199 254 324
Ame1
Okp1
T31
S41
S45
S59
S101
S277
S323
S52S53
N-term CC
Ame1
B C
AOc Cdk1-Clb2
- + - Cdk1-Clb2 Mcm21
residue sequence in vivo in vitro
- - + Cdk1-Clb5
kDa + + + ATP T31 FKTPNA + +
170 S41 ENSPIQ + + Ctf19
130 Ame1 7A S45 IQSPVQ + +
or S52 ILSSPK ? ?
100 CEN nucleosome
7E S53 ILSSPKL + +
70 * S59 ANSFE +
Okp1 S101 SESPQN +
55
S277 QDSED +
Ame1 S323 LQPSL +
25 E
YEPD YEPD + rapamycin
15 AA background
Coomassie -
Ame1-FRB
D + Ame1-WT
control
Ame1 variant + Ame1-7E
WT 7A 7E + Ame1-7A
kDa
30 °C
70 Ame1-7E
55 Ame1-WT F
Ame1-7A YEPD YEPD + rapamycin
AA background
35
- phospho-cluster
α-Flag
kDa + Ame1-WT AME1
+ Ame1-∆1-15
Ame1-FRB
1-15
70 Ame1-7E
phospho + Ame1-∆31-75 31-75
isoforms
55 Ame1-WT + Ame1-∆31-89 31-89
Ame1-7A
+ Ame1-∆31-116 31-116
35
+ Ame1-∆31-187 31-187 AME1
longer exposure α-Flag
30 °C
Figure 1. Phosphorylation analysis of the essential constitutive centromere-associated network (CCAN) subunit Ame1. (A) Organization of the essential
CCAN component Ame1CENP-U and localization of phosphorylation sites. Ame1 shows a Cdk1 phosphorylation cluster (T31, S41, S45, S52, S53, S59,
S101) at the N-terminus. The first 15 amino acids are essential for Mtw1c binding, the coiled-coil region (aa 199–254) is required for heterodimerization
with Okp1CENP-Q. Schematic overview on the right shows the four-protein complex COMA, consisting of Ame1CENP-U, Okp1CENP-Q, Ctf19CENP-P, and
Mcm21CENP-O. The COMA complex binds to the outer kinetochore component Mtw1 complex and to the centromeric nucleosome. (B) In vitro kinase
assay with recombinant Ame1-Okp1c with either Cdk1-Clb2 or Cdk1-Clb5. The migration pattern of Ame1 is shifted to a slowly migrating form when
incubated with Cdk1-Clb2. Asterisk denotes a contaminating protein. (C) List of all mapped Ame1 phosphorylation sites either in vivo or in vitro. T31,
S41, S45, S53, and S101 show the minimal motif for Cdk1 (S/TP). (D) Stably integrated Ame1 variants display distinct migration patterns in SDS-PAGE.
Ame1-WT shows multiple slowly migrating forms that are eliminated in Ame1-7A and Ame1-7E. (E) Serial dilution assay of Ame1 variants using the FRB
anchor-away system. Ame1-WT and both mutants can rescue the growth defect when endogenous Ame1 is anchored away from the nucleus. (F) Serial
dilution assay of internal Ame1 truncation mutants in the anchor-away system.
The online version of this article includes the following source data and figure supplement(s) for figure 1:
Source data 1. Mass spectrometry analysis of native constitutive centromere-associated network (CCAN) complexes.
Source data 2. Mass spectrometry analysis of in vitro phosphorylated COMA.
Figure supplement 1. Quantitative phosphorylation analysis of recombinant Ame1-Okp1 by S-Cdk1 and M-Cdk1 complexes.
Saccharomyces species (Figure 1—figure supplement 1B). For the subsequent analysis, we focused
on seven N-terminal phosphorylation sites as the two C-terminal sites Ser277 and Ser323 were not
phosphorylated by Cdc28-Clb2 in vitro. To analyze the functional role of Ame1 phosphorylation, we
mutated the cluster to either alanine (Ame1-7A) or glutamic acid (Ame1-7E) to eliminate or mimic
phosphorylation, respectively. We integrated Flag-tagged Ame1 constructs under their endogenous
Böhm et al. eLife 2021;10:e67390. DOI: https://doi.org/10.7554/eLife.67390 4 of 30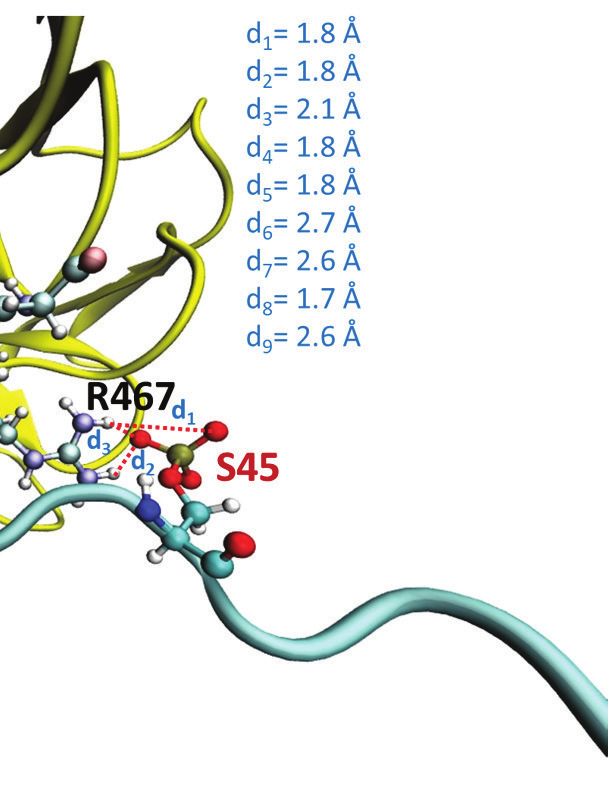
Research article                                                                 Cell Biology Chromosomes and Gene Expression

                                   promoter with these mutations into yeast and analyzed cell extracts by western blotting. Analysis of
                                   log phase extracts showed that wild-type Ame1 displayed multiple slowly migrating forms that were
                                   eliminated in the 7A mutant (Figure 1D). By contrast, Ame1-7E migrated much more slowly than
                                   wild-type, its position in SDS-PAGE corresponding to the most slowly migrating forms of Ame1-WT.
                                   Ame1-7A and -7E mutants were viable when expressed as the sole source of Ame1 in the cell. In an
                                   anchor-away approach, in which endogenous Ame1 is removed from the nucleus upon addition of
                                   rapamycin, both Ame1-7A and -7E variants supported viability with little difference in growth rate
                                   on rich media compared to wild-type Ame1 (Figure 1E). Analysis of internal truncations, which main-
                                   tained the essential Mtw1c-binding N-terminus (residues 1–15), showed that deleting the region har-
                                   boring the entire phospho-cluster (D31–116) yielded a slow growth phenotype, while a more
                                   extensive deletion was inviable (Figure 1F). We conclude that Ame1 phosphorylation is not required
                                   for viability, but the N-terminus contributes to an important aspect of Ame1 function, even when the
                                   Mtw1-binding domain is retained. This function may either be sequence-specific, lie in the correct
                                   positioning of the N-terminus, or involve a combination of both of these aspects.

                                   Non-phosphorylatable Ame1 mutants accumulate to increased protein
                                   levels
                                   During our cellular characterization experiments for Ame1 phospho-mutants, we expressed wild-
                                   type or mutant versions of Ame1, along with its binding partner Okp1 from a two-micron plasmid
                                   under control of a galactose-inducible promoter (Figure 2A). Western blot analysis showed that
                                   wild-type Ame1 gradually accumulated over the course of 5 hr after switching the cells to galactose.
                                   Strikingly, the non-phosphorylatable Ame1-7A mutant accumulated to much higher protein levels in
                                   the same time span, leading to a roughly fourfold increase in steady-state level compared to wild-
                                   type after 5 hr in galactose (Figure 2B, C). In this experiment, the Ame1-7E mutant behaved similar
                                   to the -7A mutant, suggesting that it may constitute a phospho-preventing rather than a phospho-
                                   mimetic mutation (Figure 2B). By contrast, Okp1 expressed from the same plasmid showed no
                                   change in protein level in the different Ame1 mutants, arguing that differences in plasmid stability or
                                   mitotic retention cannot be the cause for the observed effect on the Ame1 protein level. In order to
                                   simplify quantification of the Ame1 signal, whole-cell extracts were treated with lambda phospha-
                                   tase. This resulted in a collapse of the slowly migrating forms of Ame1-WT. Quantification of protein
                                   levels after phosphatase treatment confirmed a fourfold increase in the steady-state level of Ame1-
                                   7A in the wild-type strain background (Figure 2—figure supplement 1A).
                                      The mitotic checkpoint delays anaphase onset until all kinetochores have achieved correct attach-
                                   ment to the spindle. We analyzed overexpression of Ame1-Okp1 wild-type or phosphorylation
                                   mutants in strains lacking the checkpoint component mad1. This mutant should eliminate mitotic
                                   delays that could in principle contribute to protein level differences. This experiment confirmed the
                                   accumulation of Ame1 phosphorylation mutants (Figure 2—figure supplement 1C). As the steady-
                                   state protein level is determined by the rate of protein translation versus degradation, and the rate
                                   of production should be unaffected in these experiments, we reasoned that non-phosphorylatable
                                   Ame1 mutants may accumulate due to impaired protein degradation. The levels of Cse4, part of the
                                   centromeric nucleosome and a direct binding partner of Ame1-Okp1, have been shown to be regu-
                                   lated by ubiquitin-dependent proteolysis via the E3 ubiquitin ligase Psh1 (Ranjitkar et al., 2010).
                                   Levels of GAL-overexpressed Ame1-WT, however, remained low in a psh1D strain background, while
                                   Ame1-7A and -7E accumulated as in the wild-type background (Figure 2—figure supplement 1D).
                                   This suggests that Psh1 is not involved in Ame1 level regulation under these conditions. Another E3
                                   ubiquitin ligase complex, Ubr2/Mub1 has been shown to regulate Dsn1, which is a subunit of the
                                   Ame1 binding partner Mtw1c (Akiyoshi et al., 2013). Similar to psh1D, however, Ame1 protein lev-
                                   els were unaffected by the mub1 deletion, and we conclude that Ubr2/Mub1 is not involved in
                                   Ame1 level regulation under these conditions either (Figure 2—figure supplement 1E).

                                   Identification of two phospho-degron motifs in the Ame1 N-terminus
                                   To delineate the contribution of individual phosphorylation sites to Ame1 protein level regulation in
                                   the overexpression setting, we constructed mutants in which we prevented phosphorylation at
                                   selected sites individually or in combination (Figure 2D). Analysis of Ame1 protein levels after 5 hr
                                   of expression in the presence of galactose showed that preventing phosphorylation on Thr31 had

Böhm et al. eLife 2021;10:e67390. DOI: https://doi.org/10.7554/eLife.67390                                                        5 of 30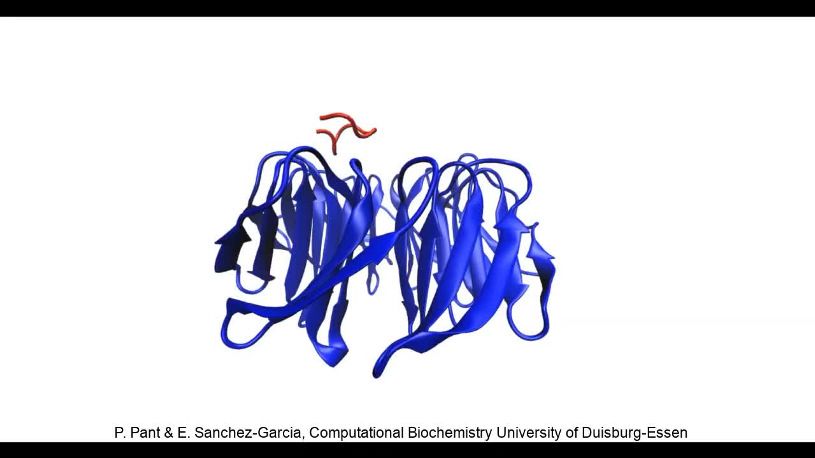
Research article Cell Biology Chromosomes and Gene Expression
A pGAL1/10
1xMyc Okp1 Ame1 1xFlag
overnight shift to add GAL prepare lysates after
WT/7A/7E
in YEP + YEP + YEP + 0, 2 and 5 h in GAL
Dextrose Raffinose Raffinose/Galactose
B control WT 7A 7E C 6
0 2 5 0 2 5 0 2 5 0 2 5 h in GAL
kDa
Ame1-7E
55 WT
4
Level of Ame1
Ame1-WT/7A 7A
35
α-Flag 2
70
Okp1-WT 0
55 0 2 5 h in GAL
α-Myc
E S41A S52A
WT T31A S41A S45A S45A S53A 7A
S52S53
S101
kDa 0 5 0 5 0 5 0 5 0 5 0 5 0 5 h in GAL
S41
S45
S59
T31
D 1 15 150
AME1-N Ame1-WT 55
N-term
Ame1
Ame1-T31A 55
Ame1-4A longer exposure α-Flag
70
Ame1-7A 55 Okp1
α-Myc
Ame1-S41A 5
S45A
4
Ame1-S52A
Level of Ame1
S53A
4A: Ame1-S41A S45A S52A S53A 3
7A: Ame1-T31A S41A S45A S52A S53A S59A S101A
2
F Okp1 wild-type
+ Cdc28-Clb2, ATP, 32P-ATP 1
Ame1 wildt-ype
Ame1-S41A
S45A
Ame1-S52A
S53A
Ame1-T31A
kinase only
0
Ame1-WT
Ame1-4A
Ame1-7A
WT T31A S41A S45A S41A S52A 7A
S45A S53A
kDa
200
150
G
120
100
85
70
60
minimal and more favourable potential Cdc4 phospho-degrons:
50
Okp1 Clb2 Cdk1 motif:
40 Ame1-6xHIS 1) I/L - I/L/P - T - P - P
S/T - P - x - K/R
30 Cdc28 2) T/S - P - X - X - S/T/D/E
25
motif 2 motif 1
Coomassie
200
150
REEN SPIQSP VQP ILSSP KLAN
120
100
85
70
60
50
Okp1 1 15 150 324
40 Ame1-6xHIS
AME1
T31
S41
S45
S52S53
S59
S101
30 N-term
25
Autoradiogram
Figure 2. Identification of phospho-degron motifs in Ame1. (A) Flag- and Myc-tagged versions of Ame1 and Okp1 were expressed from a two-micron
plasmid under a bidirectional galactose-inducible promoter. Under normal growth conditions in YEP + dextrose or YEP + raffinose, no overexpression
occurs, overexpression is only induced by adding galactose (GAL) to the medium. After 0, 2, and 5 hr in GAL, cell extracts were prepared and protein
expression was followed using western blot analysis. (B) Western blot analysis of overexpressed Ame1-WT, -7A, and -7E variants in a wild-type strain
Figure 2 continued on next page
Böhm et al. eLife 2021;10:e67390. DOI: https://doi.org/10.7554/eLife.67390 6 of 30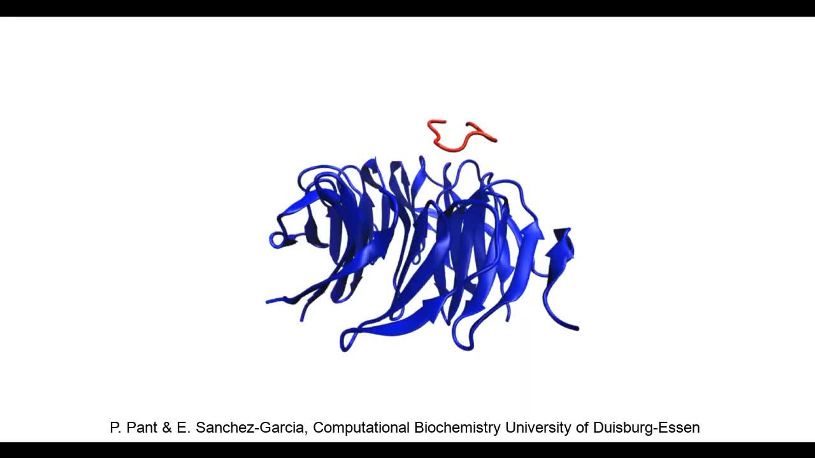
Research article Cell Biology Chromosomes and Gene Expression
Figure 2 continued
background. (C) Quantification of protein levels of Ame1-WT and Ame1-7A after indicated times in galactose medium. Mean values and standard error
of the mean are indicated, n = 7. (D) Overview of Ame1 phospho-mutants used for overexpression studies (E) or in vitro kinase assays (F). (E)
Overexpression studies of individual Ame1 phospho-variants. Ame1 protein levels in this experiment are quantified below, the Ame1-WT level is set to
1. Okp1 levels are stable and used for normalization of Ame1 protein levels. (F) In vitro kinase assay of AO complexes using recombinant Cdk1-Clb2.
Note reduced or lacking phosphorylation of Ame1-4A and -7A, respectively. Also Okp1 can be phosphorylated by Cdk1-Clb2. (G) Cdk1 target sites in
Ame1 resemble two different types of phospho-degrons motifs that are recognized by the E3 ubiquitin ligase complex SCF-Cdc4.
The online version of this article includes the following figure supplement(s) for figure 2:
Figure supplement 1. Additional analysis of Ame1 overexpression.
Figure supplement 2. Additional analysis of AO in vitro phosphorylation by Cdc28-Clb2.
relatively little effect on Ame1 level when compared to the wild-type. By contrast, preventing phos-
phorylation at Ser41, Ser45, or Ser52/53 led to accumulation of the protein, roughly similar to pre-
venting phosphorylation altogether in the 7A mutant (Figure 2E). We prepared the analogous Ame1
mutants as recombinant Ame1-Okp1 (AO) complexes for in vitro kinase assays to evaluate the contri-
bution of these individual sites to overall Ame1 phosphorylation. Autoradiographs showed that in
addition to Ame1 also Okp1 can be phosphorylated by Cdc28-Clb2 (Figure 2F, see also Figure 1—
figure supplement 1 and Figure 2—figure supplement 2). Ame1-WT appeared as two separated
phosphorylated forms after in vitro phosphorylation. The Ame1-T31A mutant displayed a similar
phosphorylation pattern, while the phosphorylation of Ame1-4A was clearly decreased, with only the
fast migrating Ame1 form remaining. The Ame1-7A mutant completely eliminated Cdc28-Clb2 phos-
phorylation in vitro. Preventing phosphorylation on either Ser41/Ser45 or Ser52/Ser53 allowed some
residual phosphorylation, but clearly decreased phosphorylation compared to wild-type. We con-
clude that the residues responsible for Ame1 level regulation in vivo are major targets for Cdc28
phosphorylation in vitro. Further analysis confirmed that mutating the candidate Cdk1 site Ser26 in
Okp1 to alanine prevented Cdc28 phosphorylation and that the Ame1-7A/Okp1-1A complex was
completely refractory to Cdc28 phosphorylation (Figure 2—figure supplement 2).
Post-translational modification via phosphorylation can be mechanistically linked to the control of
protein stability via the generation of so-called phospho-degrons (Skowyra et al., 1997). The best
studied example for this mechanism is the controlled ubiquitination and degradation of key cell cycle
regulators by modular SCF complexes, using F-box proteins as readers of phosphorylated substrates
(Feldman et al., 1997; Örd et al., 2019a; Örd et al., 2019b). Intriguingly, the Ame1 N-terminal
sequences resembled previously described Cdc4 phospho-degrons: the Ame1 sequence surround-
ing Ser52 and Ser53 (motif 1) showed similarity to a cyclin E-type phospho-degron, comprehensively
described in the context of the Cdk1 inhibitor Sic1 (Kõivomägi et al., 2011; Nash et al., 2001),
while the combination of Ser41/Ser45 (motif 2) resembled a di-phospho-degron with a typical +4
spacing between phosphorylated residues found for example in the acetyltransferase Eco1
(Hao et al., 2007; Lyons et al., 2013; Lyons and Morgan, 2011; Figure 2G).
Molecular dynamics simulations predict Ame1 phospho-peptide binding
to Cdc4
To evaluate candidate degron motifs in Ame1, we performed Gaussian-accelerated molecular
dynamics (GaMD) simulations of Ame1 phospho-peptide binding to the WD40 domain of Cdc4
using as template for initial coordinates the published crystal structure of a cyclin E-derived model
peptide associated with Cdc4 (Orlicky et al., 2003). The analysis of the trajectories allowed us to
predict that the doubly phosphorylated Ser41/Ser45 peptide should be a good Cdc4 binder. Phos-
pho-Ser41 establishes hydrogen bond interactions with the guanidino groups of Arg485 and Arg534
of Cdc4 while phospho-Ser45 of the peptide establishes hydrogen bond interactions with Arg467 of
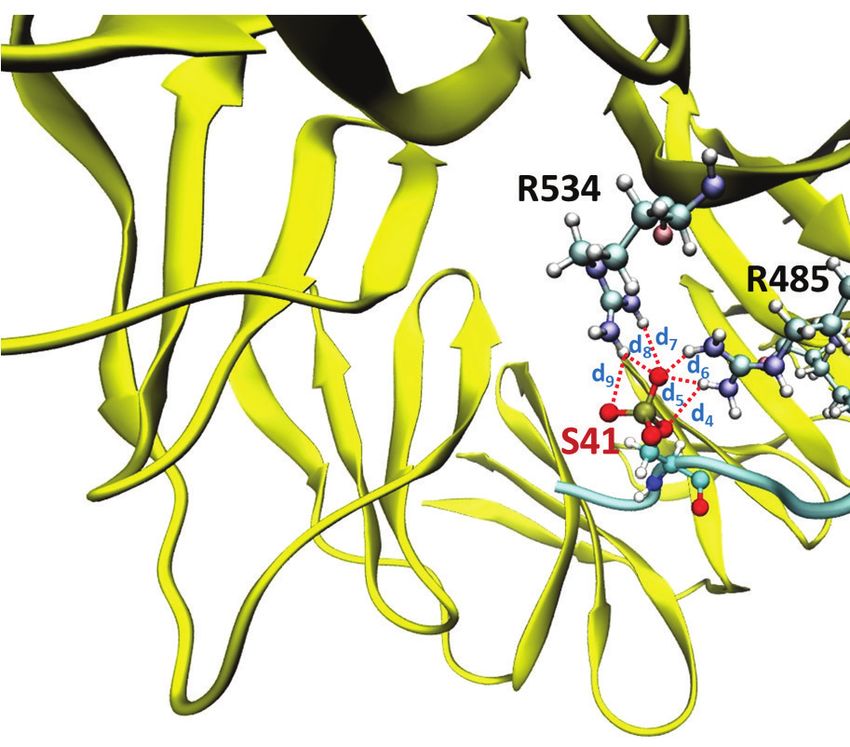
Cdc4 (Figure 3A, Figure 3—figure supplement 1A). Further, phospho-Ser45 is engaged in addi-
tional interactions with Arg443, Ser464, and Thr465 of Cdc4 (Figure 3B). The peptide residues
Pro42, Ile43, Glu39, and Asn40 are also involved in interactions with the protein (Figure 3B). Overall,
the doubly phosphorylated peptide showed a strong hydrogen bond network at the binding pocket
of Cdc4, highlighting the potential of this peptide as a Cdc4 binder.
The simulations also indicated that the doubly phosphorylated Ser41/Ser45 peptide establish
more interactions with Cdc4 with respect to the singly phosphorylated variants (Figure 3—figure
Böhm et al. eLife 2021;10:e67390. DOI: https://doi.org/10.7554/eLife.67390 7 of 30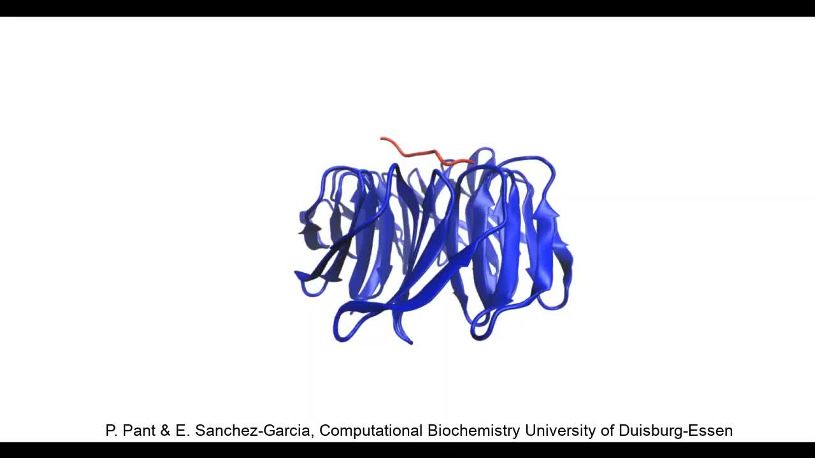
Research article                                                                          Cell Biology Chromosomes and Gene Expression

   A

                                                                                motif 2
                                                                             ENSPIQSPVQ

                                                                      1 15                               150
                                                                                                      AME1

                                                                                   T31
                                                                                   S41
                                                                                   S45
                                                                                S52S53
                                                                                   S59

                                                                                             S101
                                                                       N-term

                                                                                   Ame1 N-terminus
                                         Cdc4 WD40 domain
   B

Figure 3. Gaussian-accelerated molecular dynamics simulations predict Ame1 peptide binding to Cdc4. (A) Interactions between the conserved
arginine residues of Cdc4 (yellow) and the phospho-serine residues of the doubly phosphorylated peptide (cyan). (B) The doubly phosphorylated Ser41/
Ser45 peptide and Cdc4 establish an intense hydrogen bond network involving the phosphorylated residues of the peptide and the conserved arginine
residues of Cdc4, as well as other residues.
The online version of this article includes the following figure supplement(s) for figure 3:
Figure supplement 1. Additional analysis of peptide-Cdc4 interactions by Gaussian-accelerated molecular dynamics simulations.

                                    supplement 1B, Videos 1–3). Furthermore, the protein-peptide complex involving the doubly phos-
                                    phorylated peptide displayed less structural fluctuations during the trajectories compared to the sim-
                                    ulations of Cdc4 with the monophosphorylated peptides, especially the Ser45 phosphorylated
                                    peptide. Accordingly, the doubly phosphorylated Ser41/Ser45 peptide remained attached at the
                                    binding site of the protein by establishing conserved interactions throughout the simulations, unlike
                                    the monophosphorylated peptides that displayed a dynamic behavior with less retention of their
                                    binding motifs (Videos 1–3).

                                    The SCF ligase with the F-box protein Cdc4 regulates Ame1-Okp1
                                    protein levels
                                    To test whether Ame1 level regulation is under control of SCF via phospho-degrons in vivo, we used
                                    different SCF mutant alleles in the GAL overexpression setting, starting with Skp1 as a component
                                    of all modular SCF complexes. All SCF ts alleles were used at the permissive temperature, ensuring
                                    progression through the cell cycle. Western blotting showed that Ame1-WT expressed from the
                                    GAL promoter strongly accumulated in the skp1-3 mutant relative to a wild-type background
                                    (Figure 4A). The phospho-forms of Ame1 were preserved under these conditions, showing that the
                                    skp1-3 mutant uncouples phosphorylation of Ame1 from its degradation. Interestingly, under these
                                    conditions, also an accumulation of Okp1, expressed from the same plasmid, was apparent. Okp1
                                    appeared in two distinctly migrating forms, possibly corresponding to phosphorylation. Combining
                                    the Ame1-7A mutation with the skp1-3 background revealed that the Ame1-7A protein was further
                                    enriched in the skp1-3 background compared to the wild-type strain, demonstrating that Ame1-7A

Böhm et al. eLife 2021;10:e67390. DOI: https://doi.org/10.7554/eLife.67390                                                                  8 of 30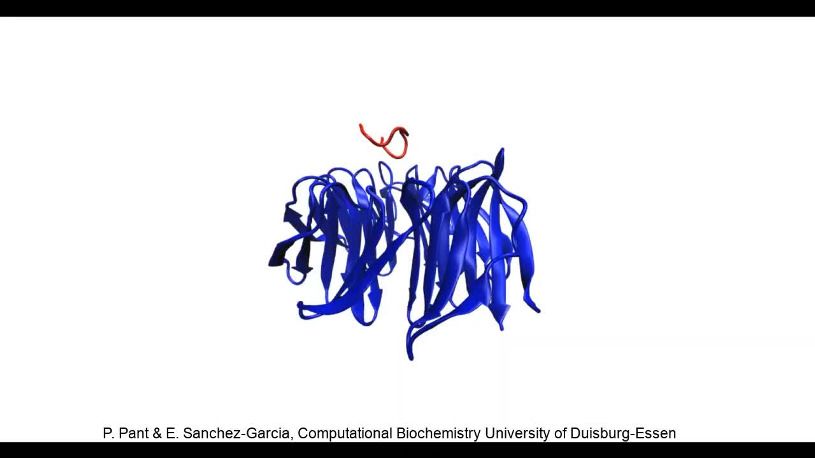
Research article                                                                   Cell Biology Chromosomes and Gene Expression

                                   Video 1. Gaussian-accelerated molecular dynamics       Video 2. Gaussian-accelerated molecular
                                   (GaMD) simulation of the doubly phosphorylated (S41    dynamics (GaMD) simulation of the
                                   and S45) Ame1 peptide (red) binding to WD40 domain     monophosphorylated (S41) Ame1 peptide (red) binding
                                   of Cdc4 (blue).                                        to the WD40 domain of Cdc4 (blue).
                                   https://elifesciences.org/articles/67390#video1        https://elifesciences.org/articles/67390#video2

                                   can be further accumulated by compromising the SCF machinery in addition to preventing phos-
                                   phorylation of Ame1 itself (Figure 2—figure supplement 1B). We extended this analysis to mutant
                                   alleles in other SCF subunits, in particular to identify which F-box protein is responsible for Ame1
                                   regulation. Similar to the skp1-3 mutant, overexpressed Ame1 accumulated in mutant alleles of the
                                   Cullin subunit Cdc53CUL1, the E2 enzyme Cdc34, and the F-box protein Cdc4. By contrast, Ame1 lev-
                                   els remained low (or were even decreased relative to wild-type) in a deletion mutant of the cyto-
                                   plasmic F-box protein Grr1 (Figure 4B). Interestingly, the SCF mutants also had a pronounced effect
                                   on the level of overexpressed Okp1, with particularly strong accumulation (30-fold increase) observ-
                                   able in the cdc4-1 mutant. In the background of the cdc34-2 allele, Okp1 accumulated only slightly
                                   when Ame1 was wild-type, but more strongly when phosphorylation of Ame1 was prevented
                                   (Figure 4B). This indicates that in the context of the Ame1-Okp1 complex, level regulation by phos-
                                   phorylation may occur both in cis (only affecting the subunit itself) or in trans (affecting also an inter-
                                   action partner).
                                       We tested the effect of Ame1-Okp1 expression from a GAL promoter in a serial dilution assay. In
                                   a wild-type strain background, AO overexpression was tolerated well. In a skp1-3 mutant back-
                                   ground, however, overexpression of AO, either in wild-type form or with Cdk1 sites mutated to ala-
                                   nine, compromised growth at 30 and 34˚C (Figure 4C). Similar results were obtained for the cdc34-2
                                   mutant background, in which overexpression of AO already greatly impaired growth at 30˚C. These
                                   effects are consistent with AO being physiological substrates of the SCF machinery, and they show
                                   that accumulation of AO can negatively impact cell growth. While overexpression of Ame1-Okp1 or
                                   Ctf19-Mcm21 (CM) subcomplexes was tolerated in a wild-type strain background, overexpression of
                                                                                        the full four-protein COMA complex was toxic,
                                                                                        indicating that maintenance of the proper protein
                                                                                        level of this complex is critical for viability
                                                                                        (Figure 4D).

                                                                                         Increasing degron strength in the
                                                                                         Ame1 N-terminus partially
                                                                                         suppresses a cdc4 mutant
                                                                                         To further study the regulation of Ame1-Okp1 by
                                                                                         phospho-degrons, we converted the motif 1
                                                                                         degron (ILSSP) of Ame1 into a stronger Cdc4
                                                                                         phospho-degron (ILTPP), which was shown in the
                                   Video 3. Gaussian-accelerated molecular
                                                                                         context of the Cdk1 inhibitor Sic1 to provide the
                                   dynamics (GaMD) simulation of the                     highest binding affinity for Cdc4 (Ame1-
                                   monophosphorylated (S45) Ame1 peptide (red) binding   CPDILTPP; Nash et al., 2001). GaMD simulations
                                   to the WD40 domain of Cdc4 (blue).                    were performed to study the binding of this
                                   https://elifesciences.org/articles/67390#video3       Ame1-derived        peptide       featuring     a

Böhm et al. eLife 2021;10:e67390. DOI: https://doi.org/10.7554/eLife.67390                                                                 9 of 30
Research article Cell Biology Chromosomes and Gene Expression
30
A B WT
25
Level of Okp1
7A
SCF E3 Substrate 20
E2 (Cdc34)
F-Box Grr1 P
15
Cdc4
10
Skp1 Rbx1
5
Cullin (Cdc53)
wild-type
cdc53-1
cdc34-2
skp1-3
cdc4-1
grr1∆
skp1-3 skp1-3
WT 7A WT 7A
0 3 5 0 3 5 0 3 5 0 3 5 h in GAL WT 7A WT 7AWT 7A WT 7A WT 7A WT 7A 5 h in GAL
kDa kDa
55 55
Ame1 Ame1
α-Flag α-Flag
55 55
Ame1 Ame1
longer exposure α-Flag longer exposure α-Flag
α-Myc
55 Okp1 55
Okp1
α-Myc α-Myc
Ponceau S Ponceau S
SD doHIS SRG doHIS SD doHIS SRG doHIS
C
pESC-empty
wild-type
Ame1-WT+Okp1-WT
Ame1-7A+Okp1-WT
Ame1-7A+Okp1-1A
pESC-empty
skp1-3
Ame1-WT+Okp1-WT
Ame1-7A+Okp1-WT
Ame1-7A+Okp1-1A
30 °C 34 °C
pESC-empty
wild-type
Ame1-WT+Okp1-WT
Ame1-7A+Okp1-WT
Ame1-7A+Okp1-1A
pESC-empty
cdc34-2
Ame1-WT+Okp1-WT
Ame1-7A+Okp1-WT
Ame1-7A+Okp1-1A
30 °C 34 °C
D pGal constructs SD doHIS/doURA SRG doHIS/doURA SD doHIS/doURA SRG doHIS/doURA
wild-type
Ame1+Okp1
Ctf19+Mcm21
Ame1+Okp1 Ctf19+Mcm21
25 °C 30 °C
Figure 4. SCF-Cdc4 regulates Ame1-Okp1 protein levels in vivo. (A) Model of substrate binding to SCF complexes. SCF is composed of Skp1, Cdc53
(Cullin), Rbx1, an F-box protein (e.g., Cdc4 or Grr1), and here with the E2 enzyme Cdc34. Lower panel: overexpression of Ame1-WT leads to
accumulation of the protein in a skp1-3 mutant strain over time as compared to a wild-type background. (B) Protein levels of Ame1-Okp1 in different
SCF mutants after overexpression. Note that Ame1 levels remain low in the grr1D mutant (cytoplasmic F-box protein), and that Okp1 strongly
Figure 4 continued on next page
Böhm et al. eLife 2021;10:e67390. DOI: https://doi.org/10.7554/eLife.67390 10 of 30Research article Cell Biology Chromosomes and Gene Expression
Figure 4 continued
accumulates in the cdc4-1 mutant. All alleles were used at the permissive temperature of 30˚C. Quantification of Okp1 protein levels for this experiment
is shown above, Okp1-WT signal was set to 1. (C) Serial dilution assay of overexpressed Ame1-Okp1 variants in wild-type or SCF mutant strain
backgrounds (skp1-3 or cdc34-2). Plates were photographed after 2 days at the indicated temperature. (D) Serial dilution assay of overexpressed Ame1-
Okp1 variants together with Ctf19-Mcm21 in a wild-type strain background. Plates were photographed after 2 days at the indicated temperature.
phosphorylated threonine at position 52 to Cdc4 (sequence VQPILTPPKL, as in the Ser-phosphory-
lated peptides, three replicas, 100 ns each). The analysis of the resulting trajectories indicated that
the peptide establishes conserved interactions at the binding pocket of the protein and remains
bound (Video 4, Figure 5—figure supplement 1A). A representative snapshot of the most popu-
lated cluster of structures, along with the overall population of that cluster, is shown in Figure 5—
figure supplement 1B. The phosphorylated threonine Thr52 establishes a strong hydrogen bond
network with the conserved arginine residues of Cdc4: Arg467, Arg485, and Arg534 (Figure 5A).
Further, Leu56 of the peptide interacts with Arg443 and Thr465 of Cdc4, while the peptide residues
Val47, Pro53, and Pro54 also interact with protein residues (Figure 5—figure supplement 1C).
Additionally, several van der Waals contacts are established between the peptide (through Pro49,
Leu51, Lys55, and Ile50) and Cdc4 (involving Leu637, Thr677, Ile676, Trp717, Ser464, Tyr574, and
Gly636), indicating an optimal fit of the peptide at the protein binding site. Overall, this strong net-
work of peptide-protein interactions indicates that the VQPILTPPKL peptide is predicted to be a
potent Cdc4 binder, even more than the doubly phosphorylated Ser41/Ser45 peptide.
Next, we evaluated the Ame1-CPDILTPP mutation in the GAL overexpression setting. Strikingly,
neither Ame1 nor Okp1 protein was detectable by western blotting upon overexpression under
these conditions, and preventing phosphorylation on the five remaining sites (Ame1-5A-CPDILTPP)
did not stabilize the protein (Figure 5B). If the strong CPD indeed exerts its effect via Cdc4-depen-
dent recognition, then the protein levels of Ame1-CPDILTPP should be restored to wild-type in an
SCF mutant. Combining the Ame1-CPDILTPP allele with the cdc4-1 mutant demonstrated that this is
indeed the case: the Ame1-CPDILTPP mutant and also Okp1 were detectable and displayed similar
levels as the wild-type proteins in a cdc4-1 background (Figure 5B). These experiments provide evi-
dence that protein levels of Ame1 and Okp1 are regulated by activation of phospho-degrons in an
SCF-Cdc4-dependent manner. We also tested the effect of changing motif 1 into a strong CPD in
the context of endogenous Ame1. Interestingly, Ame1-CPDILTPP expressed as the sole copy of
Ame1 yielded a viable strain, which showed slight temperature sensitivity at 37˚C and increased sen-
sitivity to benomyl (Figure 5C). Upon combination with a cdc4-1 mutant, however, Ame1-CPDILTPP
was able to partially suppress the growth defect of cdc4-1 at 34˚C and improved growth in the pres-
ence of hydroxyurea and benomyl. We also examined the relationship between the Ame1-CPDILTPP
allele and other inner kinetochore mutants. Ame1-CPDILTPP only very modestly aggravated the
growth defect of a ctf19 deletion mutant at low temperatures (20˚C). The serial dilution assays also
showed that differences in benomyl hypersensitivity between Ame1 wild-type and Ame1-CPDILTPP
became apparent at 15 and 20 mg/ml benomyl
and were minor compared to the effect of a ctf19
deletion (Figure 5D). Overall, these experiments
show that the Ame1-CPDILTPP allele slightly
reduced fitness in a wild-type strain background,
but conferred a growth advantage to cdc4-1
mutants.
Phospho-degrons of endogenous
Ame1 are activated in a cell cycle-
dependent manner
In the experiments described above, cells were
challenged with increased levels of Ame1 follow- Video 4. Gaussian-accelerated molecular
ing expression from a GAL promoter. How does dynamics (GaMD) simulation of the Ame1-CPDILTPP
this relate to the regulation of endogenous peptide (red), phosphorylated at T52, binding to the
Ame1? To test this, we constructed Ame1 WD40 domain of Cdc4 (blue).
mutants expressed from their endogenous https://elifesciences.org/articles/67390#video4
Böhm et al. eLife 2021;10:e67390. DOI: https://doi.org/10.7554/eLife.67390 11 of 30Research article Cell Biology Chromosomes and Gene Expression
A B
1) change to strong CPD
37 58
REENSPIQSPVQPILSSPKLAN REENSPIQSPVQPILTPPKLAN
1 15 150 324
AME1
N-term
in cdc4-1
WT 5A WT 5A
Ame1 variant
WT 7A CPD CPD CPD CPD
kDa 0 5 0 5 0 5 0 5 0 5 0 5h in GAL
55
Ame1
35
α-Flag
70
55 Okp1
α-Myc
Ponceau S
C YEPD YEPD YEPD YEPD
Ame1-WT
Ame1-WT + cdc4-1
ILTPP
Ame1-CPD
Ame1-CPDILTPP + cdc4-1
25 °C 30 °C 34 °C 37 °C
YEPD + 20 µg/ml benomyl YEPD + HU
Ame1-WT
Ame1-WT + cdc4-1
ILTPP
Ame1-CPD
Ame1-CPDILTPP + cdc4-1
30 °C 30 °C
YEPD + YEPD + YEPD +
D YEPD 10 µg/ml benomyl 15 µg/ml benomyl 20 µg/ml benomyl
Ame1-WT
Ame1-WT + ctf19
Ame1-CPDILTPP
Ame1-CPDILTPP + ctf19
20 °C 30 °C 30 °C 30 °C
Figure 5. Tuning degron strength in the Ame1 N-terminus suppresses a cdc4 mutant. (A) The threonine phosphorylated peptide (VQPILTPPKL, cyan)
establishes a strong network of conserved interactions involving its phosphorylated threonine and the conserved arginine residues of Cdc4
(yellow). This binding is further stabilized by several protein-peptide interactions (Figure 5—figure supplement 1). (B) Changing the phospho-degron
motif 1 into a strong Cdc4-degron sequence (ILSSP to ILTPP) leads to a loss of detectable Ame1-CPD in the overexpression system. Also, note that
Okp1 is not detectable anymore. The cdc4-1 mutant background stabilizes Ame1-CPDILTPP and Okp1. The cdc4-1 allele was used at the permissive
Figure 5 continued on next page
Böhm et al. eLife 2021;10:e67390. DOI: https://doi.org/10.7554/eLife.67390 12 of 30Research article Cell Biology Chromosomes and Gene Expression
Figure 5 continued
temperature of 30˚C. (C) Serial dilution assay of Ame1-WT or Ame1-CPDILTPP in a wild-type or cdc4-1 mutant strain background. Plates were
photographed after 3 days of incubation at the indicated temperature. Note that Ame1-CPD partially suppresses the growth defect of cdc4-1 at 34˚C or
in the presence of benomyl (20 mg/ml) or hydroxyurea. (D) Serial dilution assays of Ame1-CPDILTPP combined with a ctf19 deletion at low temperature
(20˚C) or increasing benomyl concentrations. Plates were photographed after 2 days (30˚C, benomyl) or 3 days (20˚C) of incubation at the indicated
temperature, respectively. Note the benomyl hypersensitivity of Ame1-CPDILTPP relative to the wild-type allele.
The online version of this article includes the following figure supplement(s) for figure 5:
Figure supplement 1. Analysis of an Ame1 peptide with increased degron strength.
promoter. To simplify the complex phosphorylation pattern of wild-type Ame1 (Figure 6—figure
supplement 1A, C), we generated alanine mutants that either allowed phosphorylation of the motifs
1 and 2, but prevented phosphorylation of the remaining sites (Ame1-3A, CPD only), or, conversely,
prevented motif 1 and 2 phosphorylation, but allowed the remaining sites to be phosphorylated
(Ame1-4A, CPD null). Western blotting showed that motif 1/2 phosphorylation of endogenous
Ame1 was cell cycle dependent (Figure 6A). S-phase-arrested cells displayed a single slowly migrat-
ing Ame1 form in addition to unmodified Ame1, while M-phase-arrested cells were maximally phos-
phorylated with two slowly migrating forms becoming apparent. In the Ame1-4A mutant (CPD null),
all slowly migrating forms were eliminated (Figure 6A). We followed Ame1 phosphorylation over the
course of the cell cycle after release from alpha-factor. Consistent with the analysis of the arrests, we
observed that motif 1/2 phosphorylation occurred in a stepwise manner with fully phosphorylated
forms appearing 30 min into the cell cycle. FACS analysis demonstrated that by this time cells had
completed replication and were in M-phase with a 2C DNA content (Figure 6B). Strikingly, phos-
phorylated Ame1 forms gradually diminished between minute 30 and 60 and only unmodified Ame1
and a single slowly migrating form remained (Figure 6B). This indicates that degron motifs on
authentic Ame1 are phosphorylated in a cell cycle-dependent manner and lead to disappearance of
the phosphorylated forms in M-phase. We additionally analyzed Pds1 degradation kinetics in differ-
ent Ame1 mutants over the cell cycle. Ame1-3A phosphorylation was highly reproducible, while
Ame1-4A eliminated all phosphorylation events observable by shift (Figure 6C, D). Interestingly,
Ame1 mutants in which only phosphorylation on motif 1 was allowed (Ame1-5A1) or only on motif 2
(Ame1-5A2) also largely eliminated the characteristic stepwise phosphorylation of Ame1-3A (Fig-
ure 6—figure supplement 1D, E), showing that full phosphorylation is mutually dependent on the
presence of both motif 1 and motif 2. Compared to wild-type, neither of the mutants led to a strong
delay in the cell cycle as judged by Pds1 degradation kinetics or FACS analysis.
To test the involvement of SCF in the regulation of endogenous Ame1, we took advantage of dis-
tinct functionalities of the skp1-3 allele: At the semipermissive temperature of 34˚C, skp1-3 cells
completed replication with nearly wild-type kinetics and accumulated phosphorylated Ame1-3A
(Figure 6E). In contrast to wild-type cells, however, the phosphorylated Ame1 forms persisted and
the cells remained in mitosis with a 2C DNA content. When assayed at the restrictive temperature of
37˚C, skp1-3 cells only slowly progressed to 2C DNA content, indicating they had problems initiating
and completing replication. In this situation, Ame1-3A showed only a singly phosphorylated form in
western blotting and was only slowly phosphorylated to full extent (Figure 6F). Taken together, this
experiment indicates that mitotic Skp1 function is required to eliminate endogenous Ame1 phos-
phorylated at the motifs 1 and 2.
Binding of the Mtw1 complex shields Ame1 phospho-degrons from
Cdk1 phosphorylation
Our analysis described above suggests that Cdk1 phosphorylation targets Ame1 for degradation
during mitosis via SCF. This seems counterintuitive, given the critical function of the kinetochore in
mitosis. The western blot analysis also indicates, however, that only a subset of endogenous Ame1 is
subjected to phosphorylation. Since the phosphorylation cluster is close to the Mtw1 binding site,
we asked how binding of the Mtw1c to Ame1 affects phosphorylation by Cdc28-Clb2 in vitro
(Figure 7A). Analysis of in vitro kinase assays revealed that while Ame1 was heavily phosphorylated
in isolation, inclusion of the Mtw1 complex strongly reduced the incorporation of phosphate into
Ame1 under identical conditions (Figure 7B). This reduction was not due to competing
Böhm et al. eLife 2021;10:e67390. DOI: https://doi.org/10.7554/eLife.67390 13 of 30Research article Cell Biology Chromosomes and Gene Expression
P P
Ame1-3A
P P
A B only CPD phosphorylation allowed
1 15 120 324
AME1-N
S41
S45
S52S53
T31A
S59A
S101A
Ame1-3A (CPD only) Ame1-4A (CPD null) N-term min
log G1 S M log G1 S M cell cycle arrest
kDa 120
Arrest in G1 Release cell extracts
105
with α-factor every 15 minutes
55 Ame1-3A/4A
90
75
α-Flag 0 15 30 45 60 75 90 105 120 min
kDa 60
Tubulin
55 45
Ame1-3A
3A: Ame1-T31A S59A S101A 30
α-Flag 15
4A: Ame1-S41A S45A S52A S53A 55 Tubulin 0
1C 2C
C D DNA content
0 15 30 45 60 75 90 105 120 min 0 15 30 45 60 75 90 105 120 min
kDa kDa
55 Ame1-3A 55 Ame1-4A
55 Ame1- 3A 55 Ame1-4A
longer exposure α-Flag longer exposure α-Flag
Pds1 Pds1
α-Myc α-Myc
E F
skp1-3 background 34°C min skp1-3 background 37°C min
factor 0 15 30 45 60 75 90 105 min 120 factor 0 15 30 45 60 75 90 105 min 120
kDa kDa
105 105
55 55
Ame1-3A 90 Ame1-3A 90
75 75
60 60
55 45 55 45
Ame1-3A Ame1-3A
30 30
longer exposure α-Flag 15 longer exposure α-Flag 15
55 Tubulin 0 55 Tubulin 0
1C 2C 1C 2C
DNA content DNA content
Figure 6. Analysis of endogenous Ame1 phospho-mutants over the cell cycle. (A) Ame1-variants (Ame1-3A, CPD only, allowing phosphorylation at
degron motifs 1 and 2 or eliminating it, Ame1-4A, CPD null) were expressed from the endogenous promoter as the sole copy, and phosphorylation was
analyzed in different cell cycle arrests. Drugs used for the arrests: alpha-factor (1 mg/ml) for G1, hydroxyurea (0.2 M) for S-phase, and nocodazole (15
mg/ml) for M-phase. Ame1-3A shows one slowly migrating form in S-phase and two in M-phase, whereas Ame1-4A eliminates all slowly migrating forms.
(B) Ame1-3A was released from an alpha-factor arrest, and phosphorylation was analyzed by western blotting. Right panel: DNA content analysis by
FACS. Phosphorylation is maximal after 30 min when cells have completed S-phase (right: FACS analysis 15 + 30 min), and phosphorylated forms
disappear when cells are in mitosis (45 + 60 min, dashed box). For phosphorylation pattern of Ame1-WT, see Figure 6—figure supplement 1A. (C, D)
Figure 6 continued on next page
Böhm et al. eLife 2021;10:e67390. DOI: https://doi.org/10.7554/eLife.67390 14 of 30Research article Cell Biology Chromosomes and Gene Expression
Figure 6 continued
Cell cycle analysis of Ame1-3A (C) and Ame1-4A (D). (E) Analysis of Ame1-3A in the skp1-3 mutant at 34˚C (semi-permissive). Note that phosphorylation
at motif 1+ 2 persists in the mutant and cells remain in mitosis with 2C DNA content. (F) Analysis of Ame1-3A in the skp1-3 mutant at 37˚C (restrictive).
Note that under these conditions cells are delayed to complete replication and mainly a single phospho-form of Ame1 is found.
The online version of this article includes the following figure supplement(s) for figure 6:
Figure supplement 1. Cell cycle analysis of Ame1-WT and phosphorylation mutants.
phosphorylation of the Mtw1c as only the Dsn1 subunit seemed to be a minor substrate of Cdc28-
Clb2. We conclude that free AO is the preferred substrate for Cdk1 phosphorylation.
To analyze the effect of Mtw1c binding on Ame1 phosphorylation in cells, we combined Ame1-
3A or Ame1-4A with Mtw1-FRB, which can be anchored away from the nucleus into the cytoplasm
upon addition of rapamycin (Figure 7C). We observed that upon removal of Mtw1 from the nucleus,
phosphorylation at Ame1 degron motifs 1/2 gradually increased over time (Figure 7D). FACS analy-
sis indicated that this increase was not due to a major cell cycle effect caused by Mtw1c removal
from the nucleus (Figure 7—figure supplement 1A). Using this anchor-away setting, we also ana-
lyzed the stability of phospho-forms of Ame1 in the presence (-Rapamycin) or absence of the binding
partner Mtw1c (+Rapamycin). Upon inhibition of protein synthesis by cycloheximide, slowly migrat-
ing forms of Ame1 disappeared over time when Mtw1 was removed from the nucleus (Figure 7E).
As an independent means to generate unbound Ame1, we also analyzed the phosphorylation status
of Ame1 mutants lacking the N-terminal Mtw1c interaction domain. We found that Ame1 variants in
which motif1/2 phosphorylation is permitted (Ame1-3A-DN) display a prominent slowly migrating
form, which is eliminated in the Ame1-4A-DN mutant (Figure 7—figure supplement 1B). Taken
together, these observations are consistent with the notion that unbound Ame1 is the preferred sub-
strate for phosphorylation at motifs 1 and 2 in vivo and that these complexes are susceptible to
degradation.
Discussion
This study reveals novel aspects of phospho-regulation at the budding yeast inner kinetochore. We
show that an important function of Cdk1 phosphorylation is to generate phospho-degron motifs on
selected inner kinetochore subunits, including the essential COMA subunit Ame1, which are then
recognized by the conserved ubiquitin ligase complex SCF with its phospho-adapter Cdc4. We note
that Ame1 and Mcm21 peptides were also identified in a large-scale proteomic study geared
towards enriching peptides simultaneously regulated by phosphorylation and ubiquitination
(Swaney et al., 2013). In this context, ubiquitination of COMA subunits was detected for Okp1 (on
residue Lys57) and Mcm21 (on residue Lys229).
While Cdk1 has been thought to promote kinetochore assembly in most contexts investigated so
far, our study indicates that it can also act as a negative regulator of kinetochore assembly by target-
ing subunits for ubiquitination and subsequent degradation by the proteasome. This seems counter-
intuitive at first, given that kinetochores perform their essential role in segregating sister chromatids
during mitosis. There are, however, important aspects in which the inner kinetochore subunit Ame1
differs from previously studied SCF substrates: while, for example, the Cdk1 inhibitor Sic1 is fully
degraded at the G1-S transition to allow replication initiation, our experiments indicate that only a
subset of Ame1 is phosphorylated and subjected to the SCF-dependent pathway. Our biochemical
experiments furthermore suggest that the pool of Ame1 regulated by this mechanism corresponds
to molecules that are not bound to their binding partner within the kinetochore, the Mtw1c. Such
excess Ame1 subunits were also present in our GAL-induced overexpression setting, in which we ini-
tially characterized the SCF-dependent regulation of Ame1. While this experiment creates an artifi-
cial situation in which the cell is challenged with an increased level of Ame1, this scenario likely also
applies to the natural kinetochore assembly process. To ensure effective assembly during S-phase,
free kinetochore subcomplexes must be present in excess amounts, otherwise they would become
limiting for assembly and prevent the effective formation of a new kinetochore. However, these
excess subunits could pose two challenges: first, they could favor ectopic assembly, which would
lead to genetic instability. This is most critical for complexes that can effectively nucleate the
Böhm et al. eLife 2021;10:e67390. DOI: https://doi.org/10.7554/eLife.67390 15 of 30Research article Cell Biology Chromosomes and Gene Expression
A N
B
+ Cdk1-Clb2, ATP, 32P-ATP
Ame1-WT + Mtw1c
Ame1-7A + Mtw1c
free AO
Ame1-WT
Ame1-WT
Ame1-7A
C
Mtw1c
Mtw1c
C
Cdk1-Clb2 N kDa
200
150
120
100
85
70
60 Dsn1-6xHIS (172-574)
bound AO 50 Okp1 Clb2
40 Ame1-6xHIS
C
Mtw1
Nnf1 Cdk1
C
30
Nsl1
C Mtw1-FRB
25
20
FRB
15
FRB RPL13-FKBP12
Coomassie
200
150
120
+Rapamycin 100
85
70
remove from nucleus 60 Dsn1-6xHIS (172-574)
50
Okp1
40 Ame1-6xHIS
N
N
2 30
2
Ame1-3A 1 Ame1-3A 1 25
20
15
C
C C
C 1 2 3 4 5 6 7
anchor-away Mtw1c and follow phosphorylation at motif 1,2 Autoradiogram
D Mtw1-FRB
E Mtw1-FRB
Ame1-WT
Ame1-7A
control
Ame1-3A Ame1-4A YEPD YEPD + 1 µg/ml Rapa
0 90 180 0 90 180 min in Rapa 0 30 60 90 120 0 30 60 90 120 min in CHX
kDa kDa
70 70
55 Ame1 55 Ame1-3A
α-Flag α-Flag
70 70
55 55
Ame1 Ame1-3A
α-Flag, longer exposure 1 0.9 0.8 0.8 0.7 1 0.9 0.6 0.8 0.4
Ponceau S Ponceau S
Figure 7. Mtw1c binding shields the Ame1 phospho-degron from Cdk1 phosphorylation. (A) Scheme of the kinase assay. Recombinant AO with Ame1-
WT or Ame1-7A is used either alone or in combination with its binding partner Mtw1c. (B) In vitro kinase assay of Ame1-Okp1c alone or preincubated
with Mtw1c and Cdk1-Clb2 shows decreased phosphorylation of Ame1-WT-Okp1c when bound to Mtw1c (lanes 3 + 4). Phosphorylation of Okp1 is
overlapping with phosphorylation of Dsn1 (lanes 4 + 5 + 7). (C) Scheme of the FRB assay. An Mtw1-FRB strain was combined with Ame1-3A or Ame1-4A
Figure 7 continued on next page
Böhm et al. eLife 2021;10:e67390. DOI: https://doi.org/10.7554/eLife.67390 16 of 30Research article Cell Biology Chromosomes and Gene Expression
Figure 7 continued
and Ame1 phosphorylation was analyzed after rapamycin addition. Rapamycin anchors Mtw1-FRB out of the nucleus to the ribosomal anchor RPL13-
FKBP12. (D) Initial rapamycin assay to follow Ame1 phosphorylation over the time of 0, 90, and 180 min after rapamycin addition. Ame1-3A shows
multiple slowly migrating forms that accumulate over time, whereas Ame1-4A eliminates all slowly migrating forms. See Figure 7—figure supplement
1A for a corresponding FACS analysis. (E) The rapamycin assay in combination with cycloheximide (CHX). Cultures were preincubated in YEPD for 2 hr
and in YEPD + rapamycin for 180 min. New protein translation was inhibited by adding CHX (50 mg/ml) to the medium. Cell extracts were prepared
after 0, 30, 60, 90, or 120 min after CHX addition, and Ame1-phosphorylation was analyzed by western blot analysis. Numbers below indicate signal
intensities of the slowly migrating forms of Ame1 of the individual timepoints, normalized to timepoint 0.
The online version of this article includes the following figure supplement(s) for figure 7:
Figure supplement 1. Additional analysis of Ame1 variants lacking binding to the Mtw1 complex.
formation of new kinetochores, such as Cse4. Also COMA might be an important target for regula-
tion in this regard because it is near the top of the assembly hierarchy, contacts multiple other inner
kinetochore subunits (Yan et al., 2019), and contains DNA-binding elements. Second, excess free
subcomplexes may compete with centromere-bound complexes for binding partners, thereby decel-
erating kinetochore assembly and making it less effective. It may therefore be beneficial for the cell
to ‘funnel’ kinetochore assembly towards the centromere by preferentially destabilizing unassem-
bled complexes. As shown in Figure 7, Mtw1c binding of Ame1-Okp1 subcomplexes shields degron
phosphorylation in vitro and Mtw1c removal enhances Ame1 phosphorylation at the discovered
motifs in vivo. This Mtw1c binding sensitive phosphorylation could ensure that only free, unused sub-
complexes are removed by degradation (Figure 8A). From a structural standpoint, kinetochore sub-
complexes typically combine relatively short, structured segments (often coiled-coil domains) with
large unstructured domains that are the preferred targets of phosphorylation. In this context, phos-
pho-degrons could be ideally suited as assembly sensors for kinetochores since they allow to distin-
guish excess subunits from properly assembled ones. By placing individually weak degron signals on
separate subunits, the cell may allow COMA assembly from AO and CM complexes, while phosphor-
ylation of the assembled COMA then creates stronger composite binding sites for Cdc4
(Figure 8A).
In summary, we propose the following model for COMA phospho-regulation by Cdc28Cdk1
(Figure 8B): initial phosphorylation on Ame1 motifs 1 and 2 starts in S-phase but is not complete
before M-phase. This ensures that sufficient free subcomplexes are available for kinetochore assem-
bly. In parallel, the observation that individual degrons on AO or CM are weak permits COMA
assembly from its subcomplexes. In M-phase, full degron phosphorylation destabilizes assembled
COMA complexes, unless they are bound to the Mtw1 complex, which shields the degrons. The
proper timing of phosphorylation is critical in this model. Premature phosphorylation of COMA
would target it for destruction too early, likely compromising kinetochore assembly in S-phase. This
could be the reason why the Ame1 phospho-sites are only gradually phosphorylated in vivo. Con-
versely, placing the stronger CPDILTPP phospho-degron into Ame1 compromised growth in other-
wise wild-type cells, but partially rescued the growth phenotypes of cdc4-1 mutants. This argues
that indeed key mitotic SCF substrates reside at the inner kinetochore. Our study adds to the
description of molecular links between SCF and centromeres. Notably, a recent study has identified
Cse4 as an SCF substrate in budding yeast and shown that Cse4 overexpression aggravates the
growth defects of SCF mutants (Au et al., 2020). Moreover, assembly and turnover of CBF3 com-
plexes are defective in SCF mutants and both complexes contain Skp1 as a subunit (Kaplan et al.,
1997). Skp1 mutants also influence the levels of the Mis12 complex at human kinetochores
(Davies and Kaplan, 2010; Gascoigne and Cheeseman, 2013), indicating that SCF-mediated regu-
lation may be a conserved aspect of kinetochore biology.
While our experiments strongly implicate Ame1 as a Cdk1 and SCF substrate, they also show that
the Ame1-7A mutant effectively prevents phosphorylation in vivo and in vitro, but does not induce a
strong mitotic delay such as the skp1-3 mutant. We speculate that the Ame1-7A mutant is not suffi-
cient to fully prevent the mitotic defects of SCF, and additional phospho-targets must exist. We
note that the Ame1-7A mutation leads to an increased Okp1 level in the cdc34-2 mutant back-
ground, suggesting that it contributes to Okp1 level regulation at least under these specific condi-
tions (see Figure 4B). On the other hand, Okp1 itself appears to accumulate even more strongly in
the cdc4-1 mutant than Ame1. This makes it likely that additional, yet undiscovered degron signals
Böhm et al. eLife 2021;10:e67390. DOI: https://doi.org/10.7554/eLife.67390 17 of 30You can also read