S-phase-independent silencing establishment in Saccharomyces cerevisiae - eLife
←
→
Page content transcription
If your browser does not render page correctly, please read the page content below
RESEARCH ARTICLE

                                     S-phase-independent silencing
                                     establishment in Saccharomyces
                                     cerevisiae
                                     Davis Goodnight, Jasper Rine*

                                     Department of Molecular and Cell Biology, University of California, Berkeley,
                                     Berkeley, United States

                                     Abstract The establishment of silent chromatin, a heterochromatin-like structure at HML and
                                     HMR in Saccharomyces cerevisiae, depends on progression through S phase of the cell cycle, but
                                     the molecular nature of this requirement has remained elusive despite intensive study. Using high-
                                     resolution chromatin immunoprecipitation and single-molecule RNA analysis, we found that
                                     silencing establishment proceeded via gradual repression of transcription in individual cells over
                                     several cell cycles, and that the cell-cycle-regulated step was downstream of Sir protein
                                     recruitment. In contrast to prior results, HML and HMR had identical cell-cycle requirements for
                                     silencing establishment, with no apparent contribution from a tRNA gene adjacent to HMR. We
                                     identified the cause of the S-phase requirement for silencing establishment: removal of
                                     transcription-favoring histone modifications deposited by Dot1, Sas2, and Rtt109. These results
                                     revealed that silencing establishment was absolutely dependent on the cell-cycle-regulated
                                     interplay between euchromatic and heterochromatic histone modifications.

                                     Introduction
                                     Inheritance of gene expression state often accompanies the inheritance of genetic content during
*For correspondence:                 cell division. Indeed, the eukaryotic replication fork plays host to the enzymes needed to replicate
jrine@berkeley.edu                   DNA as well as intricate machinery that reassembles chromatin in the wake of replication. However,
                                     during development, cell division is also coupled to the rewiring of gene expression patterns that
Competing interests: The
                                     lead to the generation of new cell types. An understanding of chromatin and epigenetics requires an
authors declare that no
                                     understanding of the mechanisms by which cells can both faithfully transmit chromatin state through
competing interests exist.
                                     cell division, and subvert that inheritance to establish new cell types. The silent chromatin controlling
Funding: See page 19                 mating-type identity in Saccharomyces cerevisiae offers a tractable context for exploring how cell-
Received: 14 May 2020                cycle-regulated chromatin dynamics lead to the establishment of new expression states.
Accepted: 18 July 2020                   The maintenance of the correct mating type in Saccharomyces relies on both the expression of
Published: 20 July 2020              the a or a mating-type genes at the MAT locus and the heterochromatin-mediated silencing of cop-
                                     ies of those same genes at HML and HMR (Herskowitz, 1989). Silencing is dependent on the Silent
Reviewing editor: Tim Formosa,
University of Utah School of
                                     Information Regulator genes, SIR1-4, whose study has led to an understanding of how silencing is
Medicine, United States              achieved (Gartenberg and Smith, 2016; Rine and Herskowitz, 1987). HML and HMR are flanked
                                     by DNA sequences termed silencers, which recruit the DNA-binding proteins Rap1, Abf1, and ORC.
   Copyright Goodnight and
                                     These in turn recruit the Sir proteins via protein-protein interactions. Sir protein recruitment to
Rine. This article is distributed
                                     silencers is followed by the spread of Sir proteins across the multi-kilobase loci by iterative cycles of
under the terms of the Creative
Commons Attribution License,         deacetylation of the tails of histones H3 and H4 by Sir2 and binding of Sir3 and Sir4 to those deace-
which permits unrestricted use       tylated histone tails (Hecht et al., 1995; Hoppe et al., 2002; Rusché et al., 2002).
and redistribution provided that         Despite decades of work, a longstanding puzzle remains at the heart of the mechanism of silenc-
the original author and source are   ing: cells must pass through S phase to establish silencing, but the identity of the elusive cell-cycle-
credited.                            dependent component is unknown (reviewed in Young and Kirchmaier, 2012). Cells with a

Goodnight and Rine. eLife 2020;9:e58910. DOI: https://doi.org/10.7554/eLife.58910                                                      1 of 23
Research article                                                          Chromosomes and Gene Expression Genetics and Genomics

                                   temperature-sensitive sir3-8 allele arrested in G1 cannot repress HMRa1 when switched from the
                                   non-permissive temperature to the permissive temperature, but can when allowed to progress
                                   through the cell cycle (Miller and Nasmyth, 1984). DNA replication per se is not required for silenc-
                                   ing establishment. Excised DNA circles bearing HMR, but no origin of replication, can be silenced if
                                   allowed to pass through S phase (Kirchmaier and Rine, 2001; Li et al., 2001). Thus, some feature of
                                   S-phase, but not DNA replication itself, is crucial for silencing establishment.
                                       Interestingly, low-resolution chromatin immunoprecipitation (ChIP) studies showed that Sir pro-
                                   tein recruitment to HMR can occur with or without cell-cycle progression, suggesting that Sir protein
                                   binding and silencing are not inextricably linked (Kirchmaier and Rine, 2006). If Sir proteins can
                                   bind to a locus but not silence it, then other molecular changes must be required to create silencing-
                                   competent chromatin. In cycling cells undergoing silencing establishment, removal of histone modifi-
                                   cations associated with active transcription occurs over several cell cycles (Katan-Khaykovich and
                                   Struhl, 2005). Furthermore, deletion of genes encoding enzymes that deposit euchromatic histone
                                   marks modulates the speed of silencing establishment in cycling cells (Katan-Khaykovich and
                                   Struhl, 2005; Osborne et al., 2009), suggesting that removal of these marks is a key step in build-
                                   ing heterochromatin. It is unknown whether the removal of euchromatic marks is related to the
                                   S-phase requirement for silencing establishment.
                                       To better understand how chromatin transitions from the active to repressed state are choreo-
                                   graphed, we developed an estradiol-regulated Sir3 fusion protein, which, combined with high-reso-
                                   lution ChIP and RNA measurements, allowed precise experimental analysis of silencing
                                   establishment with single-cell resolution. We characterized the molecular changes that occur during
                                   silencing establishment and identified the genetic drivers of the S-phase requirement for silencing
                                   establishment.

                                   Results
                                   S phase as a critical window for silencing establishment
                                   Previous studies of silencing establishment have used a variety of strategies to controllably induce
                                   silencing establishment, each with its own strengths and weaknesses (see, e.g., Miller and Nasmyth,
                                   1984; Kirchmaier and Rine, 2001; Li et al., 2001; Lazarus and Holmes, 2011). We sought a new
                                   tool to induce silencing that would allow preservation of the structure of the silencers at HML and
                                   HMR and minimally perturb cell physiology upon induction. To do this, we fused the coding
                                   sequence of the estrogen binding domain (EBD) of the mammalian estrogen receptor a to SIR3,
                                   making SIR3’s function estradiol-dependent (Figure 1A; Lindstrom and Gottschling, 2009; Pic-
                                   ard, 1994). Estradiol addition frees the EBD from sequestration by Hsp90, and hence the induction
                                   is rapid because it does not require new transcription or translation (McIsaac et al., 2011). SIR3-EBD
                                   strains grown without estradiol failed to repress HMR, mimicking the sir3D phenotype, while those
                                   grown with estradiol repressed HMR to a similar degree as wild-type SIR3 strains (Figure 1B).
                                       To test whether the SIR3-EBD allele retained the requirement for cell-cycle progression to repress
                                   HMR, estradiol was added to cells that were either cycling or arrested in G1 by a factor. In cycling
                                   cells, silencing establishment of HMR occurred gradually over several hours (Figure 1C). However, in
                                   cells arrested in G1, estradiol led to no measurable repression of HMR, even after many hours
                                   (Figure 1D). Thus, silencing of HMR could not occur without progression through the cell cycle, in
                                   agreement with prior results using other conditional alleles.
                                       Prior work indicated that S phase is a critical window during which cells may undergo partial
                                   silencing establishment (Kirchmaier and Rine, 2001; Lau et al., 2002; Miller and Nasmyth, 1984).
                                   Consistent with this, when we arrested cells in G1, then induced SIR3-EBD and allowed them to pro-
                                   ceed through S phase and re-arrested them at G2/M, HMR was repressed ~60% from its starting lev-
                                   els (Figure 1E). Crucially, the extent of this partial repression was stable over many hours in these
                                   G2/M-arrested cells. Thus, a repression-permissive window or event occurred between G1 and the
                                   beginning of mitosis that allowed partial silencing establishment, and further repression was not pos-
                                   sible while arrested at G2/M. Indeed, after 3 hr in estradiol, cycling cells were repressed >20 fold
                                   from their starting value, compared to only ~3 fold for cells arrested after a single S phase (compare
                                   Figure 1C and E). This requirement for multiple cell cycles to occur before full gene repression was

Goodnight and Rine. eLife 2020;9:e58910. DOI: https://doi.org/10.7554/eLife.58910                                                  2 of 23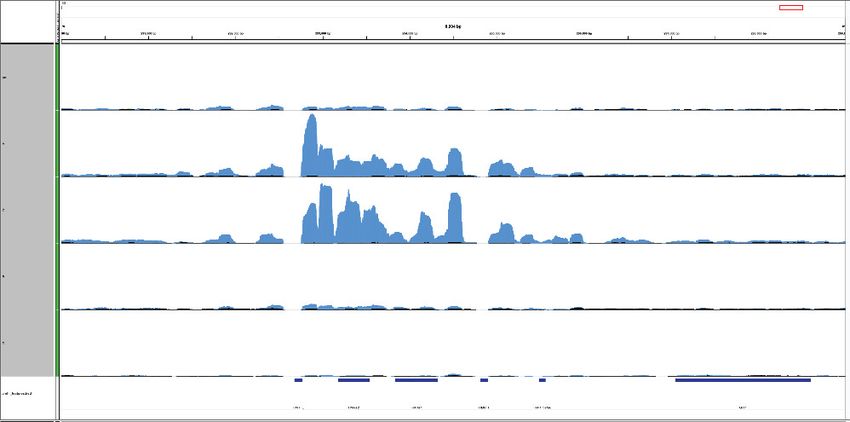
Research article                                                              Chromosomes and Gene Expression Genetics and Genomics

Figure 1. Silencing establishment using SIR3-EBD required S-phase progression. (A) Schematic for SIR3-EBD activation. When estradiol is absent, SIR3-
EBD is kept inactive and HML and HMR are expressed. Upon addition of estradiol, SIR-EBD is activated and HML and HMR are repressed. (B) RT-qPCR
of mRNA from sir3D (JRY12168), SIR3 (JRY12171), and SIR3-EBD (JRY12170) cells grown with ethanol (solvent control) or estradiol (N = 3 for each
condition). Also plotted is the non-reverse-transcribed (no RT) value HMRa1no RT/ALG9 for SIR3 cells , to demonstrate that SIR3 cells and SIR3-EBD cells
grown with estradiol silenced HMRa1 to essentially the limit of detection. (C) SIR3-EBD cultures (JRY12169, JRY12170) were grown to mid-log phase,
then split and grown in medium with either estradiol or ethanol added. Silencing was monitored by RT-qPCR in a time course after estradiol addition.
t = 0 represents the point of estradiol addition for this and subsequent experiments. (D) SIR3-EBD cultures (JRY12169, JRY12170) were arrested in G1
with a factor, then split, with either ethanol or estradiol added. The arrest was maintained for 6 hr, and silencing was assayed by RT-qPCR throughout.
(E) SIR3-EBD cultures (JRY12169, JRY12170; 2 replicates of each genotype) were arrested in G1 with a factor, then split and released to G2/M by
addition of protease and nocodazole in the presence of either ethanol or estradiol. In this and all subsequent figures, dots represent biological
replicates, and the bars/lines represent the averages of biological replicates.
The online version of this article includes the following figure supplement(s) for figure 1:
Figure supplement 1. Effects of cohesin depletion and tT(AGU)C deletion on silencing establishment.
Figure supplement 2. Silencing establishment required S phase at HML*.

                                     consistent with prior studies of silencing establishment both in cell populations and at the single-cell
                                     level (Katan-Khaykovich and Struhl, 2005; Osborne et al., 2009).
                                        Having established the validity of the SIR3-EBD fusion as a tool for studying silencing, we revisited
                                     two mutants that have been reported to bypass cell-cycle requirements for silencing establishment.
                                     In one study, depletion of the cohesin subunit Mcd1/Scc1 allowed for increased silencing in G2/M-
                                     stalled cells (Lau et al., 2002). In another study, deletion of a tRNA gene adjacent to HMR, termed
                                     tT(AGU)C, which is known to bind cohesin, was found to allow partial silencing establishment at
                                     HMR without S-phase progression (Lazarus and Holmes, 2011). Using SIR3-EBD in combination
                                     with an auxin-inducible degron (AID)-tagged Mcd1, we found no effect of depleting cohesin or
                                     deleting the tRNA gene in regulating silencing establishment (Figure 1—figure supplement 1).
                                     Thus, at least for strains using SIR3-EBD, the genetic basis for the cell-cycle requirement for silencing
                                     establishment at HMR remained to be determined. Possible explanations for the discrepancies
                                     between our results and earlier reports are discussed below.
                                        Our finding that tT(AGU)C did not regulate silencing establishment led us to reconsider the
                                     broader claim that HMR is distinct from HML in its requirement of S phase passage for silencing

Goodnight and Rine. eLife 2020;9:e58910. DOI: https://doi.org/10.7554/eLife.58910                                                                3 of 23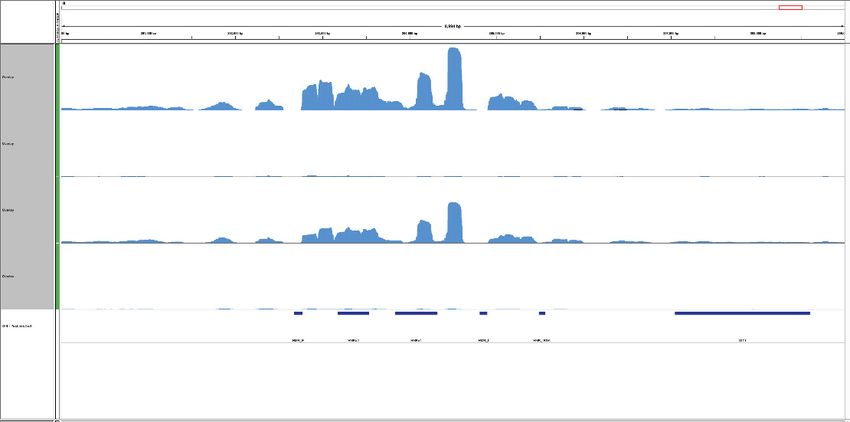
Research article                                                          Chromosomes and Gene Expression Genetics and Genomics

                                   establishment (Lazarus and Holmes, 2011; Ren et al., 2010). Earlier silencing establishment assays
                                   at HML were complicated by the strong silencing-independent repression of HMLa1 and HMLa2 by
                                   the a1/a2 repressor (Herskowitz, 1989; Siliciano and Tatchell, 1986): when both a and a informa-
                                   tion are expressed in the same cell, the a1 and a2 proteins form a transcriptional repressor whose
                                   targets include the HMLa promoter. Unless strains are carefully designed, conventional measures of
                                   silencing will also inadvertently measure this silencing-independent repression. To circumvent this
                                   limitation, we constructed an allele of HML with nonsense mutations in both a1 and a2, so that the
                                   a1 and a2 proteins were never made, even when HML was de-repressed. This modification also
                                   allowed us to use a factor to arrest cells while studying silencing establishment at HML, which was
                                   not possible before because expression of either the a1 or a2 protein renders cells insensitive to a
                                   factor. We also introduced additional single nucleotide polymorphisms into the regions of HML that
                                   are homologous to HMR, to allow unambiguous assignment of high-throughput sequencing reads to
                                   the two loci (see below). We refer to the mutant locus as HML* and the mutant alleles as hmla1*
                                   and hmla2* hereafter.
                                       When cells with HML* and SIR3-EBD, were arrested in G1 and then treated with estradiol, they
                                   were unable to silence hmla1* or hmla2* while kept in G1 (Figure 1—figure supplement 2A and
                                   B). Interestingly, expression of hmla1* and hmla2* increased markedly over the course of the a-fac-
                                   tor arrest. This a-factor-dependent hyper-activation was observed even in sir3D cells in which no
                                   silencing occurs (Figure 1—figure supplement 2E and F). We identified two previously-unreported
                                   binding sites for Ste12, the transcription factor activated by mating pheromone, in the bidirectional
                                   a1/a2 promoter, which explains the increased expression when cells are exposed to a factor (Fig-
                                   ure 1—figure supplement 2G; Dolan et al., 1989). Both hmla1* and hmla2* decreased in expres-
                                   sion following release from G1 to G2/M (Figure 1—figure supplement 2C and D), suggesting that
                                   S phase was required for partial silencing establishment at HML. Notably, the fold change in expres-
                                   sion that followed a single passage through S phase was not identical among HMRa1, hmla1*, and
                                   hmla2*. Thus, some S-phase-dependent process was important for silencing both HML and HMR,
                                   but the effects of that process varied in magnitude between these two loci.

                                   Silencing establishment occurred through a partially repressive
                                   intermediate
                                   We were interested in the partial silencing observed in cells that transited through a single S phase
                                   after SIR3-EBD induction, in which transcription of HMRa1 was down ~60% (see Figure 1E). This
                                   appearance of a stable intermediate level of silencing could reflect either of two distinct phenomena
                                   at the single-cell level (Figure 2A). One possibility was that cells have a ~60% chance of establishing
                                   stable heterochromatin during the first S phase after SIR3-EBD induction and a ~40% chance of fail-
                                   ing to do so. This possibility would resonate with the behavior of certain mutants, for example sir1D,
                                   wherein silent loci can exist in one of two epigenetic states: stably repressed or stably de-repressed,
                                   with rare transitions between the two (Pillus and Rine, 1989; Xu et al., 2006). Alternatively, every
                                   cell might reach a partially repressive chromatin state at HMR during the first S phase during silenc-
                                   ing establishment.
                                       To distinguish between these possibilities, we used single-molecule RNA fluorescence in-situ
                                   hybridization (smRNA-FISH) to quantify the expression of HMRa1 during the establishment process.
                                   If silencing establishment proceeded via individual cells transitioning between the discrete ‘ON’ and
                                   ‘OFF’ states during S phase, we would expect an accumulation of cells with zero transcripts during
                                   the establishment of silencing, with no change in the average number of transcripts in those cells still
                                   expressing HMRa1. However, if silencing establishment proceeded via partially repressive intermedi-
                                   ates in individual cells, we would expect a shift downward in the mean number of transcripts per cell
                                   (Figure 2A). In both cases, cells with zero transcripts would accumulate over time.
                                       As expected, SIR3-EBD cells arrested in G1 without estradiol had similar numbers of HMRa1 tran-
                                   scripts as sir3D cells (Figure 2—figure supplement 1A). When we added estradiol and allowed the
                                   cells to go through S phase to G2/M, the decrease in transcript number in the population of cells
                                   analyzed closely mirrored the results we obtained using RT-qPCR, confirming that our single-mole-
                                   cule analysis was consistent with bulk measurements (Figure 2—figure supplement 1B, compare to
                                   Figure 1E). This decrease occurred via a reduction in the average number of transcripts per cell, and
                                   not simply by an increase in the number of cells with zero transcripts (Figure 2B, Figure 2—figure

Goodnight and Rine. eLife 2020;9:e58910. DOI: https://doi.org/10.7554/eLife.58910                                                   4 of 23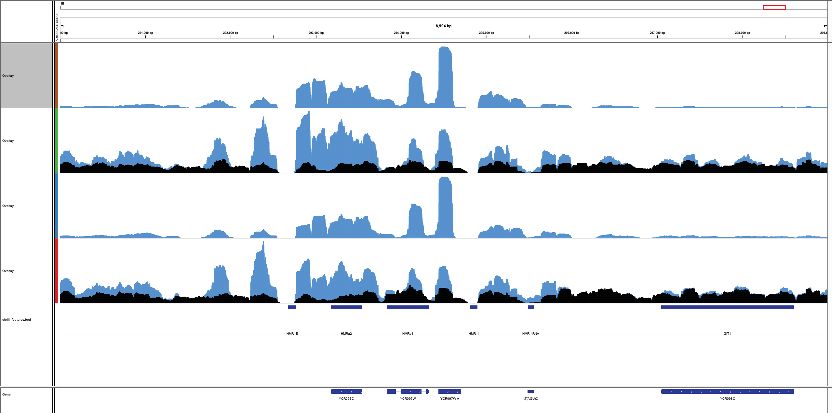
Research article Chromosomes and Gene Expression Genetics and Genomics
A B 0.12
G2/M + estradiol G1 pre-estradiol
Models for silencing establishment 0.09
G1 pre-estradiol
0.06
N=362
Via intermediate states Discrete transition 0.03
0.00
Fraction of cells
Fraction of cells
Fraction of cells
0.3
0.10 0.10
G2/M + estradiol
0.2
0.05 0.05 N=290
0.1
0.0
0.00 0.00
0 5 10 15 0 5 10 15
G2/M - estradiol
Transcripts per cell Transcripts per cell 0.10
G2/M - estradiol
N=276
0.05
0.20
0.00
0.10
0.15 0 10 20 30
a1 KAP104 DAPI a1 KAP104
HMRa1 transcripts per cell
0.10
0.05
0.05
C
pre-estradiol
0.075
0.00 0.00 pre-estradiol
0 5 10 15 0 5 10 15 0.050
0.025
N=1233
0.5
0.3
0.4 0.000
1.5 hr estradiol
0.2 0.20
0.3
0.15 1.5 hr estradiol
0.2
0.1
0.10
0.1 N=1127
Fraction of cells
0.05
0.0 0.0
0 5 10 15 0 5 10 15 0.00
0.6
3 hr estradiol
0.4 3 hr estradiol
0.2 N=1135
0.0
0.08
- estradiol
0.06
3 hr no estradiol
0.04
N=764
0.02
0.00
0 10 20 30 40
cre KAP104 DAPI cre KAP104
HMLα::cre transcripts per cell
Figure 2. Silencing establishment proceeded via gradual repression in individual cells. (A) Potential models for silencing establishment. Before silencing
establishment (top), mRNA transcripts are present as a distribution around a mean. If silencing establishment occurred via intermediate states (left), the
mean number of transcripts per cell would decrease over time, with complete silencing, that is zero transcripts per cell, occurring as the probability
distribution shifted toward the y axis. If silencing establishment occurred via discrete transitions (right), an increasing fraction of cells would have zero
transcripts over time, but the distribution of cells with >0 transcripts would retain the same shape. (B) smRNA-FISH for HMRa1 during silencing
establishment after 1 s phase. A SIR3-EBD culture (JRY11762) was arrested in G1 with a factor (‘G1 pre-estradiol’), then split and released to G2/M by
addition of protease and nocodazole in the presence of either estradiol or ethanol. Samples were collected 2 hr after estradiol addition. (C) smRNA-
FISH for HMLa::cre during silencing establishment in cycling cells. A SIR3-EBD strain bearing the HMLa::cre reporter (JRY12514) was grown to mid-log
phase (‘pre-estradiol’), then the culture was split in two, with one sub-culture receiving estradiol and the other receiving ethanol. Samples were
collected for smRNA-FISH at t = 1.5 hr and t = 3 hr after estradiol addition. For both (B) and (C), the images displayed are representative maximum-
intensity Z-projections. The data shown in (B) and (C) each represent one of two replicate experiments, for which the other replicate is shown in
Figure 2—figure supplements 1 and 2, respectively. Scale bars = 5 mm.
The online version of this article includes the following figure supplement(s) for figure 2:
Figure supplement 1. Gradual silencing establishment at HMR.
Figure supplement 2. Gradual silencing establishment at HMLa::cre.
supplement 1C and D). Thus, individual cells undergoing silencing establishment at HMR formed
partially repressive heterochromatin after a single S phase.
Goodnight and Rine. eLife 2020;9:e58910. DOI: https://doi.org/10.7554/eLife.58910 5 of 23
Research article Chromosomes and Gene Expression Genetics and Genomics
To determine whether the stepwise repression seen at HMR was a general feature of silencing
establishment or if it was particular to HMR and/or the cell-cycle conditions tested, we performed an
analogous experiment using the HMLa::cre allele that has been previously characterized by smRNA-
FISH (Dodson and Rine, 2015). In this experiment, we analyzed the number of cre transcripts per
cell over time following induction of SIR3-EBD, without any cell-cycle perturbations. Silencing estab-
lishment at HML also occurred via partially repressive intermediate states (Figure 2C, Figure 2—fig-
ure supplement 2A and B). The degree of repression observed by smRNA-FISH was quantitatively
similar to the measurement of the same gene by RT-qPCR (Figure 2—figure supplement 2C and
D). Together, these results suggested that silencing establishment proceeded via the gradual repres-
sion of genes by the Sir proteins, and that there were specific windows of the cell cycle during which
transcriptional tune-down could occur.
Extensive Sir protein binding could occur without gene repression
The gradual silencing establishment described above might be achieved via increased Sir protein
recruitment to HML and HMR during each passage through a specific cell-cycle window. Alterna-
tively, Sir protein recruitment might be independent of the cell cycle, in which case passage through
the cell cycle would favor repression via a step occurring after Sir protein recruitment. To test
whether Sir protein recruitment was limited in the cell cycle, we performed ChIP-seq on myc-tagged
Sir4 during silencing establishment. The tagged Sir4-myc is functional for silencing (Figure 1B), and
its localization at HML and HMR is indistinguishable from Sir2-myc and Sir3-myc in wild-type cells
(Thurtle and Rine, 2014).
We developed a protocol for ChIP-seq using MNase-digested chromatin, which resulted in
increased signal-to-noise over standard sonication-based ChIP-seq (Figure 3, Figure 3—figure sup-
plements 1 and 2). One limitation of this approach is that MNase can digest non-nucleosomal DNA,
and thus the silencers at HML* and HMR and the tRNA gene adjacent to HMR, which are not nucleo-
some-bound, are under-recovered relative to sonication ChIP (Figure 3—figure supplement 2).
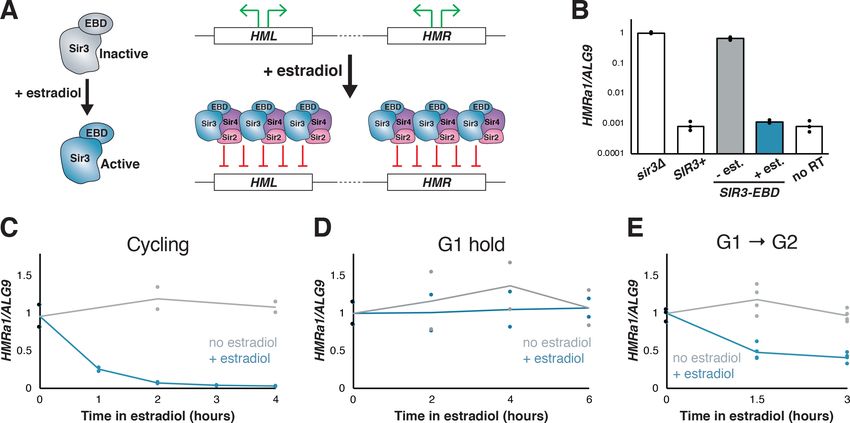
As expected, ChIP-seq on cells with wild-type SIR3 revealed strong binding of Sir4-myc through-
out HML* and HMR (Figure 3A and B). SIR3-EBD cells grown with estradiol gave profiles that were
indistinguishable in both the strength of binding and the location of binding. In sir3D cells and SIR3-
EBD cells grown without estradiol, some Sir4-myc binding across HML* and HMR, though severely
reduced, was still evident (Figure 3A and B). This weak binding was observed in multiple replicates
with different crosslinking times and was not observed in cells with untagged Sir4 (Figure 3—figure
supplement 1A). We also performed ChIP-seq for Sir3-EBD using an antibody to the estrogen
receptor, and found that its binding was strongly dependent on the presence of estradiol, and its
binding pattern was indistinguishable from Sir4-myc (Figure 3—figure supplement 3). The apparent
weak Sir3-EBD signal at HML* and HMR in the absence of estradiol did not drive the weak Sir4-myc
binding described above, as the same Sir4-myc binding was observed in sir3D cells as in SIR3-EBD
cells grown without estradiol.
ChIP-seq data from SIR3-EBD cells arrested in G1 without estradiol revealed the same weak
enrichment of Sir4-Myc at HML* and HMR that we observed in cycling cells (Figure 3C, Figure 3—
figure supplement 1C). However, upon addition of estradiol in cells kept in G1, we saw a strong
increase in Sir4-myc binding across the loci (Figure 3C, Figure 3—figure supplement 1C). The
increase in Sir4-myc binding to HMR was not associated with any change in expression of HMRa1,
which remained completely de-repressed (Figure 3—figure supplement 1B). Hence, Sir protein
binding across HML* and HMR was not sufficient to lead to gene silencing. When cells were allowed
to pass from G1 to G2/M, the resulting partial silencing was correlated with an increase in Sir4-myc
binding at HML* and HMR (Figure 3C, Figure 3—figure supplement 1C). Thus, Sir proteins binding
throughout HML* and HMR in absence of cell-cycle progression achieved no repression, and some
S-phase-dependent process promoted further binding and partial repression. Together, these data
revealed the existence of cell-cycle-regulated steps beyond Sir binding required to bring about
silencing.
Goodnight and Rine. eLife 2020;9:e58910. DOI: https://doi.org/10.7554/eLife.58910 6 of 23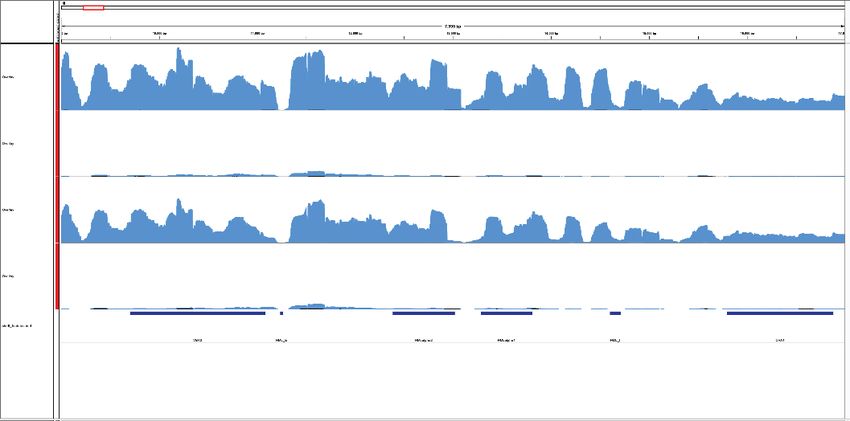
Research article Chromosomes and Gene Expression Genetics and Genomics
A Sir4-13xMyc ChIP
HMR Input
Reads relative to genome-wide median
300
200
SIR3+
100
0
6
300
SIR3-EBD - estradiol SIR3-EBD - estradiol
200 3
100
0
0
300
SIR3-EBD + estradiol 6
200 sir3∆
100 3
0
300 0
200
sir3∆
100
0
E a2 a1 I tRNA GIT1
E a2 a1 I tRNA GIT1
500 bp
B Sir4-13xMyc ChIP
HML* Input
Reads relative to genome-wide median
200
SIR3+
100
0
20
200
SIR3-EBD - estradiol SIR3-EBD - estradiol
10
100
0 0
200
SIR3-EBD + estradiol 20
100
sir3∆
10
0
0
200
sir3∆
100
0
VBA3 E α2* α1* I CHA1
VBA3 E α2* α1* I CHA1
500 bp
C Sir4-13xMyc ChIP Sir4-13xMyc ChIP
HMR Input HML* Input
50
pre-estradiol 80 pre-estradiol
Reads relative to genome-wide median
25 40
0 0
50
G1 + estradiol 80 G1 + estradiol
25 40
0 0
50
G2/M + estradiol 80 G2/M + estradiol
25 40
0 0
50
G1 - estradiol 80 G1 - estradiol
25 40
0 0
50
G2/M - estradiol 80 G2/M - estradiol
25 40
0 0
500 bp E a2 a1 I tRNA GIT1 VBA3 E α2* α1* I CHA1
500 bp
Figure 3. Sir protein binding and silencing were separable phenomena. All panels show Sir4-13xMyc ChIP-seq signal in blue and input in black. Read
counts were normalized to the non-heterochromatin genome-wide median. IP and input values are plotted on the same scale. (A) Left, ChIP-seq for
Sir4-13xMyc at HMR in strains with SIR3 (JRY12172), sir3D (JRY12168), and SIR3-EBD (JRY12170) grown with or without estradiol and fixed for 60 min in
formaldehyde. Right, same data as the left panel for sir3D and SIR3-EBD without estradiol, enlarged to show IP levels above input. (B) Same as (A), but
Figure 3 continued on next page
Goodnight and Rine. eLife 2020;9:e58910. DOI: https://doi.org/10.7554/eLife.58910 7 of 23Research article Chromosomes and Gene Expression Genetics and Genomics
Figure 3 continued
showing data from HML*. (C) ChIP-seq for Sir4-13xMyc during silencing establishment at HMR (left) and HML* (right). Cultures of SIR3-EBD cells
(JRY12169) were arrested in G1 with a factor (‘pre-estradiol’), then split four ways. Two sub-cultures were maintained in G1 in medium with estradiol or
ethanol (‘G1 + estradiol’ and ‘G1 - estradiol’). The other two sub-cultures were released to G2/M by addition of protease and nocodazole; and received
either estradiol or ethanol (‘G2/M + estradiol’ and ‘G2/M - estradiol’). After 3 hr in medium with estradiol or ethanol, cultures were fixed in
formaldehyde for 15 min and collected for ChIP-seq. Data shown represent one of two replicates, with the other shown in Figure 3—figure
supplement 1C.
The online version of this article includes the following figure supplement(s) for figure 3:
Figure supplement 1. Silencing establishment ChIP-seq.
Figure supplement 2. ChIP-seq with sonicated chromatin.
Figure supplement 3. ChIP-seq for Sir3-EBD.
Removal of H3K79 methylation was a critical cell-cycle-regulated step
in silencing establishment
Given that silencing at HML and HMR was established only during a discrete window of the cell
cycle, the key issue was to identify what molecular event(s) occurred during this window and why it/
they were limited in the cell cycle. A mutant that could establish silencing while arrested in G1 would
potentially identify that molecular event.
The histone methyltransferase Dot1 has several characteristics that suggest it might act as an
antagonist of silencing establishment. Dot1 methylates histone H3 on lysine 79 (H3K79), which inter-
feres with Sir3 binding to nucleosomes (Altaf et al., 2007; Armache et al., 2011; van Leeuwen
et al., 2002; Yang et al., 2008). Dot1 is unique among yeast histone methyltransferases in lacking a
counteracting demethylase that removes H3K79 methylation. Thus, removal of H3K79 methylation
can be achieved only through turnover of the histones that bear it, such as occurs during S phase,
when new histones are incorporated that lack H3K79 methylation (De Vos et al., 2011). Indeed,
dot1D SIR3-EBD cells arrested in G1 robustly repressed HMRa1, hmla1*, and hmla2* upon addition
of estradiol (Figure 4A, Figure 4—figure supplement 1A and B). This phenotype was not limited to
SIR3-EBD strains. Strains bearing the temperature-sensitive sir3-8 allele and dot1D could also estab-
lish silencing in G1 when shifted from the non-permissive temperature to the permissive temperature
(Figure 4E). Thus, removal of H3K79me from HML and HMR was one crucial S-phase-specific step
during silencing establishment.
To test whether the dot1D phenotype was due specifically to methylation at H3K79, both copies
of histone H3 were mutated to encode arginine at position 79 (H3K79R), a mimic for the non-methyl-
ated state. This mutant also allowed for robust silencing establishment in G1, in fact, to a stronger
degree than dot1D (Figure 4C). Strains with H3K79 mutated to leucine (H3K79L) or methionine
(H3K79M) failed to establish silencing even after passage through S phase (Figure 4—figure supple-
ment 1C and D), confirming the importance of the positive charge on H3K79 in silencing. Notably,
even though G1-arrested H3K79R cells could strongly repress HMRa1 (~15 fold), this was still incom-
plete relative to fully silenced cells, which repressed HMRa1 >1000 fold (see Figure 1B). Thus, either
increased time or cell cycle progression promoted silencing establishment even in absence of H3K79
methylation.
In addition to promoting S-phase-independent silencing establishment, dot1D and H3K79R cells
that passed from G1 to G2/M also repressed HMRa1 more robustly than did wild-type cells transit-
ing the same cell-cycle window (Figure 4B and Figure 4D, compare to Figure 1E). S-phase passage
markedly increased the speed of silencing establishment in dot1D cells, though the ultimate degree
of repression was similar whether cells passed through S phase or stayed in G1 (compare Figure 4A
and B). Thus, some feature of S phase still promoted silencing establishment in cells lacking H3K79
methylation.
To understand how H3K79 methylation prevented silencing establishment, we performed ChIP-
seq for Sir4-myc in dot1D cells undergoing silencing establishment in the absence of cell-cycle pro-
gression. G1-arrested dot1D cells already displayed clear partial silencing establishment after 1.5 hr
in estradiol (Figure 4—figure supplement 1E). However, the level of Sir4-myc recruitment to HML*
and HMR at this early time point was similar to the recruitment observed in wild-type cells, in which
Goodnight and Rine. eLife 2020;9:e58910. DOI: https://doi.org/10.7554/eLife.58910 8 of 23Research article Chromosomes and Gene Expression Genetics and Genomics
Figure 4. Cells without H3K79 methylation established silencing without cell-cycle progression. (A) Cultures of dot1D cells (JRY12443, JRY12445) were
arrested in G1 with a factor, then split, with half receiving ethanol and the other half receiving estradiol. Silencing was monitored by RT-qPCR over time
after estradiol addition. (B) dot1D mutants were arrested in G1 with a factor, then released to G2/M by addition of protease and nocodazole, and either
ethanol or estradiol. Silencing was monitored by RT-qPCR over time after estradiol addition. (C) Cultures of cells in which lysine 79 was mutated to
arginine in both HHT1 and HHT2 in two isogenic strains (H3K79R; JRY12851, JRY12852) were arrested in G1 with a factor, then split, with one sub-
culture receiving ethanol and the other receiving estradiol. Silencing was assayed by RT-qPCR after 6 hr in ethanol. (D) H3K79R cells were arrested in
G1 with a factor, then released to nocodazole with protease and nocodazole and either estradiol or ethanol. Silencing was assayed by RT-qPCR after 3
hr in estradiol. The pre-estradiol sample for this experiment was the same culture used in (C). (E) Cultures of dot1D sir3-8 cells (JRY12859, JRY12890)
were grown at the non-permissive temperature for sir3-8 (37˚C) and arrested in G1 with a factor, then split, with half shifted to the permissive
temperature (24˚C) and other half staying at the non-permissive temperature. Silencing was assayed by RT-qPCR after 6 hr. (F) Cultures of dot1D cells
(JRY12443, JRY12444) were arrested in G1 with a factor (‘pre-estradiol’), then split, with half the culture receiving ethanol, and the other half receiving
estradiol. After 1.5 hr and after 3 hr, samples were fixed for 15 min in formaldehyde and collected for ChIP. Sir4-13xMyc ChIP-seq signal is in blue and
input in black, each normalized to the non-heterochromatin genome-wide median and plotted on the same scale. Also displayed are two replicates of
wild-type G1 cells after 3 hr in estradiol from Figure 3C and Figure 3—figure supplement 1C.
The online version of this article includes the following figure supplement(s) for figure 4:
Figure supplement 1. Silencing establishment in dot1D cells.
Figure supplement 2. H3K79 trimethylation dynamics during silencing establishment.
no gene repression had occurred after 3 hr (Figure 4F, Figure 4—figure supplement 1F). There-
fore, even though dot1D and wild-type cells had indistinguishable levels of Sir binding, that binding
gave rise to different transcriptional effects. Thus, removal of H3K79me did not regulate silencing
establishment by controlling Sir protein binding.
We next tested explicitly whether H3K79 methylation depletion can occur during a G1 arrest
and during passage through S phase. As noted previously, in wild-type cells, H3K79 trimethyla-
tion (H3K79me3) is almost completely absent from HML* and HMR, but in sir3D mutants,
Goodnight and Rine. eLife 2020;9:e58910. DOI: https://doi.org/10.7554/eLife.58910 9 of 23Research article Chromosomes and Gene Expression Genetics and Genomics
H3K79me3 is present at both loci (Figure 4—figure supplement 2A and B). When SIR3-EBD
was induced in cells arrested in G1, no change in H3K79me3 was observed (Figure 4—figure
supplement 2), even though robust Sir protein recruitment could occur (Figure 3C). Following S
phase, though, H3K79me3 was partially depleted from HMR and from hmla1*, but not from
hmla2* (Figure 4—figure supplement 2). Thus, Sir protein binding in G1 was insufficient to
change H3K79me3 levels at HML and HMR. The first depletion of this mark occurred concomi-
tantly with S phase.
SAS2 and RTT109 contributed to limiting silencing establishment to S
phase
The crucial role of H3K79 methylation removal in silencing establishment led us to consider other
chromatin modifications that might regulate silencing establishment. Two histone acetyltransferases,
Sas2 and Rtt109, were especially interesting given the S-phase dynamics of the marks they deposit
and their known relevance to silencing. Sas2, the catalytic component of the SAS-I complex, acety-
lates H4K16 during S phase (Kimura et al., 2002; Meijsing and Ehrenhofer-Murray, 2001;
Reiter et al., 2015; Suka et al., 2002). The removal of H4K16 acetylation by Sir2 is the central his-
tone modification associated with silencing (Imai et al., 2000; Johnson et al., 1990; Landry et al.,
2000; Park and Szostak, 1990). Rtt109 acetylates newly-incorporated histone H3 at lysines 9 and
56 during S phase, and this acetylation is largely removed by Hst3 and Hst4 by the time of mitosis
(Adkins et al., 2007; Celic et al., 2006; Driscoll et al., 2007; Fillingham et al., 2008;
Schneider et al., 2006). Mutations in SAS2 and RTT109 have both been shown to have subtle silenc-
ing phenotypes (Imai et al., 2000; Miller et al., 2008).
Interestingly, both sas2D and rtt109D mutations led to partial repression of HMR upon SIR3-EBD
induction in cells arrested in G1 (Figure 5A). The magnitude of this effect was weaker than in dot1D
cells but highly significant. Cells without RTT109 grew slowly and were less sensitive to a factor than
wild-type cells, so we cannot exclude the possibility that a population of rtt109D cells passed
through S phase during the experiment, contributing to the observed phenotype (Figure 5—figure
supplement 1). When combined with dot1D, both sas2D and rtt109D led to a further increase in
silencing establishment. Thus, SAS2 and RTT109 impeded silencing establishment by a different
mechanism than DOT1. Silencing establishment in cells lacking both SAS2 and RTT109 was not sig-
nificantly different from that of the single mutants. Strikingly, triple mutant sas2D rtt109D dot1D
strains established silencing no better than single-mutant dot1D cells. Interestingly, the G1 pheno-
types we observed at HMR for dot1D, sas2D, and rtt109D single mutant cells were largely similar at
hmla1* (Figure 5B). Altogether, these findings demonstrate that SAS2, RTT109, and DOT1 inhibit
silencing establishment outside of S phase.
Discussion
In this study, we resolved why silencing establishment requires cell cycle progression. These results
highlighted the value of studying the dynamics of silencing both in populations of cells and at the
single cell level. By monitoring changes in chromatin and changes in expression simultaneously, we
documented effects that were elusive at steady state, but critical for a mechanistic understanding of
the process. We found that the cell-cycle-dependent removal of euchromatic marks was a major
driver of a cell’s ability to establish stable heterochromatin. Interpretation of our results required crit-
ical reassessment of some earlier results.
Silencing establishment occurred by tuning down transcription in
individual cells after Sir proteins were bound
The classic model for silencing establishment involves two steps: nucleation of Sir proteins at the
silencers, followed by spreading of Sir proteins from silencers via the stepwise deacetylation of
nucleosomes by Sir2 and subsequent binding of Sir3 and Sir4 to deacetylated positions of H3 and
H4 tails (Hecht et al., 1995; Hoppe et al., 2002; Rusche et al., 2003; Rusché et al., 2002). In the
classic model, individual Sir proteins are recruited to the silencers, but the spread across the locus is
dependent on all three proteins Sir2/3/4, with both continuous Sir protein binding and histone
deacetylation being required for gene repression (Johnson et al., 2009; Yang and Kirchmaier,
2006). The binding of a Sir2/3/4 complex to internal nucleosomes at HML and HMR is thought to
Goodnight and Rine. eLife 2020;9:e58910. DOI: https://doi.org/10.7554/eLife.58910 10 of 23Research article Chromosomes and Gene Expression Genetics and Genomics
HMR HML*
A G1 hold B G1 hold
no estradiol 2.0
no estradiol
(relative to pre-estradiol)
+ estradiol + estradiol
(relative to pre-estradiol)
1.5
hmlα1*/ALG9
HMRa1/ALG9
1.5
1.0
1.0
0.5
0.5
0.0 0.0
T ∆ ∆ ∆ ∆ ∆ ∆ ∆ T ∆ ∆ 9∆ ∆ ∆
t1 2 9 9 t1 t1 t1 W t1 s2 t1 t1
W
do as 10 10 do do do do sa 10 do do
s rtt rtt ∆ ∆ ∆ rtt ∆ ∆
∆ s2 09 09 s2 09
s2 sa 1 1 sa 1
sa rtt rtt r tt
∆
s2
sa
Figure 5. Effects of SAS2 and RTT109 on silencing establishment in G1. For all strains, cultures were arrested in G1 with a factor, then split, with one
sub-culture receiving estradiol and the other receiving ethanol. Silencing was assayed by RT-qPCR 6 hr after additions. Each sample was normalized to
its own pre-estradiol value. The following strains were used. WT: JRY12169; dot1D: JRY12443, JRY12445; sas2D: JRY12615, JRY12616; rtt109D: JRY12689,
JRY12690; sas2D rtt109D: JRY12765, JRY12766; sas2D dot1D: JRY12618, JRY12619; rtt109D dot1D: JRY12691, JRY12692; sas2D rtt109D dot1D: JRY12767,
JRY12768. (A) Silencing establishment of HMRa1 by RT-qPCR. The level of repression observed in each mutant was significantly greater than in wild
type (Two-tailed T-test; pResearch article Chromosomes and Gene Expression Genetics and Genomics
Sir binding and partial silencing establishment. However, in G1-arrested dot1D cells, in which Sir4
binding patterns were indistinguishable from G1-arrested wild-type cells, induction of SIR3-EBD
caused partial silencing establishment. Together, these observations indicate that a key regulated
step in building heterochromatin occurred after the major silencing factors were already present at
the locus. Two interpretations were compatible with our data. First, the non-repressive Sir4 binding
observed in G1 and the repressive Sir4 binding observed in G2/M could differ in some parameter
that is not apparent in crosslinking ChIP experiments, such as differences in the on and off rates for
Sir4 binding to nucleosomes. Second, Sir binding could be unable to drive transcriptional changes
until competing euchromatic marks on chromatin are relieved. Consistent with the latter interpreta-
tion, we found that Sir protein binding could lead to changes in H3K79 trimethylation only after S
phase. In addition, a prior study of telomeric silencing found that while Sir protein binding was
detectable at both repressed and de-repressed telomeres, euchromatic marks, including H3K79me,
were found only at de-repressed telomeres, and that, in vitro, H3K79me could disturb silencing with-
out changing Sir protein binding (Kitada et al., 2012).
Our smRNA-FISH results showed that silencing establishment proceeds via the gradual tune-
down of transcription in individual cells, and that this tune-down occurs over multiple cell cycles.
Interestingly, the fraction of cells with zero transcripts after a single S phase (~30%, see Figure 2B),
is similar to the fraction of cells that established phenotypic silencing after a single division in a previ-
ous study (Osborne et al., 2009). While these results are not directly comparable, as the previous
study assayed silencing at HML and used a different induction strategy, one possibility is that pheno-
typic silencing only arises when transcript number falls to zero in a given cell. This result conflicts
with a prior study of silencing establishment in single cells using a fluorescent reporter at HML. That
study concluded that silencing establishment proceeded via discrete transitions from the ‘ON’ to the
‘OFF’ state (Xu et al., 2006). However, because that study relied on qualitative assessment of fluo-
rescence intensity in individual cells, it may not have been possible to ascertain intermediate states.
Indeed, our data illustrate an inherent limitation of qualitative measurements of single-cell parame-
ters: in the smRNA-FISH images in Figure 2, a striking feature is the dichotomy between cells with
no transcripts and those with some transcripts. That observation might lead to the conclusion that
silencing establishment is caused by the complete shutdown of transcription stochastically in some
cells. However, as illustrated by Figure 2A, that dichotomy is expected from both an ‘all-or-nothing’
model and a ‘gradual transition’ model. It is only through the quantitative analysis that we could see
the gradual decrease in transcription in individual cells.
Whether silencing acts through steric occlusion or through a more specific inhibition of some
component necessary for transcription, it is difficult to explain how any intermediate in the assembly
of a static heterochromatin structure could drive partial repression. The simplest explanation for how
partially repressive chromatin could form would be that silencing machinery and transcriptional
machinery both come on and off the chromatin, and the establishment of silencing involves a change
in the relative rates of those two processes. In that case, histone modifications could be crucial in
shifting the balance.
Euchromatic histone mark removal was a key cell-cycle-regulated step
in silencing establishment
Removal of Dot1-deposited methylation of H3K79 was a critical step in silencing establishment. This
finding was consistent with earlier studies of cycling cells, which found that dot1D cells established
silencing more quickly than wild-type cells (Katan-Khaykovich and Struhl, 2005; Osborne et al.,
2009). Indeed, Katan-Khaykovich and Struhl proposed a model for silencing establishment in which
Sir protein binding and histone deacetylation occur rapidly, followed by slow removal of methylation
over several cell cycles, which is consistent with our findings. Removal of H3K79 methylation appears
to be the primary reason why cells need to progress through S phase to establish silencing. Dot1 is
thought to reduce the Sir3 BAH domain’s affinity for the nucleosome core by methylating H3K79
(Martino et al., 2009; Ng et al., 2002a; Onishi et al., 2007). In addition to Dot1 and Sir3 both bind-
ing the nucleosome core at H3K79, they also compete for binding to the H4 tail, and deacetylation
of the tail by Sir2 is thought to favor Sir3 binding at the expense of Dot1 (Altaf et al., 2007). Thus,
through modifications at H4K16 and H3K79, transcription and silencing mutually antagonize each
other. In a cell in G1, even if Sir2/3/4 are able to displace Dot1 by deacetylating H4K16, H3K79me
Goodnight and Rine. eLife 2020;9:e58910. DOI: https://doi.org/10.7554/eLife.58910 12 of 23Research article Chromosomes and Gene Expression Genetics and Genomics
will remain until histones are turned over, which seems to explain the S-phase requirement for silenc-
ing establishment.
Silencing establishment at HMR does not require replication of the locus, as shown by the ability
of excised episomes bearing HMR but no replication origin to establish silencing in an S-phase-
dependent manner (Kirchmaier and Rine, 2001; Li et al., 2001). This finding presented a major
mystery: what S-phase-specific process other than replication fork passage drives silencing establish-
ment? Our results suggest that an influx of H3 molecules lacking methylation at K79 could be the
solution. Replication-independent histone exchange can occur throughout the cell cycle (Dion et al.,
2007; Rufiange et al., 2007; Schlissel and Rine, 2019), which means that a replicating or non-repli-
cating copy of HMR can incorporate histone molecules from the nuclear pool. Outside of S
phase, ~90% of all H3 in the nucleus is methylated at K79 (van Leeuwen et al., 2002), so histone
exchange would likely lead to incorporation of the silencing-refractory methylated form. However,
during S phase, a large quantity of newly-synthesized non-methylated H3 is present. Therefore, his-
tone incorporation during S phase through either replication-coupled chromatin assembly or replica-
tion-independent histone turnover would lead to incorporation of many H3 molecules that are not
methylated at K79. This might explain why silencing establishment can occur at HMR, whether it is
replicated or not, and why that establishment depends on S phase.
We found that H3K79R mutants, which mimicked the non-methylated state of H3K79, also estab-
lished silencing in G1-arrested cells and did so even more strongly than dot1D mutants. A simple
explanation for this difference in impact of the two mutations could be that Sir3 binds more strongly
to arginine than lysine at position 79. Alternatively, Dot1 has been shown to have several methyl-
transferase-independent functions, and it was possible that one of these functions acted to promote
silencing. In particular, Dot1 has recently been shown to possess histone chaperone activity that is
independent of its ability to methylate histones (Lee et al., 2018). In addition, Dot1 has the methyl-
transferase-independent ability to stimulate ubiquitination of histone H2B (van Welsem et al.,
2018). The latter result is particularly interesting, because H2B ubiquitination is itself required for
both H3K79 methylation (Briggs et al., 2002; Ng et al., 2002b) and H3K4 methylation
(Dover et al., 2002; Sun and Allis, 2002). Conflicting reports have pointed to a role of H3K4 meth-
ylation in silencing (Fingerman et al., 2005; Mueller et al., 2006; Santos-Rosa et al., 2004). Thus, it
is possible that in a dot1D mutant, the removal of H3K79me per se promotes silencing, but an indi-
rect effect through H2Bub and/or H3K4me partially counteracts the H3K79me effect.
The histone acetyltransferases Sas2 and Rtt109 also had roles in limiting silencing establishment
to S phase. Individually, sas2D and rtt109D mutations led to partial silencing establishment in G1-
arrested cells, and each of these effects was additive with a dot1D mutation. Acetylation of H4K16
by Sas2, like methylation of H3K79 by Dot1, is critical in distinguishing euchromatin and heterochro-
matin. Interestingly, in a previous study, while dot1D sped silencing establishment at HML, sas2D
delayed silencing establishment by that assay (Osborne et al., 2009). The single-cell a-factor
response assay used in that study required cells to fully repress HML to gain the a mating type iden-
tity, whereas our assay used more direct measures of changes in transcription at HML and HMR.
Thus, one explanation consistent with both results is that sas2D cells begin silencing more readily
than wild-type cells, but take more cell cycles to reach full repression. This could be the result of the
competing effects of the sas2D mutation: hypoacetylation of histones at HML and HMR might
increase Sir protein recruitment, while the global pool of hypoacetylated histones can also titrate Sir
proteins away from HML and HMR.
The ability of rtt109D cells to drive partial silencing establishment in G1-arrested cells was surpris-
ing. Like Sas2, Rtt109 binds to Asf1 and acetylates newly-synthesized histones (Driscoll et al., 2007),
but H3K56 acetylation is removed after S phase by the sirtuins Hst3 and Hst4 (Celic et al., 2006).
The residual H3K56ac present outside of S phase is due to transcription-coupled histone turnover,
which incorporates new histones marked with H3K56ac (Rufiange et al., 2007). A negative role for
H3K56 acetylation in silencing has been observed, although this has not been well-characterized
(Dodson and Rine, 2015; Miller et al., 2008). One simple model is that H3K56ac favors transcrip-
tion, and thus impedes silencing establishment. However, given genome-wide acetylation and
deacetylation of H3K56, indirect effects cannot be excluded.
Goodnight and Rine. eLife 2020;9:e58910. DOI: https://doi.org/10.7554/eLife.58910 13 of 23Research article Chromosomes and Gene Expression Genetics and Genomics
Silencing establishment occurred via similar mechanisms at different
loci
The mechanism of repression at the two silent mating type loci, HML and HMR, is generally assumed
to be quite similar, but there are mutations that cause effects only at one of the two loci, and others
that cause divergent phenotypes between the two loci (Park and Szostak, 1990; Ehrenhofer-
Murray et al., 1997; Yan and Rine, unpublished). Earlier studies concluded that cell-cycle require-
ments for silencing establishment differed at HML and HMR (Ren et al., 2010; Lazarus and Holmes,
2011) In contrast, in both wild-type cells and the mutant conditions we tested, both loci behaved
similarly. A major innovation that distinguished our studies from the prior studies was our use of a
mutant HML that allowed unambiguous study of its expression by ensuring that a1 and a2 proteins
would not be made. This strategy removed the strong repressive effect that the a1/a2 repressor has
on transcription from the HML promoter, which was a confounding influence in earlier experimental
designs that could have led to apparent cell-cycle independent silencing of HML. In the course of
this work, we found that the HML promoter is subject to hyperactivation by a factor, which further
complicates studies of silencing establishment at the locus. More work is clearly needed to fully
understand how silencing establishment is regulated at HML.
We did note one distinction between HML* and HMR. After a single S phase, H3K79 trimethyla-
tion was depleted from HMR and hmla1*, but not from hmla2*. Given that H3K79 methylation is a
major regulator of silencing establishment, this could explain the observation that hmla2* was also
the gene whose silencing was weakest after a single S phase of silencing establishment. The interre-
lation between promoter strength, transcription-coupled histone modification, and silencing remains
a fascinating topic for future study.
This fundamental similarity between HML and HMR in silencing establishment was further evi-
denced by the lack of an effect of the tRNA gene adjacent to HMR, or the tRNA gene’s binding
partner, cohesin, loss of either of which were reported to allow early silencing establishment in
previous studies (Lau et al., 2002; Lazarus and Holmes, 2011). The reason behind the differen-
ces between our results and those of the previous studies was not clear. We did observe subtle
silencing-independent fluctuations in HMRa1 expression through the cell cycle, which may have
confounded earlier results that relied on non-quantitative RT-PCR assays (data not shown). We
cannot exclude the possibility that differences between SIR3-EBD and earlier inducible alleles
contributed to the different results, as temperature, metabolism, and hormone addition could
each affect silencing or the cell cycle in unappreciated ways. Lazarus and Holmes’s use of the
galactose promoter to drive SIR3 expression would alter Sir3 concentration and the stoichiometry
of the SIR complex, both of which would be expected to be important parameters in regulating
silencing establishment.
Do the contributions of DOT1, SAS2, and RTT109 completely resolve
the cell-cycle requirement for silencing establishment?
In dot1D mutants, S phase still dramatically accelerated silencing establishment, indicating that some
feature of S phase beyond H3K79me removal was important in those cells. In addition, we found no
case in which silencing establishment in G1-arrested cells matched the degree of silencing observed
after overnight growth in estradiol. However, the ~90% repression observed in, for example G1-
arrested H3K79R cells should be sufficient to completely turn off transcription at HML and HMR in
the majority of cells (see Figure 2). The quantitative gap in the level of silencing seen at steady state
and that which is achieved in the experiments reported here could reflect a requirement for further
cell-cycle steps or more time to complete silencing establishment. Others have identified a cell-cycle
window between G2/M and G1 that contributes to silencing establishment (Lau et al., 2002), and
none of our data were inconsistent with that result. Identifying mutant conditions in which G1-
arrested cells and cycling cells establish silencing at an equal rate will be required before the cell-
cycle-regulated establishment of silencing is fully understood. In addition, future studies should
address whether the antagonistic effects of euchromatic histone modifications on silencing establish-
ment can be counteracted by increasing SIR complex concentration.
Together, our data suggest that silencing establishment cannot proceed without removal of
histone modifications that favor transcription. In this view, at any stage of the cell cycle, Sir pro-
teins can bind to HML and HMR. Passage through S phase leads to incorporation of new
Goodnight and Rine. eLife 2020;9:e58910. DOI: https://doi.org/10.7554/eLife.58910 14 of 23Research article Chromosomes and Gene Expression Genetics and Genomics
histones, which, crucially, lack H3K79 methylation. This decrease of H3K79me by half leads to
both further Sir binding and decreased transcription. However, one cell cycle is not sufficient to
fully deplete activating marks, and successive passages through S phase complete the process of
silencing establishment.
Materials and methods
Key resources table
Reagent type
(species) or resource Designation Source or reference Identifiers Additional information
Strain, strain Various This paper NCBITaxon:4932 See
background Supplementary file 1a
(Saccharomyces
cerevisiae)
Antibody Anti-c-myc beads Thermo Fisher Cat # 88842 50 mL per IP
(mouse monoclonal) Scientific
Antibody Anti-H3K79me3 Diagenode Cat # C15410068 5 mL per IP
(rabbit polyclonal)
Antibody Anti-ERa Santa Cruz Cat # sc-8002, 25 mL per IP
(rabbit polyclonal) Biotechnology RRID:AB_627558
Antibody Anti-Hexokinase Rockland Cat # 100–4159, (1:20,000)
(Rabbit polyclonal) RRID:AB_219918
Antibody Anti-V5 Thermo Fisher Cat # R960-25, (1:2,500)
(Mouse monoclonal) Scientific RRID:AB_2556564
Antibody IRDye 800CW Li-Cor Cat # 926–32210, (1:20,000)
anti-mouse RRID:AB_621842
(Goat polyclonal)
Antibody IRDye 680RD Li-Cor Cat # 926–68070, (1:20,000)
anti-rabbit RRID:AB_10956588
(Goat polyclonal)
Recombinant HML* This paper Mutated allele of HML
DNA reagent
Recombinant SIR3-EBD This paper Fusion protein of
DNA reagent Sir3 and EBD of
mammalian ERa
Sequence- Various This paper qPCR primers See
based reagent oligonucleotides Supplementary file 1b
Sequence- smRNA Biosearch See
based reagent -FISH probes Technologies Supplementary file 1c
Commercial RNEasy Mini Kit Qiagen Cat # 74104
assay or kit
Commercial Qiaquick PCR Qiagen Cat # 28104
assay or kit purification kit
Commercial NEBNext Ultra II NEB Cat # 37645L
assay or kit Library prep kit
Commercial Superscript III reverse Thermo Fisher Cat # 18080044
assay or kit transcriptase kit Scientific
Commercial DyNamo HS SYBR Thermo Fisher Cat # F410L
assay or kit Green qPCR kit Scientific
Peptide, Catalase Sigma-Aldrich Cat # C3515
recombinant protein
Peptide, Proteinase K NEB Cat # P8107S
recombinant protein
Peptide, Glucose oxidase Sigma-Aldrich Cat # G2133
recombinant protein
Peptide, Zymolyase-100T VWR Cat # IC320932
recombinant protein
Continued on next page
Goodnight and Rine. eLife 2020;9:e58910. DOI: https://doi.org/10.7554/eLife.58910 15 of 23You can also read