PRENEOPLASTIC ALTERATIONS DEFINE CLL DNA METHYLOME AND PERSIST THROUGH DISEASE PROGRESSION AND THERAPY - MPG.PURE

Page created by Lloyd Alvarez
 
CONTINUE READING
PRENEOPLASTIC ALTERATIONS DEFINE CLL DNA METHYLOME AND PERSIST THROUGH DISEASE PROGRESSION AND THERAPY - MPG.PURE
Research Article

Preneoplastic Alterations Define CLL DNA
Methylome and Persist through Disease
Progression and Therapy
Helene Kretzmer1, Anat Biran2, Noelia Purroy2,3,4, Camilla K. Lemvigh2,5, Kendell Clement3,6, Michaela
Gruber2,7, Hongcang Gu3, Laura Rassenti8, Arman W. Mohammad3, Connie Lesnick9, Susan L. Slager9,
Esteban Braggio10, Tait D. Shanafelt9, Neil E. Kay9, Stacey M. Fernandes2, Jennifer R. Brown2,4,11, Lili Wang12,
Shuqiang Li13, Kenneth J. Livak13, Donna S. Neuberg14, Sven Klages15, Bernd Timmermann15, Thomas J. Kipps8,
Elias Campo16, Andreas Gnirke3, Catherine J. Wu2,3,4,11, and Alexander Meissner1,3,6

    Downloaded from https://bloodcancerdiscov.aacrjournals.org at Max Planck Insitut fuer Molekulare Genetik on January 12,
                      Copyright2021. 2020  by 2020
                                     Copyright American
                                                    AmericanAssociation     for
                                                              Association for   Cancer
                                                                              Cancer       Research.
                                                                                      Research.
PRENEOPLASTIC ALTERATIONS DEFINE CLL DNA METHYLOME AND PERSIST THROUGH DISEASE PROGRESSION AND THERAPY - MPG.PURE
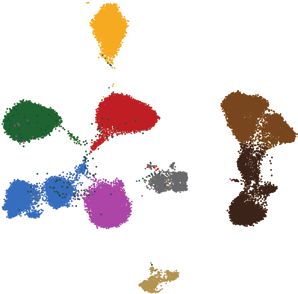
abstract            Most human cancers converge to a deregulated methylome with reduced global
                                    levels and elevated methylation at select CpG islands. To investigate the emergence
                and dynamics of the cancer methylome, we characterized genome-wide DNA methylation in preneo-
                plastic monoclonal B-cell lymphocytosis (MBL) and chronic lymphocytic leukemia (CLL), including serial
                samples collected across disease course. We detected the aberrant tumor-associated methylation
                landscape at CLL diagnosis and found no significant differentially methylated regions in the high-count
                MBL-to-CLL transition. Patient methylomes showed remarkable stability with natural disease and
                posttherapy progression. Single CLL cells were consistently aberrantly methylated, indicating a homo-
                geneous transition to the altered epigenetic state and a distinct expression profile together with MBL
                cells compared with normal B cells. Our longitudinal analysis reveals the cancer methylome to emerge
                early, which may provide a platform for subsequent genetically driven growth dynamics, and, together
                with its persistent presence, suggests a central role in disease onset.

                Significance: DNA methylation data from a large cohort of patients with MBL and CLL show that epi-
                genetic transformation emerges early and persists throughout disease stages with limited subsequent
                changes. Our results indicate an early role for this aberrant landscape in the normal-to-preneoplastic
                transition that may reflect a pan-cancer mechanism.
                See related commentary by Rossi.

Introduction                                                                      scape (1, 2). By contrast, cells profiled from virtually every
                                                                                  human cancer type display local hypermethylation at typi-
  In normal adult tissues, cell identity is associated with
                                                                                  cally lowly methylated CpG-rich regions and simultaneously
accurate maintenance of a distinct DNA methylation land-
                                                                                  global hypomethylation at highly methylated domains (3–6).
                                                                                      The striking universality of this phenomenon across cancer
1
 Department of Genome Regulation, Max Planck Institute for Molecular              types raises the fundamental question of whether a cell first
Genetics, Berlin, Germany. 2Department of Medical Oncology, Dana-Farber           becomes cancerous and then acquires an aberrant methylome or
Cancer Institute, Boston, Massachusetts. 3Broad Institute of MIT and Harvard,
Cambridge, Massachusetts. 4Harvard Medical School, Boston, Massachusetts.
                                                                                  if the aberrant methylome is a prerequisite. Methylation dynam-
5
 Department of Health Technology, Technical University of Denmark, Lyngby,        ics of similar proportions have otherwise only been observed
Denmark. 6Department of Stem Cell and Regenerative Biology, Harvard Univer-       during early embryonic development or the germ­line specifica-
sity, Cambridge, Massachusetts. 7Division of Haematology and Haemostaseol-        tion. At the same time, the generation and propagation of most
ogy, Department of Internal Medicine I, Medical University of Vienna, Vienna,
                                                                                  other benign adult cell types show relatively stable global meth-
Austria. 8Division of Hematology-Oncology, Department of Medicine, Moores
Cancer Center, University of California, San Diego, La Jolla, California. 9Mayo   ylation patterns (1–7). One notable exception to the epigenetic
Clinic, Division of Hematology, Rochester, Minnesota. 10Mayo Clinic Arizona,      stability of adult cell types is the maturation of B cells from
Scottsdale, Arizona. 11Department of Medicine, Brigham and Women’s Hospital,      hematopoietic stem cells through several intermediate stages to
Boston, Massachusetts. 12Department of Systems Biology, Beckman Research          mature B cells, which is a critical process for the establishment
Institute, City of Hope, Monrovia, California. 13Translational Immunogenom-
ics Laboratory, Dana-Farber Cancer Institute, Boston, Massachusetts. 14Data
                                                                                  of a highly effective, dynamic immune system (8). This matura-
Science, Dana-Farber Cancer Institute, Boston, Massachusetts. 15Sequencing        tion process involves genetic modulation such as somatic hyper-
Core Facility, Max Planck Institute for Molecular Genetics, Berlin, Germany.      mutation of the immunoglobulin heavy-chain variable (IGHV)
16
  Lymphoid Neoplasm Program, Institut d’Investigacions Biomèdiques August         region and immunoglobulin class switch recombination (9), as
Pi i Sunyer (IDIBAPS), Hematopathology Section, Hospital Clínic; Departament
                                                                                  well as a modulation of the methylome (10, 11). Interestingly,
d’Anatomia Patològica, Universitat de Barcelona, Barcelona, Spain.
                                                                                  the methylation dynamics observed in B-cell maturation share
Note: Supplementary data for this article are available at Blood Cancer
Discovery Online (https://bloodcancerdiscov.aacrjournals.org/).                   many features with the cancer methylome (10, 11).
A. Biran, N. Purroy, C. K. Lemvigh, K. Clement, and M. Gruber contributed             Chronic lymphocytic leukemia (CLL) is a malignancy of
equally to this article.                                                          aberrant clonal mature B cells in the blood, bone marrow,
C.J. Wu and A. Meissner jointly supervised this work.                             and lymphoid organs that provides an ideal model setting
Current address for M. Gruber: CeMM Research Center for Molecular Medicine        to gain insight into the emergence of the altered methyl-
of the Austrian Academy of Sciences, Vienna, Austria; and current address for     ome. Its typically indolent course enables longitudinal studies
T.D. Shanafelt, Stanford University School of Medicine, Stanford, California.     within individual patients from a pretreatment “watch and
Corresponding Authors: Alexander Meissner, Max Planck Institute for               wait” phase—the duration of which is highly variable among
Molecular Genetics, Ihnestr. 63-73, 14195 Berlin, Germany. Phone: 49-30-
8413-1880; E-mail: meissner@molgen.mpg.de; and Catherine J. Wu, Dana-
                                                                                  patients, lasting months to years (12)—to the posttreatment
Farber Cancer Institute, 44 Binney Street, Boston, MA 02115. Phone:               setting and even onto progression (13, 14). A precursor stage
617-632-5943; E-mail: cwu@partners.org                                            termed monoclonal B-cell lymphocytosis (MBL) has also been
Blood Cancer Discov 2021;2:1–16                                                   described, defined as elevated white blood cell (WBC) counts
doi: 10.1158/2643-3230.BCD-19-0058                                                with clonal B cells of a CLL immunophenotype. High-count
©2020 American Association for Cancer Research.                                   MBL on average progresses to CLL that requires treatment in

                                                                                          January 2021      blood CANCER DISCOVERY | OF2

   Downloaded from https://bloodcancerdiscov.aacrjournals.org at Max Planck Insitut fuer Molekulare Genetik on January 12,
                              2021. Copyright 2020 American Association for Cancer Research.
RESEARCH ARTICLE                                                                                                                            Kretzmer et al.

1% to 2% of patients per year (15). A well-established prognostic                 Results
factor in CLL is the mutational status of the IGHV region
genes, with mutated IGHV showing a much better prognosis                          Unmutated and Mutated CLLs Converge to a
than CLL with unmutated IGHV (16, 17). The IGHV muta-                             Similar Methylome
tional status has been thought to reflect differences in the cell                    To systematically study the DNA methylation dynamics
of origin, with a similarity in methylation profiles of unmu-                     across the disease course of CLL, we generated RRBS datasets
tated CLLs and pregerminal center B cells, and of mutated CLL                     from CD19+ CD5+ cells collected from 23 individuals with
with mature, postgerminal center memory B cells, suggesting                       MBL, matched samples for 5 patients capturing both the MBL
that CLL emerges from a spectrum of B cells undergoing broad                      and their transition to CLL, and serial pre- and posttreatment
DNA methylation alterations (11, 16, 18, 19). In addition to                      samples from 25 patients collected following the diagnosis of
these characteristic global changes, we previously identified a                   CLL (28, 29) and compared these with published B-cell–lineage
pervasive local disorder of methylation across genomic features                   subpopulations (refs. 10, 30; Fig. 1A; Supplementary Table S1).
in CLL, not present in normal tissues (20). Although general                         Genome-wide correlation of single CpG methylation
changes in methylation profiles during B-cell development and                     showed a substantial similarity of unmutated and mutated
cancer have been described (6, 10, 11, 20–24), little is currently                methylation profiles (r = 0.96); however, compared with
known about: (i) if and which additional methylation changes                      their putative cell of origin, the CLL IGHV subtypes showed
are necessary to transition from normal into a preneoplas-                        different degrees of abnormality. Although the unmutated
tic state and further into cancer, (ii) how this altered cancer                   CLL showed more changes compared with naïve B cells, the
methylome is affected by therapy, and (iii) why it is found so                    mutated CLL exhibited a methylation landscape more similar
ubiquitously across different types and stages of cancer. Fur-                    to memory B cells than naïve to memory B cells (Fig. 1B). As
thermore, the chronologic origin of altered methylation with                      noted above, CLLs originate from a range of developmental
respect to cancer initiation and progression is not well under-                   stages with pregerminal center B cells thought to give rise to
stood but would be of relevance for early detection and could                     unmutated CLL and mature, postgerminal center memory B
lead to novel therapeutic strategies.                                             cells to mutated CLLs (10, 11, 16, 18, 19, 31). Evaluation of single
   To approach these questions, we used bulk and single-                          samples in a phylogenetic tree analysis revealed that the unmu-
cell reduced representation bisulfite sequencing (RRBS; refs.                     tated and mutated CLL samples are characterized by a methy-
25–27) to profile normal mature B cells, as well as cells from                    lome that consistently differs from normal naïve and memory
patients in the preneoplastic MBL phase and during CLL                            B cells, suggesting a convergent disease-associated methylome,
progression, including after treatment. We characterized the                      irrespective of IGHV mutation status (Fig. 1C; Supplementary
methylation status of samples collected from 53 patients sup-                     Fig. S1A). Together, these results suggest that both IGHV sub-
plemented with WBC counts as a measure of tumor burden,                           types of CLL undergo methylation changes specific to CLL.
and hence the effect of treatment (average sampling period of                     However, some of these changes also appear to be normally
5.7 years). Further, we used single-cell transcriptomics to                       acquired during B-cell maturation, as observed in the exam-
complement the DNA methylation results in the patients                            ple of the EBF3 locus (Fig. 1D).
transitioning from MBL to CLL. Our analyses reveal that                              To more systematically evaluate regions that are consistently
changes in methylome and transcriptome are established                            altered in CLL, we identified differentially methylated regions
early on, already at the precursor stage, and remain remark-                      (DMR) between (i) unmutated CLL versus naïve B cells (n =
ably stable throughout the disease and even after therapy.                        23,206 DMRs) and (ii) mutated CLL versus memory B cells

Figure 1. CLL methylation signatures distinguish CLL from normal B cells. A, Schematic representation of progression from the precursor state of MBL
to CLL, depicting the extended period of “watch and wait” (w/w) until first treatment and an overview of the patient cohort from which 109 samples were
collected to generate RRBS data. Combination chemoimmunotherapy (CIT; FC/FCR) typically leads to a rapid decrement in WBC counts. Our cohort included
samples from 23 MBL, 5 paired samples of MBL and CLL, and 25 CLL patients. More specifically, the MBL samples are n = 20 high and n = 3 low count [2 with
unmutated IGHV (≥98% homology with germline sequence), 18 with mutated IGHV (0.25) and hypomethylated (
The Altered DNA Methylation Landscape in CLL                                                                                                                                                                                                                                                     RESEARCH ARTICLE

A                                                                                                           Treatment            Treatment
                                                                                                                                                                       D
                                                                                                                                                                                                                131.74 mb                                                                 131.76 mb
                                                                                                                                                                                   chr10
                                                             MBL                                 CLL                                                                                         1
                                                                                                                                                                                             0                                                                                                                                naiBC

                                                                                                                                                                           CpG methylation
                                                                                                                                                                                             1
                        (WBC)                                                                                                                                                                0                                                                                                                                memBC

                                                                                                                                                                                             1

               Low-count MBL                                                                                                                                                                 0                                                                                                                                Unmut.
                   (n = 3)                                                                                                                                                                                                                                                                                                             CLL
                                                                                                                                                                                             1
                                        Unmut.
                                                                                                                                                                                             0                                                                                                                                Mut.
                                        Mutated
                                       Unknown
                                                                                                                                                                                                                                                                                                             EBF3
              High-count MBL
                  (n = 20)
                                                    A                                                                                                                  E
                       MBL – CLL                    B                                                                                                                                                B-cell–related DMRs (n = 22,325)                                                   CLL DMRs (n = 3,475)
                                                    C
                        (n = 5)                     D

                                                                                                                                                                                                                                         Chromatin

                                                                                                                                                                                                                                                                                                             Chromatin
                                                    E

                                                                                                                                                                                                                                         DMRs

                                                                                                                                                                                                                                                                                                             DMRs
                                                                                                                                                                                                                                         Gene

                                                                                                                                                                                                                                                                                                             Gene
                                        Unmut.

                                                                                                                                                                                                                                         CGIs

                                                                                                                                                                                                                                                                                                             CGIs
                                                                −5        0                  5
                                        Mutated                   Years to CLL
                                   1
                                   2   Unknown
                                   3
                                   4
                                   5
                                   6
                                   7
                                   8
                           CLL     9
                         (n = 21) 10
                                  11
                      w/w FC/FCR 12
                                  13
                                  14
                                  15
                                  16
                                  17
                                  18
                                  19
                                  20
                                  21

                                                                                                                                                                                                        naiBC
                                                                                                                                                                                                                memBC
                                                                                                                                                                                                                        Unmut.
                                                                                                                                                                                                                                 Mut.

                                                                                                                                                                                                                                         n = 1,303
                                                                                                                                                                                                                                         n = 1,706
                                                                                                                                                                                                                                         n = 4,984

                                                                                                                                                                                                                                                                                     naiBC
                                                                                                                                                                                                                                                                                    memBC
                                                                                                                                                                                                                                                                                             Unmut.
                                                                                                                                                                                                                                                                                                      Mut.
                                                                                                                                                                                                                                                                                                              n = 82
                                                                                                                                                                                                                                                                                                             n = 135
                                                                                                                                                                                                                                                                                                             n = 658
                                                            – 20         –15     –10                   –5       0           5
                                                                           Years to treatment
                          CLL                      V1                                                                                                                                                                                                                                           CLL
                                                   V2                                                                                                                                                                       CLL
                         (n = 4)                   V3
                       Venetoclax                  V4                                                                                                                                                 Methylation                   DMRs         CGI                            Gene                     Chromatin state
                                                                                                                                                                                                                                     Hype         Island                          Promoter                 Promoter
                                                                                                                                       0           12         24                                                                     Hypo         Shore                           Body                     Poised promoter
                                                                                                                                                                                                       0                1                                                                                  Enhancer
                                                                                                                                           Months                                                                                                 Shelf                           Intergenic
                                                                                                                                                                                                                                                                                                           Transcription
                                                                                                                                                                                                                                                                                                           Insulator
                                                                                                                                                                                                                                                                                                           Heterochromatin

B                                                                                                                                                                                                                                                F
                  1                                                        5.4                                                     11                                                                   5.3
                                       r = 0.95                                                  r = 0.93                                                   r = 0.96
                                                                                 CLL unmutated

                                                                                                                                            CLL mutated

                                           2.2%                                                     0.6%                                                       0.4%
                                                                                                                                                                                                                                                                                     CLL unmutated                  CLL mutated
                         memBC

                                                                           %                                                       %                                                                    %                                                                              vs. naiBC                     vs. memBC
                                                                                                                                                                                                                                                                               20
                                                                                                                                                                                                                                                      Number of DMRs (×10 3)

                                                                                                                                                                                                                                                                                                                             Hyper
                                                           5.4%                                                     11%                                                            5.3%
    CpG methylation

                                                                                                                                                                                                                            Density                                                                                          Hypo
                                                                                                                                                                                                                                                                               15
                  0                                                        2.2                                                     0.6                                                                  0.4         Low                 High
                                                  naiBC                                                     naiBC                                                  memBC
                                                                                                                                                                                                                                                                               10
                  1                                                        2.7                                                     12.1                                                                 6.5             ∆ Methylation
                                       r = 0.96                                                  r = 0.91                                                   r = 0.95                                                       [−1, −0.25]
                                                                                                                                            CLL unmutated

                                                                                                                                                                                                                           [−0.15, 0.15]
                         CLL mutated

                                                                                 CLL mutated

                                           2.4                                                      1.9%                                                       0.9%                                                                                                             5
                                                                                                                                                                                                                           [0.25, 1]
                                                                           %                                                       %                                                                    %
                                                                                                                                                                                                                                                                                0
                                                                                                                                                                                                                                                                                         B cell CLL                  B cell CLL
                                                           2.7%                                                     12.1%                                                          6.5%
                                                                                                                                                                                                                                                                                        related                     related
                  0                                                        2.4                                                     1.9                                                                  0.9
                                           CLL unmutated                                                    naiBC                                                  memBC
                                  0                                  1                      0                                1                          0                                        1
                                                                                                   CpG methylation

C                                                                                                                                                                      G
                                                                                                                                                                                                                                                                                    P
                                                         CLL unmutated
                                                                                                                                                                                                     PI3 kinase pathway                                                         0.005
                                                                         memBC                                             CLL                                                                       EGF receptor signaling pathway                                             0.000
                                                                                                                          mutated
                                                                                                                                                                                                     T cell activation                                                          0.001
                                                                  gcBC                                                                                                                               B cell activation                                                          0.005

                                                  preB2C                                                                                                                                             VEGF signaling pathway                                                     0.003
                                                                                                                                                                                                     Ras pathway                                                                0.012
                                                  HPC                                                                                                                                                Thyrotropin-rel. hormone receptor                                          0.020
                                                        naiBC        PCT                                                                                                                             FGF signaling pathway                                                      0.006
                                                                                                                            CLL                                                                      CCKR signaling map                                                         0.001
                                                                                                                          unmutated
                                                                          bmPC                                                                                                                       Angiogenesis                                                               0.004

                                                                                                                                                                                                 0                            1                                 2
                                                                                                                                                                                                                        Enrichment ratio
                                                                              B cell
                                                                           development

                                                                                                                                                                                                                January 2021                         blood CANCER DISCOVERY | OF4

    Downloaded from https://bloodcancerdiscov.aacrjournals.org at Max Planck Insitut fuer Molekulare Genetik on January 12,
                               2021. Copyright 2020 American Association for Cancer Research.
RESEARCH ARTICLE                                                                                                                           Kretzmer et al.

(n = 4,653 DMRs; Supplementary Table S2; ref. 32). To disen-                     samples collected during natural CLL progression. CLL
tangle methylation changes associated with normal cell line-                     allows that leukemic burden can be approximately esti-
age–specific differentiation from potentially cancer-related                     mated by measuring the WBC count over time since it is,
changes, we classified the aggregate of these two sets of DMRs                   for many patients, primarily a circulating malignancy. To
as B-cell related (n = 22,325) or CLL (n = 3,475), depending on                  study the CLL methylome before and after the first treat-
whether they were classified as dynamically changing during                      ment, we performed unsupervised phylogenetic clustering
normal B-cell development (Fig. 1E and F; Methods; ref. 30).                     of the pre- and posttreatment (fludarabine, cyclophospha-
The majority (85%) of the DMRs overlapped with develop-                          mide, and rituximab, FCR) samples of patients. Interest-
mental regions, whereas 15% were classified as CLL DMRs                          ingly, we found no consistent methylation differences that
(Fig. 1E and F; Supplementary Fig. S1B). Based on the clus-                      separate pre- and posttreatment samples, and also no WBC-
tering, B-cell lineage–related DMRs showed a gradual shift,                      related effects could be seen in the clustering (Fig. 2A).
mostly toward hypomethylation, from naïve to memory and                          Next, we compared methylation levels across patient time
both CLL subtypes, reflecting the normal B-cell developmen-                      points for selected chromatin states derived from pub-
tal changes that are retained in CLL. In contrast, as expected,                  lished data of the lymphoblastoid cell line GM12878 (33).
the set of CLL DMRs readily distinguished normal B cells                         Despite vastly different growth patterns and subclonal
from CLL (Fig. 1E). Moreover, genes that were associated                         dynamics (defined by prior genetic characterization; ref.
with CLL DMRs were found to be overrepresented among                             28), global methylation levels of various genomic features,
pathways related to cell growth and survival, proliferation,                     such as heterochromatin, strong enhancers, and poised
and neoplastic transformation, suggesting possible regula-                       promoters, for serial samples from all 21 patients remained
tory relevance (Fig. 1G).                                                        stable and were consequently independent of the dynamic
   We additionally confirmed the DMRs to be a distinctive                        changes in WBC counts (Fig. 2B, left; Supplementary Fig.
feature between normal B and CLL cells by analyzing repli-                       S3A and S3B).
cates of CD5-positive and -negative naïve and memory B cells                        We observed substantial posttreatment reduction in WBCs
from a set of three healthy donors. Genome-wide phyloge-                         creating population bottlenecks for the nine patients follow-
netic tree clustering and the correlation of methylation rates                   ing treatment with FCR (Fig. 2B; Supplementary Fig. S3A).
revealed two major clusters, separating the samples by naïve                     However, this was not associated with any notable DNA
and memory B cells but not by CD5 status (Supplementary                          methylation changes over the three representative genomic
Fig. S2A and S2B). Based on the presence of the CLL-spe-                         features or the number of distinct epialleles present (Fig. 2B;
cific DMRs, CD5-sorted healthy donor samples were found                          Supplementary Fig. S3; ref. 34). Indeed, methylation levels
to cluster into the group of previously published reference                      were mostly independent of detected subclonal genetic evolu-
B cells, hence demonstrating similar methylation in DMRs                         tion and from patterns of growth. Similar stability was also
independent of CD5 status of naïve or memory B-cell state                        found at the previously identified DMRs, with once acquired
(Supplementary Fig. S2C).                                                        changes appearing to persist during CLL progression (Fig.
                                                                                 2C). These deregulated regions, including the example of
CLL Methylome Remains Mostly Unchanged                                           NFATC1 (Fig. 2D), further highlight the remarkable stability
after Treatment                                                                  of methylation patterns.
  To evaluate the stability of these DMRs and the dynamics                          We also compared the nine patients by focusing on the
of the CLL methylome over time, we analyzed longitudinal                         clinically most divergent time points, i.e., first and last

Figure 2. The CLL methylome remains mostly unchanged over disease progression, including after treatment. A, Phylogenetic tree of normal B cells and
all measured time points of patients with CLL (n = 83) using global CpG methylation levels. Each line represents a sample; subtrees are multiple samples
of the same patient. Yellow lines represent posttreatment samples (chemoimmunotherapy and venetoclax V1–V4). Mutated and unmutated are colored as
before, and all patient numbers are shown next to the respective branches. All samples from the same patient clustered together, whereas normal samples
are distinct from the CLL cohort. B, WBC counts and methylation dynamics for selected genomic features to represent global hypomethylation (HC, hetero-
chromatin; SE, strong enhancers) and hypermethylation (PP, poised promoters) across disease progression for patients 11, 13, 16, and 17 (for all others,
see Supplementary Fig. S3A). The methylation levels remain constant over time and after treatment. Black dots: WBC counts (left axis). Blue lines and dots:
measurements of CpG methylation levels (right axis). Black arrows and dashed lines indicate collected time points for DNA methylation analysis. Boxplots
to the right display the coverage normalized epiallele fraction in poised promoter regions. Treatment exposure at time points is indicated as shaded
boxplots. In addition to the methylation level, the epiallelic fractions’ distribution stays stable over time and after treatment. WBC plots are taken from
the same patients studied in ref. 28 and have been overlaid with our DNA methylation data. Distinct genetically defined subclones are indicated with the
different colors. Tx., treatment. C, Left, average methylation levels per sample (columns) for CLL DMRs (rows) of unmutated CLL versus naïve B cells and
mutated versus memory B-cell comparisons. Rows were ordered using unsupervised hierarchical clustering. Right, average methylation levels per sample
(columns) for B-cell–related DMRs (rows) of unmutated CLL versus naïve B cells and mutated versus memory B-cell comparisons. Rows were ordered using
unsupervised hierarchical clustering. D, Average CpG methylation in naïve B cells (light gray), memory B cells (dark gray), and five serial samples collected
from patient 17 (orange, top to bottom: three pretreatment and two posttreatment samples) across the NFATC1 locus. Dots represent CpG-level methyla-
tion of each sample. E, Correlation of CpG methylation levels in the first pre- and last pretreatment sample as well as last pre- and first posttreatment of
patient 17 at CpG-level resolution (n = 1,912,382). For all other samples, see Supplementary Table S3. Bar charts give fraction of hypermethylated (>0.25)
and hypomethylated (0.25) and hypomethylated (
The Altered DNA Methylation Landscape in CLL                                                                                                                                                                                                                                                                               RESEARCH ARTICLE

      A                                                             17
                                                                               18
                                                                                                                                                     B                                                Tx.                                  Tx.
                                                                                                                                                                                                                                                                                                    Average
                                       CLL    19                                       8                                                                                                                        Patient 11                                                                         methylation
                                      mutated                                                  10                                                                    400                                                                                                                                               1.00                                                         1.00
                                                                                                                                                                                                                                                                                   HC
                                          16                                                                                                                                                                                                                                                                           0.75                                                         0.75
                                                                                                                                                                                                                                                                                   SE
                                                                                                                                                                     200                                                                                                                                               0.50                                                         0.50
                                                                                                        7                                                                                                                                                                          PP                                  0.25                                                         0.25
                        4                                                                                                                                                                                                                                                                                              0.00
                                                                                                                                                                       0

                                                                                                                                                                                                                                                                                                                                        Poised promoter (PP) epi-allele frequency
                                                                                                                     21                                                                                                                                                                                                                                                               0
                                                                                                                                       V2                                      2                4                   6                      8                             10                   12
              9
                                                                                                                                           V1                        300
                                                                                                                                                                                                                    Patient 13                                                                                         1.00
                                                                                                                                                                                                                                                                                                                                                                                    1.00
                                                                                                                                           15                        200                                                                                                  HC                                           0.75                                                         0.75
                                                                                                                                                                                                                                                                          SE                                           0.50                                                         0.50
                                                                                                                                                                     100
                                                                                                                                            20                                                                                                                            PP                                           0.25

                                                                                                                                                      WBC (×109/L)
                                                                                                                                                                                                                                                                                                                                                                                    0.25
                                                                                                                                                                       0                                                                                                                                               0.00
                                                                                                                                                                                                                                                                                                                                                                                       0
                                                                                                                                                14                                      2                   4                6                                   8

                                                                                                                                                12                   100                                            Patient 16                                                                                                                                                      1.00
                                                                                                                                                                                                                                                                                                                       1.00
                                                                                                                                                                                                                                                                                          HC                                                                                        0.75
                                                                                                                                                6                                                                                                                                                                      0.75
                                                                                                                                                                      50                                                                                                                  SE                           0.50                                                         0.50
      B cells                                                                                                                                                                                                                                                                             PP                           0.25                                                         0.25
                                                                                                                                           13
                                                                                                                                                                       0                                                                                                                                               0.00                                                            0
                                                                                                                                                                           0                2                   4                6                                   8                   10
                                                                                                                                       2                                                                                                                                                                                                                                            1.00
             Clustered samples                                                                                                                       400                                                            Patient 17
             Posttreatment                                     1                                                                                                                                                                                                                                                       1.00                                                         0.75
                                                                                                                                  11                                                                                                                                                HC
                                                                     3                                                                                                                                                                                                                                                 0.75                                                         0.50
                                                                                                                                                     200                                                                                                                            SE                                 0.50
                                                              CLL                                                                                                                                                                                                                                                                                                                   0.25
                                                                                                                                                                                                                                                                                    PP                                 0.25
                                                            unmutated 5                                                                                0                                                                                                                                                               0.00
                                                                                                                                                                                                                                                                                                                                                                                       0
                                                                                                    V4                                                                                                                                                                                                                                                                                     1 2 3 4 5
                                                                                                                                                                      12           14                 16                18                                 20                 22              24
                                                                                           V3
                                                                                                                                                                                                    Years after diagnosis                                                                                                                                                            Time points across
                                                                                                                                                                                                                                                                                                                                                                                       disease course
      C                                                              CLL DMRs (n = 3,475)                                                                                                       B-cell–related DMRs (n = 22,325)

                                                                                                                                                                                                                                                                                                                        Type
                                                                                                                                                                                                                                                                                                                        Patient

                                                                                                                                                                                                                                                                                                                                        Normal B cells
                                                                                                                                                                                                                                                                                                                                        CLL unmutated
                                                                                                                                                                                                                                                                                                                                        CLL mutated

                                                                                                                                                                                                                                                                                                                                  Methylation

                                                                                                                                                                                                                                                                                                                              0                                                            1

      D                                        77.15 mb                                                                                                                                               77.25 mb
                               chr18
                                      1
                                                                                                                                                                                                                                                                                              naiBC
                                      1
                    CpG methylation

                                                                                                                                                                                                                                                                                              memBC
                                      1                                                                                                                                                                                                                                                       1 pre
                                      1                                                                                                                                                                                                                                                       2 pre
                                      1
                                                                                                                                                                                                                                                                                                                           Patient 17
                                                                                                                                                                                                                                                                                              3 pre
                                      1
                                                                                                                                                                                                                                                                                              1 post
                                      1
                                                                                                                                                                                                                                                                                              2 post
                                      0
                                      CGIs
                                              NFATC1

      E                                                   Density
                                                                                    ∆ Methylation
                                                                                       [–1, –0.25]
                                                                                                                                                                                                                        F
           Patient 17                            Low                High               [– 0.15, 0.15]
                                                                                       [0.25, 1]
                                1                                                          2.8                                                                                                  3.5                                                        1.0                                                         1
                                              r = 0.97                                                                             r = 0.96
                                                                                                                                                                                                                                 Correlation coefficient
                                                                                                            First posttreatment

                                                                                                                                                                                                                                                                                                   ∆ CpG methylation
            CpG methylation
           last pretreatment

                                                                                                                                                                                                                                                                         ??

                                                 2.3%                                                                                      3.2%                                                                                                                                     ??

                                                                                                                                                                                                                                                           0.9
                                                                                           %                                                                                                    %                                                                                                                      0

                                                                     2.8%                                                                                                  3.5%
                                                                                                                                                                                                                                                           0.8
                                0                                                          2.3                                                                                                  3.2
                                                                                                                                                                                                                                                                                                                  –1
                                          0       First pretreatment            1            0                                              Last pretreatment                       1                                                                            Pre- Post-                                                   Pre- Post-
                                                                               CpG methylation                                                                                                                                                                   treatment                                                    treatment

      G                                                    V1                                                                                                V2
                                1                                                       1.5                                                                                                     2.9
                                              r = 0.97                                                                             r = 0.96
           CpG methylation

                                                                                                    CpG methylation

                                                 2.6%                                                                                       2.4%
            posttreatment

                                                                                                     posttreatment

                                                                                        %                                                                                                       %

                                                                     1.5%                                                                                                  2.9%

                                0                                                       2.6                                                                                                     2.4

                                          0                                    1               0                                                                                    1
                                                                         CpG methylation pretreatment

                                                                                                                                                                                                                January 2021                                                   blood CANCER DISCOVERY | OF6

  Downloaded from https://bloodcancerdiscov.aacrjournals.org at Max Planck Insitut fuer Molekulare Genetik on January 12,
                             2021. Copyright 2020 American Association for Cancer Research.
RESEARCH ARTICLE                                                                                                  Kretzmer et al.

pretreatment and last pre- and first posttreatment. No joint     vast majority (89% and 86%) appeared in regions shared with
DMRs between all first pretreatment versus last pretreat-        normal B-cell development. The remaining DMRs comprised
ment time points could be detected. The variability between      only 8% of the aforementioned dynamic CpGs. However,
samples of the same patient and the lack of shared events        with 50% of the dynamic CpGs still localized to CLL-specific
appear to be more in line with patient-specific evolution        regions, our data suggest the presence of randomly modu-
than a common path across patients. Moreover, correlation        lated individual CpGs rather than stretches of adjacent CpGs.
analysis on the CpG level also confirmed a largely stable        Furthermore, about half of the CLL DMRs were located
methylome across CLL evolution and even after treatment          in heterochromatin, supporting the assumption that these
(Fig. 2E and F).                                                 may represent a secondary effect (Supplementary Fig. S5E).
   To explore if the observed methylation stability is therapy   Finally, gene set enrichment analysis revealed pathways sup-
specific, we next analyzed four patients treated with the BCL2   ported by only a few genes (i.e., B-cell and T-cell pathways
inhibitor venetoclax (35). As with the FCR chemoimmuno-          supported by three genes and p53 by two genes) or pathways
therapy-treated patients, these CLL samples collected before     with no apparent link to CLL (Supplementary Fig. S5E).
and after venetoclax exposure clustered tightly together,           In sum, although a low number of patient-specific methyl-
within the group of chemoimmunotherapy-treated patients          ation changes accompany the individual tumor evolution, we
(Fig. 2A and G). We further confirmed the stability of the       observed remarkable stability and similarity of the acquired
B-cell–related and CLL DMRs in this treatment cohort, in         CLL methylome across patients.
which we could only detect globally on average less than 6%
of CpGs to vary between pre- and post-venetoclax treatment       The Altered Methylome Is Already Detectable at
(Supplementary Fig. S4A–S4D).                                    the MBL Stage
   Combined with the early emergence of the altered methyla-        Because we observed an altered methylome already pre-
tion landscape, our posttreatment results highlight the strik-   sent within the first time points of the characterized CLL
ing stability of the CLL methylome, with minimal changes         specimens, we next turned to specimens collected from our
over disease progression, including after treatment.             patients with MBL to evaluate the cancer precursor methyl-
                                                                 ome. We again performed unsupervised phylogenetic cluster-
Variations in the CLL Methylome Appear                           ing but now including the high-count MBL samples. Despite
Stochastic among Patients                                        clinical classification as a precursor state, all of the MBL
   Because only a few patient-specific methylation dynamics      cases were found to cluster directly among the group of CLL
were observed, we assessed if their occurrence exceeded ran-     samples and not to branch earlier from the trunk of this tree
dom dynamics present among normal B-cell subtypes. Focus-        (Fig. 3A). Most strikingly, all five matched MBL–CLL cases
ing on the chemoimmunotherapy-treated patient samples,           appeared to be as similar to each other as the biological repli-
we first compared the number of dynamic CpGs between first       cates of different healthy B-cell types and much more similar
and last pretreatment, and last pre- and first posttreatment     to each other than to the other CLL cases. Thus, patient-specific
CLL samples with differences between biological replicates       methylation signatures appeared to be stronger than any
of naïve and memory B cells (Supplementary Fig. S5A; Sup-        preleukemic versus leukemic methylation signature, which
plementary Table S3). Although we did not detect any cor-        would have otherwise resulted in the separate clustering of
relation with the time to treatment, we observed the fraction    the MBL samples from the CLL samples.
of dynamic CpGs to be slightly higher in posttreatment              Strikingly, the identified CLL-associated DMRs were also
samples. Overall, only 1 of 21 patients stood out with higher    present in our patients with MBL (Supplementary Fig. S6A
variability (r = 0.94 pretreatment and r = 0.93 for pre- to      and S6B). We extended the analysis to search for additional
posttreatment comparison); however, this is very similar to      consistently occurring methylation changes that could
the variation observed at the transition of naïve to memory      potentially drive the MBL-to-CLL transition. However, no
B cells (r = 0.95). Moreover, the relative number of CpGs        statistically significant DMRs could be detected between the
that exhibited substantial differences was less than 5% of all   methylomes of the individuals that transitioned from MBL
considered CpGs for most CLL cases, and those CpGs were          to CLL. As a representative example of this shared landscape
frequently located in heterochromatin regions and outside        between MBL and CLL, we show the methylation patterns
of CpG islands (Supplementary Fig. S5B). Most of the dynamic     for the gene NFATC1, which has been reported as overex-
CpGs were restricted to individual patients, and 99.9% of CpGs   pressed in CLL due to loss of epigenetic repression (36) and
were shared within a maximum of six and four patients for pre-   is an upstream effector of BCL2, which itself is frequently
and posttreatment comparisons, respectively (Supplementary       deregulated due to chromosomal translocations in B-cell
Fig. S5C), thus again confirming limited variation and a high    malignancies (Fig. 3B). Through a correlation analysis at sin-
degree of stability of CLL methylome over time.                  gle CpG resolution of the methylomes of the matched MBL
   To further separate random single dynamic position events     and CLL pairs, we further observed the striking similarity
from consistently altered regions during disease progres-        between MBL and CLL methylomes. These results revealed
sion and following treatment, we focused on patient-specific     only minor, if any, targeted remodeling of the methylome
DMRs identified either between first and last pretreatment       between the precursor and CLL stages within a given patient
for all 21 patients (Supplementary Fig. S5D, left), or between   (Fig. 3C; Supplementary Fig. S6C). To appreciate this high
the last pre- and first posttreatment for the nine patients      similarity, we note that comparably high correlations are
(Supplementary Fig. S5D, right). We found a median of 106        otherwise found between biological replicates of flow cyto-
pre- and 143 posttreatment DMRs per sample. Of these, the        metrically isolated normal B-cell subpopulations.

OF7 | blood CANCER DISCOVERY          January 2021                                                             AACRJournals.org

     Downloaded from https://bloodcancerdiscov.aacrjournals.org at Max Planck Insitut fuer Molekulare Genetik on January 12,
                                2021. Copyright 2020 American Association for Cancer Research.
The Altered DNA Methylation Landscape in CLL                                                                                                                                                                                                                                RESEARCH ARTICLE

    A                                               D
                                                                                                                               D                                                                                                 E
                                              E

                                                                                                                                                naiBC

                                                                                                                                                                                                                                                             15

                                                                                                                                                                                                                                     Number of CpGs (×103)
                                                                                                                                          memBC
                                                                                                  C
                                                                                                                                      MBL-CLL-A
                                                                                                                                                                                                                                                             10
                                                                                                                                      MBL-CLL-B
                       B cells
                                                                                                                                      MBL-CLL-C

                                                                                                                                                                                                                                                                              Frequency
                                                                                           A                                                                                                                                                                                                1
                                                                                                                                                                                                                                                              5                             2
                                                                                                                                      MBL-CLL-D                                                                                                                                             3
                                                                                       MBL CLL                                                                                                                                                                                              4
                                                      B                                           Unmut.                              MBL-CLL-E
                                                                                                  Mutated                                                                                                                                                     0
                                                                                                                                                         −0.25                       0            0.25                                                             >0.25 0.25) and hypomethylated (0.25 (n = 1,801,907 CpGs). Methylation
differences among biological replicates were less than 2% (naïve B cells) and 3.6% to 9.5% (memory B cells) of CpGs with a difference of >0.25. Per box-
plot, the median value is indicated by the centerline, with first and third quartiles as outlines of boxes, and 1.5× interquartile range as whiskers; data beyond
the end of the whiskers are omitted. E, Number of CpGs with a difference of >0.25 in MBL–CLL comparisons and frequency of recurrent observations
across the five pairs (light gray, unique for one pair, to dark grey, observed in four of five pairs, no five of five detected). The minority of CpGs are recur-
rently differentially methylated. F, Comparison of average chromatin state methylation among DNA from normal B cells, MBL, and CLLs. Black horizontal
lines, matched MBL–CLL pairs (n = 1,801,907 CpGs). G, Comparison of chromatin state proportions of discordant methylation rates (proportion of discord-
ant reads, PDR) between MBL and CLLs. Black horizontal lines, matched MBL–CLL pairs.

                                                                                                                                                                                                 January 2021                                                blood CANCER DISCOVERY | OF8

   Downloaded from https://bloodcancerdiscov.aacrjournals.org at Max Planck Insitut fuer Molekulare Genetik on January 12,
                              2021. Copyright 2020 American Association for Cancer Research.
RESEARCH ARTICLE                                                                                                  Kretzmer et al.

   Also, at single CpG resolution, we found that at most 4%         Based on the single-cell expression profiles, the differences
of all covered CpGs showed a difference of 0.25 or greater       between MBL and CLL appear to be marginal, which agrees
between MBL and CLL samples of the same patient (Fig.            with the lack of separation by clustering on single-cell tran-
3D). An expanded analysis to examine whether individual          scriptomes. Combined with the lack of DNA methylation
CpGs were conserved targets across patients revealed this        changes in the MBL-to-CLL transition, it points to an earlier
is not the case (Fig. 3E). Finally, we compared methylation      molecular event that sets the normal cells already on the path
and read-discordance levels for different chromatin states.      to tumorigenesis.
This showed that differences and variability compared with
normal B cells affect MBL and CLL cases to the same degree,      Individual MBL and CLL Cells Show Little DNA
again highlighting that the similarity of MBL and CLL is not     Methylation Heterogeneity
merely based on patient identity (Fig. 3F and G).                   Our bulk data indicated an early conserved switch in the
   Lastly, as most of our patients with MBL had already rela-    DNA methylation landscape across patients with CLL, and
tively elevated WBC counts, we further extended our investi-     our single-cell transcriptome data demonstrate the transcrip-
gation to include CD5+ sorted cells from three patients with     tional similarity between matched MBL and CLL. However,
low-count MBL (Supplementary Fig. S7A). Although the sig-        bulk measurements cannot completely distinguish the con-
nal is expectedly not as strong due to the rare proportion of    tributions of diverse cellular subpopulations to the overall
cells sequenced and the potential contamination with CD5+        picture. Subclonal evolution and genetic heterogeneity are
normal B cells, we do detect evidence of the same characteris-   common in CLL (37–39). This understanding motivated us
tic epigenetic alterations as observed in high-count MBL and     to investigate single-cell methylation maps from two patients
CLL (Supplementary Fig. S7B–S7D).                                with CLL, two patients with MBL, and age-matched B cells
   Taken together, our comprehensive analysis of 53 patients     collected from two healthy adult volunteers, uncovering a
and 101 pretreatment RRBS datasets suggests that the tran-       stable level of mean methylation per cell on a global scale (Fig.
sition to the cancer methylome occurs early in the disease.      5A; Supplementary Table S1; ref. 40).
Analysis of patient-matched MBL and CLL shows that no               Analysis of our previously defined DMRs showed the pres-
consistent additional DNA methylation changes are seemingly      ence of aberrant methylation levels in all MBL/CLL cells
associated with disease progression.                             with sufficient coverage (Fig. 5B). When comparing naïve to
                                                                 memory with MBL and CLL cells, a gradual gain of meth-
Heterogeneous Expression Patterns Are                            ylation in B-cell–related and CLL hyper-DMRs was observed.
Present Per Patient but Are Stable across                        Conversely, hypomethylated B-cell–related and CLL DMRs
Natural Disease Progression                                      appeared slightly stronger in separating normal from dis-
   Complementing our methylation analysis, we profiled           eased (MBL and CLL) cells (Fig. 5B). Phylogenetic clustering
the transcriptomes of approximately 60k single cells iso-        separated CLL, memory B, and naïve B cells, with no differ-
lated from healthy donors and the five matched MBL–CLL           ences between the B-cell subpopulations with or without the
specimens (Fig. 4A). Unsupervised clustering revealed nine       presence of CD5 (Fig. 5C; ref. 12). Moreover, we observed
distinct clusters: four clusters representing peripheral         a clear separation between MBL and CLL versus normal,
blood mononuclear cells of the two healthy donors and the        with each forming a tight cluster in line within the observed
remaining five, with each representing one of five patient       stability of the methylome per patient. Of note, memory B
B cells (Fig. 4B). From the healthy donors, cell clusters of     cells, despite many shared features with the CLL methylome,
myeloid and lymphoid origin were readily identifiable based      cluster distinctly next to the naïve B cells and apart from the
on their marker gene expression. In contrast, the five clus-     MBL and CLL cells.
ters from patients were identified as CLL/MBL-mixed clus-           Our genome-wide single-cell methylation analysis thus
ters that showed expression of some B-cell marker genes,         complements our bulk data by further showing the clear
although less pronounced (Fig. 4C). When looking more            methylation difference between MBL and CLL compared
specifically at differentially expressed genes, we found lower   with sorted B-cell subtypes.
and heterogeneous expression for some characteristic B-cell
markers and similarly heterogeneous upregulation of genes
such as KLF2 and CD27 in the patient samples (Fig. 4D). Of       Discussion
note, the MBL and CLL cells per patient were transcription-         We show that the aberrant cancer methylome in CLL is
ally indistinguishable.                                          already established at the preneoplastic MBL stage and is con-
   Because the transcription-based clustering could not dis-     sistently present at the time of diagnosis across samples col-
tinguish the MBL and CLL cells, we instead used barcode          lected from 3 low-count and 20 high-count MBL, 5 matched
information per cell for annotation (Fig. 4E). We observed a     MBL–CLL pairs, and 25 patients with CLL. Although nor-
remarkable overlap for most clusters, supporting the strik-      mal B-cell maturation shows some similarities with the CLL
ing similarity of the MBL and CLL transcriptomes. Only the       methylome, these normal developmental changes are likely
MBL and CLL cells from patient A were slightly separated         insufficient to transform cells into proliferative MBL and
in the UMAP visualization. However, upon evaluation of           CLL. Nonetheless, the shared targets make a better under-
the highest-ranked marker genes for each MBL–CLL set, we         standing of the underlying mechanism and biological reason
found a surprisingly high concordance of expression of even      highly relevant. We also find a limited set of cancer-specific
the most differential expressed genes between MBL and CLL        targets that can be readily applied to distinguish all normal
cells (Fig. 4F).                                                 B-cell subtypes from MBL and CLL. These CLL DMRs are

OF9 | blood CANCER DISCOVERY          January 2021                                                             AACRJournals.org

     Downloaded from https://bloodcancerdiscov.aacrjournals.org at Max Planck Insitut fuer Molekulare Genetik on January 12,
                                2021. Copyright 2020 American Association for Cancer Research.
The Altered DNA Methylation Landscape in CLL                                                                                            RESEARCH ARTICLE

   A                                                                                     B
                                                                                                                           D
               Donor    Sample         # Cells            IGHV
               HD1      Blood          8,613
                                                                                                                 E            C                        T-cell
               HD2      Blood          8,966
                A       MBL/CLL     3,702/3,292       Mutated
                B       MBL/CLL     4,340/5,368       Mutated                                                                     B-cell
                C       MBL/CLL     5,183/4,654       Unmutated
                D       MBL/CLL     4,335/2,508       Unmutated
                                                                                                                                                         NK
                E       MBL/CLL     4,641/5,028       Mutated                                                    A            B

                                      Σ 60,630

                                                                                                UMAP-2
                                                                                                                                   Myeloid

                                                                                                         UMAP-1
   C                                                                                     D
                                                                          Norm.                                                                       Norm.
  Myeloid                                                               expression              B-cell                                              expression
   T cell                                                                    1                                                                          1
                                                                                                         A
      NK
   B cell                                                                                                B
        A                                                                    0                                                                          0
        B                                                                                                C
                                                                           % cells                                                                    % cells
       C                                                                     100                         D                                              100
       D                                                                     80                                                                         80
                                                                             60                                                                         60
        E                                                                    40                          E                                              40
                                                                             20                                                                         20
                                                                             0                                                                          0
                    LST1
                     AIF1

                   GZMA
                   PRF1

                  CD79A
                  MS4A1

                HLA-DRA
                   CD74

                                                                                                                MS4A1

                                                                                                                BANK1
                                                                                                             CCDC88A

                                                                                                                PEBP1

                                                                                                               PMAIP1
                                                                                                               VOPP1
                   CD3D
                   LDHB

                  CD79B
                   GN7R
                   CST3

                     IL32

                   CCL5

                                                                                                                  LTB

                                                                                                                  FOS
                   CD3E

                                                                                                               ABCA6

                                                                                                                 KLF2
                 GIMAP7
                    ILR7

                   NKG7
                   CST7
                     LYZ

                  CTSW

                                                                                                                 CD27
                                                                                                              TMSB4X

                                                                                                                 CLNK
                                                                                                                                                       Norm. expression
   E                                                  F                                                                                                     0         1

                                   MBL-D
                                   CLL-D
                                                        H3F3B
                                                          EIF1
                                                         JUNB
                                                        TCL1A
                                                        RPS27
                                                        RPS29
             CLL-E                       MBL-C           TPT1
                                        CLL-C          TUBB4B
             MBL-E                                       CKS2
                                                      MT-ATP6
                      CLL-A                 B cell     MT-ND2
              MBL-A                                      KLF6
                                                        DUSP1
    UMAP-2

                                    CLL-B             TSC22D3
                                    MBL-B
                                                                 CLL MBL      CLL        MBL       CLL           MBL    CLL       MBL                 CLL           MBL
             UMAP-1
                                                                    D                A                       C                B            B cell               E

Figure 4. Single-cell transcriptome analysis. A, Summary table with details of donors, tissue source, number of cells per sample, and IGHV status.
Patients were profiled in MBL as well as the CLL state using the 10x Genomics Chromium droplet single-cell RNA sequencing. HD, healthy donor. B, UMAP
displaying the groups found using the Louvain algorithm. The healthy donor cells split into B cells, T cells, myeloid cells, and natural killer (NK) cells. The
MBL and CLL cells of patients build distinct groups but are within a patient not distinguishable. C, Normalized gene expression level and the number of
positive cells of marker genes used to identify normal cell types in B. B-cell–specific genes show an aberrant expression profile in clusters derived from
patient cells. D, Normalized gene expression level and the number of positive cells of genes identified as marker genes between B cells and all patient
cells (Wilcoxon rank-sum test). E, UMAP of MBL, CLL, and B cells with artificially introduced identification of MBL and CLL cells. MBL and CLL cells cluster
farther apart from the B cells than from other cells of the same patient and are highly overlapping for almost all patients. F, Heatmap displaying single-cell
gene expression of highest-ranking marker genes between MBL and CLL cells of the same patient (Wilcoxon rank-sum test). Expression levels are very
similar among cells of the same patient as compared with other patients or B cells, a parameter that is also supported by hierarchical clustering.

overrepresented among pathways involved in proliferation,                               Our results provide a comprehensive picture of the DNA
cell survival, and growth. Although it remains technically                           methylation alterations in MBL and CLL and demonstrate
challenging to experimentally explore if, for instance, the                          that the switch to an abnormal landscape has consistently
addition of just these CLL DMRs alone is sufficient to drive                         occurred before any of our measured time points. This
the tumorigenic transition or facilitate extended and rapid                          notably expands findings from prior array-based studies
proliferation, we anticipate that these targets are certainly                        (41, 42) and complements recent work on the genetic evo-
worthy of future exploration, including with emerging epige­                         lution across the 21 CLL samples (28). Similar early altera-
nome editing tools.                                                                  tions of the methylome have also been noted in colorectal

                                                                                               January 2021            blood CANCER DISCOVERY | OF10

   Downloaded from https://bloodcancerdiscov.aacrjournals.org at Max Planck Insitut fuer Molekulare Genetik on January 12,
                              2021. Copyright 2020 American Association for Cancer Research.
RESEARCH ARTICLE                                                                                                                                 Kretzmer et al.

         A                                      Avg.                              B
                                     # CpGs methylation                                                                    B-cell–related DMRs
                             # Cells (×103 ) SINE CGI
                                                                                                            1.00   Hyper              Hypo
                CD5+ naiBC     41      823   0.76 0.20
                naiBC          32      643   0.75 0.22

                                                                                      Average methylation
                CD5+ memBC 48          747   0.73 0.21                                                      0.75
                memBC          44      916   0.71 0.23
                MBL_sc05       30      439   0.69 0.17
                                                                                                            0.50
                MBL_sc08       41      550   0.67 0.18
                CLL_sc12 (1)   94      328   0.75 0.18
                         (1)   95      447   0.73 0.22                                                      0.25
                CLL_sc03

         C                                                                                                    0
                         MBL_sc08                         naiBC/
                                                        CD5+ naiBC                                                            CLL DMRs
              MBL_sc05                                                                                             Hyper              Hypo
                                                                                                            1.00

                                                                                      Average methylation
                                                                                                            0.75

                                                                                                            0.50

                                                                 memBC/                                     0.25
             CLL_sc12                                          CD5+ memBC

                                                                                                              0
                        CLL_sc03

Figure 5. Single-cell DNA methylation analysis of MBL, CLL, and normal B cells. A, Summary table of methylation data generated from MBL (rose,
brown), CLL (red, orange), and flow cytometrically isolated normal B-cell subpopulations [naïve B cells, CD19+CD27− (lightest gray), CD5+ naïve B cells
(CD19+CD27−, light gray), memory B cells (CD19+CD27+, dark gray), CD5+ memory B cells (CD19+CD27+, darkest gray)]. n = 611,452 CpGs covered on aver-
age. (1)Data for CLL were taken from Gaiti and colleagues (40). B, Average methylation levels for B-cell–related and CLL DMRs per cell confirm aberrant
methylation of these regions being consistently observed across all cells. CLL and MBL cells show strong patterns of hypomethylation, whereas the small
number of hypermethylated DMRs (n = 888 and 70, respectively) is already present in MBL but also seems to be slightly more prevalent in CLL cells. C,
Unsupervised hierarchical clustering of MBL, CLL, and normal B cells. MBL and CLL cluster together into one clade. Although the clonal MBL and CLL
separate by donor, naïve and memory B cells are intermingled with their CD5-positive counterparts.

cancer where the aberrant methylation landscape is already                       Aside from these considerations, we note that the MBL and
detectable in premalignant colorectal adenomas and ampli-                     CLL methylome and transcriptome are extremely stable once
fies upon the colorectal cancer state (43). Taken together                    acquired. In contrast to the dramatic fluctuations in tumor
with the near universality of the altered cancer methylome                    burden (estimated by the changes in the level of WBC counts)
(5), the possibly conserved early emergence points to an                      across disease course, methylation levels are not consistently
important role for the epigenetic change in a tumorigenic                     affected by clonal expansion or treatment-induced bottlenecks.
transition. Although it is difficult to establish causality,                  The latter may reflect that cells surviving treatment represent
we speculate that the altered landscape may provide a                         either the average of all subclones or that limited methylation
receptive platform for the disease progression. Alterna-                      heterogeneity is present across all subclones. From a practi-
tively, the cancer methylome may simply be a consequence                      cal standpoint, the stability of the methylome in patients
of a developmental program that may regulate numerous                         with CLL limits its utility to track disease progression. Still,
cellular attributes, including methylation (5). In the latter                 it may be valuable for early detection and helpful to assess
case, it may well be other features driving the tumorigenic                   the efficiency of treatments. We observed neither any notable
transition, and the methylome is only one biological conse-                   consistency of dynamic CpGs along with the MBL to CLL
quence of the entire program. Although this seems possible,                   nor CLL progression and treatment, indicating that the few
it should be noted that this altered DNA methylation land-                    observed dynamics over the disease progression are possibly
scape is maintained across patients sometimes for decades                     an accumulative secondary effect. During disease progression,
and found in nearly all cancer types, raising the question of                 considerable increases in WBC counts are only juxtaposed with
why it is not diverging if it has no functional role. Another                 subtle methylome changes. These largely constant methyla-
possibility that we can consider here is that the altered                     tion levels within each patient indicate that increased clonal
methylome presents an optimized epigenetic state to main-                     expansion occurred without substantial additional departure
tain viability with maximum proliferation and the minimal                     from the preexisting, already aberrant landscape. The stabil-
energy requirement for DNA methylation maintenance.                           ity of the altered state is further supported by our single-cell

OF11 | blood CANCER DISCOVERY                 January 2021                                                                                   AACRJournals.org

      Downloaded from https://bloodcancerdiscov.aacrjournals.org at Max Planck Insitut fuer Molekulare Genetik on January 12,
                                 2021. Copyright 2020 American Association for Cancer Research.
The Altered DNA Methylation Landscape in CLL                                                                         RESEARCH ARTICLE

transcriptomes from the five patients that transition from MBL          and stained with anti–CD19-phycoerythrin (PE; BioLegend) prior to
to CLL without any major expression dynamics. Finally, our              FACS sorting for live single cells in the presence of DAPI. MBL cells
finding that the cancer methylome also remains mostly unaf-             and naïve and memory B cells from age-matched healthy donors were
fected by conventional chemoimmunotherapy or the BCL2                   isolated as follows: Cryopreserved PBMCs were thawed and stained
                                                                        with anti–CD19-PE, CD5-FITC, and CD27-Allophycocyanin (APC;
inhibitor venetoclax may keep patients at an elevated risk for
                                                                        BioLegend). Cells were gated for naïve B cells (CD19+, CD27−, and
relapse, in line with the fact that CLL is rarely cured, although       CD5), memory B cells (CD19+, CD27+, and CD5−), or MBL (CD19+
this treatment landscape is continuously evolving (17).                 and CD5+; Supplementary Fig. S7A).
   Genetic and epigenetic diversity of normal tissues, tumors,
and even clonally amplified cell populations have been most             Bulk RRBS Library Generation and Data Processing
broadly assessed in-depth so far using bulk sequencing. To                 RRBS libraries were generated from 25 to 100 ng of input DNA using
date, the degree of heterogeneity in methylation levels among           the Ovation Methyl-Seq System (NuGen) following the manufacturer’s
distinct genomic regions within a single cell has not been              recommendation. We used NuGen unique molecular identifier (UMI)
investigated to our knowledge. Here, we applied single-cell             technology to measure the rate of PCR duplicates on one patient (four
methylome analysis and could show that aberrant meth-                   samples) and found the duplicate rate to be below 2%, even at an input
ylation affects single cells to a surprisingly similar extent.          of only 25 ng of DNA. On average, 15.7M fragments, resulting in 31.4M
Despite these convincing findings, it needs to be stated that           paired-end 101–base pair (bp) reads, were sequenced per sample on
due to technical limitations, such as stochastically missing            an Illumina HiSeq2500. These reads were aligned to the human hg19
                                                                        genome using BSmap (45) with flags -v 0.05 -s 16 -w 100 -S 1 -p 8 -u. An
values caused by unequal coverage, parts of the genome have
                                                                        average of 21.1M reads per sample was aligned correctly. Custom scripts
not been investigated. Nevertheless, we could confirm that
                                                                        written in Perl were used to count the number of times a CpG was
hypomethylation is more pronounced across individual MBL                observed to be methylated. The methylation percentage for each CpG
and CLL cells, suggesting that the methylation machinery                was calculated as the number of times the CpG appeared methylated
targets a consistent and specific set of regions, though single         divided by the total times the CpG was covered in sequencing reads.
CpGs are generally affected discordantly (20). As a result,             Finally, we converted the resulting CpG level files to bigWig files, filter-
single-cell analysis can help classify tumors and their micro-          ing out all CpGs covered with less than five reads. An average of 3.4M
environment, which provides a more holistic disease picture             CpGs was covered per sample at an average depth of 14×.
and may guide more precise treatments in the future.
   In sum, our comprehensive exploration over the disease               Multiplexed Single-Cell RRBS Library Generation
course of CLL, including its precursor stage MBL, highlights sev-       and Data Processing
eral important lessons toward a better mechanistic understand-             Single-cell RRBS libraries were prepared by combining the first
ing of the cancer methylome. First, the transition to the altered       steps (cell lysis and physical separation of DNA and mRNA) of the sin-
methylome occurs very early, possibly as a nongenetic precursor         gle-cell methylome and transcriptome sequencing protocol (46) with
lesion that is not yet tumorigenic. Second, it should play at least     multiplexed single-cell RRBS (26) using double MspI+HaeIII diges-
some facilitating, if not central, role as it was present in all 53     tion. Single cells were sorted into 5 μL RLT plus buffer (QIAGEN)
                                                                        containing 1 U SUPERase in RNase inhibitor (Invitrogen) in 96-well
patients evaluated and at all stages with remarkable stability.
                                                                        PCR plates, flash-frozen on dry ice, and stored at –80°C. Upon
And finally, its persistence after treatment, though currently          thawing, 5 μL of QIAGEN RLT plus buffer and 10 μL M-280
limited to the 13 patients that we investigated, suggests that the      streptavidin beads conjugated to a biotinylated oligo-dT primer
current chemoimmunotherapy and BCL2 inhibition approach                 were added to each well. After 30 minutes at 25°C, the plates
eradicates only some but not all diseased cells. Although it            were transferred to a magnet to capture bead-bound mRNA, and
remains to be investigated, the general nature of the epigenetic        the DNA-containing supernatant was transferred to a new 96-well
transformation extends to other cancer types, including many            plate. Beads in the original wells were washed twice with 15 μL
solid tumors, suggesting that this landscape may reflect conver-        of washing buffer (50 mmol/L Tris-HCl, pH 8, 75 mmol/L KCl, 3
gence toward a commonly utilized regulatory mechanism.                  mmol/L MgCl2, 10 mmol/L DTT, and 0.5% Tween-20), and each
                                                                        wash was added to the DNA plate. To clean up the DNA, 1 volume of
                                                                        a 1:5 dilution of AMPure XT SPRI beads (Beckman Coulter) in 20%
Methods                                                                 PEG/2.5 mol/L NaCl and 0.5 μL Proteinase K (0.8 U/μL, NEB) were
                                                                        added. After 30 minutes at 25°C with mixing, the beads were washed
Human Samples                                                           with 80% ethanol and genomic DNA eluted with 8 μL H2O, with the
   Heparinized blood samples were obtained from normal donors           beads remaining in the well during library prep. After addition of
and patients enrolled in clinical research protocols approved by the    2 μL 1x CutSmart buffer (NEB) containing 10 U of MspI (NEB), or 5
Human Subjects Protection Committee of the Dana-Farber Cancer           U of MspI plus 5 U of HaeIII (NEB), DNA was digested for 2 hours
Institute (DFCI), at University of California, San Diego and the Mayo   at 37°C, followed by heat inactivation for 15 minutes at 65°C. MspI
Clinic (CLL Research Consortium), and through the International         sites were filled in and fragment ends adenylated by adding 2 μL
Cancer Genome Consortium (42) after obtaining written-informed          1× CutSmart containing 2.5 U Klenow fragment (3′–5′exo-, NEB),
consent. Treatment indication for all 21 patients in the discovery      0.4 μL of dNTP mixture (10 mmol/L dATP, 1 mmol/L dCTP, and
cohort was determined based on International Workshop on Chronic        1 mmol/L dGTP) followed by a two-step incubation for 25 minutes
Lymphocytic Leukemia criteria (12, 44). Peripheral blood mononu-        at 30°C and 30 minutes at 37°C and heat inactivation at 70°C for
clear cells (PBMC) from normal donors and patients were isolated by     10 minutes. After addition of 3 μL 1× CutSmart containing 800 U
Ficoll/Hypaque density gradient centrifugation. Mononuclear cells       T4 DNA ligase (NEB), 0.1 μL of 100 mmol/L ATP (Roche), 1.5 μL of
were used fresh or cryopreserved with 10% DMSO FBS and stored           0.1 μmol/L custom 5mC-substituted and indexed (inline barcode)
in vapor-phase liquid nitrogen until the time of analysis. CD19+ B      adapter, overnight ligation at 16°C, and heat inactivation (20 min-
cells from normal volunteers and CLL samples with WBC ≤ 50 ×            utes at 65°C), 24 separately indexed ligation reactions were pooled.
109/L were isolated by immunomagnetic selection (Miltenyi Biotec)       After addition of 3 μL sheared and dephosphorylated Escherichia coli

                                                                                January 2021         blood CANCER DISCOVERY | OF12

  Downloaded from https://bloodcancerdiscov.aacrjournals.org at Max Planck Insitut fuer Molekulare Genetik on January 12,
                             2021. Copyright 2020 American Association for Cancer Research.
RESEARCH ARTICLE                                                                                                                Kretzmer et al.

carrier DNA (27), DNA was cleaned up with 1.8 volumes of                  Additional Data
AMPure XP beads (Beckman Coulter), eluted off the beads, and                Whole genome bisulfite sequencing (WGBS) data of normal B cells
bisulfite converted (EpiTect Fast Bisulfite kit, QIAGEN) following        were obtained from the European Genome-phenome Archive (EGA)
the manufacturer’s recommendations with extended conversion time          under accession EGAS00001001196 for comparison in the phylogenetic
(20 minutes each cycle). Each pool of RRBS libraries from 24 single       and average methylation analysis. Methylation data were filtered for
cells was PCR amplified using KAPA HiFi Uracil+ DNA Polymerase, a         minimum coverage of 10× read coverage, and coordinates were con-
universal P5, and a pool-specific indexed P7 primer for a total of        verted to hg19 using bedtools liftOver (49). Additional WGBS data of
17 cycles. The thermoprofile was 98°C denaturation for 45 sec-            normal B cells were obtained from Beekman and colleagues (30) and
onds, 6 cycles of 98°C for 20 seconds, 58°C annealing for 30              downloaded from http://resources.idibaps.org/paper/the-reference-
seconds, and 72°C extension for 1 minute, followed by 11 cycles           epigenome-and-regulatory-chromatin-landscape-of-chronic-lym-
of 98°C for 20 seconds, 65°C annealing for 30 seconds, and                phocytic-leukemia. Methylation data were filtered for a minimum
72°C extension for 1 minute, and a final extension at 72°C for            of 10× read coverage, and coordinates were converted to hg19 using
5 minutes. To minimize size bias during sequencing, multiple PCR          bedtools liftOver. Data were used in phylogenetic comparisons, aver-
products, each representing 24 single cells, were pooled together         age methylation analysis, and all comparative analysis, e.g., detecting
and size selected on a 2% NuSieve agarose gel into two fractions          differential methylated regions and genomic region visualizations.
(150–400 bp and 400–800 bp) that were sequenced in separate               To ensure accurate comparison among samples, all published WGBS
lanes with a 10% spike-in of a library with a balanced base compo-        data were reduced to positions covered in any of our patient RRBS
sition, which is typically 2 lanes (1.5 plus 0.5 lanes for the low and    data, resulting in a set of approximately 5 million comparable CpGs.
high size cut, respectively) for 96 cells. On average, 4.5M fragments,      Single-cell RRBS and RNA-seq data of the two CLL samples were
resulting in 9M paired-end 75-bp reads, were generated per sample         obtained from Gaiti and colleagues (40).
on an Illumina HiSeq4000.
   Sequencing reads were demultiplexed using the inline barcode,
adapters were trimmed, and reads were trimmed for quality. These          Feature Annotations
reads were aligned to the human hg19 genome using BSmap with                 Chromatin states were defined by the standard 15-state model
flags -v 0.1 -s 12 -w 100 -S 1 −q 20 −u −R. An average of 8.4M reads      using the ChromHMM algorithm (33) and were downloaded from
(4.2M pairs) per sample was aligned. To determine the methylation         the UCSC Genome Browser (50). The average methylation rate for
state of all CpGs captured and assess the bisulfite conversion rate,      each sample and per chromatin state was calculated as the mean of
we used the mcall module in the MOABS software suite with stand-          all methylation rates overlapping with a particular chromatin state.
ard parameter settings (47). Finally, we converted the resulting          CpG islands were downloaded from the UCSC Genome Browser;
CpG level files to bigwig files, filtering out all CpGs covered with      shores were defined as adjacent 2 kb regions and shelves as the next
more than 250 reads resulting in an average of 1.1M CpGs covered          adjacent 2 kb regions. Gene annotations were downloaded from the
per sample.                                                               UCSC Genome Browser (gencode v19), and promoter regions were
                                                                          defined as 5,000 nt upstream to 2,500 nt downstream of annotated
10x Single-Cell RNA Library Generation and                                transcription start site. DMRs were assigned to genes if overlapping
Data Processing                                                           with the promoter or gene body with at least one shared base. For
                                                                          unique annotation of DMRs and if a DMR overlapped more than
   PBMCs were thawed in Roswell Park Memorial Institute 1640
                                                                          one feature, the ranking was: promoter, gene body, last intergenic; or
medium supplemented with 10% FBS and centrifuged at 1,500
                                                                          CpG island, shelf, and last shore. For chromatin state annotation of
rpm for 5 minutes. Each sample was filtered through a 70-μm
                                                                          DMRs, the 15 chromatin states were collapsed into the 6 main cat-
filter. Cells were resuspended in PBS–0.04% BSA and stained with
                                                                          egories (Active Promoter, Poised Promoter, Enhancer, Transcription,
anti-human CD5 (FITC), CD19 (PE), CD27 (APC), and 7-aminoac-
                                                                          Insulator, and Heterochromatin), and each DMR was assigned to the
tinomycin D for 15 minutes on ice (BioLegend). The samples were
                                                                          region with its maximal overlap.
washed and resuspended in PBS–0.04% BSA at a concentration of
                                                                             Mutation and subclone information was taken from ref. 28.
10 × 106 cells/mL. Samples from the same patient were processed
and sorted in parallel on the same day using two FacsAria II cytom-
eters (Becton Dickinson). Cells were sorted through a 70-μm noz-          Phylogenetic Tree
zle into 1.5-mL Eppendorf tubes with 10-μL PBS–0.04% BSA and                 The phylogenetic analysis of DNA methylation was performed
immediately stored on ice. Cellular suspensions were loaded on a          as previously described (51). In brief, the phylogenetic trees were
10x Genomics Chromium Controller platform (10x Genomics, Inc.)            inferred using the fastme.bal function in the R package ape, which
to generate a single-cell Gel bead in Emulsion (GEM). Single-cell         is based on the minimal evolution method. Trees were computed
RNA sequencing (scRNA-seq) libraries were prepared as previously          by applying the fastme.bal function on the Euclidean distance
described (48).                                                           matrices of the methylation rates of all samples in the tree. To
   The Cell Ranger pipeline (10X Genomics, Inc.) was used for each        always capture the maximal information, the subset of CpGs
scRNA-seq dataset to demultiplex the raw base call files, generate        considered was adapted to the sample shows, resulting in n = (i)
the fastq files, perform the alignment against the mouse reference        28,343,743; (ii) 5,227,401; and (iii) 3,490,971 CpGs for (i) normal
genome hg19, filter the alignment, and count barcodes and UMIs.           B cells, (ii) normal B cells + first time point CLL, and (iii) normal
Outputs from multiple sequencing runs were also combined using            B cells + first time point CLL + MBL; normal B cells + all CLL time
Cell Ranger functions.                                                    points, respectively.

Data Analysis                                                             Scatter Plots and Correlation
  If not stated otherwise, all statistics and plots are generated using      Scatter plots were created using the smoothScatter function of R,
R version 3.5.1 “Feather Spray.” In all boxplots, the centerline is       and correlations were calculated using the cor function of R. For the
median; boxes, first and third quartiles; whiskers, 1.5× interquartile    first figure, the average methylation per group was used (n = 3 for
range; and data beyond the whiskers’ end are omitted.                     naïve and memory B cells, n = 20 and 21 for unmutated and mutated
  Bed files were processed using UCSCtools and bedtools                   CLL, respectively). Missing values were removed from the mean cal-
(v2.25.0).                                                                culation. For the matched MBL–CLL correlation, missing values were

OF13 | blood CANCER DISCOVERY                January 2021                                                                   AACRJournals.org

      Downloaded from https://bloodcancerdiscov.aacrjournals.org at Max Planck Insitut fuer Molekulare Genetik on January 12,
                                 2021. Copyright 2020 American Association for Cancer Research.
You can also read