Geographic Patterns of Genetic Differentiation among Killer Whales in the Northern North Pacific
←
→
Page content transcription
If your browser does not render page correctly, please read the page content below
Journal of Heredity Advance Access published July 11, 2013
Journal of Heredity                                        Published by Oxford University Press on behalf of the American Genetic
doi:10.1093/jhered/est037                            Association 2013. This work is written by (a) US Government employee(s) and
                                                                                                    is in the public domain in the US.

Geographic Patterns of Genetic
Differentiation among Killer Whales
in the Northern North Pacific
Kim M. Parsons, John W. Durban, Alexander M. Burdin, Vladimir N. Burkanov,
Robert L. Pitman, Jay Barlow, Lance G. Barrett-Lennard, Richard G. LeDuc,
Kelly M. Robertson, Craig O. Matkin, and Paul R. Wade
From the National Marine Mammal Laboratory, Alaska Fisheries Science Center, National Oceanic and Atmospheric
Administration, 7600 Sand Point Way NE, Seattle, WA 98115 (Parsons, Durban, Burkanov, and Wade); Protected
Resources Division, Southwest Fisheries Science Center, National Marine Fisheries Service, National Oceanic and

                                                                                                                                         Downloaded from http://jhered.oxfordjournals.org/ by guest on September 14, 2015
Atmospheric Administration, California (Durban, Pitman, Barlow, LeDuc, and Robertson); Kamchatka Branch of the Pacific
Institute of Geography RAS, Petropavlovsk-Kamchatskiy, Russia (Burdin); Vancouver Aquarium Marine Science Centre,
Vancouver, British Columbia, Canada (Barrett-Lennard); and North Gulf Oceanic Society, Homer, AK (Matkin).

Address correspondence to Kim M. Parsons at the address above, or e-mail: kim.parsons@noaa.gov.

Abstract
The difficulties associated with detecting population boundaries have long constrained the conservation and management
of highly mobile, wide-ranging marine species, such as killer whales (Orcinus orca). In this study, we use data from 26 nuclear
microsatellite loci and mitochondrial DNA sequences (988 bp) to test a priori hypotheses about population subdivisions
generated from a decade of killer whale surveys across the northern North Pacific. A total of 462 remote skin biopsies
were collected from wild killer whales primarily between 2001 and 2010 from the northern Gulf of Alaska to the Sea
of Okhotsk, representing both the piscivorous “resident” and the mammal-eating “transient” (or Bigg’s) killer whales.
Divergence of the 2 ecotypes was supported by both mtDNA and microsatellites. Geographic patterns of genetic dif-
ferentiation were supported by significant regions of genetic discontinuity, providing evidence of population structuring
within both ecotypes and corroborating direct observations of restricted movements of individual whales. In the Aleutian
Islands (Alaska), subpopulations, or groups with significantly different mtDNA and microsatellite allele frequencies, were
largely delimited by major oceanographic boundaries for resident killer whales. Although Amchitka Pass represented a
major subdivision for transient killer whales between the central and western Aleutian Islands, several smaller subpopula-
tions were evident throughout the eastern Aleutians and Bering Sea. Support for seasonally sympatric transient subpopula-
tions around Unimak Island suggests isolating mechanisms other than geographic distance within this highly mobile top
predator.
Key words: ecotypes, genetic structure, mtDNA, microsatellite, Orcinus orca, populations, subpopulations

Population boundaries are often difficult to define for          and drive divergence. Beyond population delimitation and
highly mobile species with largely continuous geographical       identification of stock boundaries, understanding patterns of
distributions. However, identifying patterns of population       gene flow and dispersal is fundamental for evaluating popula-
structure is critical for the effective management and conser-   tion status.
vation of natural populations, and for identifying subpopula-       High mobility and dispersal capabilities, combined with a
tions requiring unique management strategies (Avise 1994).       seemingly homogenous marine habitat, were initially assumed
Furthermore, underlying population genetic structure has         to translate into high levels of gene flow within oceanic
considerable evolutionary and ecological relevance, provid-      species (Palumbi 1994). Analytical advances have provided
ing unique insight into mechanisms of reproductive isola-        the tools necessary to directly examine geographic structuring
tion and patterns of localized adaptation, and furthering our    among individual animals, and recent studies of a variety of
understanding of the factors that shape these subdivisions       marine vertebrate species have clearly demonstrated that high

                                                                                                                                    1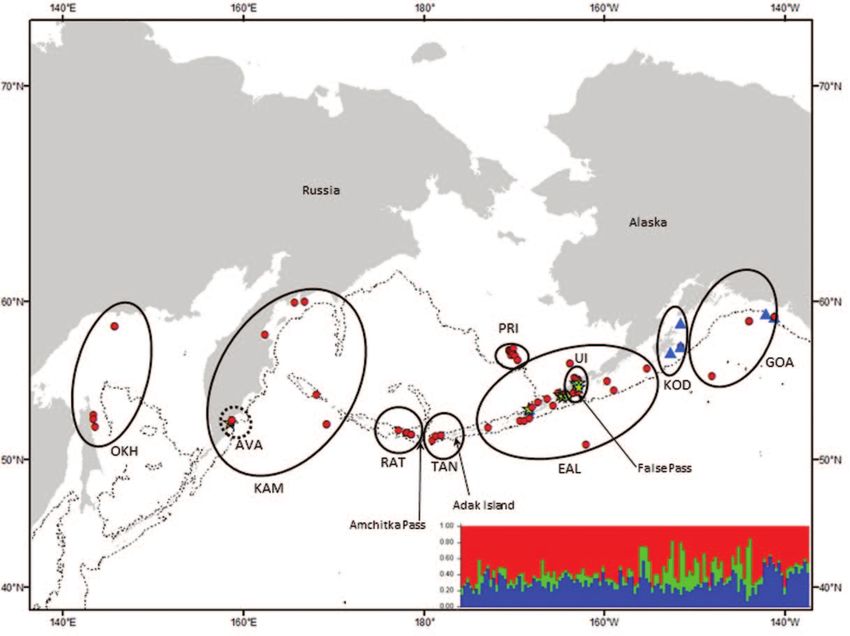
Journal of Heredity

potential mobility cannot be used as a predictor of effective            As a result of multiple decades of individual-based
gene flow (Carreras et al. 2007; Verissimo et al. 2010; Sandoval-    studies, population structure is well characterized for killer
Castillo and Rocha-Olivares 2011). Despite the lack of               whales around Prince William Sound/Kenai Fjords, in the
obvious physical barriers to dispersal and gene flow, molecular      coastal waters of the Gulf of Alaska (Matkin 1997; Matkin
genetic studies of many species within the taxonomic order           et al. 1999), and for those inhabiting the coastal waters fur-
Cetacea have clearly dispelled the assumption of panmixia,           ther south around British Columbia and Washington State
documenting numerous cases involving significant geographic          (Bigg et al. 1990; Ford 1991; Baird and Whitehead 2000;
patterns of population genetic differentiation (Baker et al.         Ford et al. 2011). However, less information is available for
1998; Rosel et al. 1999; Parsons et al. 2006; Fontaine et al.        whales inhabiting waters of the western Gulf of Alaska,
2007; Mirimin et al. 2009; Rosenbaum et al. 2009). Because           Aleutian Islands, Bering Sea, and Russia. Despite a relatively
cetaceans are marine predators with remarkable longevity             ubiquitous distribution, data documenting individual move-
and both direct and indirect interactions with commercial            ments and social affiliations (Durban et al. 2010; Fearnbach
fisheries, understanding the structuring of their populations        2012), as well as telemetry data (Durban J, unpublished
has important implications for understanding ecosystem               data; Matkin et al. 2012) suggest that some individuals and
processes on both local and global scales.                           matrilineal pods exhibit restricted movements and a high
    The killer whale (Orcinus orca), a large, globally distributed   degree of interannual site fidelity. However, contemporary
delphinid, is among the better known of cetacean species.            estimates of gene flow are lacking for these northern areas,
In the northeastern Pacific, long-term studies on several            and documented movements of individual whales between

                                                                                                                                      Downloaded from http://jhered.oxfordjournals.org/ by guest on September 14, 2015
small populations of piscivorous killer whales have contrib-         Kodiak Island and southeastern Alaska, for example, sug-
uted unprecedented insight into their habits, social organi-         gest a certain degree of connectedness (Matkin 1997; Matkin
zation, philopatry to matrilineal groups and, more recently,         et al. 1999, 2012). As a consequence of the uncertainty sur-
patterns of gene flow (Balcomb and Bigg 1986; Bigg et al.            rounding the population structuring within these regions
1990; Parsons et al. 2009; Ford et al. 2011). Studies focusing       and a lack of data for the westernmost reaches of the
on the behavioral ecology of killer whales have identified 3         northern North Pacific, current stock designations encom-
divergent yet sympatric ecotypes inhabiting northern North           pass very broad areas. According to the stock assessment
Pacific waters (Bigg 1982; Ford et al. 1998). The 3 ecotypes         requirements of the US Marine Mammal Protection Act
(commonly referred to as “residents,” “transients,” or Bigg’s        (MMPA), resident killer whales inhabiting the waters in the
killer whales, in tribute to the late Dr Michael Bigg (Ford          far North Pacific are currently recognized as a single stock
2011; Riesch et al. 2012), and “offshores”) differ phenotypi-        ranging from southeast Alaska through the Aleutian Islands
cally and show marked differences in patterns of dispersal,          and Bering Sea (Allen and Angliss 2011). The US MMPA
acoustic patterns, social structure, group dynamics, and prey        stock designation for transient killer whales recognizes 2
preferences (Baird and Stacey 1988; Bigg et al. 1990; Ford           stocks with overlapping geographic distributions, com-
1991; Barrett-Lennard et al. 1996; Ford et al. 1998; Baird and       prising the “Aleutian and western” stock (Gulf of Alaska,
Whitehead 2000; Foote and Nystuen 2008; Ford et al. 2011).           Aleutian Islands, and Bering Sea), and the much smaller
In addition to the genetic differences among ecotypes first          community of “AT1” killer whales whose range appears to
described by Stevens et al. (1989) and Hoelzel and Dover             be largely restricted to Prince William Sound and the Kenai
(1991), recent analyses of the entire mitochondrial genome           Fjords (Allen and Angliss 2011; Matkin et al. 1999). Recent
suggested that some of the unique killer whale ecotypes              work examining the social structure of resident killer whales
represent deeply divergent evolutionary lineages and war-            within the “Alaska resident stock” described social networks
rant elevation to species or subspecies status (Morin et al.         that are spatially connected yet exhibit differential ranging
2010). For example, estimates from mitogenome sequence               patterns (Fearnbach 2012). Such socially mediated spa-
data indicate that transient killer whales diverged from all         tial structuring may provide a basis for population genetic
other killer whale lineages some 700 000 years ago, and the          subdivisions similar to that described for the Northern and
ad hoc committee on marine mammal taxonomy currently                 Southern resident killer whale communities off the coast of
recognizes the 2 predominant North Pacific ecotypes as               British Columbia and Washington State (Ford et al. 2000).
unnamed Orcinus orca subspecies (Committee on Taxonomy                   As apex predators with high energetic requirements
2012). Coalescent analyses further suggest that the ecologi-         (Noren 2011; Williams et al. 2004, 2011), killer whales are
cal divergence between the resident and transient ecotypes           of both management and conservation concern throughout
may have arisen during an allopatric period preceding the            the North Pacific. Predation on, and competition with,
migration of ancestral resident maternal lineages back into          both endangered and commercially important species (e.g.,
the North Pacific resulting in secondary contact and the cur-        marine mammals, salmonids) make killer whales a species
rent sympatric distribution (Foote et al. 2011). The broad           of interest throughout Alaskan waters and beyond. In this
distribution of killer whales throughout coastal and offshore        study, we use both mitochondrial (mtDNA) sequences and
waters, combined with its ecological specializations, pre-           nuclear (nDNA) microsatellite genotypes to examine genetic
sents an ideal opportunity to compare patterns of genetic            structure of 2 ecotypes (residents and transients) within the
structuring among ecotypes and contrast the socioecologi-            genus Orcinus in northern North Pacific waters. The patterns
cal factors that shape patterns of gene flow and population          of genetic discontinuities resolved in this study will provide
structuring.                                                         data to support a revision of stock structure in the North

2
Parsons et al. • Killer Whale Populations in the Northern North Pacific
Pacific and provide insight into some of the ecological published killer whale sequences deposited in GenBank.
factors shaping killer whale populations. Haplotypic (h) and nucleotide (π) diversities were estimated
according to Nei (1987) to describe the control region
sequence divergence and haplotype frequency differences
Methods using Arlequin v3.11 (Excoffier et al. 2005).
Samples were genotyped at 27 polymorphic microsatellite
DNA Extraction and PCR Amplification
loci (see Supplementary Appendix 1 online). Initially, each
Skin biopsy samples were obtained from killer whales by locus was amplified individually in 10 µL reactions contain-
remote dart biopsy (Barrett-Lennard et al. 1996; Parsons et al. ing 4 ng of genomic DNA, 1X Promega GoTaq Flexi Buffer,
2003) during dedicated and opportunistic shipboard surveys 2.5 mM MgCl2, 0.2 mM of each dNTP, 0.1 µg/µL of bovine
across the North Pacific. Samples were collected primarily serum albumin, 0.2 µM of each primer (forward primers were
during the summer months (June through August), primar- fluorescently labeled), and 0.5 units of GoTaq Flexi DNA
ily between 2001 and 2010 from both resident and transient Polymerase (Promega, Madison, WI). Thermocycler profiles
killer whales (Table 1). Tissue samples were stored frozen included initial denaturation at 94 °C for 2 min, followed by
in 99% ethanol or salt-saturated dimethyl sulfoxide solution 30 cycles of 94 °C for 35 s, Ta °C for 35 s, 72 °C for 35 s, and
until the time of sample processing. Total genomic DNA was a final extension at 72 °C for 30 min. Amplification condi-
isolated from skin biopsy subsamples using a variety of com- tions were further optimized, and the majority of loci were
mon extraction methods, including silica-based filter mem- multiplexed as groups of 2–4 loci with nonoverlapping allele
Downloaded from http://jhered.oxfordjournals.org/ by guest on September 14, 2015
branes (Qiagen, Valencia, CA), standard phenol/chloroform sizes using the Qiagen Multiplex PCR Kit. Each multiplex
extraction (modified from Sambrook et al. 1989), and lithium PCR was performed according to the conditions suggested
chloride (Gemmell and Akiyama 1996). DNA concentrations by Qiagen Multiplex PCR Kit handbook in a total reaction
were determined by absorbance on a NanoDrop ND-8000 volume of 20 μL. Additional PCR conditions are described in
Spectrophotometer (NanoDrop Technologies, Wilmington, Supplementary Appendix 1 online. Amplified products were
DE) and normalized to a working concentration of 2 ng/μL. analyzed using an ABI 3100 automated DNA sequencer, and
Remaining skin biopsy fragments and extracted DNA were allele sizes were determined using ABI LIZ500 as the internal
archived at −80 °C. size standard. ABI GeneScan v3.7 and Genotyper v3.7 (ABI)
The mitochondrial control region was amplified via poly- software were used to collect and analyze microsatellite data.
merase chain reaction (PCR) in 20 µL reaction volumes as Genotyping quality control measures included negative
described in Zerbini et al. (2007). Both strands of the ampli- control reactions at each step including DNA extraction,
con were sequenced independently using Applied Biosystems PCR, and sequencing, as well as replicate genotyping of
(ABI, Carlsbad, CA) BigDye Terminator v3.1 Cycle Sequenc multiple samples. An overall genotyping replication rate of
ing Kit on the ABI model 3100 sequencer. Sequences were ≥11% of samples allowed us to empirically estimate the per-
manually checked for sequencing errors or questionable base allele genotyping error rate (Hoffman and Amos 2005; Morin
calls and aligned using ClustalW (Thompson et al. 1994) as et al. 2010). Furthermore, each PCR set included at least 2
implemented in BioEdit (Hall 1999). Control region haplo- samples previously genotyped to provide cross-plate controls
types were assigned based on comparison with previously and ensure consistent allele binning throughout the study.
Table 1 Sample sizes across a priori strata for both resident and transient killer whales sampled across the northern North Pacific
Ecotype: a priori Number of samples
Geographic region stratum Collection years Total Resident Transient
Central Aleutians RES-CAL 2001–2010 61 61
Eastern Aleutians RES-EAL 1997–2010 56 56
Gulf of Alaska RES-GOA 2001–2005 32 32
Russia RES-RUS 1994–2006 117 117
Western Aleutians RES-WAL 2004–2010 8 8
Eastern Aleutians TRANS-EAL 1990–2009 44 44
Unimak Island TRANS-UI 2001–2009 16 16
Gulf of Alaska TRANS-GOA 2004 13 13
Kamchatka Peninsula TRANS-KAM 2002–2006 11 11
Kodiak Island TRANS-KOD 2001–2005 7 7
Sea of Okhotsk TRANS-OKH 2001–2004 6 6
Pribilof Islands TRANS-PRI 2005–2009 30 30
Rat Island Group TRANS-RAT 2006–2010 11 11
Tanaga Island TRANS-TAN 2003–2010 5 5
Counts reflect the number of individually genotyped whales after the removal of genetically identical biopsies.
3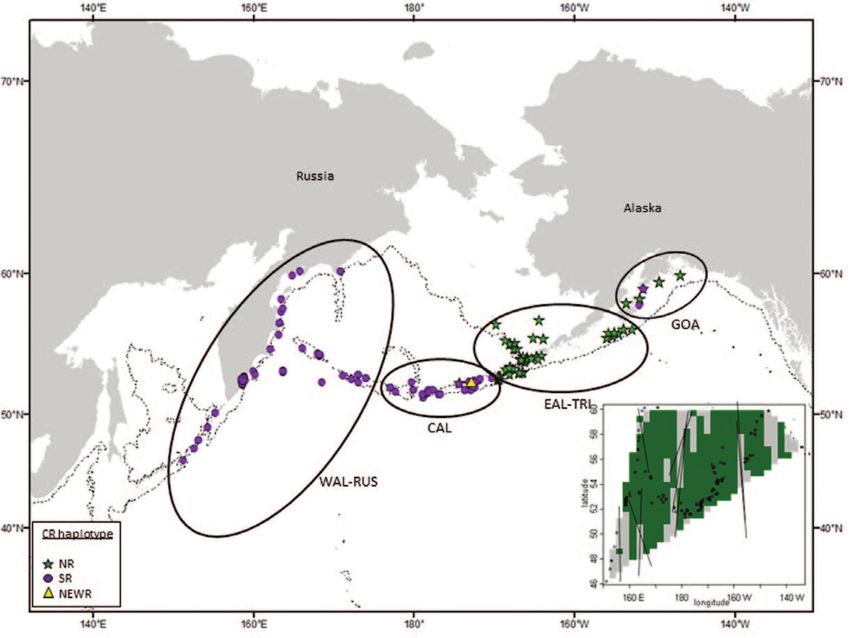
Journal of Heredity

Ecotype Identification and Genetic Assignment                        empirically assess a minimum threshold for the number of
                                                                     loci genotyped by calculating P(ID)sib for increasing numbers
Ecotype identification for each sample was based on both
                                                                     of loci. Including data from the least heterozygous loci first,
photographic identification of individuals using phenotypically
                                                                     we derived a conservative estimate of the minimum number
distinctive characteristics of whales in sampled groups and
                                                                     of loci needed to identify individual whales and achieve a
mitochondrial control region sequence (Matkin et al. 2007;
                                                                     probability of identity for siblings ≤0.001 (Waits et al. 2001).
Zerbini et al. 2007; Durban et al. 2010). The ability to reliably
                                                                         After removal of duplicate samples from the data set,
identify ecotype based on characteristic pigmentation and
                                                                     genetic diversity within each ecotype was quantified as
morphological differences (Baird and Stacey 1988; Ford
                                                                     the mean number of alleles per locus (Na), allelic richness
et al. 2000) and fixed mtDNA sequence differences (Hoelzel
                                                                     (AR), observed (HO) and expected heterozygosity (HE), and
et al. 1998; Barrett-Lennard 2000; Hoelzel et al. 2002) has
                                                                     inbreeding coefficient (FIS) using FSTAT (Goudet 2000) and
been previously demonstrated for North Pacific killer whales
                                                                     GenAlEx (Peakall and Smouse 2006). Departures from HWE
(Zerbini et al. 2007). For the 6 samples in the data set for
                                                                     expectations using the Fisher’s Exact test (Guo and Thompson
which the above data were unavailable, ecotype was identified
                                                                     1992) and tests for genotypic disequilibrium among the loci
post hoc by examining the clustering of samples in a principal
                                                                     were assessed using GENEPOP v4.0 (Raymond and Rousset
coordinate analysis (PCA) based on multilocus data and by
                                                                     1995). Multiple tests error rate was adjusted using the sequen-
individual assignment tests as executed in GeneClass (see
                                                                     tial Bonferroni correction (Rice 1989).
below).
                                                                         Data sets containing a large number of closely related indi-
    The probability of an individual belonging to a particu-

                                                                                                                                        Downloaded from http://jhered.oxfordjournals.org/ by guest on September 14, 2015
                                                                     viduals have the potential to impact estimates of population
lar ecotype was estimated using the Bayesian assignment
                                                                     structure and inflate measures of genetic distance through
method of Rannala and Mountain (1997) as implemented
                                                                     violations of model assumptions due to allelic enrichment
in GeneClass v.2 (Piry et al. 2004), and the clustering algo-
                                                                     (Amos et al. 1993). Long-term studies of several killer whale
rithms implemented in Structure (Pritchard et al. 2000), run
                                                                     populations have documented extreme philopatry to natal
naively without the inclusion of prior information on ecotype
                                                                     groups and a matrifocal social organization within populations
or location (see below for model specifics). The clustering
                                                                     (Balcomb and Bigg 1986; Bigg et al. 1990; Ford et al. 1994
of individual samples according to pairwise genotypic dis-
                                                                     Matkin et al. 1999; Parsons et al. 2009). Because the focus of
tance was examined using PCA as implemented in GenAlEx
                                                                     this study is to examine population structure on a fairly broad
v.6.4 (Peakall and Smouse 2006). Genetic differentiation
                                                                     scale geographically, we addressed potential kin bias by esti-
(nDNA) between resident and transient ecotypes was esti-
                                                                     mating pairwise relatedness within each ecotype from micro-
mated using both FST (Weir and Cockerham 1984) and F ′ST
                                                                     satellite allele frequency data. KINGROUP (Konovalov et al.
(Hedrick 2005), calculated using custom code (Mesnick et al.
                                                                     2004) was used to estimate pairwise relatedness according to
2011) written in the statistical programming language R (R
                                                                     Lynch and Ritland’s (1999) regression-based estimator (RLR).
Development Core Team 2011). Arlequin v.3.5.1.2 (Excoffier
                                                                     Relatedness estimates were compared with the maximum
and Lischer 2010) was used to estimate both FST and ΦST
                                                                     value obtained from a simulated set of 10 000 pairs of unre-
(Tamura and Nei, 1993; α = 0.5) for mtDNA sequence data.
                                                                     lated individuals (UR) using the observed allele frequencies.
Statistical significance for all metrics was determined by
                                                                     Pairs of individuals with RLR > URMAX were considered to
10 000 random permutations of the original data set.
                                                                     be potential close relatives and 1 individual from the pair was
Identifying Duplicate Samples, Estimating Genetic                    removed for analyses of spatial genetic patterns to minimize
Diversity, and the Removal of Close Kin                              the impact of inclusion of kin in the data set.

Microsatellite Toolkit (Park 2001) and GENECAP (Wilberg
                                                                     Testing a priori Hypotheses of Geographic Structure
and Dreher 2004) were used to examine the microsatellite
genotype data set for potential errors and to identify dupli-        Geographic structure was first examined by testing a priori
cate genotypes by comparing each multilocus genotype to all          subdivisions. Putative geographic strata were defined based
others in the data set. All pairs of genotypes that mismatched       on data acquired from georeferenced photographic records
at 3 or fewer loci were rechecked for potential scoring errors       of individual killer whales (Wade P, Durban J, unpublished
by re-examining the electropherograms for those loci. Pairs          data; Durban et al. 2010), the geographic extent of social
of samples that were identified as genetic matches were fur-         network clusters (Fearnbach 2012), and the presence of
ther examined by comparing associated field (photographic            large geophysical barriers (e.g., Kamchatka peninsula). Strata
identifications) and molecular (control region haplotypes and        names were based on general geographic regions, and sam-
genetic sex) data. GENECAP (Wilberg and Dreher 2004)                 ples were assigned to the stratum in which they were sam-
was also used to calculate the probability of identity (P(ID)):      pled. These assignments are not intended to convey core
the probability that 2 unrelated individuals share the same          areas for individually sampled killer whales. Despite some
multilocus genotype by chance. The observed P(ID) was cal-           long-range movements of individual whales, social network
culated using the more traditional formula assuming Hardy–           analyses highlight a strong spatial component that was used
Weinberg equilibrium (HWE; Paetkau and Strobeck 1994),               to inform a priori strata (Fearnbach 2012). However, indi-
as well as the conservative estimator of P(ID) for full siblings     vidual sighting histories were limited for the majority of
(P(ID)sib; Waits et al. 2001). Estimates for P(ID)sib were used to   killer whales encountered in the Aleutian Islands and Bering

4
Parsons et al. • Killer Whale Populations in the Northern North Pacific
Sea. Therefore, with the exception of transient killer whales Islands (EAL), Unimak Island (UI), Kodiak Island (KOD),
comprising the Unimak Island stratum (see below), spatial and the Gulf of Alaska (GOA) (Figure 2a). In the eastern
genetic structure was tested by assigning individual whales to Aleutians, samples were assigned to the Unimak Island (UI)
the stratum in which they were sampled. stratum based on behavioral data documenting the presence
Resident killer whales were assigned to 5 large a priori of identified whales in spring killer whale assemblages
subdivisions delimiting putative populations that were foraging on migrating gray whales (Barrett-Lennard et al.
arranged largely along longitudinal lines and significant 2011; Durban et al. 2010). A priori hypotheses about
oceanographic boundaries in the North Pacific (Figure 1a): population structure were first tested by estimating both
Russia (RUS), western Aleutian Islands (WAL), central nuclear and mitochondrial genetic differentiation among these
Aleutians (CAL), eastern Aleutians (EAL), and the Gulf strata. Measures of genetic differentiation including pairwise
of Alaska (GOA). Transient killer whales were assigned to measures of FST (Weir and Cockerham 1984), F ′ST (Hedrick
9 smaller putative subdivisions: Sea of Okhotsk (OKH), 2005), G ′ST (Hedrick 2005; Meirmans and Hedrick 2010) and
Kamchatka peninsula (KAM), the Rat Islands group (RAT), chi square were calculated from nuclear microsatellite data
Tanaga Island (TAN), Pribilof Islands (PRI), eastern Aleutian using the custom R code as described above. Both FST and
Downloaded from http://jhered.oxfordjournals.org/ by guest on September 14, 2015
Figure 1. Resident killer whale samples included in this study plotted according to biopsy sample locations. (a) Solid line
ellipses indicate the extent of a priori geographic strata. Dotted lines surround putative strata indicated by Wombling analyses
and included in pairwise tests of genetic differentiation. Symbols representing individual samples are colored according to the
Structure cluster (model for k = 5) to which they were assigned with the highest probability (mean ± SD = 0.677 ± 0.143). Inset
figure shows the Structure bar plot (k = 5), where each vertical bar represents the proportional membership of individual whales
within each of inferred genetic clusters, individuals are ordered by longitude. Samples representing the southern resident killer
whale population (“SR” on the far right of the inset plot) sampled in Washington State are not mapped. (b) Ellipses indicate a
posteriori geographic strata based on analysis of nDNA and mtDNA data. Individual samples are coded according to control
region mtDNA haplotype. Inset figure shows regions of genetic discontinuity (light grey) identified by Wombsoft indicating
significant putative genetic boundaries for resident killer whales. The 1000 m bathymetric depth contour is indicated by a thin
broken line.
5Journal of Heredity
Downloaded from http://jhered.oxfordjournals.org/ by guest on September 14, 2015
Figure 1. Continued
ΦST overall, and for all pairwise comparisons among strata, Although photographic evidence suggests population sub-
were estimated as above for mtDNA sequence data. divisions, repeated sightings of killer whales throughout
the Aleutian Islands indicate infrequent movement between
neighboring geographic strata (National Marine Mammal
Detecting Spatial Genetic Clusters
Laboratory, unpublished data; Durban et al. 2010). In light
The presence of spatial genetic discontinuities or population of these movements and the generally weak signals of popu-
boundaries that were not reflected by the a priori subdivisions lation genetic structure resolved for other cetacean popu-
was explored using 2 complementary methods. First, the lations, it is reasonable to expect relatively weak signals of
Wombling method was applied as implemented in the R pack- genetic differentiation. As such, we applied the new models
age, Wombsoft (Crida and Manel 2007). This method uses of Hubisz et al. (2009), incorporating general sample loca-
geographically referenced individual genotypes to compute tions to inform cluster assignments, rather than the original
allele frequencies across the study region, and calculates the Structure model of Pritchard et al. (2000) that incorporates
gradient of these surfaces to infer genetic boundaries between prior information based on the existence of relatively well-
populations (Zhu et al. 2011). Default values were used for the supported discrete populations. The sampling location prior
Wombsoft models, with the exception of the grid size that (LOCPRIOR) was assigned according to the a priori geo-
was set at 30 × 30 across the entire study area and a bandwidth graphic strata described above. Structure was run indepen-
of h = 1.0. Longitudes were manually transformed to avoid dently both with and without the sampling location prior. We
negative values east of 180°, facilitating interpretation of the executed 5 independent runs of 105 iterations (after burn-in
resulting candidate boundaries map. Statistical significance of of 105 iterations) for each model to estimate the probability
genetic boundaries was assessed at a level of α = 0.05. support for each number of candidate clusters, k, from 1 to
The Bayesian clustering algorithm implemented in 20. The most likely number of clusters, k, was determined by
Structure 2.3 (Pritchard et al. 2000) was used to estimate the method of Pritchard et al. (2000). We also estimated the
the number of genetically distinct subpopulations, assum- statistic Δk that quantifies the second-order rate of change
ing the admixture model with correlated allele frequencies. in log-likelihood across the range of k values as described by
6Parsons et al. • Killer Whale Populations in the Northern North Pacific
Downloaded from http://jhered.oxfordjournals.org/ by guest on September 14, 2015
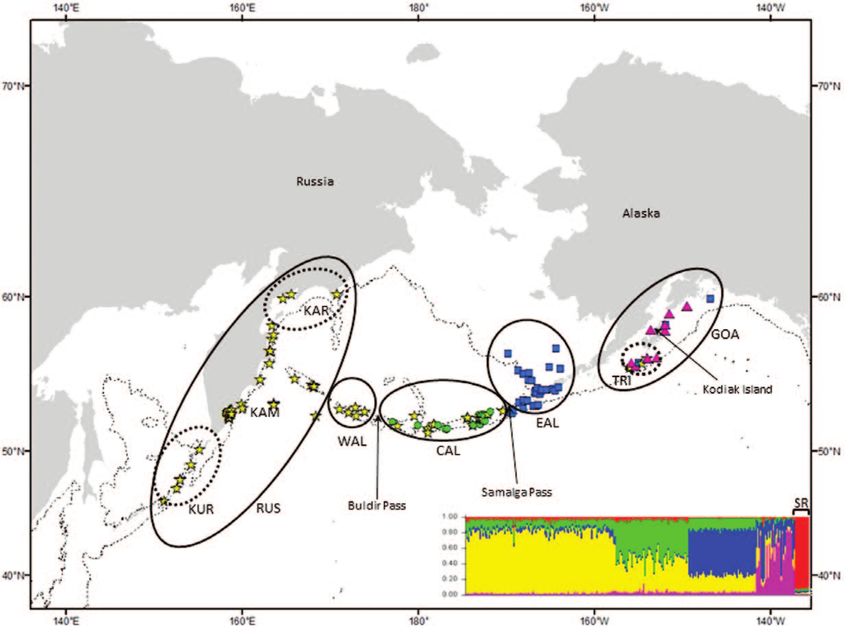
Figure 2. Transient killer whale samples included in this study plotted according to biopsy sample locations. (a) Solid line
ellipses indicate the extent of a priori geographic strata. Dotted lines surround a putative stratum indicated by Wombling analyses
and included in pairwise tests of genetic differentiation. Symbols representing individual samples are colored according to the
Structure cluster (model for k = 3) to which they were assigned with the highest probability (mean ± SD = 0.591 ± 0.100). Inset
figure shows the Structure bar plot (k = 3), where each vertical bar represents the proportional membership of individual whales
within each of inferred genetic clusters, individuals are ordered by longitude. (b) Ellipses indicate a posteriori geographic strata
based on analysis of nDNA and mtDNA data. Individual samples are coded according to control region mtDNA haplotype. Inset
figure shows regions of genetic discontinuity (light grey) identified by Wombsoft indicating significant putative genetic boundaries
for transient killer whales. The 1000 m bathymetric depth contour is indicated by a thin broken line.
Evanno et al. (2005) and directly examined Structure bar northern California and is both geographically segregated and
plots for likely values of k. genetically distinct from the Alaskan populations (Barrett-
Genetic cluster analyses were performed for the 2 ecotypes Lennard 2000; Ford et al. 2000; Krahn et al. 2004; Ford et al.
separately, acknowledging the recent findings of mitogenomic 2011). Furthermore, recent genetic analyses found no evi-
analyses that indicated high levels of genetic divergence sug- dence to suggest that calves were sired by males outside the
gesting that these 2 North Pacific ecotypes may in fact rep- population, further supporting a lack of gene flow between
resent separate species (Foote et al. 2011; Morin et al. 2010). the SRKW population and neighboring populations (Ford
In addition to samples collected in the northern North et al. 2011). This subset of SRKW samples was included to
Pacific, Structure analysis of the resident killer whale data provide an independent method for assessing the model’s abil-
set included a subset of whales (n = 11) from the southern ity to identify this set of samples as a unique genetic cluster.
resident killer whale (SRKW) population. Despite the rela-
tively continuous distribution of resident killer whales along
Quantifying Genetic Differentiation among
the west coast of North America, a number of genetically and
Subpopulations
demographically distinct populations are currently recognized.
The SRKW population is recognized as a distinct population Patterns of genetic differentiation among a priori strata were
segment inhabiting the waters between British Columbia and examined for each ecotype using microsatellite genotypes
7Journal of Heredity
Downloaded from http://jhered.oxfordjournals.org/ by guest on September 14, 2015
Figure 2. Continued
and mtDNA sequences. Lack of statistical support for discrepancies between the mtDNA data and photographic-
geographically neighboring strata was taken as evidence of based ecotype assignments clearly supports the validity of
larger geographic population strata, and putative population these 2 independent methods for ecotype determination and
boundaries were redrawn accordingly. The spatial extent of corroborates previous findings for North Pacific killer whales
genetic clusters inferred from the results of both Wombsoft (Durban et al. 2010; Matkin et al. 2007; Zerbini et al. 2007).
and Structure were compared with a priori strata. Where Ten unique haplotypes (Table 2) were defined based on
the spatial genetic models suggested regions of significant nucleotide differences across the mitochondrial control
genetic differentiation not reflected by the original a priori region (~988 bp). Both haplotypic and nucleotide diversity
subdivisions, new boundaries were drawn a posteriori, and were low, consistent with expectations considering previ-
pairwise measures of genetic differentiation among these ously published studies of killer whale mitochondrial diver-
secondary putative strata were recalculated as described sity (Table 3; Hoelzel et al. 2002; Zerbini et al. 2007; Morin
above for both mtDNA and nDNA to provide quantitative et al. 2010). Seven mtDNA haplotypes were detected from
metrics for comparison. transient killer whale samples (n = 153), whereas only 3 hap-
lotypes were represented among the resident killer whale sam-
ples (n = 288), with one of these (NEWR) found in only a
Results single whale. No mtDNA haplotypes were shared between
the 2 ecotypes. The geographic distribution of the 2 common
Genetic Diversity and Ecotype Differentiation
resident haplotypes was strongly differentiated by a break
Molecular genetic analyses were applied to 462 killer whale (FST = 0.898, P < 0.0001; ΦST = 0.915, P < 0.0001) at Samalga
biopsy samples collected throughout the study range between Pass (170°W), delimiting the western domination by NR and
the northern Gulf of Alaska and the Sea of Okhotsk the eastern domination by the SR haplotypes (Figure 1b).
(Table 1; Figures 1a and 2a; see Supplementary Appendix 2 Only 5 samples with the NR haplotype were found west of
online). Ecotype was determined for each sample on the basis Samalga Pass, but both haplotypes co-occurred in the GOA
of photographic (phenotypic) evidence and mtDNA control east of KOD (153°W). In contrast, the distribution of control
region haplotype for 98.67% of samples. The absence of region haplotypes for transient killer whales was much less
8Parsons et al. • Killer Whale Populations in the Northern North Pacific
Table 2 Control region (mtDNA) haplotype identity and frequency across sampled resident and transient killer whales for which high
quality sequences were generated (n = 405)
GenBank Common
accession number Variable sites Ecotype Frequency names
122234444457
267980499938
475530934637
DQ399077 TGTATACACCTA Resident 176 SR, ENPSR
DQ399078 .........T.. Resident 86 NR, ENPNR
DQ399074 ..C......... Resident 1 NEWR
DQ399082 ...GC.T.T.CG Transient 17 AT1
DQ399081 ....CGT.T.CG Transient 68 GAT
DQ399080 .....GT.T.CG Transient 11 GAT2, ENPT2
DQ399075 .A..CGT.T.C. Transient 35 NT1
DQ399076 C...CGT.T.CG Transient 6 NT2
GU187157 ..CGC.T.T.CG Transient 3 NT3
GU187161 .A..CGTGT.C. Transient 2 NT4
Variable nucleotide sites within the 980 bp mtDNA fragment are indicated.
Downloaded from http://jhered.oxfordjournals.org/ by guest on September 14, 2015
discrete (Figure 2b) although differences in the frequency of Table 3 Measures of genetic diversity for both nuclear and
occurrence were evident across the region. mitochondrial loci
All 27 microsatellite loci were polymorphic. The number
Resident killer Transient killer
of alleles per locus ranged from 3 (Ttr04) to 12 (EV37Mn),
whales whales
with an average of 7.22 alleles per locus (see Supplementary
Appendix 1 online). Evidence of private alleles was found mtDNA
for both resident and transient ecotypes (Table 3). In general, n 265 142
haplotypes 3 7
genetic diversity was higher among transient killer whales h 0.4503 ± 0.0198 0.6815 ± 0.0303
(Table 3). The average rate of missing data per locus due to π 0.0005 ± 0.00046 0.0042 ± 0.0023
amplification errors was 11.11% (SD = 3.24%), excluding 10 Microsatellite
samples that failed to amplify at all loci due to poor sample/ n 263 143
DNA quality. Global tests for deviation from HWE within AR 3.647 (±0.917) 6.701 (±2.242)
each ecotype revealed heterozygote deficiencies for 7 out of NA 4.000 (±1.095) 6.769 (±2.303)
the 27 loci (EV5Pm, KW207, Dde66, 415/416, GATA53, HO 0.441 (±0.145) 0.597 (±0.181)
HE 0.479 (±0.153) 0.647 (±0.184)
417/418, and FCB5). However, only KW207 showed evi- FIS 0.113 (±0.190) 0.075 (±0.076)
dence of significant departures from HWE for both ecotypes APRI 0.577 (±0.138) 3.346 (±0.363)
after correction for multiple tests. Plots of HO/HE (see
Supplementary Appendix 3 online) for each locus confirmed Values reflect the final data set of 26 microsatellite loci after the removal
an obvious heterozygote deficit for KW207, and this locus of duplicate genotypes and poor quality samples that failed across all loci.
was subsequently dropped from all further analyses. No evi- h, haplotypic diversity; π nucleotide diversity; AR, allelic richness; NA, mean
dence of genotypic disequilibrium was detected among loci number of alleles; APRI, private alleles averaged across all loci.
after correction for multiple tests.
Examination of multilocus genotypes for evidence of
duplicate genotypes revealed multiple “recaptures” of 23 the removal of duplicate and triplicate genotypes, and samples
genotypes, including 21 duplicate and 2 triplicate samples. typed at ≤10 loci, a total of 391 individuals (residents = 264;
Original electropherograms were carefully reviewed for transients = 127) were included in all spatial genetic analyses.
all putative matching genotypes mismatching at ≤3 loci. PCA plots showed clear clustering of samples by ecotype
A per-allele genotyping error rate of 0.24% was empirically (Figure 3), and 99.8% of samples correctly self-assigned to
estimated from replicated positive control samples. The most ecotype using GeneClass. The single sample that misas-
conservative estimate of probability of identity (P(ID)sib) was signed had a probability of assignment of 54% to the alter-
used to provide a lower bound on the number of loci required nate population, but assigned to the correct population with
to reliably distinguish among even closely related individuals. a probability of 46%. This assignment ambiguity was likely
Calculating P(ID)sib for an increasing number of loci, with attributed to missing data at 15 out of 26 loci. All 6 samples
increasing heterozygosity, indicated that a minimum of 10 of unknown type were assigned to the resident ecotype with
loci were required to achieve a conservative P(ID)sib estimate an average assignment value of 0.929 (±0.075), supporting
of 0.00078. This probability of identity was used to identify the clustering observed in the PCA plot, and were therefore
genotypes of sufficient quality, and all samples typed at fewer determined to originate from a resident killer whale popula-
than 10 loci were removed from subsequent analyses. After tion. In addition to the absence of shared mtDNA haplotypes
9Journal of Heredity
Downloaded from http://jhered.oxfordjournals.org/ by guest on September 14, 2015
Figure 3. Plot of first 2 principal coordinates based on microsatellite data (26 loci) for all killer whale samples genotyped from
the northern North Pacific. The long converging tails are an artifact of samples with incomplete genotypes and are eliminated
when the data set is further restricted to samples genotyped at ≥20 loci (n = 372; inset figure).
(Table 2; FST = 0.447, P < 0.0001; ΦST = 0.865, P < 0.0001), spatial genetic analyses were conducted separately for each
estimates of genetic distance indicated highly significant ecotype.
nDNA divergence between the 2 North Pacific killer whale
ecotypes (FST = 0.2104, F ′ST = 0.4690, P = 0.0001). The deep
genetic divergence between ecotypes was further supported Genetic Structure of Resident Killer Whales
by a cluster analysis performed in Structure, without prior Measures of genetic differentiation among the 5 putative
information on ecotype or sampling location. The results a priori strata of resident killer whales showed significant
grouped all North Pacific samples into one of two clusters, mtDNA differentiation among all neighboring strata in
assigning individual samples with remarkable confidence the Aleutian Islands, and significant nDNA genetic differ-
(mean ± SD = 0.9950 ± 0.01502). All individual whales cor- entiation among all pairwise comparisons except RUS and
rectly assigned to one of two clusters comprised exclusively WAL (Table 4a). In general, measures of genetic divergence
of either resident or transient killer whales. between geographically adjacent strata were in agreement
across all metrics used, and only chi square failed to support
significant subdivision between the 2 geographically adjacent
Identification of Spatial Genetic Clusters
regions represented by CAL and WAL (see Supplementary
Relatedness estimates (RLR) based on a simulated data set Appendix 4 online). Pairwise measures of differentiation
using the observed allele frequencies resulted in a maximum among a priori strata based on mtDNA sequences also indi-
estimate of RLR for unrelated pairs of individuals (URMAX) cated significant genetic differences for 7 out of 10 pairwise
of 0.571 (mean ± SD = 0.001 ± 0.086) for transient killer comparisons (Table 4a).
whales, and URMAX = 0.816 (mean ± SD = 0.0007 ± 0.129) The Wombsoft analysis indicated the presence of sig-
for resident killer whales. Using URMAX as a minimum nificant genetic boundaries at Buldir Pass between WAL and
threshold for estimates of relatedness between potential CAL, and between EAL and GOA, but did not find genetic
kin, 9 pairs of resident and 4 pairs of transient killer whales discontinuity between CAL and EAL (Figure 1b). In the
were identified as putative close relatives. One individual western extent of the study area, putative genetic bounda-
from each pair of putative relatives was removed from ries were also indicated within the RUS region separating
the data set. Subsequent data analyses were performed on the Kuril Islands (KUR) and Karaginsky Gulf (KAR) from
the data representing only unrelated individuals, and all Kamchatka Peninsula (Figure 1b).
10Parsons et al. • Killer Whale Populations in the Northern North Pacific
Table 4 Pairwise measures of genetic differentiation based on both mtDNA and nDNA among resident killer whales for both
(a) a priori and (b) a posteriori geographic strata
(a) GOA EAL CAL RUS WAL
GOA — 0.057 0.824* 0.965* 0.898*
EAL 0.040* — 0.905* 1.000* 1.000*
CAL 0.063* 0.033* — 0.124* −0.004
RUS 0.094* 0.046* 0.033* — 0.000
WAL 0.085* 0.039* 0.036* 0.009 —
(b) GOA EAL-TRI CAL WAL-RUS
GOA — 0.180* 0.783* 0.962*
EAL-TRI 0.074* — 0.915* 1.000*
CAL 0.114* 0.031* — 0.131*
WAL-RUS 0.154* 0.036* 0.029* —
Estimates of F ′ST (nDNA) are presented below the diagonal and ΦST (mtDNA) are presented above the diagonal in (a) and (b) for the indicated population
strata. Asterisks (*) indicate P ≤ 0.05 based on 10 000 random permutations of the original data set. A complete list of all FST analogs based on nDNA
presented in Supplementary Appendices 4 and 7 online.
Downloaded from http://jhered.oxfordjournals.org/ by guest on September 14, 2015
Structure indicated the most likely number of sub- Appendix 7 online). However, both of these regions were
populations to be 5 when comparing the values of k (num- significantly differentiated from the adjacent WAL-KAM
ber of clusters) estimated by the methods of Pritchard (KAR vs. WAL-KAM, FST = 0.027, P = 0.007; KUR vs.
et al. (2000) and Evanno et al. (2005; see Supplementary WAL-KAM, FST = 0.040, P = 0.006; see Supplementary
Appendix 5 online). As expected, running the model with- Appendix 7 online), suggesting subdivision within the west-
out prior information on sampling location suggested fewer ernmost sampled regions. Significant divergence between the
genetic clusters (k = 3) with a lower average probability of whales sampled around the Trinity Islands (TRI) and those
assignment to the most likely cluster (without LOCPRIOR: in northern GOA (FST = 0.029, F ′ST = 0.055, P = 0.009), but
mean ± SD = 0.577 ± 0.123; with LOCPRIOR: mean ± a lack of differentiation between EAL and TRI (FST = 0.008,
SD = 0.677 ± 0.143) reflecting the positive effect of the F ′ST = 0.016, P = 0.115) suggested that the genetic boundary
location prior on the model’s ability to detect weak genetic for EAL may extend further east than that reflected by the a
structure. All Structure results (both with and without priori strata.
LOCPRIOR) identified the southern resident killer whale From these a posteriori analyses, we consider that the
samples as a unique genetic cluster providing evidence of the data support differentiation among 4 resident killer whale
model’s ability to accurately identify discontinuous popula- subpopulations (WAL-RUS, CAL, EAL-TRI, and GOA;
tions (inset, Figure 1a). Figure 1b). Measures of genetic differentiation among these
The distribution of genetic clusters based on the results a posteriori subpopulations supported the genetic diver-
of the Structure model incorporating the LOCPRIOR gence among these subpopulations based on both nuclear
supported a population break within the Aleutian Islands genotypic data (FST = 0.031, F ′ST = 0.058, P < 0.001) and
between the a priori strata CAL and EAL at Samalga Pass mtDNA control region sequences (FST = 0.904, P < 0.0001;
(170°W), as well as a break between EAL and GOA west of ΦST = 0.916, P < 0.0001). Pairwise measures of genetic dif-
Kodiak Island (Figure 1a). Whales sampled around the Trinity ferentiation based on mtDNA sequence data did not support
Islands (TRI) were assigned to 3 different genetic clusters. significant divergence among the a posteriori subdivisions
Within CAL, Structure assigned samples either to a cluster west of Samalga Pass (Table 4b). This is likely attributable
comprised of whales sampled in RUS-WAL (n = 46) or to a to the extremely low genetic diversity within the mtDNA
unique CAL cluster (n = 48) with nearly equally probability. control region resulting in fixed haplotypes that are shared
No subdivision was indicated in the western regions of the among populations of piscivorous killer whales.
study area within RUS or WAL (Figure 1a).
To evaluate the additional subdivisions suggested by
Genetic Structure of Transient Killer Whales
WOMBSOFT and STRUCTURE, we revised boundaries
and recalculated measures of genetic differentiation. RUS Pairwise measures of genetic differentiation among the 9 a
was divided into 3 regions (Kuril Islands (KUR), Kamchatka priori strata of transient killer whales shared no significant
Peninsula (KAM), and Karaginsky Gulf (KAR)) and the mtDNA divergence (ΦST) among all strata east of Adak
Trinity Islands (TRI) separated from the other GOA sam- Island, except for PRI (Figure 2a; Table 5a). Transients
ples (Figure 1a). Although Wombsoft suggested population sampled around the Pribilof Islands (PRI were also sig-
subdivisions within the Russian samples, pairwise measures nificantly differentiated from all strata east of Kamchatka
of genetic differentiation failed to support significant diver- Peninsula (Table 4a). There was no significant mtDNA
gence between the discontiguous regions of KAR and KUR differentiation between both TAN-RAT and TAN-KAM
(FST = 0.029, F ′ST = 0.054, P = 0.120; see Supplementary (Table 5a).
11Journal of Heredity
Table 5 Pairwise measures of genetic differentiation based on both mtDNA and nDNA among transient killer whales for both
(a) a priori and (b) a posteriori geographic strata
(a)
GOA KOD EAL UI PRI TAN RAT KAM OKH
— −0.010 −0.053 −0.045 0.574* 0.280* 0.257* 0.316* 0.574*
0.064 — −0.027 0.040 0.594* 0.399* 0.346* 0.311* 0.661*
0.052* 0.061* — 0.013 0.502* 0.272* 0.250* 0.341* 0.514*
0.034 0.080* 0.041* — 0.624* 0.487* 0.436* 0.430* 0.698*
0.053* 0.033 0.019* 0.059* — 0.632* 0.624* 0.179* −0.020
0.034 0.125* 0.021 0.016 0.066* — −0.056 0.248 0.503*
0.009 0.086* 0.041* 0.076* 0.034* 0.067* — 0.270* 0.518*
−0.007 −0.015 0.023 0.044* 0.013 0.041 −0.007 — −0.015
0.060 0.129* 0.032 0.108* 0.098* 0.072* 0.022 0.049 —
(b)
KOD-GOA EAL-TAN UI PRIB OKH-KAM-RAT
— −0.007 −0.033 0.605* 0.222*
0.041* — 0.036 0.484* 0.158*
Downloaded from http://jhered.oxfordjournals.org/ by guest on September 14, 2015
0.032 0.034 — 0.624* 0.259*
0.029* 0.024* 0.059* — 0.212*
0.011 0.031* 0.065* 0.035* —
Estimates of F ′ST (nDNA) are presented below the diagonal and ΦST (mtDNA) are presented above the diagonal in (a) and (b) for the indicated popula-
tion strata. Asterisks (*) indicate P ≤ 0.05 based on 1 000 random permutations of the original data set. A complete list of all FST analogs based on nDNA
presented in Supplementary Appendices 4 and 7 online.
Estimates of differentiation based on nuclear microsatel- individuals being assigned to one of two clusters with nearly
lite data revealed little or no significant genetic differentiation equal probability (mean ± SD = 0.546 ± 0.028). However,
among some geographically adjacent a priori strata, sug- when location information (LOCPRIOR) was included, log-
gesting larger subpopulations than the original strata tested likelihood values suggest that transients in the sampled area
(Table 5a; see Supplementary Appendix 4 online). Lack of most likely represent 3 genetic clusters (see Supplementary
significant differentiation among whales sampled west of Appendix 6 online). While the evidence of genetic struc-
Amchitka Pass (OKH, KAM, and RAT) provided strong evi- ture was weak, probabilistic cluster assignments for individ-
dence for a point of geographic subdivision at Amchitka Pass ual whales differentiated a small number of GOA samples
(179°E). Results also indicated a lack of genetic differentia- (n = 9) and a subset of EAL samples (n = 10) around Unimak
tion east of Kodiak Island (KOD and GOA). In the eastern Island from all others (Figure 2a). Eight out of 10 of the
Aleutians, significant nDNA differentiation was indicated individual whales assigned to the cluster around Unimak
between EAL and neighboring PRI to the north, but there Island originated from the UI a priori stratum.
was a lack of statistical support for the a priori split between Lack of genetic differentiation among some a priori strata,
EAL and TAN, to the west (Table 5a). Interestingly, significant as well as results from both Wombsoft and Structure, gen-
genetic differentiation was apparent when comparing whales erally indicated fewer, larger population subdivisions than
observed in spring assemblages around Unimak Island (UI) the 9 originally postulated (Table 5a). To reflect these results,
to the seasonally sympatric whales sampled in the EAL stra- regional population strata were redrawn into 5 larger a pos-
tum (Table 5a). In general, all measures of genetic divergence teriori strata as follows: all samples west of Amchitka Pass
between geographically adjacent strata concurred, with the (179°) were grouped together (OKH-KAM-RAT), samples
exception of chi square which was marginally nonsignificant, from the central Aleutians (TAN) were grouped with those
failing to support the putative subdivision between RAT and from the eastern Aleutians (EAL), and all samples from the
TAN (see Supplementary Appendix 4 online). Gulf of Alaska (KOD-GOA) were grouped into a single
Wombsoft analysis supported the broad patterns stratum (Figure 2b). Substructuring within the samples col-
indicated above, highlighting both Amchitka Pass (179°E) as lected along the Kamchatka peninsula (KAM) was examined
a significant genetic boundary between the western Aleutians by comparing whales sampled within Avacha Gulf (AVA) to
(RAT) and the central Aleutians (TAN), and a zone of genetic all others in KAM to further examine the zone of genetic
differentiation within the Pribilof Islands (inset, Figure 2b). discontinuity indicated by Wombsoft analyses.
In Russian waters, the Wombsoft analyses suggested a Revised estimates of genetic differentiation (OKH-KAM-
latitudinal division across Kamchatka Peninsula (KAM) in RAT, EAL-TAN, PRI, UI, and KOD-GOA; Figure 2b)
the region of Avacha Bay (53°N) (inset, Figure 2b). supported the 5 a posteriori strata for both nuclear geno-
Structure without prior information on sampling loca- types (FST = 0.012, F ′ST = 0.034, P = 0.0009; Table 5b) and
tion provided little evidence of genetic structure with all mtDNA control region sequences (FST = 0.271, P < 0.0001;
12Parsons et al. • Killer Whale Populations in the Northern North Pacific
ΦST = 0.295, P < 0.0001; Table 5b). Genetic differentiation genetic differentiation examined for resident killer whales.
among the Russian regions, including Avacha Gulf (AVA), were Samalga Pass has previously been recognized as a physical
not significant (FST = 0.012, P = 0.183), most likely reflecting a and biogeographic boundary between the eastern and
lack of power due to extremely small sample sizes in this region central Aleutians (Ladd et al. 2005). Wombsoft analyses also
for transient whales at the current time (AVA, n = 4). indicated the presence of 2 possible genetic boundaries within
Russia. Pairwise measures of genetic divergence supported
genetic discontinuity between Kamchatka Peninsula and
Discussion the Kuril Islands; however, there was a lack of evidence
Using a suite of 26 microsatellite loci and a large number of of genetic differentiation between the 2 noncontiguous
georeferenced samples, we have provided the most compre- regions separated by KAM (KAR and KUR), which may
hensive study of killer whale population genetic structure in be attributable to small sample sizes (7 and 6, respectively).
the North Pacific to date. Analysis of molecular genetic data These major geographic subdivisions within the resident
revealed significant levels of population genetic subdivision killer whale ecotype are consistent both with direct evidence
within the 2 predominant ecotypes of the genus Orcinus across of individual movements and with the geographic extent of
the northern North Pacific using both mitochondrial con- social networks (Fearnbach H et al., unpublished data) and
trol region sequences and nuclear microsatellite genotypes. are supported by broad regional differences in both stable
Strong evidence of genetic divergence among neighboring isotopes and persistent organic pollutants suggesting that
geographic regions indicated multiple populations within the differences in prey across the northern North Pacific may
Downloaded from http://jhered.oxfordjournals.org/ by guest on September 14, 2015
currently recognized stocks for both resident and transient be a driving factor shaping population subdivisions (Krahn
killer whales. However, patterns of population genetic subdi- et al. 2007).
vision suggested some notable differences in the geographic According to nDNA data, the point of subdivision
structuring of populations between the 2 ecotypes. between resident killer whales in the northern Gulf of
Alaska (GOA) and the eastern Aleutians is in the region of
Kodiak Island. Despite the indication of a genetic bound-
Genetic Divergence among Ecotypes ary west of the Trinity Islands, pairwise comparisons among
Estimates of genetic distance between the 2 predominant strata suggest that whales sampled in this region (TRI) were
North Pacific ecotypes indicate negligible levels of gene flow significantly differentiated from GOA and most likely con-
between ecotypes, confirming the findings of previous stud- tinuous with the eastern Aleutians subpopulation. Direct
ies of ecotypic variation, and highlighting the genetic and observations of photographically documented killer whales
demographic isolation of these 2 divergent evolutionary line- indicate a single population in the northern GOA span-
ages in the North Pacific (Hoelzel and Dover 1991; Hoelzel ning the waters from southeastern Alaska to Kodiak Island
et al. 2007; Morin et al. 2010; Pilot et al. 2010). This study (Matkin 1997; Matkin et al. 1999), which is socially and spa-
more than doubled the total number of killer whale sam- tially distinct from whales further west (Fearnbach 2012;
ples representing Alaska and Russia compared with previous Matkin et al. 2007). Association data and acoustic analyses
studies (Hoelzel et al. 2007; Pilot et al. 2010) and substantially also support an eastern Aleutian population of resident killer
increased the number of polymorphic microsatellites from whales that interacts infrequently with Gulf of Alaska ani-
16 to 26 loci. Recently, analysis of mitogenome sequences mals (Fearnbach 2012; Matkin et al. 2007). However, recently
demonstrate phylogenetic sorting of ecotypes and suggest acquired data from satellite transmitter tags highlight marked
that transient killer whales should be elevated to full species seasonal differences in the movement patterns of whales
status (Morin et al. 2010). The lack of shared mtDNA hap- in the northern and eastern Gulf of Alaska, as well as dif-
lotypes and the significant genetic differentiation of nDNA ferences in core areas among matrilines (Matkin CO et al.,
data in this study support these findings and highlight the unpublished data). These data emphasize the extreme mobil-
contemporary genetic divergence of the 2 ecotypes. ity of these animals and underscore the limitations of infer-
ring fixed boundaries from instantaneous samples.
Geographic Structure of North Pacific Resident
Killer Whales Geographic Structure of North Pacific Transient
Killer Whales
Our analyses of the resident killer whale data set supported
the existence of 4 longitudinally divided subpopulations In contrast to the longitudinally defined geographic sub-
across the North Pacific and Bering Sea. The eastern populations of the resident killer whales, population genetic
Aleutians subpopulation appears to diverge from the boundaries for transient killer whales indicate a few large
northern Gulf of Alaska in the waters around Kodiak Island. geographic subdivisions, interspersed with smaller neigh-
The 2 other major points of population subdivision coincide boring or seasonally sympatric subpopulations. As with the
with 2 major island passes: Samalga Pass and Buldir Pass. The resident killer whales, genotypic data indicate that the waters
presence of population subdivision at Samalga Pass indicated around Kodiak Island likely represent the easternmost point
by Bayesian cluster analysis of nDNA genotypic data was of subdivision between EAL and GOA. Direct data on the
supported by a striking shift in the frequency of mtDNA movements of transient killer whales also support popula-
haplotypes and also supported by all pairwise measures of tion differences between the eastern Aleutians and the Gulf
13You can also read