The ageing of populations in Belgium: Current situation and perspectives - OJS UCLouvain
←
→
Page content transcription
If your browser does not render page correctly, please read the page content below
Vol. 5, n° 2, octobre 2017, pp. 69-114
DOI : 10.14428/rqj2017.05.02.03
ISSN: 20349378

The ageing of populations in Belgium:
Current situation and perspectives
Mélanie Bourguignon
Jean-Paul Sanderson
Catherine Gourbin

©2017 Mélanie Bourguignon, Jean-Paul Sanderson, Catherine Gourbin

This work is licensed under a Creative Commons Attribution-NonCommercial 4.0 International License. You can
share, adapt the material for non-commercial purposes provided that you give appropriate credit and indicate if
changes were made. For details see https://creativecommons.org/licenses/by-nc/4.0/
REVUE QUETELET/QUETELET JOURNAL
Vol. 5, n° 2, octobre 2017, pp. 69-114
DOI : 10.14428/rqj2017.05.02.03

                   The ageing of populations
                   in Belgium: Current situation
                   and perspectives
                   MÉLANIE BOURGUIGNON1
                   JEAN-PAUL SANDERSON1
                   CATHERINE GOURBIN1

Résumé
Depuis quelques décennies, les pays occidentaux font face au vieillissement de leur
population, résultat du processus de transition démographique. Cet article traite du
vieillissement des populations et des défis qu’il implique, essentiellement du point
de vue du démographe. La première section est centrée sur l’évolution démogra-
phique du vieillissement depuis les années 1970 et les particularités de la Belgique
en tant que pays européen ainsi que ses spécificités régionales sont étudiées. L’aug-
mentation de la population âgée de 60 ans et plus, et plus particulièrement celle des
80 ans et plus, s’accompagne de modifications des profils sociodémographiques des
populations. Dans la deuxième section, l’accent est mis sur les conséquences du vieil-
lissement en termes de santé, notamment à travers l’indicateur, aujourd’hui fré-
quemment utilisé, d’espérance de vie en bonne santé. Avec le report des décès à des
âges de plus en plus élevés, la probabilité de survenue de problèmes de santé a aug-
menté. Dans ce cadre, si les aidants professionnels sont indispensables dans la prise
en charge à domicile des personnes âgées à domicile, cet article s’est intéressé plus
particulièrement aux aidants proches qui jouent un rôle primordial dans la possibilité
du maintien à domicile des personnes âgées. Une troisième et dernière section est
consacrée aux conséquences socioéconomiques du vieillissement des populations,
avec une réflexion autour de la «durabilité» du système de sécurité sociale tel qu’il
est organisé aujourd’hui en Belgique. Lorsque cela s’avère possible, des comparai-
sons sont réalisées avec les situations observées dans d’autres pays européens.
Mots-clés
Vieillissement démographique, Belgique, Europe, espérance de vie en bonne santé,
système de pension.

1.       Centre for Demographic Research, Université catholique de Louvain (UCL), Lou-
vain-la-Neuve, Belgium.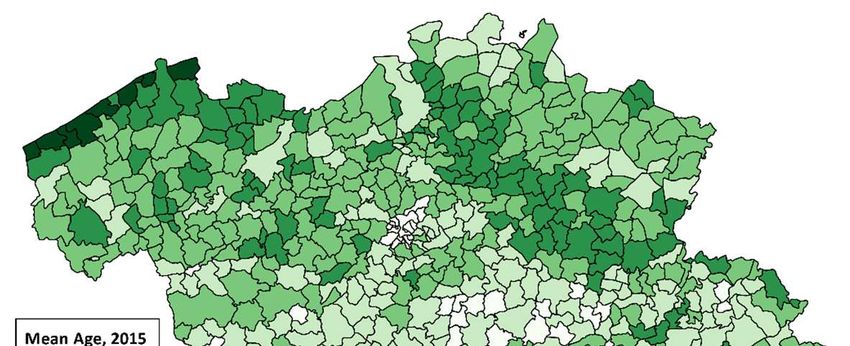
70                                                  The ageing of populations in Belgium:
                                                       Current situation and perspectives

Abstract
For many decades now, population ageing is observed in every Western countries,
as the result of the demographic transition. This article focuses on these issues
through the particular lens of the demographer. The first section is focused on the
evolution of ageing since 1970, situating Belgium in its wider context as a European
nation and analysing spatial differences within Belgium according to standard demo-
graphic indicators. The increase in the population over 60 and especially over 80
comes along with a transformation in the population profile. In the second section
we look at consequences of ageing in terms of health through an indicator that has
now become standard, that of healthy life expectancy. With death taking place at
ever older ages, the chance of experiencing health problems has also risen. If to-
day’s health-care systems are vitally important in helping older people remain at
home for longer, we have focused on the role of the family caregiver, a vital facet of
health-care systems for the old. Finally, the third section is devoted to the socioec-
onomic consequences of demographic ageing, especially in terms of the resilience of
the social security system. Where possible, we draw comparisons with the situation
in other European countries.
Keywords
Population ageing, Belgium, Europe, Healthy life expectancy, Pension system.

Introduction

For many decades now, scientists have been warning policy-makers
about the ageing of the population and its socioeconomic consequences
(Loriaux et al., 1990). This ageing, observed in every Western country, is
the result of the demographic transition – which in Belgium took place in
the nineteenth century – which saw a regime of high fertility and mortal-
ity rates transformed into one of low fertility and mortality rates.
The number of children per woman thus plunged from 4.47 in 1866 to
3.04 in 1910 (Festy, 1979; Brée et al., 2016), 1.61 in 1991 and 1.87 in
2010 (Costa et al., 2010) (Figure 1). Fewer births has meant that the rel-
ative proportion of young people has gradually weakened, leading to a
natural increase in the proportion of older people. This is known as age-
ing from the bottom, in reference to the narrowing of the bottom of the
population pyramid. At the same time, life expectancy at birth has in-
creased from 40 years in 1830 to 84 years for women and 79 for men in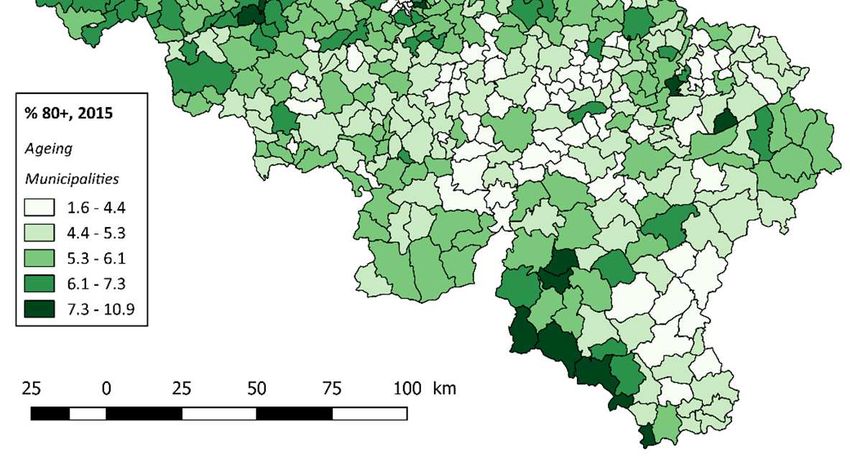
Mélanie Bourguignon, Jean-Paul Sanderson, Catherine Gourbin                               71

2016,2 thus explaining the reduction in the mortality rate for all ages (Fig-
ure 2). This dynamic has resulted in a phenomenon of ageing from the top
(with more and more people surviving to old age). These two changes
taken together have led to an overall ageing of the population (Eggerickx
et al., 2011) and to a smoothing of the age structure, with the vagaries of
mortality affecting populations to a lesser and lesser degree.

FIGURE 1        Evolution of fertility in Belgium, 1805-2015

Source: Festy, 1979; Costa et al., 2010; Brée et al., 2016.

These changes have been particularly noticeable over the past 45 years
and can be readily discerned in population pyramids (Figures 3 and 4). In
1970, the pyramid still somewhat resembled a geometric pyramid, with
a relatively wide base narrowing upwards. At that time, 13% of the pop-
ulation was aged 65 years or more and only 2% 80 or more. With the de-
crease in fertility, the bottom has shrunk and is narrowing, while the gen-
erations at the top are more numerous due to the increase in longevity.
For 2015, ageing is more obvious. The structure is shaped rather like a
haystack, with 17% of the population now 65 years of age or more and
5% 80 or more. The base is not as wide and contains fewer people than
do the various age groups between 35 and 59.

2.       https://statbel.fgov.be/fr/themes/population/mortalite/tables-de-mortalite-et-espe-
rance-de-vie.
72                                                   The ageing of populations in Belgium:
                                                        Current situation and perspectives

FIGURE 2      Evolution of life expectancy at birth in Belgium, 1830-2015

Source: Human Mortality Database.

This change in the demographic profile impacts upon individual people
as well as states. At the individual level, an increasing life expectancy
raises issues about the state of health of older people (Lannoye, Lypszic,
2000) and how life unfolds after the working years are over. At the na-
tional level, the maintenance of social security systems in the face of
change are a crucial issue that has been acknowledged for many years
(Devolder, Maréchal, 2007; Vandenberghe, 2010).
This article focuses on these issues through the particular lens of the de-
mographer. The aim is not to repeat the ideas of economists, sociologists,
medical doctors, etc. on ageing but rather to examine it as a demographic
issue. To achieve this we will set the stage by giving an overview of the
evolution of ageing since 1970, situating Belgium in its wider context as
a European nation and analysing spatial differences within Belgium ac-
cording to standard demographic indicators (such as average age, pro-
portion of the population 65 and over, dependency ratio, and seniority
ratio). In the second section we look at consequences of ageing in terms
of health through an indicator that has now become standard, that of
healthy life expectancy. We analyse this further by examining some of the
diseases associated with individual ageing and the place of the caregiver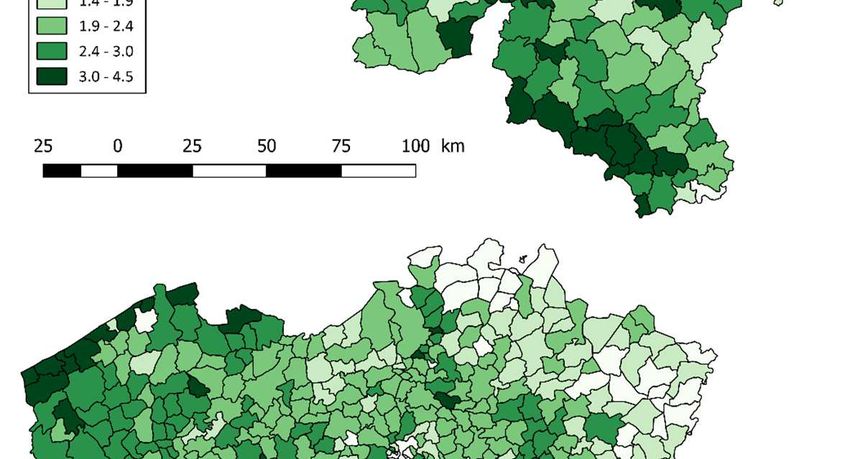
Mélanie Bourguignon, Jean-Paul Sanderson, Catherine Gourbin   73

FIGURE 3       Population of Belgium by age and sex in 1970

Source: Population census 1970.

FIGURE 4       Population of Belgium by age and sex in 2015

Source: Cytise/National Register, DGSIE.
74                                                      The ageing of populations in Belgium:
                                                           Current situation and perspectives

within the wider caregiving system for the aged. We devote the third sec-
tion to the socioeconomic consequences of demographic ageing, in par-
ticular issues around retirement, analysing discourses about the three
pillars of the retirement pension system, the impact of ageing on the em-
ployment rate of populations approaching retirement age, and the demo-
graphic argument in regards to increasing of age of retirement (as lon-
gevity continues to lengthen). Where possible, we draw comparisons
with the situation in other European countries.

Demographic Changes

About forty years ago the population of Belgium was around 9’656’000.
The milestone of 10 million was reached in 1992, and as of January 1,
2015, the population was 11’209’044. This represents an average annual
increase of + 0.33% for the period 1975-2015, with a slight acceleration
toward the end of the period (0.5% for 2001-2015). Nonetheless, this
falls far short of the growth rates previously reached in the nineteenth
century (Debuisson et al., 2000). The situation is similar in many other
European countries, which, like, Belgium, have experienced increases in
their population growth rates since 2000. The exceptions are Luxem-
bourg, whose demographic growth has remained steady, and Germany,
affected by demographic decline in its eastern area (Monnier, 2006).
These instances of very low growth are mainly the natural result of a de-
creasing gap between birth and death rates (Monnier, 2006; Sardon,
2004), and there is a very real possibility that in the relatively near future
number of deaths will overtake number of births, thus producing a chron-
ic natural deficit even with increasing longevity (Eggerickx, Tabutin,
2002).
How is ageing ideally measured?
In any consideration of the temporal progression of ageing, it is difficult to quickly encap-
sulate the issues raised in evaluating the notion of ageing. Calot and Sardon (2000) iden-
tified the most commonly used measures of ageing (and, indeed, which are used in this
article) based on chronological age. In 1989 Bourdelais challenged this focus on chrono-
logical age, pointing out that how the notions of ageing and old age are delineated changes
over time. The underlying issue, as Feller has shown (2005), is that being 60 years old in
the nineteenth century (when the first retirement schemes were being put into place) is
quite different from being that age today. Vandresse (2017) suggests adopting the notion
of prospective age, that is, the age as of which there would be a certain number of years
left to live, estimated according to a population’s mortality level. The threshold age would
thus vary from one period to another. This definition of ageing is difficult to refute as it
takes into account the biological, psychological and social dimensions of ageing. However,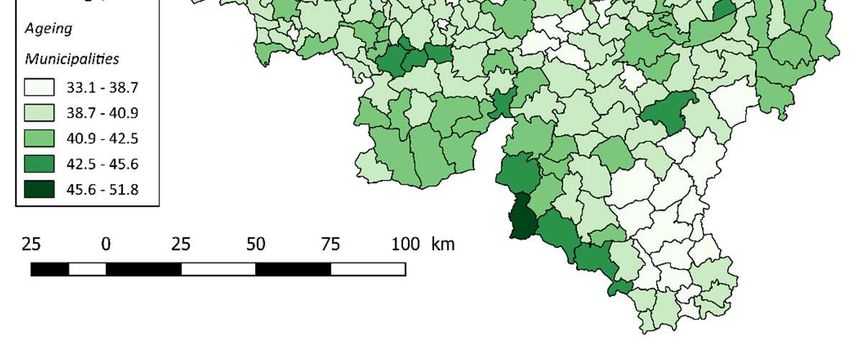
Mélanie Bourguignon, Jean-Paul Sanderson, Catherine Gourbin                           75

in discussions of processes such as demographic ageing that affect a population’s age
structure, this notion is less relevant because the objective is to highlight the increased
relative weight of those individuals at the top of the pyramid. As Calot and Sardon (2000)
noted, in these types of analyses the actual threshold is not what is at stake: what is im-
portant is how proportions change over time, allowing for an understanding of evolution
in the age structure.

In a graph showing changes to the median age of the populations of sev-
eral European Union countries (Figure 5), Belgium sits about in the mid-
dle, in contrast with Germany, where the increase began later but has
been more sustained (Monnier, 2006; Adveev et al., 2011). For 1970, the
median age for many of the countries represented on the graph is around
35 (but 28 for the Netherlands and Finland). For 2014, it is around 40 for
all the countries (with Germany at a maximum of 45). The graph clearly
shows an overall trend, as well as a major convergence (except Germany,
where ageing has been more rapid) owing to shrinking disparities be-
tween these countries.

FIGURE 5       Median age of the population in various
               European countries (1960-2016)

Source: Eurostat, 2015.

Nonetheless, beyond this country-level convergence there are major dis-
parities at the local level. Looking at the situation in Belgium for 2013, the
average age at the municipality level fluctuates between 33 and 51 years,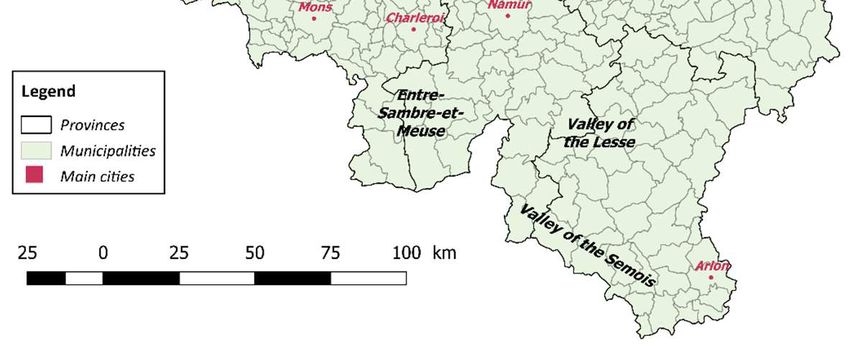
76 The ageing of populations in Belgium:
Current situation and perspectives
with a highly unequal spatial distribution. There is an overall divide be-
tween Flanders, where the population is older, and Wallonia, where it is
younger, and on top of that, within each of these regions the situation is
far from homogeneous. In general major cities have younger populations,
and there are three areas with excessive ageing (the Belgian coast, the
Lesse and Semois/Entre-Sambre-et-Meuse valleys, and a series of munic-
ipalities between Antwerp and Genk (Map 2)). These differences point to
local contexts that are highly variable and have extremely divergent
needs (in particular in terms of home-based care services) (Bourguignon
et al., 2017).
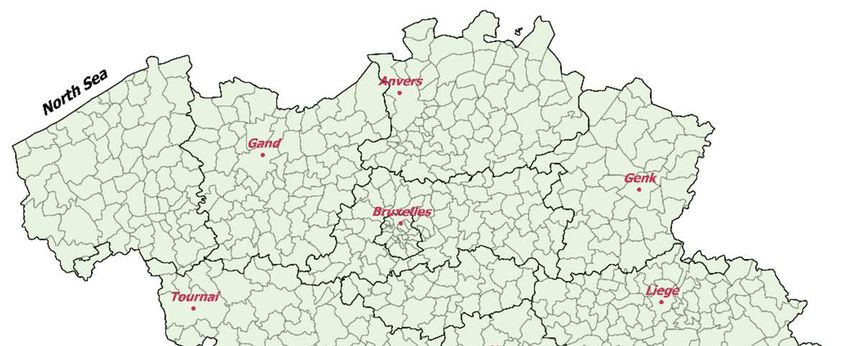
MAP 1 Administrative map of Belgium
A more revealing way of grasping the phenomenon of ageing is to look at
age structure and analyse the relative proportion of older people in the
population at large (Figure 6). Since 1960 the proportion of the popula-
tion that is 65 years of age or older has grown steadily. In 1960, this group
represented 12% of Belgium’s population; in 2015 this figure was 18%,
nearly one person in five. Belgium remains close to the European average,
near Denmark, France and the Netherlands. This group’s relative propor-
tion is expected to continue growing in the coming years, reaching 25%
of the population around 2050, or one person in four (Bureau Fédéral du
Plan, Direction générale de la Statistique, 2016).Mélanie Bourguignon, Jean-Paul Sanderson, Catherine Gourbin 77
MAP 2 Population mean age of the Belgian municipalities (2015)
Source: National Register.
FIGURE 6 Percentage of population aged 65 and over
in various European countries (1960-2016)
Source: Eurostat.78 The ageing of populations in Belgium:
Current situation and perspectives
If the relative weight of those aged 65 years or more has markedly risen,
an ageing process within this group has also taken place. Between 1970
and 2015, the age groups in Belgium that experienced the greatest
growth are the nonagenarians and the centenarians, whose numbers in-
creased fivefold and eightfold, respectively – what has been termed «age-
ing within ageing» (Eggerickx, Tabutin, 2002). This is all the more so be-
cause in the meantime the 65-79-year-old group has hardly changed (Fig-
ure 7). This trend is expected to continue in the coming years (Bureau
Fédéral du Plan, Direction générale de la Statistique, 2016) with the num-
bers of centenarians continuing to grow. These developments could have
implications for social security programmes given that the oldest mem-
bers of society are also the ones with the greatest need for health-care
services (Henrard, 1997).
FIGURE 7 Relative trend (1970=100) of age groups
65 and over in Belgium, 1970-2015
Source: National Register.
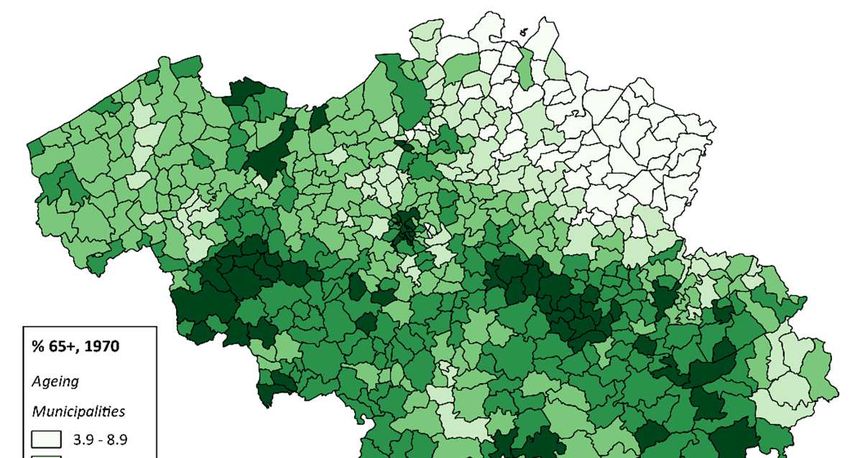
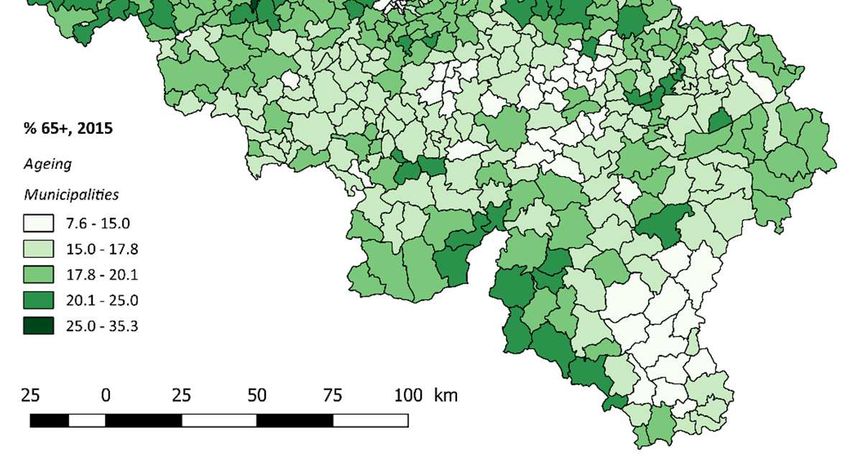
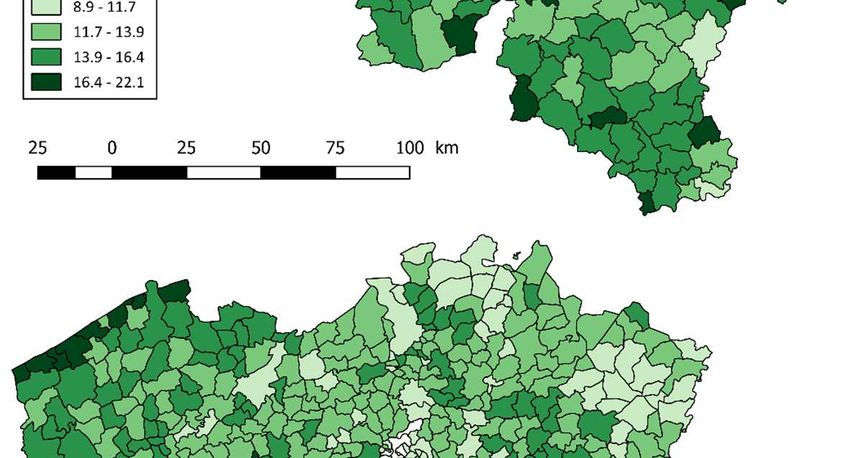
At the regional scale there has been a reversal. Up until 1970 the propor-
tion of those aged 65 years or more was higher in Wallonia than in Flan-
ders (due to the demographic transition getting under way earlier in Wal-
lonia (Map 3-4). In 2015, there is still a clear North-South division, except
that the proportions have been reversed: there is now excessive ageing
in Flanders in comparison to Wallonia and the Brussels-Capital Region,
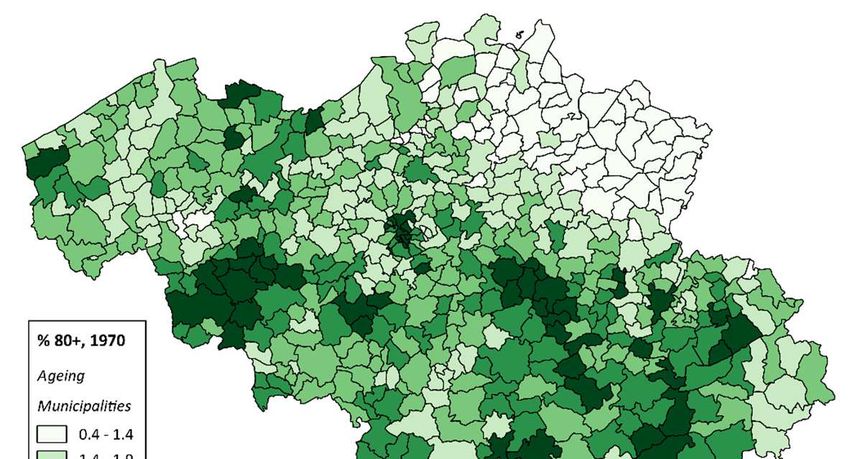
both with younger populations. However, the two regions did have oneMélanie Bourguignon, Jean-Paul Sanderson, Catherine Gourbin 79 characteristic in common: in 1970 their large cities (such as Antwerp, Ghent, Brussels and Liège) all featured excessive ageing, while in 2015 these same cities were now demographically younger than the average. This recent trend in urban under-ageing is in large part due to interna- tional immigration, which principally involves working-age people who migrate for economic reasons and affects the age structure of the areas that receive them (Rérat, 2016). The relatively young character of these urban areas is rendered especially obvious by their contrast with nearby peripheral areas, marked by intensified ageing. Beyond these general observations, the situation is variable within each region. Flanders is divided into three zones with a clear east–west cleav- age: the districts of East and West Flanders are older and that of Limburg is younger, and in between is a typical intermediate central axis. This spa- tial distribution within Flanders has historical roots, especially in terms of fertility, Limburg having been the most fertile part of the country until the 1970s. On the Walloon side, excessive ageing is especially noticeable in the South, especially in districts along the border with France, which are popular among migrants aged 50 years or more (Sanderson, 2013). It is clear that these areas do not pose the same needs in terms of services and care for the aged as do the municipalities in central Wallonia where the population is younger (Bourguignon et al., 2015). Spatial distribution maps at the local level in terms of the proportion of people aged 80 years or more show similar trends in 1970 and 2015 (Map 5-6). The ageing phenomenon is not only seen for those aged 65 years or more: younger populations are also affected, in particular those of working age.3 Changes to this group over the past few decades have been less pro- nounced than to those at the top and bottom of the age structure. For the past 150 years, those aged 20-59 years have represented about 50% of the population. Yet looking more closely at this apparently stable age group reveals that it has been through profound internal change (Figure 8). Until 1970-1981, those aged 20-39 and 40-59 followed the same over- all trajectory but with a shift of about 20 years, which brought them to converge soon after the Second World War. In 1947, those in the 20-39- year-old cohort were born between 1907 and 1927, a period when birth control was becoming widespread throughout the country; that same year, those born in 1887-1907, when women were more fertile, were now 40-59 years old. 3. This group is usually defined as those between 20 and 64 years of age even though most of them stop working before reaching 60 (Sanderson, 2014).
80                                                 The ageing of populations in Belgium:
                                                      Current situation and perspectives

MAPS 3-4       Percentage of population aged 65 and over
               in Belgium (1970 and 2015)

Source: National Register.
Mélanie Bourguignon, Jean-Paul Sanderson, Catherine Gourbin 81
MAPS 5-6 Percentage of population aged 80 and over
in Belgium (1970 and 2015)
Source: National Register.82 The ageing of populations in Belgium:
Current situation and perspectives
FIGURE 8 Evolution of labour force by age-groups and ageing
of persons of working ages in Belgium, 1846-2015
Working ages Ageing of persons of working ages
(40-59/20-39)
Source: National Register.
FIGURE 9 Ageing of working age population (40-59/20-39)
in various European countries, January 1st, 2015
Source: Eurostat.
As of 1981 the two curves begin to diverge; the relative proportion of the
20-39-year-old group decreases as it comes to incorporate the «babyMélanie Bourguignon, Jean-Paul Sanderson, Catherine Gourbin 83
busters», while the proportion of the population that is 40–59 years old
increases quickly as the «baby boomers» enter this category. These con-
trasting trends result in a quickly ageing working-age population (Figure
8). The two curves cross in 2005, after which the percentage of 40-59-
year-olds is higher than that of 20-39-year-olds (whereby the ageing ratio
for the working-age population is greater than 100). This situation has
only intensified since then, with extremely rapid growth among 40-59-
year-olds and a shrinking of the population 20-39 years, leading to a
marked ageing of the wider working-age population.
This trend has also been a feature of other European countries – France,
Germany, the Netherlands, Denmark, Finland and Sweden – albeit in var-
ying proportions. The trend in Belgium is at the intermediary stage, as it
is in France and Denmark, whereas in Finland, Sweden and Luxembourg,
it is just getting started. In Germany and the Netherlands, where working-
age populations have aged the most, the reversal has been particularly
pronounced (Figure 9).
The consequences of demographic ageing are not purely economic; they
are also social, especially in terms of isolation among older people, and
even more so because when they become dependent, the primary care-
giver is usually the spouse (Gaymu, 2009). The question of intergenera-
tional relations can be broached by looking at household composition for
older people (Table 1). Up until 79 years old it is common for both men
and women to be living as a couple. Starting at 80 years old this remains
common for men but less so for women, 48% of who now live alone. The
problem of isolation is already significant among 65-79-year-olds, with
31% of women and 17% of men living alone. The proportion of those liv-
ing in collective households increases with age, particularly among wom-
en.
TABLE 1 Distribution of population aged 65 and over according
to household type (Belgium, 2015)
Couple without Couple with Collective Single-parent
Isolated Others
children children households households
Men 65-79 years 66% 9% 1% 17% 2% 6%
Women 65-79
years 52% 5% 2% 31% 4% 6%
Men 80 years and
over 55% 5% 7% 25% 2% 5%
Women 80 years
and over 21% 2% 17% 48% 6% 7%
Source: National Register.84 The ageing of populations in Belgium:
Current situation and perspectives
FIGURE 10 Trends in the distribution of the population aged 65
and over according to household type (1991=base 100;
in brackets percentage of each type of household in 2015)
Men 65-79 years old
Women 65-79 years oldMélanie Bourguignon, Jean-Paul Sanderson, Catherine Gourbin 85 Men aged 80 and over Women aged 80 and over Source: National Register. The changes have been striking (Figure 10). Between 1991 and 2001, each of the categories (except women 65-79 years old) has seen a clear increase in the numbers of those living in collective households (even
86                                                 The ageing of populations in Belgium:
                                                      Current situation and perspectives

though their proportion remains low, apart from women 80 years old or
more).
Recent trends indicate an increase in the proportion of people living with
a spouse or otherwise cohabitating at all ages, but especially among wom-
en. This is in part related to an increasing life expectancy whereby both
spouses are surviving longer and widowhood is pushed back to very old
age. Nonetheless, there is no reason to believe that this situation will per-
sist in future generations: indeed, those who reached old age more re-
cently were born after the start of the second demographic transition. Yet
this transition could at least have a partial effect with the increase in one-
person households (Lesthaeghe, Surkyn, 2004; Adveev et al., 2011).

Ageing and Loss of Vitality: Parallel Processes?

A close relationship between age and health

Since 1841 life expectancy has gone up in Belgium at an average rate of
three months per year. In 2014, in comparison with the other 27 Euro-
pean Union countries, Belgium was positioned somewhere in the middle
in terms of life expectancy at birth (81.4 years for both sexes combined).
Countries with even higher life expectancy in Western Europe include
Luxembourg (82.3 years) and France (82.8 years), and in Southern Eu-
rope Italy (83.2 years) and Spain (83.3 years) (Figure 11). However, for a
number of countries, especially in Eastern Europe, there is significant
room for improvement, with life expectancy at birth at around 75 years,
such as Bulgaria (74.5 years), Latvia (74.5 years), Lithuania (74.7 years),
Romania (75 years) and Hungary (76 years) (Adveev et al., 2011).
Differences – in some cases significant – persist between men and women
in terms of life expectancy, with women having a longer overall average
lifespan than men (Lefèbvre et al., 2014; Vallin, 2002). In 2014 in Belgium
the gap was just over 5 years, but for some countries, it can be even wider.
In 2014 this was the case for most of the EU-28 countries with lower life
expectancies, including Poland (a gap of 8 years between sexes), Estonia
(9.5 years), Latvia (10.3 years) and Lithuania (10.9 years)4.

4.      From data published by Eurostat for 2014.
Mélanie Bourguignon, Jean-Paul Sanderson, Catherine Gourbin 87 FIGURE 11 Life Expectancy at birth by sex in various European countries, 2014 Source: Eurostat. Nonetheless, this sex difference is nuanced by the fact that by virtue of living longer, women also spend a greater span of their life in poor health (Figure 12), a factor that generally translates into increased isolation (taking into account the difference in mortality between men and women). If we focus only on healthy life expectancy,5 male/female differ- ences shrink and may even disappear or become negative.6 In several Eastern European countries where the difference between male and fe- male life expectancy approaches 10 years, women’s advantage in terms of total lifespan is mainly explained as a longer average unhealthy 5. Data on healthy life expectancy was drawn from the Eurostat database. According to Eurostat, this indicator «measures the number of remaining years that a person of specific age is expected to live without any severe or moderate health problems» (Eurostat, Reference Metadata). Eurostat goes on to explain that the notion of «health problem» is «reflecting a dis- ability dimension and is based on a self-perceived question which aims to measure the extent of any limitations, for at least six months, because of a health problem that may have affected respondents as regards activities they usually do» (Eurostat, Reference Metadata). Thus the indicator of healthy life expectancy includes two elements: that of mortality and that of health (the latter based on a specific question posed in the EU-SILC survey). See http://ec.europa.eu/ eurostat/cache/metadata/en/hlth_hlye_esms.htm. 6. In this case this means that men have a longer average healthy lifespan than that of women.
88                                                        The ageing of populations in Belgium:
                                                             Current situation and perspectives

lifespan. The gap between healthy and unhealthy life expectancy ac-
counts for around 60% of the total gap in life expectancy at birth between
men and women. In countries such as France, Germany, Spain and Den-
mark, these sex differences are reduced to nearly zero if healthy life ex-
pectancy is taken into account, highlighting the relevance of the distinc-
tion between «quality of life» and «quantity of life». Even more surprising
is that in other countries, including Belgium but also Italy and especially
Luxembourg and the Netherlands, women show no advantage at all in
terms of healthy life expectancy;7 in fact, in these countries it is actually
men who are at an advantage because in 2014 their healthy life expec-
tancy was longer than that of women. Although these trends do not apply
to the entire period under study, they nonetheless show that lifespan,
longer on average for women, is an indicator of «quantity of life», of which
the relationship with individual health and well-being is far from simple.
The subjective health indicator confirms these observed discrepancies
between men and women. These are in part due to an effect of selection
of populations in good health across all ages (a corollary of male excess
mortality is an increased selection of individuals in better health). Two
significant points can be derived from Figure 13. On one hand, the asso-
ciation with good health and age is negative: the proportion of individuals
in good health diminishes with increasing age. On the other hand, the gap
between men and women widens with age, with the exception of those
55 to 64 years old, the only group with an equal proportion of men and
women claiming good health. At older ages, the opposite occurs: when
differences in life expectancy between men and women, and the selection
effect this implies, are taken into account, men that live to a very old age
claim better overall health than women the same age.

7.        According to Meslé (2004), differences in the gaps between male and female life
expectancy are due at least in part to disparities between sexes in terms of certain disease pa-
thologies and their relative weight in patterns of national mortality.
Mélanie Bourguignon, Jean-Paul Sanderson, Catherine Gourbin 89
FIGURE 12 Gap between life expectancies in good/bad health of men
and women in various European countries, 2014
Source: Eurostat; Authors’ calculations.
FIGURE 13 Percentage of population reporting (very) good health (subjective
health indicator), Belgium, 2013
Source: Health Interview Survey, Belgium.90 The ageing of populations in Belgium:
Current situation and perspectives
Improvements in quality of life and in medicine have led to an increase in
life expectancy since around the second half of the nineteenth century.
This increase, however, has come with a higher incidence of chronic or
long-term diseases and handicaps, especially at the oldest ages (Bopp,
2013). These trends are confirmed by the Belgian data from the 2013
Health Interview Survey, with long-term ailments more and more fre-
quent, especially among the oldest people (Figure 14). One person in
three aged 75 years or more suffers from multimorbidity (Figure 15), that
is, the co-occurrence of at least two chronic illnesses (Bopp, 2013; Bopp,
Holzer, 2012). These incidences of multimorbidity necessitate changes to
the health-care system in recognition of the slow development of these
illnesses and their long-term nature.
FIGURE 14 Distribution of population according to the presence
of one or more important8 chronic diseases detected
during the previous year, Belgium, 2013
Source: Health Interview Survey, Belgium
8. Chronic diseases here include chronic respiratory diseases, serious cardiac diseases,
diabetes, arthritis/osteoarthritis, hypertension and cancer (HIS, 2013).Mélanie Bourguignon, Jean-Paul Sanderson, Catherine Gourbin 91
FIGURE 15 Distribution of the population suffering from one
or more chronic diseases, long-term conditions or
handicaps according to the restrictions in the daily
activities, Belgium, 2013
Source: Health Interview Survey, Belgium
Physical and Psychological Problems: A «Heavy Burden»
In Belgium, men and women suffer from the same chronic diseases over-
all, albeit with minor differences in order. The most common disease
among women is osteoarthritis, with a 50% prevalence rate; for men this
rate is only 28%. For men the most common disease is hypertension
(which increases the risk of cardiovascular disease), of which the preva-
lence rate for men and women is the same. In terms of chronic diseases,
the most common are musculoskeletal illnesses, with high prevalence
rates for both men and women.
This ranking of the most common chronic diseases does not include de-
mentia, depression and other psychological ailments even though their
prevalence increases with age. Dementias are among the most commonly
occurring ailments that have repercussions for the aged in terms of daily
life. Dementia as a category includes a wide variety of specific diseases,
including Alzheimer’s which accounts for about 60% of cases of dementia
(Ivanoiu, 2000 cited by Charlot, Guffens, 2007).92 The ageing of populations in Belgium:
Current situation and perspectives
FIGURE 16 Most common chronic diseases in the population
aged 65 and over, Belgium, 2013
Source: Belgian HIS in Van der Heyden and Charafeddine, 2014, p. 13.
According to the Tenth Revision of the International Statistical Classifica-
tion of Diseases and Related Health Problems,
« Dementia (…) is a syndrome due to disease of the brain, usually of a chronic or
progressive nature, in which there is disturbance of multiple higher cortical func-
tions, including memory, thinking, orientation, comprehension, calculation,
learning capacity, language, and judgement. Consciousness is not clouded. The
impairments of cognitive function are commonly accompanied, and occasionally
preceded, by deterioration in emotional control, social behaviour, or motivation.
This syndrome occurs in Alzheimer disease, in cerebrovascular disease, and in
other conditions primarily or secondarily affecting the brain» (World Health Or-
ganization, ICD-10, 2016 version).
Although this is a precise definition, it is difficult to ascertain the preva-
lence of dementias with any exactitude. Significant differences exist be-
tween data sources. According to Alzheimer Europe’s published figures
for 2012, only a very small proportion of the EU-28 population – 1.55% –
has dementia, with Belgium near the top of the ranking at 1.77%, just be-
low Italy (2.09%), Germany (1.92%), France (1.85%) and Sweden
(1.82%) (Alzheimer Europe, 2013). Based on these figures the Belgian
population thus has at least 190’000 people suffering from dementia (Alz-
heimer Europe, 2013). Although these figures do not reveal age differ-
ences, the frequency and severity of dementia does increase with age.
Vandeurzen’s figures (2010, cited by Alzheimer Europe, 2013, p. 16) putMélanie Bourguignon, Jean-Paul Sanderson, Catherine Gourbin 93 at around 10% the proportion of the Flemish population aged over 65 years, around 20% over 80 years and around 40% over 90 years. Extrap- olating for all of Belgium, a 10% prevalence for those over 65 years old would mean around 200’000 people in 2015, rising to around 310’000 by 2050 if this prevalence is maintained.9 Yet these estimates must be treated with caution because other factors influence the incidence and prevalence of dementia as much as age does, such as sex (dementia is more common among women), family history and the presence of hyper- tension (Ankri, 2009). The various forms of dementia often translate into a progressive loss of independence as well as a string of social, family and economic problems (Charlot, Guffens, 2007). Dementia can bring about a number of behav- ioural challenges which can affect and complicate the life of the dementia sufferer as well as that of their caregiver(s) (Charlot, Guffens, 2007, p. 12). In the beginning home care services, professional involvement and close family support may be enough, but inevitably a transfer to a new, specially adapted residential situation is soon required (Charlot, Guffens, 2007, p. 12). The «Burden»10 of Family Caregivers: The Recognition of this Status in Belgium as a First Step Towards its Incorporation into Policy Despite the involvement of a wide range of professionals now working to improve quality of life for the aged, the family caregiver remains central to their care (Gimbert, Malochet, 2012), even where professional help is readily available. Belgian data from the Health Interview Survey show that 85% of individuals living with some kind of limitation to their basic activities of daily living have a caregiver, with 39% having a professional caregiver, 38% having family caregivers and 24% having both (Masuy, 2010). However, when it comes to the instrumental activities of daily liv- ing, the proportion with both types of caregivers rises to 63% versus only 17% with professional help only and 17% with informal help only (Ma- suy, 2010). Other studies show that for all of Europe, including countries 9. These estimates are based on population projections developed by the Federal Plan- ning Bureau (Bureau Fédéral du Plan, Direction générale de la statistique, 2016). Figures on the prevalence of dementia are drawn from those published on the Alzheimer Europe (2013). 10. The term «burden» should be approached with caution as it connotes the idea that the aged are a heavy weight on society. We do not wish to perpetuate this view. We use this term as it is used in the literature on caregivers to highlight the load often borne by caregivers, espe- cially informal caregivers (Boutoleau-Bretonnière, Vercelletto, 2009).
94                                                   The ageing of populations in Belgium:
                                                        Current situation and perspectives

with efficient health services for the aged, «nearly 80% of care hours de-
voted to dependent elderly people are provided by family members»11
(Huber et al., 2009 cited by Gimbert et al., 2012, p. 131).
The crucial role played by informal caregivers in home care and in health-
care systems for older people is largely because of the company they pro-
vide as well as assistance with daily activities. Some older people need
long-term care and thus require not just therapeutic care but permanent
or near-permanent support. The close relationship that family caregivers
have with older people means that the role they play in care regimes is
vital. Professional services, on the other hand, are often rigidly scheduled
and focused on specific issues, as well as taking a therapeutic approach,
most often monopathological, that does not take into account the contri-
butions of their professional caregivers to their patients.
The caregiving responsibilities involved in having an older person in the
family are not evenly distributed among family members. The literature
shows that most family caregivers are immediate family members, pri-
marily spouses, children and children-in-law (Dutheil, 2001; Bracke et al.,
2008; Willemé, 2010; Haberkern, Szydlik, 2010). It is most commonly
women who provide caregiving for older people, especially when the
level of care required is high (Gimbert, Malochet, 2012; Bocquet et al.,
1997; Dutheil, 2001; Deboosere et al., 2006; Bracke et al., 2008; Fontaine,
2009; Bonnet et al., 2011). When men provide care for older people they
generally do not carry out the same tasks as women caregivers do
(Bocquet et al., 1997). While the women most often will take care of per-
sonal care and domestic tasks, the job of managing the budget and advo-
cating for the patient’s rights, for example, more often will be carried out
by the men (Dutheil, 2001; Ravaud, Ville, 2003; Gaymu, 2012). Deboosere
et al. (2006) found that the distribution of tasks varies according to type
of household: men and women tend to participate equally in caregiving
tasks when the older person lives with them at home, but if the patient
lives elsewhere, it is more frequently women who will provide the care.
Care provided from outside the patient’s home presumably tends to be
children – especially daughters – caring for their parents (Deboosere et
al., 2006).
Some studies have also concluded that level of career involvement of
caregivers can also account for differences between individuals in terms
of profferment of care, although the link between these two variables, and
what this means, remains unclear (Fontaine, 2009). Some empirical stud-

11.    All quotations in this text have been translated in English by the authors.
Mélanie Bourguignon, Jean-Paul Sanderson, Catherine Gourbin 95 ies have in fact had contradictory results. Some authors, for example, af- firm that people inactive in the formal workforce are more involved in caregiving activities, especially if the need for care is frequent (that is, more than twice per day) (Dutheil, 2001; Deboosere et al., 2006; Crespo, 2006; Henz, 2006). For some of these authors, this is because of voluntary abandonment of employment in order to fully dedicate oneself to care- giving activities. Other studies have concluded that level of care impacts on the relationship between caregiving activities and work opportunities. Those offering intensive levels of care are less likely to be involved in a career while those whose level of care is less intensive are more likely to be (Carmichael, Charles, 1998; Fontaine, 2009). Be it as it may, being a caregiver involves a major investment in time, en- ergy and emotion. Caregiving has consequences – physical, psychological, emotional, but also economic, professional and social – which taken to- gether can be termed the «burden» of caregiving. On this point most au- thors are in general agreement. These willing caregivers suffer physically as well as psychologically, and even more so in cases of dementia where the behaviour and mood of older people are affected (Boutoleau-Breton- nière, Vercelletto, 2009). Still, caregiving can be rewarding (Gimbert, Malochet, 2012), and the investment of family caregivers at the career, family and personal level can be considerable. Career involvement, when this is an option, can often be a way of combating feelings of isolation, entrapment and withdrawal associated with caring for an older parent (Campéon et al., 2012). Caregiving responsibilities also mean a whole string of concessions at the family level (such as rearranging daily rou- tines) whereby the caregiver may have difficulty in setting boundaries. The desire to keep things running well on all levels (career, family, help- ers) exposes them to a variety of forms of pressure, exhaustion, stress and fatigue (Campéon et al., 2012). In Belgium, changes to legislation were recently implemented in recogni- tion of caregivers. This is an important first step toward the establish- ment of policies in their favour. The law in question was published in the Moniteur Belge on June 6, 2014, defining the family caregiver for a highly dependent person as «that person who renders regular or continuous as- sistance and support to the person being helped» (Art. 3, our emphasis). This same law defines the notions of assistance and support as «any in- vestment in time on the psychological, social or moral plane and on the physical and material plane that has repercussions in terms of the career or family situation of the family caregiver» (Art. 2, No. 3). The assistance or support rendered must be continuous (lasting over time – Art. 2, No. 4) and regular (shaped by the cyclical progression of the disease or the
96                                                The ageing of populations in Belgium:
                                                     Current situation and perspectives

development of dependency – Art. 2, No. 5), while at the same time taking
into account the choices and desires of the person being helped (Art. 2,
No. 6). The status of caregiver is granted under a number of conditions:
the caregiver must have reached the age of majority (Art. 3, Sec. 2, No. 1),
«must have developed a close or trusting, emotional or geographic rela-
tionship with the person being helped» (Art. 3, Sec. 2, No. 2), «must prof-
fer the support or help for non-professional purposes, free of charge and
with professional support» (Art. 3, Sec. 3, No. 1), and respect the desires
of the person being helped (Art. 3, Sec. 3, No. 2). Finally, the law allows
for the family caregiver to seek provisional recognition of their informal
role from their public health provider.
While the adoption of this law will not result in major concrete changes
for caregivers, it does make Belgium one of the few countries where care-
givers are given legal recognition. Belgium must now establish a set of
social rights to provide caregivers with protection and allow them if need
to maintain their employment and access to social security, as well as re-
ceive physical and psychological support (ASBL Aidants proches12).
These recent changes were introduced at the level of Belgium, even if
Flanders was a step ahead of the other regions of the country. As part of
a 1999 decree, this region in the North of the country has set up a system
of dependency insurance, the «Vlaamse Zorgverzekering» which, on the
basis of individual annual contributions, could be used for non-medical
aids provided to dependent persons, including those provided by the
family circle (Karakaya, 2010; Masuy, 2010).

Ageing and Retirement

Just as important as these issues of health and care are those of pension
and employment for older people. Growth rates for the population 65
years old and over, which can be predicted by the continuing rise in life
expectancy and the baby-boomer generation reaching the 65-year-old
mark, will peak in the European Union (EU) over the first half of the
twenty-first century, reaching near-stagnation by 2050 in most EU coun-
tries. This raises the issue of the long-term financial viability of the retire-
ment regime in its current form.

12.     URL: www.aidants-proches.be/fr/loi-aidants-proches.
Mélanie Bourguignon, Jean-Paul Sanderson, Catherine Gourbin 97 Belgium’s Pension System The retirement pension branch of a social security system is often de- scribed as being built on three pillars. In Belgium, as in other EU coun- tries, the first pillar is the statutory pension scheme, which will be de- scribed in the following section. The other two pillars are complementary pension structures that are optional. The second pillar is that of financial instruments (pension plans, collective insurance schemes) set up by com- panies or industry sectors that allow for additional pension payments to be made to workers after they retire. The third pillar is that of individual pension plans (e.g. retirement savings, life insurance) set up in view of accumulating capital to provide additional income upon retirement. The latter two pillars are buttressed by tax breaks offered by the government. In terms of the issue of the impact of ageing on the pension system, it is the impact on the first pillar that is at stake, that of the statutory pension scheme. History and Overview The statutory pension plan for salaried workers, in its current form as a redistributive pay-as-you-go pension system, was established in 1955 for labourers and in 1957 for salaried workers (previously it had been a sys- tem based on personal savings). This pension plan recognises overall work history and is designed to guarantee a decent quality of life for workers retiring from work. It is a compulsory social insurance system financed by workers’ contributions drawn from their incomes, private- sector employers and government subsidies. The system provides a guar- antee against loss of income due to «inability to work due to age» (San- derson et al., 2015; Vanthemshe, 1994). This «inability to work» is made concrete by the application of a fixed retirement age, which since 2016 has been 65 years for both women and men. The worker qualifies for a full pension if they were active in the workforce for 45 years.13 Any worker having made contributions to the plan throughout their working life qualifies for a pension to replace their salary once they have reached official retirement age. The Belgian system, like that of other European 13. Up until 2016 an early retirement pension could be granted to individuals 60 years old with a 35-year working history.
98                                                       The ageing of populations in Belgium:
                                                            Current situation and perspectives

countries, works by redistribution: contributions made by today’s work-
ers are used to pay annual pensions for those already retired (Conférence
nationale des pensions, 2010).14

FIGURE 17      Life expectancy at age 65, EU, 2015

Source: Eurostat.

Belgium’s pension plan was set up in the period after the Second World
War, when Western Europe was experiencing strong economic growth.
Life expectancy at birth in 1955 was 65.9 for men and 71.2 for women. In
2015 life expectancy at birth for men and women was 78.6 and 83.2 re-
spectively, an increase of about 12 years over a period 60 years. In terms
of life expectancy at 65 years – the age at which pension payments may,
in principle, begin – the graph in Figure 17 shows that for all 28 EU coun-
tries together actual average lifespan after 65 years is 17.9 years for men
and 21.2 years for women, with the Belgian figures close to this at 18.2
and 21.5 respectively, or an average of about 20 years of life after the legal
retirement age. For comparison purposes, life expectancy at 60 years,
currently 21.9 years for men and 25.4 for women (Statbel, 201515), was
at the end of the 1940s 15.4 and 17.4 years respectively (Chasteland,
1960), an increase of 6.5 years for men and 8 years for women.

14.       The system thus encourages an intergenerational social contract.
15.      https://statbel.fgov.be/fr/themes/population/mortalite-et-esperance-de-vie/
tables-de-mortalite-et-esperance-de-vie#figures (exact ages).
Mélanie Bourguignon, Jean-Paul Sanderson, Catherine Gourbin 99 Budgetary expenditure on pension scheme financing Political and social systems must adjust on numerous levels in the face of demographic change. Even from a purely financial point of view, an age- ing population translates into long-term increases in social spending. Bel- gium’s Study Committee on Ageing (CEV) regularly reviews the budget- ary projections related to ageing for 2040-2060, based on a set of demo- graphic, socioeconomic and macroeconomic projections as well as on a series of hypotheses that take into account trends in terms of social poli- cies and reforms implemented by the country’s governing bodies. In 2015 budgetary expenditure related to ageing was 25.3% of the GDP (Comité d’étude sur le vieillissement, 2016), that is, over 103 billion euros. This figure includes two major components: pension payments (10.4% of the GDP) and health-care costs (8.0% of the GDP). Thus in 2015 the amount Belgium spent on pensions was 42 billion euros. It is projected that budgetary expenditure on ageing will reach 28.2% of the GDP in 2040 and diminish slightly thereafter to 27.6% of the GDP in 2060. The pension scheme component of this cost will also rise, to about 12.7% of the GDP in 2040 and 2060. It goes without saying that, especially in a period of post-economic crisis, the growth in the proportion of the budget spent on ageing, and on pension payments in particular, will be- come a major strain on the budget (as it will for social spending in other areas). What is more, these projections are based on an average economic performance. For example, an increase in productivity of 1.5%, which at a quarter – or half-point lower would mean an even greater proportion of the GDP spent on the long-term effects of population ageing. Possible steps to take Measures might be taken that do not pose any fundamental challenge to the first pillar, such as increasing worker contribution levels or decreas- ing pension allowances, but these would not be popular options. The for- mer, which highlights the intergenerational aspect of the system, would not be easily accepted by the working population whose contributions fi- nance the pensions of those already retired. The latter would already de facto be in effect if pensions ceased to be inflation-adjusted. Other resources may also be tapped into to finance pension plan pay- ments. In Belgium in 2001, the government set up an Ageing Fund in or- der to finance increased expenditure on pension payments between 2010 and 2030. This fund was to be drawn from public funding sources such as
100                                          The ageing of populations in Belgium:
                                               Current situation and perspectives

budgetary and social security surpluses, non-fiscal sources and earnings
on fund investments. However, it was only in 2006 that there was a budg-
etary surplus and 176 million euros were able to be deposited into the
fund; prior to that it had been funded purely from non-fiscal revenue.
Since 2007 there has been no more funding from these two sources. Over
15 years only 16 billion euros were collected, or the equivalent of half a
year of pension payments. This fund thus did not meet its objective of
providing short-term mitigation for the increasing share of the GDP spent
on pension payments. In May 2016 the government decided to wind up
the fund, and this went into effect on January 1, 2017 (Conférence natio-
nale des pensions, 2010; Itinera Institute, 2010).

A Longer Working Life?

Retirement age

Pushing back the legal retirement age and/or lengthening the contribu-
tion period for workers are key measures that have been taken by Euro-
pean governments in response to demographic ageing. The result is an
increase in the number of workers, a decrease in the number of retirees,
and for those who stop working before the legal retirement age, a de-
crease in pension allowances.
In Belgium the pension scheme that was put into place in the 1950s set
the legal retirement age at 65 for men and 60 for women, the latter of
which was raised to 65 in 1997. Span of working life was set at 45 years
for men and 40 years for women, the latter raised to 45 years in 1997.
Workers may also take early retirement up to 5 years before the legal re-
tirement age (Sanderson, 2014). In 2005, in recognition of the intergen-
erational solidarity pact, access to early retirement pensions was limited
in order to incite the employed and the self-employed to work right up to
the legal retirement age.
Although the legal retirement age was 65 until 2016, a graph of the aver-
age retirement age between 1970 and 2014 (Figure 18) shows that at the
EU level this indicator was gradually decreasing until the start of the
twenty-first century, going from 68 years in 1970 down to 61.4 years by
2001, and then rising slightly afterwards to 62.9 years in 2014. Through
all periods, Belgium’s average retirement age is among the lowest of the
EU countries that appear in this graph.
Mélanie Bourguignon, Jean-Paul Sanderson, Catherine Gourbin 101
FIGURE 18 Mean age at retirement for men in various EU countries (1970-2014)
Source: OECD.
A workforce overlooked: 55-64-year-olds
The pension and retirement system touches upon the general issue of end
of career, to which today is applied a series of measures for a smooth
transition from employment to retirement. There is often a gap between
the legal age for access to a pension and the age at which one actually
leaves the employment market owing to the implementation of provi-
sions for early retirement since the second half of the twentieth century
(Burnay, 2011; Sanderson et al., 2015):
«…in the 1970s and 1980s, all European countries were in full-blown economic
crisis. Drastic industry-restructuring programmes caused unemployment to
soar. Public policies, such as those in Belgium, were designed to give the young
unemployed the advantage over older workers (…). Workers 50 years of age and
over were encouraged by the government to leave the work force through early
retirement, unemployment, inability to work and taking sabbaticals. (…) the
main objective of these measures was to smooth the way for employment for the
young through the trimming away of older workers» (Burnay, 2011, p. 72).
This early withdrawal from the employment market has resulted in un-
deremployment among 55-64-year-olds: in Belgium, the employment
rate for those 20-64 years old is 67.7%, but only 45.4% for those 55-64
years old (data from Eurostat). While it is true that the employment rate
for 55-64-year-olds in Belgium has been increasing since the late 1990s,102 The ageing of populations in Belgium:
Current situation and perspectives
it is well below rates in other European countries such as Denmark
(67.8%), Germany (68.6%) and Sweden (75.5%) (Figure 19).
FIGURE 19 Employment rate for persons aged 55-64 (men and women)
for various EU countries
Source: Eurostat.
Even if Deboosere and Vandenheede (2015) argue that earlier retirement
than before could increase life expectancy, a hypothesis that still has to
be confirmed, attempts have been made in Europe to bring the employ-
ment rate for older workers back up, for example the Europe 2020 pro-
gramme (Albanese, Cockx, 2015). Such programmes come up against
many obstacles, including stereotypes about older workers, their fre-
quent desire to leave the employment market before the legal retirement
age, and the deterioration in working conditions, which increasingly
«render career paths more vulnerable, especially through an increasing
risk of developing health problems at end of career» (Burnay, 2011,
p. 72).
Negative stereotypes about older workers are well entrenched. Lack of
vigour, lower productivity, inability or lack of interest in using technol-
ogy, resistance to change and modernisation: these examples point to the
high level of antipathy toward these workers (Burnay, 2011). Even where
their qualities are recognised (experience, sense of responsibility, self-
sufficiency), it can be difficult to get to manage a company environmentYou can also read