Demographic Change in the Netherlands: Strategies for Resilient Labour Markets - OECD iLibrary
←
→
Page content transcription
If your browser does not render page correctly, please read the page content below
OECD Local Economic and Employment Development (LEED)
                                       Papers 2013/13

                                         Cristina Martinez-
                                                Fernandez,
                                           Tamara Weyman,
                                               Frank Cörvers,

    Demographic Change                        Jouke van Dijk,

        in the Netherlands:                        Arjen Edzes,

    Strategies for Resilient                Andries de Grip,

            Labour Markets               Marije Hamersma,
                                                   Philip Taylor,
                                           Jesper van Thor,
                                             Femke Verwest,
                                             Leo van Wissen
                                  https://dx.doi.org/10.1787/5k3xnhvzhmxn-en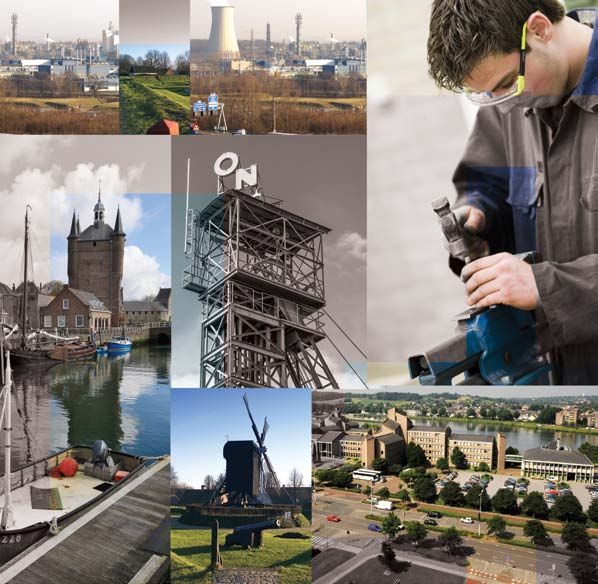
Demographic Change in the Netherlands:
Strategies for resilient labour markets
DEMOGRAPHIC CHANGE IN THE NETHERLANDS

Disclaimer

This work is published on the responsibility of the Secretary-General of the OECD. The opinions
expressed and arguments employed herein do not necessarily reflect the official views of the Organisation
or of the governments of its member countries.

This document and any map included herein are without prejudice to the status of or sovereignty over any
territory, to the delimitation of international frontiers and boundaries and to the name of any territory, city
or area.

Cover © François Iglesias (OECD/LEED)

Cover photos credits: Ministry of the Interior and Kingdom Relations, The Netherlands

© OECD 2013

ISSN 2079-4797 (PDF) OECD Local Economic and Employment Development (LEED) Working Paper Series. This report is part of a series of
working papers from the OECD Local Economic and Employment Development (LEED) Programme. The LEED Programme identifies, analyses
and disseminates innovative ideas for local development, governance and the social economy. Governments from OECD member and non-member
economies look to LEED and work through it to generate innovative guidance on policies to support employment creation and economic
development through locally based initiatives

2
DEMOGRAPHIC CHANGE IN THE NETHERLANDS

Demographic change in the Netherlands:
 Strategies for resilient labour markets

 An analysis of Groningen/Drenthe, Limburg and Zeeland Provinces

                                                                          3
DEMOGRAPHIC CHANGE IN THE NETHERLANDS

                                                       TABLE OF CONTENTS

Demographic change in the Netherlands: Strategies for resilient labour markets ............................... 5

International trends show population growth deceleration together with ageing .................................. 8

Labour markets need to be re-positioned towards sustainable and resilient development ................. 11
    Addressing population stagnation at the local level ................................................................................ 11
    Developing inter-generational engagement to stimulate ageing local labour markets ........................... 13
    Addressing labour force decline in peripheral areas ............................................................................... 18

Smart strategies in peripheral regions need to continue through co-ordinated national-local policy
responses...................................................................................................................................................... 21
    Develop inter-generational responses to labour market challenges ........................................................ 23
    Strengthen national-local alignment and co-operative frameworks to create a dynamic and responsive
    labour market ........................................................................................................................................... 27
    Invest in place-based development and foster resilient communities ....................................................... 32

The Netherlands’ Dashboard on demographic change ........................................................................... 36

Summary of the main recommendations for The Netherlands: Achieving growth that is inter-
generational, co-operative, and place-based ............................................................................................ 41

4
DEMOGRAPHIC CHANGE IN THE NETHERLANDS

DEMOGRAPHIC CHANGE IN THE NETHERLANDS: STRATEGIES FOR
             RESILIENT LABOUR MARKETS

     This document summarises the findings from the Netherlands case study for the international project
on Local scenarios of demographic change: The impact on local labour markets. The project is conducted
by the OECD Local Economic and Employment Development (LEED) Programme, in partnership with the
Ministry of the Interior and Kingdom Relations and the provinces of Groningen/Drenthe, Zeeland and
Limburg (Figure 1), with the support of the European Commission DG Employment, Social Affairs and
Inclusion. Results indicate that the Netherlands’ response to demographic change is well advanced, but
additional actions can be undertaken, particularly regarding the shrinking and ageing society, and
especially within the context of regional and local labour markets.

                          Figure 1 Map of the Netherlands and the study regions

                                                                     Groningen

                                                                     Drenthe

                          Zeeland                                              Germany

                                                         Limburg

                                    Belgium

                                                                                                      5
DEMOGRAPHIC CHANGE IN THE NETHERLANDS

     Strategic approaches to demographic challenges require a re-positioning of labour markets towards
sustainable and resilience promoting strategies. A "whole-of- government"1 approach is needed to design
economic development policies, population and health policies, labour market policies and skills and
education policies targeting sustainable and resilient communities2. A holistic development approach that
integrates economic growth, health, education, environment and other needs can produce higher quality
outputs than stand-alone projects operating on a narrow spectrum of deliverables. The issues involved
require converging strategies across policy fields, as can be seen in Figure 2.

                              Figure 2 Policies for sustainable and resilient communities

                                                    Population and Health

                                                            Eroded tax-base
                                                    Fertility
                                                                          Migration
                                                    Longevity
                                                                      Marginalisation
                    Labour Market                   Mortality                             New Sources of Growth
                                                                Ageing                               Work
                   Youth and long-
                          term                                                                     ecologies
                   unemployment                                                                    approach
                                  Ageing                Sustainable                       Silver             White
             Employability      workforce              and Resilient                    economy             economy
                                                       Communities
                 Job         Retention &                                                    Entrepreneurship
             inequalities     attraction                                                     and innovation
                              strategies                Skills Ecosystem
                                                                                                   Green
                     Skills mismatch                                                               growth
                                                             Skills
                                                            supply

                                                   Skills                 Skills
                                                  demand               utilisation

                                                      Skills           Education
                                                   development            and
                                                                        training

                                               Source: Based on OECD, 2012

1
  A whole-of-government approach is defined as “one where a government actively uses formal and/or informal networks across
the different agencies within that government to co-ordinate the design and implementation of the range of interventions that the
government’s agencies will be making in order to increase the effectiveness of those interventions in achieving the desired
objectives” (OECD, 2006, Whole Government Approach to Fragile States, OECD publishing).
2                            for
  Sustainable development        local economic development underlines the need to adopt a long-term approach that considers
economic, social and environmental issues at the same time. See Martinez-Fernandez, C., Kubo, N., Noya, A., and Weyman, T.
(2012) Demographic change and local development: Shrinkage, regeneration and social dynamics, OECD Publishing, DOI:
10.1787/9789264180468-en.

6
DEMOGRAPHIC CHANGE IN THE NETHERLANDS

      The Netherlands could re-position its communities to transition their responses to labour market
challenges to be more inter-generational3, thus providing a smarter co-operative framework, with a
dynamic and responsive local labour market, which fosters place-based development in order to achieve
resilient communities (see Table 1).

                   Table 1: A systematic approach to re-positioning labour markets in transition

Intergenerational responses           1. Re-position older workers (strategies for life-long learning, and
to labour market challenges              intergenerational skills transformation)
                                      2. Integration of the unemployed and lower-skilled (strategies for job carving
                                         and training)

Co-operative frameworks               3. Connection between education and the labour market (strategies to address
towards a dynamic &                      the mismatch in the labour market, interactions between schools and
responsive labour market                 businesses, educational choices for the young, skills ecosystems)
                                      4. Promotion of entrepreneurship and workplace flexibility (strategies for
                                         incubators and entrepreneurship education, skills development in SMEs)

Place-based development for           5. Identification of new sources of growth (strategies for work-ecologies and
resilient communities                    uniqueness of place)
                                      6. Promotion of healthy communities (strategies for good places to live and
                                         social capital development)

3
  Inter-generational approaches in the labour market refer to activities that connect young and mature workers; both in the
workplace and in learning environments. The need for regular skills updating underlines the need for intergenerational learning.
Mature workers learning from young workers and vice versa in a formal or informal manner, is a form of intergenerational
solidarity in the workplace, which is highly relevant in dealing with new skill requirements.

                                                                                                                              7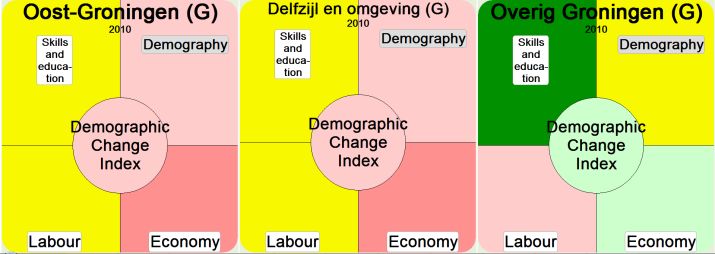
DEMOGRAPHIC CHANGE IN THE NETHERLANDS

          INTERNATIONAL TRENDS SHOW POPULATION GROWTH
               DECELERATION TOGETHER WITH AGEING

     As clearly illustrated in Figure 3, the world’s population will surpass 9 billion people by 2050 and
exceed 10 billion by 21004; with most of the population growth occurring in developing countries, while
the more developed countries will experience population stagnation. The population growth rate is
decelerating in Asia, while Europe and Latin America and much of the Caribbean will experience negative
population growth during 2050-2100 (Figure 4).

                 Figure 3 Estimated and projected (median variant) population totals (thousands)
    12 000 000                                                                                               100 000

                                                                                                             90 000
    10 000 000
                                                                                                             80 000

                                                                                                             70 000
     8 000 000
                                                                                                             60 000

     6 000 000                                                                                               50 000

                                                                                                             40 000
                         World
     4 000 000
                                                                                                             30 000
                                 Less developed regions
                                                                              Netherlands (secondary axis)   20 000
     2 000 000
                                                                                                             10 000
                        More developed regions
             0                                                                                               0
                 1950
                 1955
                 1960
                 1965
                 1970
                 1975
                 1980
                 1985
                 1990
                 1995
                 2000
                 2005
                 2010
                 2015
                 2020
                 2025
                 2030
                 2035
                 2040
                 2045
                 2050
                 2055
                 2060
                 2065
                 2070
                 2075
                 2080
                 2085
                 2090
                 2095
                 2100

                                         Source: based on data from UN (2011)

     Population ageing is becoming a worldwide phenomenon; the number of persons aged 60 or over is
expected to triple globally by 2100. According to Figure 5, in 2011 the world’s more developed regions
had 22% of the over 60 population and by 2050, they are projected to have 32%, then 33% by 2100.
Developing countries will experience rapid population ageing too, in 2011 only 9% were over 60, by 2050
this will more than double to 20%, and will reach 30% by 21005. Population ageing will have a number of
economic, social and political impacts that will need co-ordinated actions across different policy fields.6

4
  UN (2011) World Population Prospects, The 2010 Revision: Highlights and Advance Tables,
http://esa.un.org/unpd/wpp/Documentation/pdf/WPP2010_Highlights.pdf.
5
     UN (2011) World Population Prospects, The 2010 Revision: Highlights and                           Advanced   Tables,
http://esa.un.org/unpd/wpp/Documentation/pdf/WPP2010_Highlights.pdf.
6
  United Nations (2009), World Population Ageing 2009. New York: United Nations Population Division.

8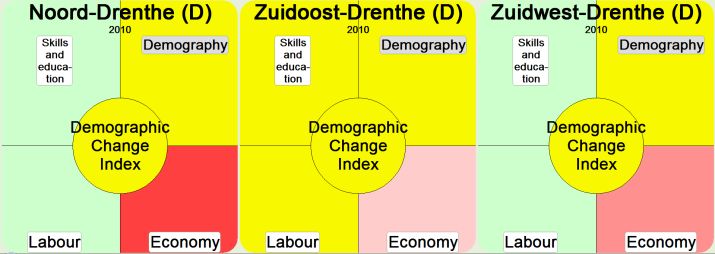
DEMOGRAPHIC CHANGE IN THE NETHERLANDS

                        Impacts of population dynamics (quantity and composition) on policy fields 7

Economically - economic growth, savings, investment, consumption, labour markets, pensions, taxation and
intergenerational transfers.
Socially – family composition and living arrangements, housing demand, migration trends, epidemiology and the
need for healthcare services.

Politically - shape voting patterns and political representation.

         Figure 4 Estimated and projected (median variant) population growth rates (%) and totals (millions)

      10000                                                                                                                                           2.5

       8000                                                                                                                                           2

       6000                                                                                                                                           1.5

       4000                                                                                                                                           1

       2000                                                                                                                                           0.5

          0                                                                                                                                           0
                World       More           Less          Africa         Asia       Europe    Latin America Northern          Oceania    Netherlands
                          developed     developed                                               and the    America
                           regions       regions                                               Caribbean
                           Average annual rates of change of the population (%)    Estimate and projected (median variant) population
                                     and projection (median variant)                                totals (millions)
       -2000                                                                                                                                          -0.5
                           1950-1980      1980-2011     2011-2050      2050-2100   1950     by 1980    by 2011     by 2050    by 2100

                                                Source: based on data from UN (2011)
                                        Note: Netherlands – statistics for 2010 (instead of 2011)

7
    See footnote 4.

                                                                                                                                                             9
DEMOGRAPHIC CHANGE IN THE NETHERLANDS
Figure 5 Population 60+ for 2011, 2050 and 2100 (median variant)
45
40
35
30
25
20
15
10
5
0
2011 2050 2100
Source: based on data from UN (2011)
10DEMOGRAPHIC CHANGE IN THE NETHERLANDS
LABOUR MARKETS NEED TO BE RE-POSITIONED TOWARDS
SUSTAINABLE AND RESILIENT DEVELOPMENT
Addressing population stagnation at the local level
The Netherlands must continue addressing demographic change. Although the population is growing,
the population growth rate, even if fluctuating considerably, has been declining since the 1960s (Figure 6).
The cause of the fluctuating and declining population growth can be linked to natural increase from births
(which is in steady decline) and a fluctuating decline in net migration (immigration minus emigration)
(Figure 7). It can be concluded from this that the population growth potential of the Netherlands is greatly
dependent on immigration from other countries, which could have significant consequences for skills
levels and the labour market environment.
Figure 6 The Netherlands total population and growth rate
18000000 16
16000000 14
14000000 12
12000000
10
number
10000000
8
8000000
6
6000000
4000000 4
2000000 2
0 0
1960
1963
1966
1981
1984
1987
1990
1993
2008
2011
1969
1972
1975
1978
1996
1999
2002
2005
Population totals Total population growth, rate
Source: Based on Netherlands Statline database
11DEMOGRAPHIC CHANGE IN THE NETHERLANDS
Figure 7 The Netherlands population growth, migration and natural increase
200000
150000
100000
50000
0
-50000
Total population growth Net Migration (Immigration minus Emigration) Natural increase
Source: Based on Netherlands Statline database
Total population numbers have increased by 25.5% from 1972 to 2011, and this increase is expected
to continue until it reaches 34% (relative to 1972 levels) in 2035 and then stabilise at 17.8 million.
However, regional differences are significant. At a provincial level, population numbers since the year
2000 have started to decline in Limburg, whereas Zeeland and Groningen show stable population figures
(Figure 8). At the NUTS III (local) level, those areas located at the periphery of the provinces are facing
the sharpest population decline (Figure 9), due to a combination of a stronger ageing process and a
negative migration balance, meaning that young people who cannot find jobs (or education) move to areas
where there are more opportunities. Continued and co-ordinated policy focus is needed in these peripheral
local areas, to strengthen the re-positioning of labour markets to areas in which the population decline is
taking place and encourage personal networks that will lead to development of resilient communities.
Figure 8 Total population (registered from 1972-2011, prognoses from 2012-2040, 1972=100)
12DEMOGRAPHIC CHANGE IN THE NETHERLANDS
Figure 9 Total population NUTS III regions (registered from 1972-2011, prognoses from 2012-2040, 1972=100)
140.0
130.0
120.0
110.0
100.0
90.0
80.0
70.0
1975
2026
1972
1978
1981
1984
1987
1990
1993
1996
1999
2002
2005
2008
2011
2014
2017
2020
2023
2029
2032
2035
2038
Oost-Groningen Delfzijl en omgeving Zuidoost-Drenthe
Zeeuwsch-Vlaanderen Noord-Limburg Midden-Limburg
Zuid-Limburg
Developing inter-generational engagement to stimulate ageing local labour markets
Many demographic trends in the regions are explained by the ageing of the population. All four
provinces have a one to three year higher median age than the Netherlands as a whole (40 years).
Differences are even more significant at the NUTS III (local) level, with Zeeuws Vlaanderen having a
median age of 46, and Zuid-Limburg and Delfzijl a median age of 45.
Figure 10 clearly illustrates significant changes in the Netherlands’ age structure: declining share of
youth (younger than 20 years); growth and then decline in the share of the 20 to 40 age cohort; significant
increase in the 40 to 65 age cohort; and gradual increases in the 65 to 80 and 80 years or older cohorts. As
a result, the workforce in the near future will be older, which will considerably change the situation in the
labour market, increasing the number of older workers and reducing the number of new entrants into the
labour market.
13DEMOGRAPHIC CHANGE IN THE NETHERLANDS
Figure 10 The Netherlands age structure since 1960
100%
90%
80%
70%
60%
50%
40%
30%
20%
10%
0%
1960
1962
1964
1966
1968
1970
1972
1974
1976
1978
1980
1982
1984
1986
1988
1990
1992
1994
1996
1998
2000
2002
2004
2006
2008
2010
Younger than 20 years 20 to 40 years 40 to 65 years 65 to 80 years 80 years or older
Source: Based on Netherlands Statline database
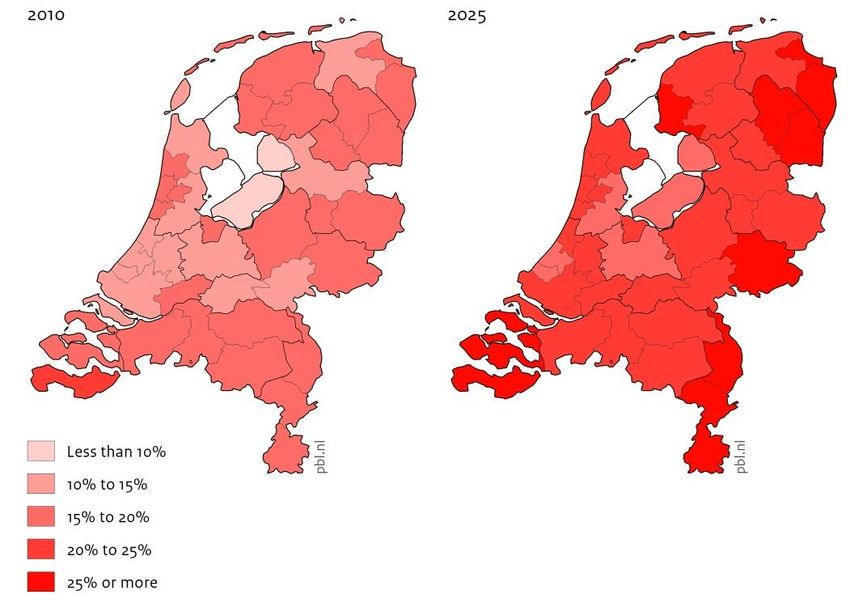
Nationally, the 65+ population's share has increased from 10% to 15% between 1972 and 2011. Some
NUTS III (local) regions are already close to 20%: Zeeuws-Vlaanderen; and Zuid-Limburg (Figure 11).
Furthermore, in the coming years, the share of people aged 65 and over will continue to increase (Figure
12). Older workers (55-64) will constitute an increasing part of the labour force, increasing the
employment rates of older people is thus a necessity in order to compensate for the lower number of young
people entering the labour market. Developing inter-generational activities that connect the young with the
old is a resilient and feasible strategy for local prosperity. The inter-generational approach can be useful in
narrowing the gap between different age groups and in helping disadvantaged people to be active in the
labour market. This approach is fundamental to increasing civic participation, building communities,
improving health and creating better employment opportunities, particularly in shrinking labour markets8.
8
Martinez-Fernandez, C., Kubo, N., Noya, A., and Weyman, T. (2012) Demographic change and local development: Shrinkage,
regeneration and social dynamics, OECD Publishing, DOI: 10.1787/9789264180468-en.
14DEMOGRAPHIC CHANGE IN THE NETHERLANDS
Figure 11 Population 65+ as a ratio of total population
25.0%
20.0%
15.0%
10.0%
5.0%
0.0%
1972 2011
Figure 12 Share of the population aged 65 and over, per COROP area (NUTS III)
Source: CBS/PBL 20119; De Jong and Van Duin 2011, p.1110
9
PBL and CBS (2011), Regionale bevolkings- en huishoudensprognoses 2011-2040 [in Dutch] [Regional population and
household projections 2011-2040], website www.regionalebevolkingsprognoses.nl, The Hague: PBL Netherlands Environmental
Assessment Agency/Statistics Netherlands.
10
Jong, A. de and C. van Duin (2011), Regional population and household projections, 2011-2040 marked regional differences
[available on website http://www.pbl.nl/en/], The Hague: PBL.
15DEMOGRAPHIC CHANGE IN THE NETHERLANDS
Future shifts can be illustrated by the old age dependency ratio (population aged 65 and over
compared to population 15 to 64 years old). This indicator shows how demographic changes may influence
pension systems in the future. According to Eurostat data, from 1990, the indicator for the Netherlands has
been lower than for EU27. In 2010, the Netherlands’ ratio was 22.82 persons aged 65 and over compared
to 100 persons aged 15 to 64 years, and for EU27 it was 25.92. But it is forecast that the indicator will be
higher for the Netherlands than for EU27 by 2025, when it will reach 35.15 and 34.57 respectively.
However, as illustrated in Figure 13, the Netherlands is predicted to dip below the EU27 ratio again by the
year 2040.
Figure 13 Old age dependency ratio (population 65 and over compared to population 15 to 64 years)
60
50
40
30
20
10
0
EU (27 countries) Netherlands
Source: Based on Eurostat data
Increasing participation of older workers in the labour force is intertwined with increasing health and
active ageing. According to the Active Ageing Index11, overall the Netherlands ranks 5th (from the 27
countries in the European Union), below Sweden, Denmark, Ireland and the UK. Within specific
component indices the Netherlands ranked 8th for employment, 6th for social participation, 3rd for
independent living and capacity for active ageing. However, the Netherlands’ score was 38.9% of the
theoretical potential for full active ageing engagement of people working or providing skilled inputs, which
would make it possible to achieve an improved economy, with increased productivity and lower health
care costs (Figure 14). Thus, policy efforts need to be directed towards this end, in areas such as workplace
activation, volunteerism, and long-life learning.
11
European Commission and United Nations Economic Commission for Europe (2013) Policy brief: Introducing the Active
Ageing Index, March 2013. According to the document, in order to maintain “… prosperity and social cohesion, mobilising all
available human resources is crucial. Policies need to ensure that, as people grow older, they can continue contributing to the
economy and society and be able to look after themselves for as long as possible”.
16DEMOGRAPHIC CHANGE IN THE NETHERLANDS
Active Ageing Index
The Active Ageing Index (AAI) was developed by the European Centre for Social Welfare Policy and Research
in Vienna. The AAI was constructed from four different domains, with each domain presenting a different aspect of
active and healthy ageing. The first three domains refer to the actual experiences of active ageing (employment,
unpaid work/social participation, independent living), while the fourth domain captures the capacity for active ageing
as determined by individual characteristics and environmental factors. The AAI is a composite index, which means
that a number of individual indicators contribute to each of the domains – in total there are 22 individual indicators
across four domains. Each individual indicator can be positively interpreted, meaning that the higher the indicator
value, the better the active ageing outcome. For example, the more care older people provide for others, the better
are their active ageing outcomes. Indicators are weighted individually and then combined within the four domains,
thus creating the domain-specific indices. The overall Active Ageing Index is then the weighted average of the four
domain-specific indices. The results of the AAI are presented as a ranking of countries by the scores achieved in the
overall AAI and in the domain-specific indices. The rank order of countries differs across domains. The rank of each
country in the AAI is determined by the score it has obtained in the four domains and in the overall index. Individual
country scores show the extent to which its older people's potential is used and the extent to which they are enabled
to participate in the economy and society. The theoretical maximum for the index is assumed to be 100, currently
none of the countries is coming anywhere near this maximum. In fact, were they to be near this maximum, it would
imply a much higher life expectancy and an unrealistically high participation of older people in the economy and
society. Thus, the index is constructed in such a way that not even the best-performing countries will hit the ceiling of
100. As a result of this methodological choice, current top performers like Sweden or Denmark are only around the
40-mark. Improvements are possible even for the top performers, but obviously, 100 would not be a realistic present-
day goal.
Source: European Commission and United Nations Economic Commission for Europe (2013) 12
17DEMOGRAPHIC CHANGE IN THE NETHERLANDS
Figure 14 AAI results across EU27 countries
Sweden 44.0
Denmark 40.2
Ireland 39.4
United Kingdom 39.2
Netherlands 38.9
Finland 38.8
Cyprus 36.3
Luxembourg 35.1
Germany 35.0
Austria 34.9
Czech Republic 34.3
Portugal 34.2
France 34.2
Belgium 33.5
Italy 33.3
Estonia 33.1
Spain 32.5
Lithuania 31.6
Malta 31.0
Romania 30.9
Slovenia 30.6
Latvia 30.2
Bulgaria 30.0
Greece 29.3
Hungary 28.2
Slovakia 27.7
Poland 27.3
0 20 40 60 80 100
Distance to achieving the theoretical
full active ageing potential
Source: European Commission and United Nations Economic Commission for Europe (2013) 12
Addressing labour force decline in peripheral areas
As illustrated in Figure 15, employment rates have risen considerably in the past 15 years in the
Netherlands from 58.7 in 1996 to 67.2 in 2011. In general, Zeeland is very close to the Dutch average of
67.2; Drenthe and Limburg are slightly lower (64.7); while Groningen is substantially behind (60). The
participating provinces show similar rising trends, but fluctuations throughout the years are different.
Groningen and Drenthe seem to show sharper fluctuations (positive and negative) than Zeeland and
Limburg. At the NUTS III (local) level, the picture is varied, revealing some shrinking areas, which have
the lowest participation rates (Oost-Groningen, Zuidoost Drenthe, Zuid-Limburg), while others approach
the national average (Zeeuws-Vlaanderen, Noord-Limburg). Delfzijl stands out because of the large
increase in its employment rate (Figure 16).
12
Commission and United Nations Economic Commission for Europe (2013) Policy Brief: Introducing the Active Ageing Index,
March 2013. The information in this document with reference to “Cyprus” relates to the southern part of the Island. There is no
single authority representing both Turkish and Greek Cypriot people on the Island. Turkey recognizes the Turkish Republic of
Northern Cyprus (TRNC). Until a lasting and equitable solution is found within the context of United Nations, Turkey shall
preserve its position concerning the “Cyprus” issue.
18DEMOGRAPHIC CHANGE IN THE NETHERLANDS
Figure 15 Employment rate (1996-2011)
Figure 16 Employment rate in NUTS III (local) regions (1996 and 2011)
70
65
60
55
50
1996
45
2011
Unemployment rates in the Netherlands have fluctuated between 3% and 6% from 1996 through to
2011. Groningen stands out because it has the highest unemployment rate (6.8% in 2010), followed by
Drenthe and Limburg, which were consistently above the national average - only Zeeland was below
(Figure 17).
Figure 17 Unemployment rate 1996-2011)
10.0%
8.0%
6.0%
4.0%
2.0%
0.0%
1996
1997
1998
1999
2000
2001
2002
2003
2004
2005
2006
2007
2008
2009
2010
Netherlands Groningen Drenthe
Zeeland Limburg
19DEMOGRAPHIC CHANGE IN THE NETHERLANDS
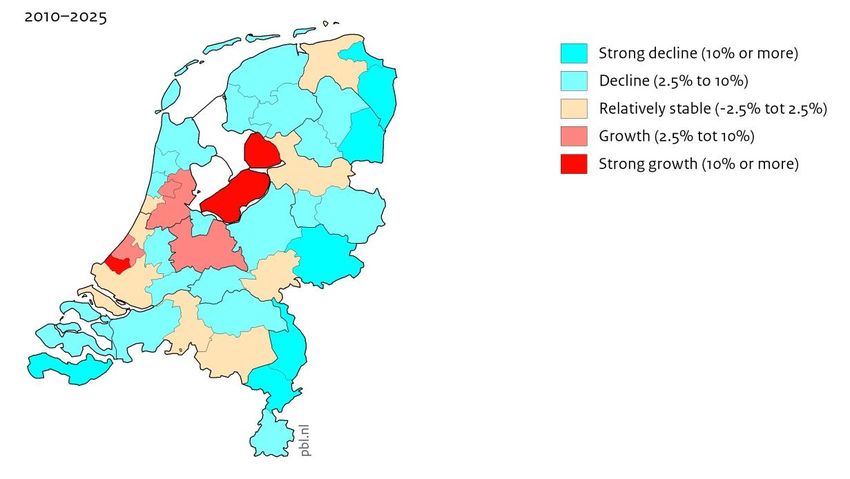
At a regional level, the decrease in the potential labour force is widespread.13 In 2010, 24 of the 40
NUTS III (local) areas experienced a decrease in the potential labour force.14 According to the regional
projections,15 the potential labour force is expected to decrease in almost all NUTS III areas before 2040.
Peripheral regions in particular, among which the case-study regions are included, are expected to face a
severe decline in the potential labour force. This applies in particular to the Delfzijl region, with an
expected decline of over 20%, and Zeeuws-Vlaanderen, east Groningen, south-east Drenthe, north
Limburg and mid–Limburg, with a decline of 10% to 20%. For south Limburg, the expected decline is just
below 10% up to the year 202516 (Figure 18).
Figure 18 Potential labour force levels (retirement age 65) per COROP area (NUTS III), 2010–2025
Source: PBL/CBS 201117; De Jong and Van Duin 2011, p.10.18
13
See footnote 11.
14
Verwest, F. and F. van Dam (2010), From combatting to managing: Demographic decline in the Netherlands. Policy strategies
for current and future shrinking regions [English translation of the summary of the Dutch report ‘Van bestrijden naar begeleiden:
demografische krimp in Nederland. Beleidsstrategieën voor huidige en toekomstige krimpregio’s is available on website
http://www.pbl.nl/en/], The Hague: PBL Netherlands Environmental Assessment Agency.
15
See footnote 10.
16
See footnote 9.
17
See footnote 10.
18
See footnote 11.
20DEMOGRAPHIC CHANGE IN THE NETHERLANDS
SMART STRATEGIES IN PERIPHERAL REGIONS NEED TO CONTINUE
THROUGH CO-ORDINATED NATIONAL-LOCAL POLICY RESPONSES
Demographic and economic decline is more likely to occur in peripheral regions with a mono-
functional economic structure. Central urban regions with a diverse economic structure and/or regions with
large sectors such as business services, industry or logistics, seem to be less vulnerable to demographic and
economic decline. Territorial population decline and population ageing has and will continue to have social
and economic consequences for national, regional and local labour markets. These include:
A decreasing potential labour force, due to the declining numbers of youth and stagnating
working age population, leading to a dwindling labour supply, a tight labour market and more
competition over workers, or even labour shortages19.
A decrease in industrial activity and business vitality as firms relocate or reduce activities from
shrinking regions to growing regions because of labour market issues.
A decrease in the population and the number of households implies a smaller local market and
may lead to an oversupply of services and housing. Such a surplus in housing may in turn result
in vacant properties.
Local services (e.g. infrastructure, transport, care) will become more expensive, as demand in
shrinking regions is expected to increase due to the ageing population, with a simultaneous
decrease in labour supply20 and eroded tax-base as the population declines.
Skills ecosystems weaken as the private sector and skilled labour force are reduced.
Strategic solutions must encompass both local and regional capacities to attract and generate jobs
within the national and economic contexts.
Demographic changes such as localised population decline, population ageing and migration are key
changes in the demography of the Netherlands and particularly in the study regions. A negative economic
situation may increase outward migration. A decrease in the labour force may also lead to a decrease in job
growth which, together with an ageing population, could prompt firms to leave shrinking areas and re-
establish in growing regions. For localised shrinkage and population ageing, efforts should also focus on
encouraging the existence of personal networks and personal attachment to the area.21
19
See footnote 14; Verwest, F. (2011), Demographic decline and local government strategies. A study of policy change in the
Netherlands, Delft: Eburon; and Euwals, R., K. Folmer, T. Knaap and M. Volkerink (2009), ‘Bevolkingskrimp en de
arbeidsmarkt’ [in Dutch] [‘Population decline and the labour market’], in: N. van Nimwegen and L. Heering (red) (2009a),
Bevolkingsvraagstukken in Nederland anno 2009. Van Groei naar krimp. Een demografische omslag in beeld [Population issues
in the Netherlands in 2009. From growth to shrinkage. A demographic change], Amsterdam: KNAW Press, pp.145-162.
20
See footnote 14.
21
Musterd, S. & A. Murie (2010) (Eds.) Making competitive cities. Oxford: Wiley Blackwell; and
Musterd, S. & Z. Kovacs (2013) (Eds) Place-Making and policies for competitive cities. Oxford: Wiley Blackwell.
21DEMOGRAPHIC CHANGE IN THE NETHERLANDS
These differences in demographic situations require a territorial analysis so that regional and local
perspectives on policy preparation, development and implementation are co-ordinated with national policy
efforts. The need is for holistic, but customised solutions, which respond to the specific needs of the local
labour market, individual company or person, based on national/regional/local partnerships. The national-
local axis requires systematic consideration for policy delivery. Due to socio-economic differences,
regional systemic and sustainable strategies should firstly be explored, then developed, implemented and
reviewed, focusing on the key aspects that make the region unique. Essential measures for a strategic
framework that provide the starting point and guidance for future projects and initiatives for each region
include:
a. Developing regional networks for local action in order to establish national and regional
provincial policy support for demographic transition, and to raise the awareness of local
authorities and businesses of the impact this will have on the labour market and economy.
b. Strategies that are place-based and highly contingent on context (instead of place neutral). These
should consider economic, social, political and institutional diversity in order to maximise both
the local and the aggregate potential for economic development.
c. A territorial approach that takes into account the demographic diversity of shrinking and
predicted potentially shrinking municipalities. Policies should anticipate and managed
demographic decline rather than combat it22. Municipalities, as well as the business community,
should manage with less people; support people and families who want to stay; and provide a
living environment that continues to appeal to existing (and potential new residents); in
particular, those in the 20 to 65 age group, in order to maintain (and potentially increase) the
labour force. Local communities should be made aware of not only the challenges, but also the
opportunities inherent in local shrinkage, through education campaigns and raising awareness of
innovative thinking and options.
Innovative awareness
23
‘Leve de Krimp!’ is a methodology based on a an alternate reality game. The game raises awareness of the
effects of depopulation on the daily lives of inhabitants in shrinking regions. Current inhabitants are the most
important stakeholders in shrinking regions. The game stimulates a sense of ownership and encourages people to
start taking action. The methodology is based on current wins and potential options in shrinking areas with smart
connections being made between streams, such as knowledge, energy, materials, services and money. The
collective intelligence of the community in a shrinking region is thus mobilised and ideas arise that are supported
from the bottom-up. In this way, the quality of life within a shrinking region can be kept high – or even made higher –
despite a quantitative decrease in inhabitants. A pilot was implemented by the game developers in the Achterhoek, a
region in the east of Holland, which is facing anticipated depopulation. In the pilot (played by three inhabitants over a
week and a half), players imagined themselves living in the year 2039. The game created awareness of the effects
of population shrinkage and the players thus became motivated to develop ideas and solutions. “Let’s Shrink!” (‘Leve
de Krimp!’) consists of a generic portion of the game, and a specific portion. The generic part is the framework of the
game, which can be applied to different regions that are experiencing depopulation and ageing. The specific portion
is the option to shape the content of the game to match the culture, mentality and relevant themes within a shrinking
region. For the next stage of the project, Studio Papaver has a partnership vision, in which a combination of partners
with a strong interest in the generic portion of the game (such as ministries and European programmes), are
combined with partners that have a strong interest in the specific part (such as local organisations and private
parties). The next step would be to undertake a larger pilot and then fine-tune the game and disburse it for real-world
application.
22
See footnote 14.
23
The title ‘Leve de Krimp!’ could be translated as ‘Let’s Shrink’, it has a positive tone to it. Most of the time the subject of
depopulation and shrinkage is labeled as something very negative. ‘Leve de Krimp!’ focuses on an increase of quality parallel to a
decrease of quantity.
22DEMOGRAPHIC CHANGE IN THE NETHERLANDS
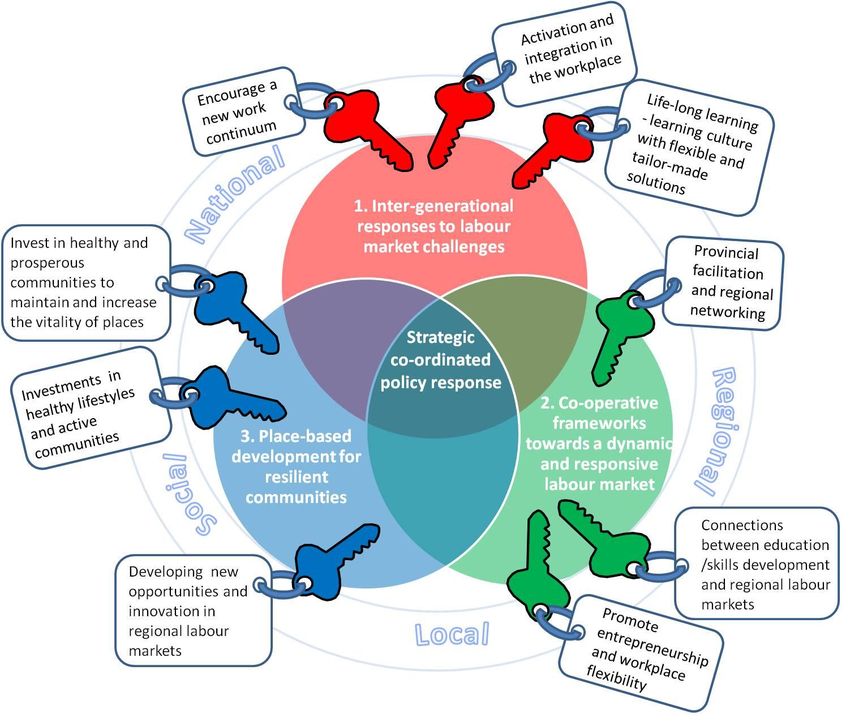
Figure 19 illustrates three interconnected policy themes that are vital for regional labour markets
attempting to manage a shrinking and ageing society: (1) intergenerational responses to labour market
challenges; (2) co-operative local frameworks towards a dynamic and responsive labour market; and (3)
place-based development strategies for resilient communities.
Figure 19 Netherlands’ demographic transition strategic areas
Develop inter-generational responses to labour market challenges
There is a tendency for older workers to retire relatively early, either due to attainment of retirement
age or a preference to stop working. The Dutch government is in the process of raising the retirement age
to 66 by 2018 and to 67 by 202124. Although this will increase labour participation among the older age
cohorts, it will not fully compensate for the expected decline in the potential labour force 25. Nevertheless,
the raising of the retirement age will place less pressure on national old age entitlements and encourage
longer and more active working lifestyles. Other reasons for older workers leaving the workplace are: the
24
VVD and PvdA (2012), Bruggen slaan. Regeerakkoord VVD-PvdA [in Dutch] ['Building Bridges', Tte new coalition agreement
between the VVD (People’s Party for Freedom and Democracy) and the PvdA (Labour Party)]. 29 October 2012, The Hague.
25
Commissie Bakker (2008), Naar een toekomst die werkt. Hoofdlijnen Advies Commissie Arbeidsparticipatie [in Dutch]
[Towards a future that works. Highlights of the Advisory Committee on Labour Participation], [commissioned by the Minister of
Social Affairs and Employment], Rotterdam: Commissie Arbeidsparticipatie; see Footnote 19; and ESPON and NIDI (2010),
DEMIFER Demographic and Migratory Flows affecting European Regions and Cities, Luxembourg: ESPON and NIDI.
23DEMOGRAPHIC CHANGE IN THE NETHERLANDS
increasing competition from younger and better educated people; the widespread use of technology; and
unsupportive work cultures and behaviours. Encouraging companies to implement age management
practices, such as flexible working hours, opportunities for older workers to update their skills, and better
health and/or safety programmes would encourage older workers to stay within the working environment.
Examples of specific measures are:
a. Encourage a new work continuum ranging from full-time to part-time within the employment
options for companies, governments and other sectors so as to extend the length and variety of
and engagement in working-life, leading to longer employment and increased productivity for
people across all sectors. This will extend the working age while allowing people to meet the
requirements of family, community and other engagements that in turn improve personal, family
and community health. Inter-generational engagement in changing working conditions needs to
also be taken into account.
Facilitating work after retirement
Governments can play a role in facilitating work after retirement by shaping labour markets, equal opportunity and
social protection policies, as well as tax and benefit systems. For example, in Sweden, employers are exempt from
payroll taxes for all employees over the age of 65. A pilot scheme in Italy offered workers who were about to retire the
possibility to postpone retirement by three years, and add employer and employee social security contributions to
their income. Companies can also play a role, with measures aimed at attracting and retaining pensioners. Examples
include the Ship Design and Research Centre in Poland, where 7% of its employees are retirees. Most of these
people have expertise that the company does not want to lose. As pensions in Poland can be low in comparison to
the increasing cost of living, work has become a necessity for many, even for the relatively well-off. A recent national
law, however, requires pensioners to resign and re-apply for their jobs in order to continue receiving a pension in
addition to their working income. For some this might mean the end of their employment. Some companies also
specifically recruit older workers. One example is Seniorjobbarna in Sweden, which conducts agency work in areas
such as crafts, cleaning and gardening. Another is the Austrian Senior Expert Pool, which provides consultancy
services, mainly in management or highly specialised technical areas. In both cases, the option of working part-time
and with flexible working hours was considered crucial in attracting and retaining retirees.
26
Source: European Foundation for the Improvement of Living and Working Conditions (2011)
27
The Senior Enterprise project aims to raise awareness about how the over 50s can engage with enterprise and
the benefits that can flow from that engagement. This could be through: starting a business, either alone or with
others; acquiring or investing in a business; advising an entrepreneur; or supporting innovation within a business
owned by another. The four-year project (2010-14) is a response to the challenge of ageing populations in Europe.
The change in demographics is viewed in an almost entirely negative light by many people, but the promoters of
Senior Enterprise believe that the over 50 age group is a source of untapped potential that could be used to drive
forward Europe's national economies. It is intended that as a result of Senior Enterprise, more businesses will have
been started, more investment will have been made and more senior citizens will be active as advisors in new and
developing businesses. The project is being implemented by partners in Ireland, the UK and France, and nine
observers across north-western Europe.
28
PATRON Project
This Grundtvig project identifies and tests ways to transfer the skills that senior managers and entrepreneurs have
developed throughout their working lives, which have helped them to develop their creativity, competitiveness,
management and entrepreneurial capacities. Young entrepreneurs and managers in the participating countries and
regions benefit from this skills transfer. The methods and results are disseminated through the project’s website, so
they can be used in other participating regions.
For details: http://www.patronproject.org.
26
European Foundation for the Improvement of Living and Working Conditions (2011) Living longer, working better – Work after
retirement, http://www.eurofound.europa.eu/pubdocs/2011/663/en/1/EF11663EN.pdf.
27
http://europa.eu/ey2012/ey2012main.jsp?catId=975&langId=en&mode=initDetail&initiativeId=785&initLangId=en.
28
http://www.age-platform.eu/en/age-policy-work/solidarity-between-generations/best-practices/985-employment.
24DEMOGRAPHIC CHANGE IN THE NETHERLANDS
b. Identify and implement programmes to re-position workers (older and younger) who are un-(or
under) employed, especially lower skilled workers, in a concerted effort to encourage their
engagement and integration into the workplace (job carving29) and to connect older with younger
workers in the workplace. Incentives for continuing to work after age 60, as well as social
security systems that are designed to promote working late in life need to be developed, including
creating new roles within companies for workers in their later life.
Examples of strategies for engagement and integration into the workplace
Older Workers
In Germany, Perspective 50 Plus –Employment Pacts for Older Workers in the Regions, is part of the Initiative 50
30
Plus programme under the German Federal Ministry of Labour and Social Affairs . A programme of regional
employment pacts was launched to initiate and evaluate new strategies targeting older workers. Those supported are
predominantly among the low- or semi-skilled long-term unemployed. Job centres and local authorities find the
engagement and integration of older workers particularly difficult, and these regional employment pacts aim to involve
all appropriate regional and local actors in order to ensure more and better employment for this group. This form of
regional co-operation takes a cross-sector approach including: the labour market; employment; and social and health
policies. Regional pacts have deployed a wide range of different tools and instruments, including profiling,
assessments, special training measures, internships in companies, placement activities (adapted to the special needs
of the target group), wage subsidies for employers, time management, and publicity campaigns to raise awareness of
the challenges of demographic change.
Job Carving
31
Canada’s WORKink® is an online career development and employment portal for people with disabilities, however,
it can be applied to people who are unemployed or lower skilled. The portal describes the values of ‘Job Carving’ (or
creating roles), thus ‘structuring one or more jobs to make the best use of all employees’ skills and abilities’. To
implement successful job carving practices it is important to consider:
Changes in supervision requirements, such as more frequent instructions and guidance.
Alternative methods of conveying job instructions and adding new tasks.
Co-worker involvement and support.
Involvement of a community agency that works with employers to define roles, assist in training employees
and ironing out some of the initial details.
Job or work experience with defined time parameters.
Staying positive. Being prepared to deal with some co-workers’ negative perceptions about “make work”
projects and short-term limited opportunities.
32
Centrica: Age management policy (UK)
Centrica, a large-scale UK gas supplier, is attempting to encourage age diversity among its labour force by setting up
various measures such as the Age Action Group, which brings together the managers of various sections to see how
they as a group can best meet the needs of their ageing work force. With this in mind, they have developed an
awareness-raising programme on age management with flexible working conditions, a network of staff members with
family obligations, teams of different ages and potential for mentoring. They feel that the age mix helps staff members
in these groups with different ages to be mutually enriched.
29
Job carving is a term for customising job duties, such as creating specialist job roles that free up the time of specialist staff, or
swapping job duties to make the most of individual skills (http://base-uk.org/employers-recruitment-jobcarving).
30
http://www.forumpartnerships.zsi.at/attach/germany2.pdf.
31
WORKink® http://www.workink.com/articles.php?prID=2&pgID=8&art=1191.
32
http://www.age-platform.eu/en/age-policy-work/solidarity-between-generations/best-practices/985-employment.
25DEMOGRAPHIC CHANGE IN THE NETHERLANDS
c. Foster life-long learning to stimulate competitiveness, because economies now depend on value
that is added from the entire workforce. Regional firms need to invest in and improve their
learning culture, with flexible and tailor-made training and skills development programmes, not
only for new employees, but also for the older workforce. These programmes will promote
intergenerational workforce skill linkages, such as master-apprentice relationships. To increase
entrepreneurship or self-employment, educational programmes and business coaching should be
promoted wherein the skills of older people are transferred into new opportunities.
Examples of life-long learning
33
Genial - Generations at the workplace (Austria)
Demographic change will require enterprises to take more social responsibility and to open up resources for older
employees to stay in the market. In turn, this will require employees to invest in their own abilities, competencies, and
health. The Genial project of the Austrian provincial government supports these needs by assisting employees to
develop their work-life balance in order to maintain their health, but also tries to elicit more individual responsibility for
life-long learning through to an advanced age, staying open-minded about new technologies, and achieving a
different attitude towards ageing.
Genial is based on three pillars:
Public relations and awareness raising.
Specific projects realised in companies.
Network building to exchange experiences and develop new measures and instruments to support the
process.
The project also enables enterprises to better understand and deal with the human capital they can generate, while
enhancing the work experiences of older employees. The portfolio of activities is comprised of specific ageing
34
analyses, work ability indices, specific support for putting concrete activities in place, and more.
35
Within the framework of the project, the ‘Qualification Association Genial’ was founded, offering qualifications in
health and work-ability issues, seminars for managers (e.g. on modern, more motivationally oriented leadership), and
content related issues. Currently, the Qualification Association Genial has 7 member companies and has delivered
20 measures to approximately 230 people between March and July 2012.
36
Intelligent personnel management for logistics (IPL)
The pilot project IPL, funded by the Ministry of Labour, Social Integration and Welfare in North Rhine-
Westphalia and the European Social Fund, focuses on improving human resource management. Approaches to
implementing life-long learning as a component of demographically sensitive human resources work were generated
from the results of the IPL project.
Promoting vocational education and training:
Additional training for people with immigration backgrounds
Part-time training
Dual higher education study programmes in logistics.
33
Förschner, M., Partnership strategies for demographic change and ageing: Lessons learnt from a Study Visit to the Province of
Carinthia, Austria, in October 2012, OECD/LEED.
34
Genial: http://www.genial.or.at.
35
Qualification Associations are instruments of active labour market policy whereby one or more large companies, together with a
number of smaller companies within a region, engage in common qualification measures for their staff. Often companies within
the same field and geographical area have the same needs regarding qualifications, but it is too complicated and expensive for
single organisations to undertake alone. Qualifications Associations are supported by the AMS and the ESF, and receive higher
funding if they offer measures for older workers.
36
CEDEFOP (2012), Working and Ageing: The benefits of investing in an ageing workforce, Publications Office of the European
Union, Luxembourg.
26DEMOGRAPHIC CHANGE IN THE NETHERLANDS
Further qualification of older workers in warehouse management and professional driving.
Mixed-aged teams – designed to retain the knowledge and experience of older workers within companies,
to foster intergenerational learning, and to prevent the development of age-specific stigmas among
employees.
On-the-job training.
Job rotation schemes and mixed work.
Employee discussions on specific topics.
37
CVET, Germany
German citizens also participate in CVET (Continuous Vocational Education & Training), which includes among other
areas, re-training, qualification upgrades, second-chance opportunities for adults to complete school leaving
certificates, university entrance preparation, specialist training, foreign language instruction, and political education.
CVET in Germany then includes further unregulated in-house training, and further regulated training (for example,
the achievement of Meister and specialist or technician-level qualifications). These qualifications and programmes
are also associated with federal regulations for further training. However, state governments also play a role in
supporting continuing education that leads to qualifications. A constituent element of the institutionalised system of
CVET is provider plurality. This diversity of providers of CVET enables a variety of activities to be offered, which
cover a very large spectrum in terms of both content, and organisation and methodology.
Strengthen national-local alignment and co-operative frameworks to create a dynamic and
responsive labour market
Central governments are no longer the sole provider of territorial policies. Shrinking areas require a
coherent policy response from national and local governments to maintain existing jobs, generate new
employment, and protect vulnerable households. National, regional and local levels of government need to
align their various strategies in order to develop a consistent direction to meet development objectives,
leverage economies of scale, and reap the dividends of joint initiatives that share knowledge and reduce
operational overheads. Improving the policy coherence between national and local levels of government
(vertically) and co-ordination across different ministries (horizontally) can significantly increase the
effectiveness of programme delivery and the quality of services provided. The interests of the national and
local governments may not always be in harmony. National considerations, such as increased gross
domestic product or improved foreign exchange flows, may not always mesh with local government’s
concerns, such as local job creation, infrastructure development and social protection programmes.
National and local governments need to harmonise development objectives (e.g. enhanced rural access) to
avoid redundant programmes and heighten the effectiveness of programmes occupying shared geographic
and technical space (e.g. environment). Identification of conflicting national-local objectives (e.g. the
planning of rural roads for extractive industries rather than for improving market access of remote rural
producers) can result in a national-local dialogue that can lead to the development of an innovative win-
win situation38.
37
http://www.eqavet.eu/gns/what-we-do/implementing-the-framework/germany.aspx.
38
OECD (2011) Job-rich growth in Asia. Strategies for local employment, skills development and social protection. OECD-ILO.
27DEMOGRAPHIC CHANGE IN THE NETHERLANDS
Opportunities and challenges for effective harmonisation of national-local strategies39
There are significant opportunities for local strategies to play a deciding factor in the success of national social
and economic programmes. The core advantages of including a local dimension into a national strategy are manifold.
Key gains are:
greater flexibility to changing local opportunities and challenges
improved utilisation of scarce resources through better targeting
greater support for longer term, national strategic plans through leveraging quick wins.
The harmonisation of national-local strategies, and inter-ministerial co-operation can yield significant efficiency
dividends. A successful alignment and division of roles hinges, naturally, on the effective degree of decentralisation.
Several challenges may impede government synchronisation and policy alignment:
local government’s priorities do not coincide with national priorities
lack of experienced local managers or technical experts to address new local mandates
limited local financial space, which restricts local government’s ability to mobilise resources for their
initiatives.
Examples of specific measures are:
Encourage horizontal integration and vertical alignment of policies by promoting co-operative
frameworks and regional co-ordinated approaches, such as territorial employment pacts, which are
innovative networks that provide an institutional framework and commitment for regional networks
targeting employment strategies.
Territorial Employment Pacts40
Employment Pacts were initiated in 1997 by the European Commission, with a call for submission of projects under a
‘territorial employment pacts’ initiative to improve the employment situation. The local pacts for employment are
formed as multi-level partnerships between entities of key significance for local labour markets. Local governments
can play a leadership role in elaborating strategies for active intervention on the local labour market together with
local partners. The Barcelona Employment Pact, and the Austria Employment Pacts exemplify the different
dimensions of the governance arrangements for employment (often supported by structural funds).
Territorial Employment Pact in Vienna
The Employment Pact in Vienna began its formal co-operation in 1999 and is a partnership between the Municipality
of Vienna, the Public Employment Service, the Wiener Arbeitnehmer Innen Förderungsfonds - WAFF (Vienna Fund
for the Promotion of Employees), Federal Social Welfare Office – Vienna Regional Office, and interest representatives
of employers and employees (working group of the federal province). The objective is to support economic
development and the development of employment policies of Greater Vienna with forward-looking, concentrated
labour market interventions. The core function of the Pact is to co-ordinate co-operation and to harmonise the
strategic and operative labour market and employment policies in Vienna. Its functions are facilitation of co-ordination,
collaboration and co-decision in order to improve employment. These activities are based on joint programme
development and on financial co-ordination of the three key partners: the Vienna Fund for the Promotion of
Employees; the Public Employment Service; and the Federal Social Welfare Office. The Pact has two special focus
areas: youth, who require support in the transition from school to training; and people at risk of being permanently
excluded from professional life. The labour market and employment policies are linked to other policy areas (social,
economic and education). The Pact also has a trans-national co-operation project with Bratislava.
39
See footnote 38.
40
OECD (2011). More and better jobs: Employment Pacts' experience and business strategies. OECD-LEED Seminar, Barcelona;
and Martinez-Fernandez, M., Chorazy, P., Weyman, T., and Gawron, M. (2011) The territorialdDimension of the European Social
Fund: A local approach for local jobs, OECD, Paris.
28You can also read