Castletownbere An Economic Survey to Determine the Level of Seafood Activity and Establish its Economic Importance for the Region - Bord Iascaigh ...
←
→
Page content transcription
If your browser does not render page correctly, please read the page content below
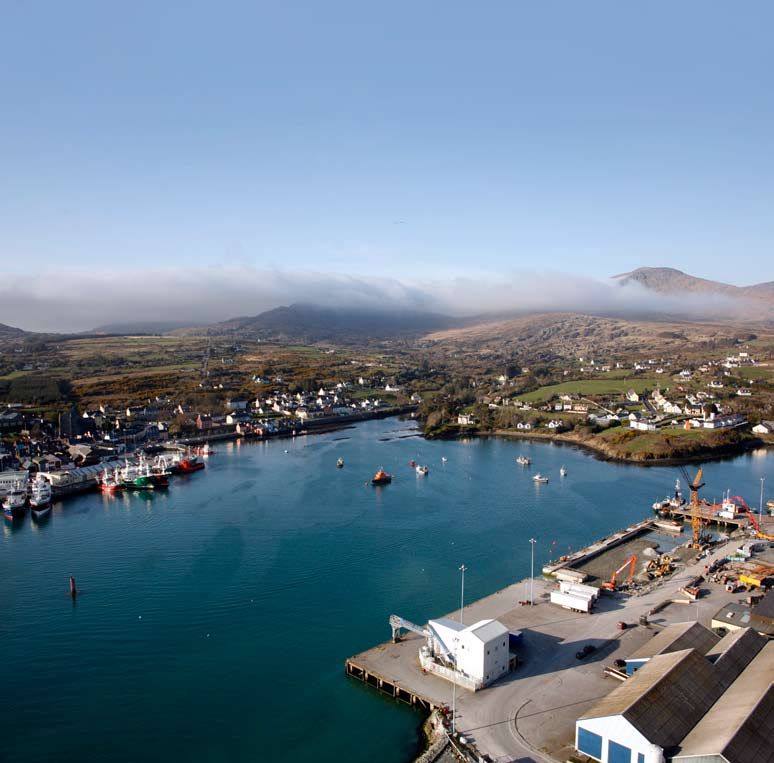
Castletownbere An Economic Survey to Determine the Level of Seafood Activity and Establish its Economic Importance for the Region
Cover image courtesy of John Eagle
i

Castletownbere
 An Economic Survey to Determine the Level of Seafood Activity
      and Establish its Economic Importance for the Region

This report is the result of a collaborative action by local stakeholders to document and analyse the level of
seafood activity in the geographical region centred on Castletownbere, Co. Cork, Ireland. The input of community
stakeholders facilitated by Eibhlín O’Sullivan (Irish South and West Fishermen’s Producer Organisation (ISWFPO)
with the assistance of Frank Fleming (consultant to the ISWFPO), and co-ordinated by Rod Cappell (Poseidon
Aquatic Resource Management Ltd) formed the basis of the quantitative and qualitative information presented.
The provision of fisheries information and engagement with the process by State agencies is acknowledged
particularly that of Bord Iascaigh Mhara (The Irish Sea Fisheries Board) who provided the support necessary to
achieve the objectives of this study.

All rights reserved. No part of this publication may be reproduced, stored in a retrieval system or transmitted
in any form or by any means, electronic, mechanical, photocopying or otherwise, without the prior permission
of the copyright owner. Applications for such permission, with a statement of the purpose and extent of the
reproduction, should be addressed to:

The Fisheries Development Manager,
Fisheries Development Division,
Bord Iascaigh Mhara,
P.O. Box 12,
Crofton Road,
Dun Laoghaire,
Co. Dublin,
Ireland.
ii
iii

Table of Contents
Executive Summary                                                                 vii

1   Introduction                                                                   1
    1.1 General Description                                                        1
    1.2 Location                                                                   1
    1.3 Key Geographical Characteristics                                           1

2   Demographic Aspects                                                            2
    2.1 Population and Population Age Structure                                    2
    2.2 Ethnicity and Migration                                                    3

3   Economic Aspects                                                               5
    3.1 Importance Of Economic Activities                                          5
         3.1.1 Tourism                                                             5
         3.1.2 Other Economic Activities                                           6
    3.2 Employment and Unemployment                                                9
    3.3 Infrastructure                                                            11
    3.4 Local Development Plans                                                   12

4   Fisheries And Aquaculture Sub-Sector                                          14
    4.1 Details of the Local Fishing Fleets                                       16
    4.2 Key Fish Stocks                                                           20
    4.3 Fisheries Infrastructure                                                  22
    4.4 Details of the Local Catching Sector                                      23
    4.5 Details of the Local Processing Sector                                    27
    4.6 Details of the Local Aquaculture Sector                                   29
    4.7 Details of the Local Ancillary Sector                                     29

5   Governance                                                                    32
    5.1 Key Local Institutions                                                    32
         5.1.1 Castletownbere Fishermen’s Co-Operative Society Ltd                32
         5.1.2 Irish South and West Fish Producer’s Organisation                  32
         5.1.3 Castletownbere Community Development Association                   32
         5.1.4 West Cork Development Partnership and West Cork Enterprise Board   32
         5.1.5 Department of Agriculture, Food and the Marine                     32
         5.1.6 Bord Iascaigh Mhara (Irish Sea Fisheries Board)                    33
         5.1.7 Bord Bia (Irish Food Board)                                        33
         5.1.8 Sea Fisheries Protection Authority                                 33
         5.1.9 Responsible Irish Fish                                             33
    5.2 Public Intervention                                                       34

6   Stakeholder Analysis                                                          35
iv
7 Qualitative Interpretation And Analysis 36
7.1 Key Events and Drivers of Trends 36
7.2 Adaptation 37
7.3 Barriers to Adaptation: 37
7.4 Role of Public Sector Support: 38
7.5 Future Development 39
7.6 Conclusion 40
8 The Way Forward 41
8.1 Catching Sector 41
8.2 Processing Sector 42
8.3 Aquaculture Sector 42
8.4 Ancillary Sector 43
8.5 Other Economic Sectors 43
8.6 Driving The Way Forward 43v
Tables
Table 1. Census records for the population of the district electoral divisions (DED) 2
around Castletownbere in 2006 and 2011.
Table 2. The number and type of vessel visiting Castletownbere from 2010 to 2012 (projected). 7
Table 3. The seasonality of economic activity by sector in Castletownbere. 8
Table 4. The population of Castletownbere broken down by employment status in 1996, 10
2002 and 2006.
Table 5. The economic multipliers on turnover and employment associated with the local and 14
foreign fleet landing into Castletownbere.
Table 6. The characteristics of the Fleet segments landing into Castletownbere in 2010. 17
Table 7. Management characteristics of the fish stocks exploited by the Castletownbere fleet. 20
Table 8. Trends in Irish quota from 2004 to 2011 for species of importance to the 21
Castletownbere fleet.
Table 9. The Volume (t) and Value (€) of catches landed from Irish registered vessels, non Irish 24
registered vessels and all vessels landing into Castletownbere from 2003 to 2010.
Table 10. Landings (t) by species made by Irish registered vessels to Castletownbere 25
from 2003 to 2010.
Table 11. Price trends for selected species at Castletownbere from 2003 to 2010. 26
Table 12. The main markets and product forms for species landed into Castletownbere. 27
Table 13. Trends in the operational characteristics of companies in the processing subsector in 28
Castletownbere between 2003 and 2010.
Table 14. The trend in processing turnover of companies in the processing subsector by 28
species group and employment from 2003 to 2010.
Table 15. The main species processed by key processors in Castletownbere. 28
Table 16. Aquaculture production in the wider Beara Peninsula area from 2003 to2009. 29
Table 17. Annual turnover (€ ‘000) of businesses in the ancillary subsector of Castletownbere 30
from 2003 to 2010.
Table 18. Employment (Full Time Equivalents) in the ancillary subsector of Castletownbere 31
from 2003 to 2010.
Table 19. Public intervention in the Castletownbere area. 34
Table 20. Stakeholder details and contacts. 35vi
Figures
Figure 1. The location of Castletownbere, West Cork, Ireland. 1
Figure 2. The population of Killaconenagh DED (containing Castletownbere) from 1990 to 2010. 3
Figure 3. The age structure of Killaconenagh DED (containing Castletownbere) recorded by 3
census in 1996, 2002 and 2006.
Figure 4. Immigration, Emigration and Net Migration in Ireland from 1987 to 2008. 4
Figure 5. The economic value (Turnover; €Million), by sector, contributed to the economy of 7
Castletownbere from 2003 to 2010.
Figure 6. The contribution to the total turnover made by different sectors to the economy of 8
Castletownbere in 2010 by value (€Million) and proportion (%).
Figure 7. The unemployment rate recorded in Castletownbere (Killaconenagh DED) between 9
1996 and 2011 (Estimated).
Figure 8. Full time employment by sector in Castletownbere between 2003 and 2010. 10
Figure 9. Fisheries sector employment dependency in Castletownbere from 2003 to 2010. 11
Figure 10. Castletownbere Local Area Plan, 2005. 13
Figure 11. Irish and foreign vessel landings of key whitefish species and Nephrops in 2010. 15
Figure 12. Trends in the size of fleet segments in Castletownbere from 2003 to 2010. 18
Figure 13. Engine power (kW) characteristics by segment of the Castletownbere fleet from 18
2003 to 2010.
Figure 14. Gross tonnage (GT) characteristics by segment of the Castletownbere fleet from 19
2003 to 2010.
Figure 15. Employment (Full Time Equivalents, FTE) characteristics by segment of the 19
Castletownbere fleet from 2003 to 2010.
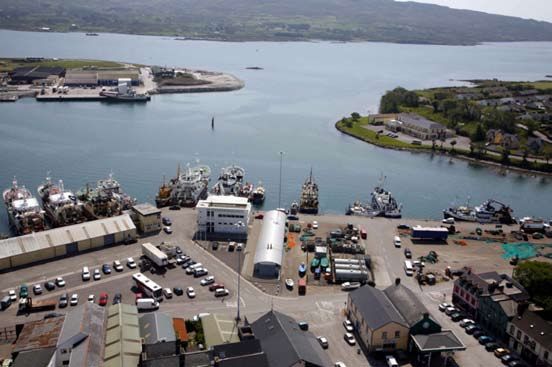
Figure 16. Castletownbere Harbour and approaches. 22
Figure 17. Trends in the volume (t) of landings to Castletownbere from 2003 to 2010. 25
Figure 18. Trends in the value (m€) of landings to Castletownbere from 2003 to 2010. 26
Figure 19. The contribution of ancillary sub-sector groups to the total turnover and estimated 30
Gross Value Added (GVA) of the entire sub-sector in 2010.Executive Summary vii Executive Summary Castletownbere is the primary urban economic and social centre on the Beara Peninsula in South West Ireland. The harbour is one of the largest natural harbours in the world and is formed by Dinish Island to the south (hosting most of the fisheries infrastructure and processing activity) and the town of Castletownbere to the north. The town is set in a dramatic and largely unspoilt landscape that is an important asset in the development of secondary, tourist-based, economic activity. Castletownbere remains the largest whitefish port in Ireland, with vessels from Spain, Scotland and France making significant landings of whitefish to the port alongside the local fleet. The total landed value of fish was €50.4m in 2010, with around 11,000t with a value of €23m landed by Irish vessels targeting pelagic species, monkfish, other whitefish and tuna and 7,500t with a value of €27m from foreign vessels targeting monkfish, hake and megrim. There are also significant landings of shellfish (Nephrops, crab and lobster) by the Irish inshore fleet. Table i. The volume and value of landings by species group to Castletownbere from 2003 to 2010. Source: SFPA and local price information. VOLUME (tonnes) 2003 2004 2005 2006 2007 2008 2009 2010 Demersal 10,594 9,358 8,726 7,996 11,742 8,797 11,242 12,522 Pelagic 1,153 2,039 4,594 3,315 10,750 5,343 8,394 6,096 Shellfish 385 98 83 9 70 79 92 25 Total volume 12,132 11,495 13,402 11,319 22,563 14,219 19,729 18,643 VALUE (€million) 2003 2004 2005 2006 2007 2008 2009 2010 Total value (see Note 1) €22 - €33 €24 - €31 €25 - €30 €23 - €28 €43.55 €30 - €40 €38 - €49 €35 - €50 Note 1: Estimating the value of landings is complicated, in particular when landings from foreign vessels are included and definitive price data are not available. In the table above the values shown include those provided by the SFPA and those based on local price data provided by the stakeholders’ group raised to official landings. Throughout the remainder of this report only the latter are used. Economic aspects The population of Castletownbere is estimated to be between 900 and 1,000, and has shown a slight increase since the 2002 census (875). In terms of employment, 660 jobs representing 81% of the employment in Castletownbere, are related to fishing (Figure i). This remarkably high level of dependency, compared to 69% for Killybegs (which is also high), has been sustained in part due to a lack of alternative opportunities and the availability of employment in the fishing industry throughout the year as fish is landed from a wide range of fisheries. Castletownbere’s dependence on a single economic sector could be viewed as a weakness, but the diversity within fisheries enables it to better cope with fluctuations in individual fisheries. Key sectors of the west Cork regional economy, such as tourism and construction, have been particularly affected by the global economic crisis. These sectors, however, make a minimal contribution to the Castletownbere economy. The export-dependent fisheries sector showed a small decline as recession began to hit in 2008, but has been comparatively robust and has grown in subsequent years. The local fisheries sector has been critical for local employment, as it has absorbed some of the losses seen in other sectors, such as construction. Those fishing part-time in previous years are now remaining within the industry on a full-time basis.
viii                                                                                                                Executive Summary

                         900
                         800

  Full time employment   700
                         600
                         500
                         400
                         300
                         200
                         100
                           0
                                   2003          2004        2005        2006        2007         2008         2009         2010

                                   Capture Fisheries         Fish Processing       Service & Retail          Ancillary (Fisheries)
                                   Tourism                   Other Port (e.g. marine extraction              Aquaculture

Figure i. Employment by sector in Castletownbere from 2003 to 2010. Source: Castletownbere
Economic Survey.

In 2010, the total economic activity (turnover) of Castletownbere was estimated to be €149m. The fish
catching and processing sectors account for over half (54%) of the town’s economic activity (Figure ii). With
the inclusion of aquaculture and ancillary sectors1 this rises to 86% fisheries-related turnover with the induced
spend by employees of these sectors making a substantial contribution to the service and retail sector of the
town. The 24% of total turnover from the ancillary sector is mainly due to fuel sales. Local companies supply
oil to the local fleet, foreign fleet and also to vessels based outside of Castletownbere. The total value of the
ancillary sector, based on local fleet sales, is estimated to be €19m (17% of total turnover).

                                                                          Other port (marine extraction)
                                             Service and Retail           €2.50m / 2%
                                             €17.1m / 11%
                                    Tourism
                                                                                                      Capture Fisheries
                                    €1.11m / 1%
                                                                                                       €50.4m / 34%
                                Aquaculture
                                €12.43m / 8%

                               Ancillary (Fisheries)
                               €35.7m / 24%
                                                                                                  Fish Processing
                                                                                                  €29.6m / 20%

Figure ii. The contribution to the total turnover made by different economic sectors in Castletownbere
during 2010. Source: Castletownbere Economic Survey.
Note: Aquaculture turnover relates to the Beara Peninsula not just to Castletownbere.

1 The ancillary sector includes vessel agents, fuel suppliers, chandlers, net repair, engineering (i.e. mechanical, electrical,
  hydraulic and refrigeration), fleet support (i.e. representation and management) and harbour services (e.g. ice, pilotage,
  synchro-lift).
Executive Summary ix Fisheries and Aquaculture Sector There are 151 vessels employing 370 Full Time Equivalent (FTE) crew within the Castletownbere fleet. Of these, 106 (70%) are inshore vessels less than 12 metres in length. A further 14 (9%) are vessels between 12 and 18 metres in length. Of the 31 larger vessels (over 18 metres in length) 8 target pelagic species while the balance (23 vessels) make up the Castletownbere over 18 metre demersal fleet, targeting Nephrops and the main whitefish species (monkfish, megrim, hake, cod, haddock, whiting etc). Despite the consolidation and reduction seen in the Irish fleet as a whole, the fisheries centre of Castletownbere has maintained its fleet and its overall fishing capacity has remained stable. The fleet lost a number of mid-range vessels through decommissioning, but reinvestment in new vessels has occurred and others have moved in from peripheral ports. The maintenance of fleet capacity over the last ten years was possible due to the varied fisheries targeted, resulting in continued fishing opportunities: as the quota in one fishery was reduced, another was increased or new opportunities were identified. Adding value to the fish landed is derived exclusively from landings made by the local fleet. For every €1m landed by the fleet, a further €2.12m is created by the processing and ancillary sectors. Every job within the local fleet supports 0.66 jobs in the processing and ancillary sectors. For foreign fleet landings the situation is very different with some value gained by the ancillary sector, mainly through fuel purchases, but almost nothing for the processing sector. Landings from Castletownbere’s fleet of eight pelagic vessels are handled by fish agents based in the town. Catches may be landed into the Castletownbere Co-op, but more often are landed either direct to processors in Killybegs who take 37% of the catch by volume from Castletownbere-registered vessels, or elsewhere in Ireland or overseas. Those interviewed stated that, where possible, they land their pelagic catches locally in Castletownbere although it was sometimes necessary to land elsewhere due to weather and other factors. The local polyvalent fleet supplies nearly all the raw material used by the processing sector in Castletownbere, with some additional (mainly shellfish) supplies sourced from other vessels. There are three major processors based in Castletownbere employing nearly 200 FTE staff who had a turnover of approximately €30m in 2010. The good tuna season and high prices throughout 2011 are expected to result in a significant increase in this sector’s turnover. The processing sector has a high dependence on local landings (66% of raw material), with additional supplies of shellfish delivered from around the region and country (31%). Only 4% of raw material is imported. This highlights the important economic correlation between the catching opportunities for the local fleet and the profitability of the local processing sector. The processing sector’s turnover and workforce have grown by over 30% since 2003. The relatively static daily output capacity, increasing by only 2%, suggests that this is mainly being achieved through improved handling and increasing the added-value of products rather than increased throughput. A 12% increase in refrigerated holding capacity has supported the development of value-added products and enabled more direct links to be made with major buyers on the continent.
x                                                                                                    Executive Summary

The aquaculture sector in the region is mainly concerned with mussel culture and salmon production,
with small-scale abalone culture also occurring in the vicinity of Castletownbere. The volume and value of
aquaculture production has fluctuated over the last ten years, due in part to production cycles, but also
the changing fortunes of a few key producers. In employment terms, the finfish-farming sector is estimated
to employ 17 FTEs and the shellfish sector 68.5 FTEs in the wider Beara Peninsula area. In Castletownbere,
employment in aquaculture is more limited with 4 administrative staff associated with salmon farming and 4
FTEs involved with locally based mussel production.

The ancillary sector in Castletownbere is very different to that found in Killybegs, Ireland’s centre for net
manufacture and marine engineering. Whereas the large ancillary sector in Killybegs greatly exceeds the
needs of its local fleet, in Castletownbere this is only true for fuel suppliers, where sales attributable to the
local fishing fleet represents 48% of the turnover (€19.3m); just over half the trade relates to servicing vessels
elsewhere and servicing the foreign fleet. Relative to the size of the fleet, the specialist engineering sector is
under-represented by local companies. This is due to the fact that specialist companies, based in Killybegs,
are used, as required, to service Castletownbere vessels.

Drivers of change
Over the last number of years, the Castletownbere fleet has remained relatively stable, in contrast to the
reductions seen in the national fleet. As the Castletownbere fisheries sector is export-dependent, it continues
to be affected by changes in key markets such as Spain and France.

External drivers have had positive and negative influences on the Castletownbere fishing sector. Although
the economic boom period known as the Celtic Tiger increased overall affluence, growth in other sectors
exceeded that seen in the fisheries sector and job opportunities elsewhere made crew retention difficult.
The recent downturn of the national economy has meant that locals are coming back to the area to work in
the fisheries sector although some local skills shortages remain.

Recent trends are positive for some aspects of the fishing sector, with good prices and good landings in 2011,
particularly for pelagic fisheries. Prime fish (i.e. high value species e.g. Brill, turbot, black sole) prices continue to
be depressed on the continent and rising fuel prices pose problems for the industry.

Adaptation
The catching sector has adapted to increased fuel costs and the need to reduce discards through sourcing
and operating more selective and lighter gear. Vessels have diversified into other fisheries such as alternative
whitefish species, Nephrops and tuna. Pelagic vessels are supplementing their main herring and mackerel
fisheries by targeting a number of pelagic species for fish meal (e.g. horse mackerel, blue whiting and boarfish).

Post-harvest adaptation has involved operating efficiencies through reduced energy costs and outsourcing
some aspects of operations. Transport and distribution operations, for example, have struggled to remain
profitable as processors supplying a depressed export market are not able to pass on additional fuel costs
by increasing the price of their products.
Executive Summary                                                                                                xi

The ancillary sector has looked to diversify into non-fishing sectors. For example, net manufacturers have
diversified into leisure, aquaculture and safety equipment; fuel suppliers now serve the leisure sector and
sea-going engineers seek land-based contracts in the quieter winter period.

The BIM Fisheries School was cited as an example of how the industry and wider community was adapting
to changes. Local fishermen are assisted in up-skilling and the school creates a small influx of students from
outside the Castletownbere area.

Access to finance was cited as a barrier to reinvestment by the fisheries sector. The value of tonnage has
collapsed, reducing the assets that catching sector interests can borrow against. Local barriers to adaptation
relate to limited infrastructure. The West Cork Enterprise Board’s Strategic Plan identifies that “although the
natural environment in which West Cork sits is an advantage… the lack of high quality road infrastructure and
the distance from other major towns and cities has led to a shortage of high-skilled and high value added
employment opportunities”.

Opportunities
The proximity to fishing grounds and the high price of fuel makes Castletownbere an attractive landing
location for vessels whether Irish or foreign. There may be the potential for more strategic linkages with
foreign operators to encourage them to land more and do more to those landings before transshipment to
the continent.

€40m of central funding for harbour development has eased over-crowding and has enabled Castletownbere
to recover some of the foreign landings lost to other ports. However, with the economic crisis, landside
development (public and private) has not occurred to fully support growth in maritime sectors. The harbour
investment does however support and safeguard existing operations as well as providing new opportunities
such as cruise liner visits planned for 2012.

The way forward
Attendees at a local stakeholder workshop held on the 19th October 2011 considered what actions could
be taken to support Castletownbere and its fisheries sector (Table ii). A ‘way forward’, identifying how these
actions could be delivered was also discussed.

The town has a Harbour Users Committee and the Community Development Association (CDA), but a small
stakeholder forum to specifically address economic development of the town is proposed to drive the
production of a jobs strategy. The group should engage with regional development organisations to seek their
guidance, exchange information and explore potential funding streams. Some stakeholders suggested that
creating a Fisheries Local Action Group (FLAG2) covering the Beara Peninsula would assist this process.

2 FLAGs are funded under Axis 4 of the European Fisheries Fund.
xii                                                                                                         Executive Summary

 Table ii. Actions proposed by stakeholders to support the component parts of the Castletownbere
 fisheries sector.

 Sector                 Actions
 Catching               • More co-operative working in catching sector
                        • New gear adaptations and fishing techniques
                        • Quality improvements – setting standards
                        • Change the intervention process for fish as it is being used to set the minimum price for many species
                        • Explore and develop potential for non fishing work such as Guard Vessel and FLO with the Oil and
                          Gas Industry
 Processing             • Tuna processing (smoking etc.)
                        • Surimi processing of boarfish as well as other human consumption options
                        • Frozen prawns at sea brand
                        • Differentiate product in market place
                        • Promote more in Ireland and UK so less straight to continent
                        • Satellite seafood development centre for Castletownbere
                        • Potential for adding value from foreign landings to be explored and developed
 Aquaculture            • More aquaculture development and support including processing
                        • Community-based licensing for aquaculture (possibly other developments)
 Ancillary              • Community Ice Plant to service fishing and other food industries
 Other sectors          • Pontoons/marina development for marine tourism
                        • Tourism attraction – develop a focal point and additional shops, restaurants more closely associated
                          with fishing sector
                        • Support to the oil and gas and renewables sector

      Conclusion
      Castletownbere has a remarkably high dependence on the fishing industry. The dominance of a single,
      export-orientated sector could be viewed as precarious, but fishing has sustained the local economy
      throughout the difficult economic conditions experience in Ireland in recent years.

      While the fishing sector continues to experience pressure from increased costs, primarily fuel, fleet
      capacity and catching opportunities are relatively stable. The Castletownbere fleet has shown it is able
      to adapt through diversification into other fisheries.

      Opportunities exist to develop other marine sectors and tourism by focusing on the town’s key assets;
      the harbour, the surrounding landscape and of course it’s fishing industry. There are also development
      opportunities in the fisheries sector through more processed products from local landings and through
      diverting some foreign landings into the local processing sector. A jobs strategy, driven by a focused
      stakeholder group, is proposed to deliver these opportunities.
1 Introduction 1 1 Introduction 1.1 General description Castletownbere is the primary urban, economic and social centre on the remote Beara Peninsula in South West Ireland. It remains the largest whitefish port in Ireland, with vessels from Spain, Scotland and France making significant landings of whitefish to the port alongside the local fleet. Pelagic landings including tuna and shellfish are also important for the local Irish fleet. The town is also a tourist hub for visitors to the Beara Peninsula, which is a rugged and relatively undeveloped stretch of coastline and hinterland that is popular with walkers. 1.2 Location Castletownbere located in County Cork, South West Ireland (Figure 1), is the main town on the Beara Peninsula. It is 2 hours by road from Cork, the second largest city in Ireland. Coordinates: 51o 39’ N, 09o 54’ W Figure 1. The location of Castletownbere, West Cork, Ireland. Source: Google maps. 1.3 Key geographical characteristics Castletownbere is on the Southern coast of the Beara Peninsula, which borders the north of Bantry Bay. Castletownbere harbour is one of the largest natural harbours in the world and is formed by Dinish Island to the south and the town of Castletownbere to the north. The harbour is protected from the Atlantic Ocean by Bere (or Bear) Island about 1.5km away. Bere Island is approximately 11km by 5km with a population of 210. Dinish Island is connected to the mainland by a bridge and hosts most of the fish processing activity and marine-related industry on property leased from the State. The town is set in a dramatic and largely un-spoilt landscape that is an important asset for the development of secondary, tourist based, economic activity.
2                                                                                        2 Demographic Aspects

2 Demographic Aspects
2.1 Population and population age structure
Castletownbere is within the Killaconenagh District Electoral Division (DED), the smallest administrative unit
with census information. The population within this DED was recorded as 1,512 in 2011, which represents
around 35% of the total population of the Beara Peninsula’s 4,290 inhabitants (Table 1).

    Table 1. Census records for the population of the district electoral divisions (DED) around
    Castletownbere in 2006 and 2011. DED Categories: A: Electoral Divisions where more than 67%
    of the total population are daily speakers of Irish; B: Electoral Divisions where 44-66% of the total
    population are daily speakers of Irish. Sources: CSO; 2011 census and West Cork Leader baseline
    data for 2006.

    DED         Geographic          Total       Total       Male       Female        Change         % Change
    Category    Area               (2006)      (2011)      (2011)      (2011)      (2006-2011)     (2006-2011)
    A           Killaconenagh       1,463       1,512        751         761            49              3.3
    B           Adrigole             461         467         252         215             6              1.3
    B           Bear                 187         216         124          92            29              15.5
    B           Coulagh              507         525         284         241            18              3.6
    B           Curryglass           362         383         201         182            21              5.8
    B           Kilcatherine         794         805         427         378            11              1.4
    B           Kilnamanagh          372         382         194         188            10              2.7
                Total              4,146        4,290       2,233       2,057          144              3.4

Within Killaconenagh, the Castletownbere town population is estimated to be between 900 and 1,000,
which has grown slightly since the 2002 census (Pop. 875). The Local Area Plan estimated that by 2011 the
population could be 1,000 people across 400 households. This estimated growth was attributed to good
economic strength and quality of life attracting new residents. The recent downturn and economic migration
being experienced across Ireland may mean that these estimates are not reached, but the 2011 census (Table
1) shows population growth of 3.3% in the area since 2006.

The Killaconenagh DED had a working population of 779 in 2006, amounting to 53% of the total population3.
Applying this ratio to the 2011 numbers, this amounts to around 800 in total of working age living in the
local area.

3 West Cork Leader baseline data report, 2006.
2 Demographic Aspects 3
1520
1500
1480
Population
1460
1440
1420
1400
1380
1990 1995 2000 2005 2010
Figure 2. The population of Killaconenagh DED (containing Castletownbere) from 1990 to 2010.
Source: CSO.
1600
1400
1200
1000
Number
800
600
400
200
0
1996 2002 2006
0-14 15-24 25-44 45-64 >65
Figure 3. The age structure of Killaconenagh DED (containing Castletownbere) recorded by census in
1996, 2002 and 2006. Source: CSO.
2.2 Ethnicity and migration
Migration into and out of the Castletownbere area has been influenced by the fortunes of the Irish economy.
In the last century the area, as with Ireland as a whole, experienced net emigration with residents leaving for
work opportunities elsewhere. The rapidly growing Irish economy in the late 90’s and first half of the 00’s,
termed the ‘Celtic Tiger’, resulted in improved prosperity overall and saw Ireland experience net immigration
(Figure 4), but continued the migration of young people and workers out of rural and isolated coastal areas
like Castletownbere to Cork and Dublin.4 2 Demographic Aspects
120
100
80
60
Thousands
40
20
0
1987
1988
1989
1990
1991
1992
1993
1994
1995
1996
1997
1998
1999
2000
2001
2002
2003
2004
2005
2006
2007
2008
-20
-40
-60
Year
Immigration Emigration Net Migration
Figure 4. Immigration, Emigration and Net Migration in Ireland from 1987 to 2008. Source: CSO.
For the fisheries sector, Ireland’s economic boom and the reduction in fleet capacity simply accelerated the
trend that saw limited recruitment of young people into the sector. This resulted in a number of vessels and
processing companies using immigrant labour from the new EU states in Eastern Europe and non-EU countries
such as Egypt and the Philippines.
The more recent economic downturn has reversed some of these trends, and Irish workers are once again
returning to their local area to seek employment. Similarly, young people are looking to local opportunities,
including fishing, for skilled/semi-skilled employment. Conversely, for those with 3rd level education
Castletownbere continues to offer only limited opportunities and many continue to move to Cork, Dublin
and increasingly overseas in a new wave of economic migration.
For those who immigrated to Ireland during the last decade the trends are complex. While there is evidence
that many EU nationals are returning to their country of origin or are deciding not to choose Ireland as a
country of destination in the first place, for those from outside the EU the available evidence suggests that
rather than leave Ireland, many are doing all in their power to remain4.
Ireland tightened its work permit system in June 2009 due to the country’s recession and no new work
permits are issued for jobs with a salary less than €30,000 (Ruhs, 2009)5. This has implications for the fisheries
sector where crew incomes are variable and can be below this level.
4 Immigrant Council of Ireland statistics, 2011.
5 Ruhs, 2009. “Ireland: From Rapid Immigration to Recession” Martin Ruhs, Centre on Migration, Policy and Society
(COMPAS) Oxford University. Updated by Emma Quinn, ESRI, Dublin.3 Economic aspects 5 3 Economic aspects 3.1 Importance of economic activities Castletownbere’s key economic sector is fishing, followed to a much lesser extent by tourism. Fishing is addressed in section 4. Tourism and other economic sectors are explored further below. 3.1.1 Tourism Tourism has experienced a significant downturn in overall visitor numbers and expenditure seen across Ireland from a peak of €4.9billion in 2007 to €3.9billion in 2010 (CSO ‘Tourism and Travel’, 2011). Tourism statistics from Fáilte Ireland are amalgamated for the South West region of Ireland (Counties Cork and Kerry). A recent study on walking tourism in West Cork for the West Cork Development Partnership estimates that in 2009 West Cork generated approximately 470,000 tourist visits and €134m in revenue. Overseas visitors accounted for 218,000 trips generating €84m revenue whilst trips taken by Irish residents amounted to 249,000 generating €48m. Approximately 328,000 of the visitors to West Cork were holidaymakers; of which 153,000 were from overseas and 173,000 were Irish residents. (URS Scott Wilson, 2011). There is a lack of visitor accommodation in and around Castletownbere with a recent study identifying 8 bed and breakfast, 10 self-catering facilities and 1 camping and caravan site. The average capacity rates for each of these results in a total of 130 serviced bed spaces around Castletownbere. Taking into account occupancy rates of only 27% for Bed and Breakfast and 35% for self-catering accommodation, the total overnight stays in Castletownbere amounts to 14,272 bed nights. The average length of stay is 4 nights giving an estimated total number of visits as 3,568. Fáilte Ireland statistics indicate a trip spend by overnight visitors to South West Ireland of €197 for domestic visitors and €313 for international visitors. Applying these spend figures to accommodation that is available to holidaymakers in Castletownbere gives an estimated tourism spend of €3.6 million by overnight visitors. There would also be a smaller spend associated with visitors staying at the camping and caravan site along with day visitor spend, which is estimated to average €11 per day. Assuming coach tours and independent traveller visits result in around 50 day visitors averaged across the year, this amounts to a further €200,750. The total visitor spend in Castletownbere, a proxy for tourism turnover, is therefore an estimated €1.1 million in 2010. It is estimated that €39,500 of visitor expenditure equates to one job in the tourism sector (Fáilte Ireland, 2009); for visitors to Castletownbere this represents just under 28 jobs. These jobs would be spread across a number of businesses supporting the tourism sector from accommodation providers, attractions and visitor services to restaurants and bars etc. The trend in the tourism sector is estimated by applying the same trends seen in annual tourism revenue for Ireland since 2003 (CSO Tourism Trends) to the turnover and employment for Castletownbere in 2010. This showed a growth in tourism to a peak in 2007, but a subsequent 44% decrease in overall tourism revenue. Fáilte Ireland surveys estimate that 86% of visitors to the South West are on holiday, and assume the remaining visitors are on business (URS Scott Wilson, 2011). As the primary economic activity in Castletownbere is fishing, a significant number of visitors are there on business as a result of the fishing sector. As will be discussed in section 4, the fleet is serviced by a number of companies based further afield such as specialist engineering companies based in Killybegs. As most landings and processed goods are exported, the port would occasionally also host overseas customers. Fishing therefore also supports spend and employment associated with the tourism sector; this has become increasingly important since the recent reduction in visitors Ireland.
6                                                                                                  3 Economic aspects

Marine tourism has increased and is centred around yachting traffic using the marina on Bere Island, which has
benefits to Castletownbere from visitors seeking entertainment and provisions etc. Two cruise-liner visits are
expected next year, which could make a significant contribution to tourism revenue for the region, if not for
the town itself.

3.1.2 Other economic activities
West Cork suffers from a narrow sectoral base and is under-represented in a number of sectors including
manufacturing, commerce and trade, transport and communications, and public administration (Cork County
Council, 2009).

The 2006 census indicates that the service and retail sector in West Cork is at a lower level (20% of
employment) compared to Cork (25%) and Ireland as a whole (27%). For Castletownbere a substantial part
of this sector is dependent on direct spend by the fishing sector (e.g. on provisions, travel and professional
services), while much of the remainder is dependent on induced spend by those living locally that are
employed by the fisheries sector. The direct spend attributable to fishing is 5.8% of the catching sector’s
turnover. In 2010 this amounted to €2m or 13% of the turnover of the local service and retail sector, further
illustrating the linkage between other economic sectors and the fortunes of the fishing industry. This is another
sector where recent trends are downwards; Irish retail sales have decreased by 30% from 2007 to 2011
(Retail Excellence Ireland, 2011)6.

The building and construction industry has recently been a key sector for the West Cork region, with
14.2% of the workforce employed in it compared to 12.5% in the county and 11.1% nationally. However,
the recent economic crisis has hit the regional construction industry hard. The only construction evident
in Castletownbere is associated with the harbour development. Construction on private sector projects is
currently minimal and public sector construction is limited to road maintenance as budgets are cut. Large on-
going projects are centred on the development of Cork city.

Construction workers, a high proportion of which are employed on a casual basis, must now choose between
a daily two hour journey to Cork or, more often, find alternative employment. For those from Castletownbere
this often means a return to the fishing sector. This is particularly the case for the inshore fisherman. During the
construction boom many found work on construction sites and either stopped fishing altogether or fished
only on a seasonal basis. Now many remain within the fishing sector throughout the year. Likewise, jobs in the
fish processing sector, once viewed as a fallback option, are now sought after and processors have a large
pool of casual staff to call upon.

Maritime activities other than fishing in Castletownbere are limited and include small volumes of cargo traffic
associated with a company harvesting calcareous marine algae for fertilizer and animal feed. The company
employs approx. 12 FTE people in Castletownbere (a similar number in Cork). This company has, however,
recently expanded to harvest larger resources off Iceland and trade is expanding as the company diversifies
into more valuable feed products which previously were only suitable for use as fertilizer. The limited number
of additional maritime sectors is evidenced by the vessel visits listed in table 2 below.

6 Based on the proportional spend on provisions, travel, accountancy and other services (source: Fleet Annual Returns,
  BIM)
3 Economic aspects                                                                                                                   7

         Table 2. The number and type of vessel visiting Castletownbere from 2010 to 2012 (projected).
         Source: Castletownbere Harbour Master.

         Type of vessel                                                  2010                     2011                    2012
                                                                                                                       (Projected)

         Cruise Liners                                                    0                         0                      2

         General Cargo Vessels                                           10-12                     18                      25

         Offshore supply vessels                                          0                         0                      ?1

         Non-Irish Vessels                                               419               530 up to 30/11/11             570

Figure 5 presents the trend in different sector’s contribution to economic activity in Castletownbere, based
on turnover. The primary production sectors of capture fisheries and aquaculture create value, while the
processing sector adds value to this production. The ancillary sector is entirely dependent on fishing sector as
its primary customer. As reported above, a significant amount of the town’s service and retail sector turnover
is also dependent on fishing.

                            160

                            140
Economic value (€million)

                            120

                            100

                             80

                             60

                             40

                             20

                              0
                                  2003        2004    2005        2006            2007          2008        2009          2010

                                  Capture Fisheries   Fish Processing            Ancillary (Fisheries)           Aquaculture
                                  Tourism             Service & Retail           Other Port (e.g. marine extraction)

Figure 5. The economic value (Turnover; €Million), by sector, contributed to the economy of
Castletownbere from 2003 to 2010. Source: Castletownbere Economic Survey.
Note: The turnover for aquaculture relates to the Beara Peninsula and not just to Castletownbere.

The substantial contribution to turnover from the ancillary sector is mainly due to fuel sales; this sector has
benefitted from the major oil price increases over the last decade. The amounts presented in represent an
estimate of the turnover attributable to fishing sector sales with companies supplying oil to vessels based
outside of Castletownbere. The total value of the ancillary sector based on sales to the Castletownbere fleet
is estimated to be €19m (17% of total turnover).

7 While there are at present no projected visits by Offshore supply vessels during 2012 any interest expressed will be
  facilitated.
8 3 Economic aspects
Other port (marine extraction)
Service and Retail €2.50m / 2%
€17.1m / 11%
Tourism
Capture Fisheries
€1.11m / 1%
€50.4m / 34%
Aquaculture
€12.43m / 8%
Ancillary (Fisheries)
€35.7m / 24%
Fish Processing
€29.6m / 20%
Figure 6. The contribution to the total turnover made by different sectors to the economy
of Castletownbere in 2010 by value (€Million) and proportion (%). Source: Castletownbere
Economic Survey.
Note: The turnover for aquaculture relates to the Beara Peninsula and not just to Castletownbere.
Table 3. The seasonality of economic activity by sector in Castletownbere. Source: Irish South and
West Fish Producer’s Organisation.
Sector Main Period of Activity
Capture Fisheries: Mackerel October to March
Pelagic catching subsector Herring October to March
Horse mackerel October to March
Boarfish October to April (bycatch throughout the year)
Blue Whiting February (minimal; 2 boats)
Tuna August to November
Sprat September to February
Capture Fisheries: Haddock All year round
Demersal catching subsector Whiting All year round
Hake All year round
Monk All year round
Megrim All year round
Sole Year round (mainly bycatch)
Saithe All year round
Nephrops All year round
Cod All year round (peak in Spring)
Pollock All year round
Ling All year round
Plaice All year round (peak in August and September)
Skates and Rays All year round
Note: The bycatch of other species such as John Dory and Lemon Sole
occurs all year round.
Capture Fisheries: Crab April to November
Shellfish catching subsector Velvet Crab February to November
Shrimp January to March
Lobster All year round (peak productivity between May and September)
Crayfish Year round (peak productivity between May and October)
Pelagic Processing Follows the catching sector
Ancillary Vessel supplies corresponding with catching activity. Vessel repairs and maintenance during
non-catching months.
Retail All year round
Aquaculture All year round
Service Sector All year round
Tourism May to October3 Economic aspects 9
3.2 Employment and unemployment
The number unemployed in Killaconenagh in 2006 was reported as 33, the same total as in 2002 (Figure 7).
This gives an unemployment rate of 2.8%, a decrease from 4% in 1996. With the economic downturn the
unemployment rate for Ireland as a whole has risen from an average of 4.4% in 2006 to 14.5% by June 2011
(CSO, 2011). projects the national unemployment rate onto the local trend data, which is only available up
to 2006, and shows the dramatic rise in unemployment after many years at a low-level. Key sectors in the
regional economy such as tourism and construction have been particularly affected. Local consultation has
confirmed that there has been a large increase in local unemployment despite the fishing sector absorbing
some of this: those fishing part time in previous years now remaining within fishing on a full time basis and
there is a positive trend in fish processing employment.
16%
14%
12%
10%
Population
8%
6%
4%
2%
0%
1996 1997 1998 1999 2000 2001 2002 2003 2004 2005 2006 2007 2008 2009 2010 2011
Unemployment Rate (%)
Figure 7. The unemployment rate recorded in Castletownbere (Killaconenagh DED) between 1996
and 2011 (Solid points = census data; Broken line = estimate). Source: CSO.
The age dependency percentage (the proportion of non-working age) in 2006 was estimated at 33.6%: this
showed more economically active population than an average of 34.5% for the West Cork area, but fewer
economically active than the national average of 31.4%.
The index score for relative affluence and deprivation for Killaconenagh was 9 compared to 12.6 for West
Cork region and 10 nationally. This indicates that the area is marginally above average in terms of affluence,
while surrounding DEDs on the peninsula are marginally below average or disadvantaged. This illustrates the
positive contribution that fishing has on the local area. However this has worsened between 1991 and 2006
while those surrounding areas have improved.10 3 Economic aspects
Table 4. The population of Castletownbere broken down by employment status in 1996, 2002
and 2006. Source: Census data.
Year 1996 2002 2006
Total Population 1467 1478 1463
Employable population (Age >15) 1130 1170 1195
Employed 546 606 661
Unemployed 584 564 534
• Looking for first regular job 8 10 6
• Unemployed (having lost or given up a previous job) 45 33 33
• Student 105 111 101
• Looking after home / family 249 171 134
• Retired 143 178 196
• Unable to work due to permanent sickness or disability 33 50 59
• Other 1 11 5
Unemployment Ratio 3.98% 2.82% 2.76%
Note: Unemployment ratio = the ratio of unemployed to the employable population.
900
800
700
Full time employment
600
500
400
300
200
100
0
2003 2004 2005 2006 2007 2008 2009 2010
Capture Fisheries Fish Processing Service & Retail Ancillary (Fisheries)
Tourism Other Port (e.g. marine extraction Aquaculture
Figure 8. Full time employment by sector in Castletownbere between 2003 and 2010. Source:
Castletownbere Economic Survey.
presents the employment in Castletownbere per sector. These data are not available at town level and have,
therefore, been collated from a number of information sources with some based on estimates. The survey
found a remarkably high and sustained level of local employment dependency on the fisheries sector of
between 80% and 82%.3 Economic aspects 11
84%
Regional fisheries dep
82%
80%
78%
76%
74%
72%
70%
68%
2003 2004 2005 2006 2007 2008 2009 2010
Figure 9. Fisheries sector employment dependency in Castletownbere from 2003 to 2010. Source:
Castletownbere Economic Survey.
3.3 Infrastructure
The extent to which non-fishery sector infrastructure is available can significantly enable or constrain
development and diversification opportunities in any community. In Castletownbere, existing infrastructure is
not well-developed and is recognised as a constraint.
n There is only one principal road running east west through the town, giving rise to certain traffic circulation
and parking problems. A number of preliminary indicative routes for a future relief road have been
identified. There is also a need to identify a new car park location and to provide public lighting and
footpaths in a number of locations.
n An hourly car ferry takes residents and visitors to Bere Island from Castletownbere Harbour.
n There is no railway to Castletownbere. The Cork Bandon and South Coast Railway going as far west as
Bantry closed in 1961. The nearest rail connection is now Cork, 2 hours by road. Cork airport, also 2 hours
by road is the nearest air service.
n International ferry services operate from Cork to Swansea, Wales and Roscoff, France.
n Industry and enterprise development is focused on Dinish Island. Significant upgrading of the quayside
has occurred and space is available for marine and non-marine industries to establish themselves.
n According to the local area plan (Cork County Council, 2005) some water mains are in poor condition
and require replacement and a treatment plant upgrade is required. Wastewater from the town is either
discharged untreated or only subject to primary treatment at present.
n Education infrastructure: Castletownbere has primary and secondary schools. The BIM fisheries school
based at the harbour (see details in ancillary sector) and the National Maritime College of Ireland at
Ringaskiddy provide a number of vocational courses for the maritime sector. More general tertiary
education establishments in the region are in Cork (e.g. University College Cork, Cork Institute of
Technology and the Cork College of Commerce).
n Health infrastructure: Castletownbere has a health clinic and a community hospital providing care to the
elderly. The nearest general hospital is in Bantry, one hour away.
n Broadband accessibility has improved in recent years with the area within which Castletownbere is located
being part of the National Broadband Scheme, which aimed to deliver a choice of service providers and
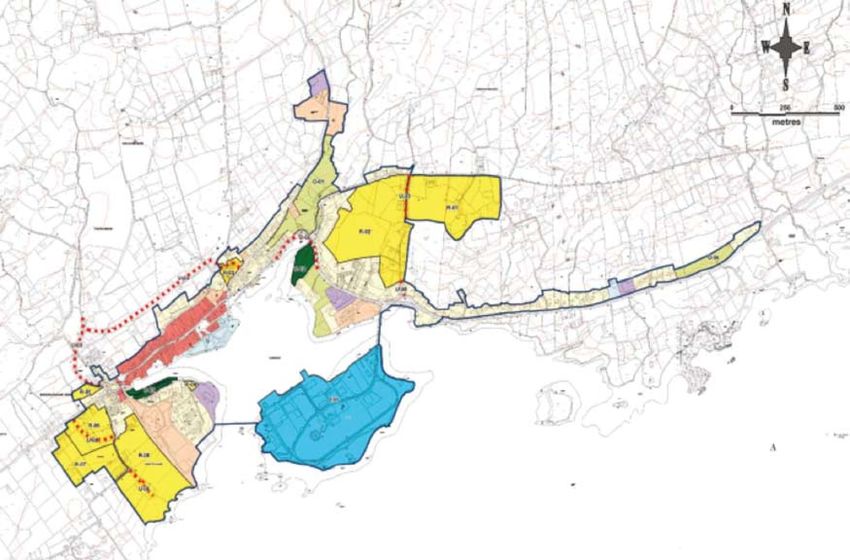
completed in October 2010.12 3 Economic aspects 3.4 Local development plans The Bantry Electoral Area Local Area Plan, published by Cork County Council in 2005, sets out a six year plan for the area. Castletownbere, along with Bantry and Schull, is identified as a key settlement in the area. The plan states that: “The overall strategy aims to consolidate Castletownbere as a key fisheries harbour and an important local and employment centre and promote its role as a marine-based tourism and employment location.” The Plan notes the barrier to economic development that a lack of hotel accommodation causes. “Even though the town plays an important role as a tourism hub for the Beara peninsula, Castletownbere is in need of additional high quality tourism accommodation. This would include hotel accommodation (with associated facilities e.g. leisure centre etc.) as well as a range of self-catering enterprises, hostels etc. Such uses will be accommodated within the town at appropriate locations in such a way as to support the general economic vitality of the town.” The only hotel in the town, the Cametringane Hotel with 26 bedrooms closed in 2009. This leaves Castletownbere with only bed and breakfast and hostel accommodation. Since the local area plan was published, the global economic crisis and Ireland’s debt crisis and property crash mean that few expected developments have come to fruition. A new local area plan is expected next year.
3 Economic aspects

                                                                                      LEGEND for ZONING MAPS
                                                                                      LAND USE CATEGORIES
                                                                                      Established Areas                                  New Area
                                                                                      n Primarily Residential                            n Residential

Figure 10. Castletownbere Local Area Plan, 2005. Source: Cork County Council, 2005.
                                                                                      n Primarily Town Centre/Neighbourhood Centre       n Town Centre/Neighbourhood Centre
                                                                                      n Primarily Commercial                             n Commercial
                                                                                      n Primarily Industry/Enterprise                    n Industry/Enterprise
                                                                                      n Primarily Educational/Industrial/Civic           n Educational/Industrial/Civic
                                                                                      n Primarily Utilities/Infrastructure               n Utilities/Infrastructure
                                                                                                                                                                                            13

                                                                                      n Primarily Open Space/Sports/Recreation/Amenity   n Open Space/Sports/Recreation/Amenity
                                                                                                                                         n Primarily Open Space/Sports/Recreation/Amenity
                                                                                                                                           (see specific objectives)
                                                                                                                                         n Special Zoning (see specific objectives)
14 4 Fisheries and aquaculture sub-sector 4 Fisheries and aquaculture sub-sector The fisheries sector in Castletownbere has a landed value of €50.4m in 2010, of which around 11,000t (€23m) was landed by Irish vessels (pelagic species, monkfish, whitefish and tuna) and 7,500t (€27m) was by foreign vessels with catches mainly consisting of hake, monkfish and megrim. 40% of foreign vessel landed value was by Spanish vessels, 35% from French vessels and 22% from UK vessels. There are also significant landings of shellfish (Nephrops, crab and lobster) by the Irish inshore fleet. Aquaculture production, mainly mussel and salmon in the surrounding the Beara Peninsula (not just in the immediate vicinity of Castletownbere) amounted to 6,435t in 2009 worth €12.4m, but production levels and values have fluctuated substantially above and below this level in recent years. Table 5 presents a comparison of the multipliers associated with the local fleet in relation to the processing and ancillary sectors. The table shows that additional economic value is derived from landings by the local fleet. Every €1m landed by the fleet, a further €2.12m is created by the processing and ancillary sectors. In employment terms, every job in the local fleet represents 0.66 jobs in processing and ancillary sectors. Table 5. The economic multipliers on turnover and employment associated with the local and foreign fleet landing into Castletownbere. Source: Castletownbere Economic Survey. Multipliers Turnover Employment Local fleet to processing subsector 1.28 0.53 Local fleet to ancillary subsector 0.83 0.13 Local fleet to processing and ancillary 2.12 0.66 Foreign fleet to processing subsector 0.02 n/a Foreign fleet to ancillary subsector 0.76 n/a Foreign fleet to processing and ancillary 0.77 n/a For foreign fleet landings the situation is very different with far less value added before the fish is exported. Landings by the foreign fleet do result in additional value for the ancillary sector, mainly through fuel purchases, but almost nothing for the processing sector. Analysis of 2010 whitefish landings by the foreign and domestic fleets (Figure 11) shows the substantial first hand sales value of foreign landings, accounting for 60% of the total (by volume). Just three species (monkfish, hake and megrim) account for 93% of foreign landings by value, but this value is not retained or added to locally. Castletownbere Co-Op already processes these three species from local vessel landings, but it has proven extremely difficult to establish additional processing from foreign vessels. Most foreign vessels landing into Castletownbere are under the control of one of the larger continental multiples with their own processing facilities on the continent and therefore choose to transport the raw materials from Castletownbere to these facilities. Getting more from these foreign landings before they are exported is an area of opportunity that should be explored. For example, the local processing sector has added substantial value to Irish Megrim landings, mainly through quality grading before export, and this now represents around 60% of the sector’s turnover from demersal species. If just 20% of the Megrim from foreign vessels could be diverted into local processing, this would result in a 7% increase in turnover for the whole processing sector and could provide for 14 new full-time jobs.
4 Fisheries and aquaculture sub-sector                                                                                                    15

In the future foreign operators may be more interested in processing some landings in Castletownbere if
lower transportation costs resulted in sufficient cost savings. The Danish Export Council is one example of
how this could be developed: an independently owned processing facility would be available and those
with product would pay a set fee to the facility to process the goods, but would be responsible for both
sourcing the raw materials and also selling the finished product. There is a need to continue developing
relationships with multiples such as Mercadona and Intermarche, but a guarantee of supply and traceability
are vital to these key customers and local processors must provide appropriate assurances. Branding/labelling
and continuity of supply need to be strengthened to try and increase the amount of value added products.
More collaborative working practices could be implemented, e.g. a number of different processors supplying
product through centralised distribution, to help ensure continuity of supply.

                         4,000
                                    Foreign
                         3,500
                                    Domestic
Landings 2010 (tonnes)

                         3,000
                         2,500
                         2,000
                         1,500
                         1,000
                          500
                            0
                                   Cod

                                          Haddock

                                                    Whiting

                                                              Plaice

                                                                       Sole

                                                                                 Pollack

                                                                                           Saithe

                                                                                                    Nephrops

                                                                                                                      Monkfish

                                                                                                                                 Megrim
                                                                                                               Hake

                                                                              Species

                                   Domestic
                                 4,580 / 40%

                                                                                                                   Foreign
                                                                                                                6,987 / 60%

Figure 11. Irish and foreign vessel landings of key whitefish species and Nephrops, in 2010. Source:
BIM.
16 4 Fisheries and aquaculture sub-sector For Castletownbere registered vessels, it is the polyvalent fleet that has the closest ties to the port, landing the majority of their catch either to the port or to nearby ports where the catch is transported overland back to Castletownbere for further grading, processing and distribution. A number of additional Irish vessels from the surrounding area also land whitefish into the port (amounting to 230t in 2010), which augments that supplied by the Castletownbere fleet. Pelagic vessels land to buyers; these may be the Castletownbere Co-op, but more often catch is landed direct to processors in Killybegs (taking 37% of Castletownbere-registered vessels catch by volume) elsewhere in Ireland or overseas. The Castletownbere pelagic vessels do land locally when possible however they are often unable where, for example, the location of the fishing grounds for mackerel at certain times of the year make it unviable to land to Castletownbere. The multipliers in table 5 and the analysis of landings suggest that the Castletownbere-registered pelagic vessels are part of a national pelagic fleet that nevertheless bring significant benefits in terms of jobs and income to Castletownbere. The foreign vessels also bring some benefit through additional trade for the ancillary sector supporting the fleet. It is, however, the large polyvalent fleet based in Castletownbere, and to a lesser extent the inshore shellfish fleet in the surrounding region, that creates the greatest benefits by providing fishing jobs, raw material for the processing sector and trade for the ancillary sector with the associated employment these bring. 4.1 Details of the local fishing fleets In total there are 151 vessels employing 370 FTE crew within the Castletownbere fleet. Table 6 presents details of the various fleet segments in 2010. Most of the fleet (88% of vessels) consists of polyvalent whitefish/Nephrops trawlers with five large vessels targeting pelagic species and 12 under 12m vessels potting for crab and lobster. In terms of number of vessels and crew, the polyvalent under 12m fleet segment dominates, accounting for 62% of vessel numbers and 32% of catching sector employment.
You can also read