PHANGS-HST: Star Cluster Spectral Energy Distribution Fitting with - CIGALE
←
→
Page content transcription
If your browser does not render page correctly, please read the page content below
MNRAS 000, 1–22 (2020)                            Preprint 7 January 2021               Compiled using MNRAS LATEX style file v3.0

                                              PHANGS–HST: Star Cluster Spectral Energy Distribution Fitting with
                                              CIGALE
                                               Jordan A. Turner,1? Daniel A. Dale,1 Janice C. Lee,2 Médéric Boquien,3 Rupali Chandar,4
                                              Sinan Deger,2 Kirsten L. Larson,2 Angus Mok,4 David A. Thilker,5 Leonardo Ubeda,6
                                              Bradley C. Whitmore,6 Francesco Belfiore,7 Frank Bigiel,8 Guillermo A. Blanc,9,10 Eric Emsellem,11,12
                                              Kathryn Grasha,13 Brent Groves,13 Ralf S. Klessen,14,15 Kathryn Kreckel,16 J. M. Diederik Kruijssen,16
                                              Adam K. Leroy,17 Erik Rosolowsky,18 Patricia Sanchez-Blazquez,19,20 Eva Schinnerer,21
arXiv:2101.02134v1 [astro-ph.GA] 6 Jan 2021

                                              Andreas Schruba,22 Schuyler D. Van Dyk,2 and Thomas G. Williams21
                                              1 Department    of Physics & Astronomy, University of Wyoming, Laramie, WY USA
                                              2 Caltech/IPAC,    Pasadena, CA USA
                                              3 Centro de Astronomı́a (CITEVA), Universidad de Antofagasta, Antofagasta, Chile
                                              4 Department of Physics & Astronomy, University of Toledo, Toledo, OH USA
                                              5 Center for Astrophysical Sciences, The Johns Hopkins University, Baltimore, MD USA
                                              6 Space Telescope Science Institute, Baltimore, MD USA 7 INAF – Osservatorio Astrofisico di Arcetri, Largo E. Fermi 5, I-50157, Firenze, Italy
                                              8 Argelander-Institut für Astronomie, Universität Bonn, Auf dem Hügel 71, D-53121 Bonn, Germany
                                              9 The Observatories of the Carnegie Institution for Science, 813 Santa Barbara St., Pasadena, CA, 91101
                                              10 Departamento de Astronomı́a, Universidad de Chile, Camino del Observatorio 1515, Las Condes, Santiago, Chile
                                              11 European Southern Observatory, Karl-Schwarzchild Straße 2, D-85748 Garching bei München, Germany
                                              12 Université Lyon 1, ENS de Lyon, CNRS, Centre de Recherche Astrophysique de Lyon UMR5574, F-69230 Saint-Genis-Laval, France
                                              13 Research School of Astronomy and Astrophysics, Australian National University, Canberra ACT, Australia
                                              14 Universität Heidelberg, Zentrum für Astronomie, Institut für Theoretische Astrophysik, Heidelberg, Germany
                                              15 Universität Heidelberg, Interdisziplinäres Zentrum für Wissenschaftliches Rechnen, Heidelberg, Germany
                                              16 Astronomisches Rechen-Institut, Zentrum für Astronomie der Universität Heidelberg, Heidelberg, Germany
                                              17 Department of Astronomy, The Ohio State University, Columbus, Ohio 43210, USA
                                              18 Department of Physics, University of Alberta, Edmonton, AB, Canada
                                              19 Departamento de Fı́sica de la Tierra y Astrofśica, Universidad Complutense de Madrid, E-28040, Spain
                                              20 Instituo de Fı́sica de Particulas y del Cosmos IPARCOS, Universidad Complutense de Madrid, E-28040, Madrid, Spain
                                              21 Max-Planck-Institut für Astronomie, Königstuhl 17, D-69117 Heidelberg, Germany
                                              22 Max-Planck-Institut für Extraterrestrische Physik, Giessenbachstraße 1, D-85748 Garching, Germany

                                              Accepted XXX. Received YYY; in original form ZZZ

                                              ABSTRACT
                                              The sensitivity and angular resolution of photometric surveys executed by the Hubble Space Telescope (HST ) enable
                                              studies of individual star clusters in galaxies out to a few tens of megaparsecs. The fitting of spectral energy distri-
                                              butions (SEDs) of star clusters is essential for measuring their physical properties and studying their evolution. We
                                              report on the use of the publicly available Code Investigating GALaxy Emission (cigale) SED fitting package to
                                              derive ages, stellar masses, and reddenings for star clusters identified in the Physics at High Angular resolution in
                                              Nearby GalaxieS–HST (PHANGS–HST) survey. Using samples of star clusters in the galaxy NGC 3351, we present
                                              results of benchmark analyses performed to validate the code and a comparison to SED fitting results from the Legacy
                                              ExtraGalactic Ultraviolet Survey (LEGUS). We consider procedures for the PHANGS–HST SED fitting pipeline, e.g.,
                                              the choice of single stellar population models, the treatment of nebular emission and dust, and the use of fluxes versus
                                              magnitudes for the SED fitting. We report on the properties of clusters in NGC 3351 and find, on average, the clusters
                                              residing in the inner star-forming ring of NGC 3351 are young (< 10 Myr) and massive (105 M ) while clusters in
                                              the stellar bulge are significantly older. Cluster mass function fits yield β values around −2, consistent with prior
                                              results with a tendency to be shallower at the youngest ages. Finally, we explore a Bayesian analysis with additional
                                              physically-motivated priors for the distribution of ages and masses and analyze the resulting cluster distributions.
                                              Key words: galaxies: star clusters: general – galaxies: individual NGC 3351 – methods: data analysis

                                              ?   E-mail: jturne19@uwyo.edu
                                              © 2020 The Authors
2 J. A. Turner et al.
1 INTRODUCTION to derive ages, stellar masses, and reddenings for star clus-
ters identified in the Physics at High Angular resolution in
The measurement of the physical properties of stellar pop-
Nearby GalaxieS–HST (PHANGS–HST) survey (J. C. Lee
ulations using broadband photometry is an arduous task.
et al. in prep.)2 . PHANGS3 is a panchromatic collaboration
Even at the level of an individual single-aged star cluster,
comprised of: PHANGS–ALMA, a large CO(2–1) mapping
various phenomena are at play. As starlight interacts with
program aimed at covering a representative sample of ∼74
dust, a fraction is absorbed and then re-emitted at longer
nearby galaxies (A. K. Leroy et al., in prep.); PHANGS–
wavelengths. Additionally, the dust obscures the view of the
MUSE, a Very Large Telescope (VLT) imaging program of
star clusters leading to extinction and reddening of the stellar
∼20 of the PHANGS galaxies with the MUSE optical IFU
emission. Young clusters contain massive stars that ionize the
instrument (E. Emsellem et al. in prep.; see first results in
surrounding gas, leading both to the rise of a nebular contin-
Kreckel et al. 2016, 2019); and PHANGS–HST which aims
uum and to the appearance of a series of emission lines. This
to chart the connections between molecular clouds and young
nebular emission can be quite bright, and may represent a
star clusters/associations throughout a range of galactic en-
non-negligible fraction of the flux captured by broadband fil-
vironments by imaging the 38 galaxies from the PHANGS
ters (e.g., Anders & Fritze-v. Alvensleben 2003; Groves et al.
sample best-suited4 for study of resolved stellar populations.
2008; Boquien et al. 2010; Reines et al. 2010). In addition to
PHANGS–HST observations, which begun in 2019 April and
the effects from dust and ionized gas, there are dependencies
are scheduled to conclude in mid 2021, are expected to yield
on the initial mass function (IMF) of the stellar population
N U V -U -B-V -I photometry for tens of thousands of stellar
where the IMF can be fully-sampled or stochastically sam-
clusters and associations.
pled (e.g., Barbaro & Bertelli 1977; Girardi & Bica 1993).
cigale is designed for speed, ease of use, and adaptabil-
To further our understanding of star cluster formation and
ity. It is based on a Bayesian approach for estimating phys-
evolution, it is necessary to carefully account for these effects
ical properties and the corresponding uncertainties. It has
to accurately measure fundamental cluster properties such as
the necessary flexibility for handling different stellar evolu-
the age, mass, and reddening.
tion tracks, star formation histories, dust attenuation curves,
These measurements of stellar cluster properties provide an
and options for including nebular emission. A χ2 minimiza-
essential tool for understanding the mechanisms which drive,
tion option is available with cigale to simplify comparisons
regulate, and extinguish star formation at small scales. In
with prior work. It is well-suited for supporting stellar clus-
turn, catalogs of star clusters can be combined with observa-
ter studies, as well as for self-consistent modelling of both
tions of gas in nearby galaxies to chart the cycling of gas into
single-aged and composite stellar populations. Such an ap-
stars, allowing us to study the dependence of star formation
proach is needed for the characterization of structures across
on environmental parameters on galactic scales. Previously
the full star formation hierarchy, beyond the densest peaks
developed catalogs of stellar cluster ages and masses have en-
(i.e., stellar clusters), as will be investigated by PHANGS.
abled the study of cluster mass and age functions (e.g., Foues-
For this specific work, cigale has been been expanded to
neau et al. 2014; Ashworth et al. 2017; Chandar et al. 2017;
handle the modelling of pure single-aged stellar populations,
Linden et al. 2017; Mok et al. 2019), star formation in differ-
and the yggdrasil stellar populations models (Zackrisson
ent environments (e.g., Whitmore et al. 2014; Chandar et al.
et al. 2011) have been added to allow for easy comparison
2017; Leroy et al. 2018), and star formation efficiencies and
with previous studies, complementing the Bruzual & Charlot
timescales (e.g., Grasha et al. 2018, 2019). Most recently, the
(2003, hereafter BC03) populations that are provided by de-
Legacy ExtraGalactic Ultraviolet Survey (LEGUS) project
fault.5 cigale fits photometry in linear flux units by default,
(Calzetti et al. 2015) has derived the ages, masses, and red-
but a modification to enable the fitting of photometry in units
denings of star clusters using the SED modelling techniques
of magnitudes has also been implemented to allow for easy
described in Adamo et al. (2017).
comparison with previous star cluster SED modelling studies.
Over the past decades, various codes have been developed
These changes are available in dedicated branches, SSP and
to model the panchromatic emission from galaxies. Combined
SSPmag, respectively, of the public git repository6 of cigale.
with Bayesian techniques, they can provide deeper insight
When employing these modified versions, one still has the op-
into the properties of star cluster populations in conjunction
tion to run cigale in its default operating mode of modelling
with simple χ2 minimization for constraining physical param-
the SFH rather than to fit the SSP track directly.
eters (e.g., da Cunha et al. 2008; Franzetti et al. 2008; Han
& Han 2012; Moustakas et al. 2013; Chevallard & Charlot
2016). Although this machinery has enabled significant ad-
2
vances for the interpretation of galaxy spectral energy distri- https://phangs.stsci.edu
3 http://www.phangs.org
butions (SEDs), application to stellar clusters has been more
4 Galaxies that are relatively face-on, avoid the Galactic plane,
limited.
and have robust molecular cloud populations to facilitate joint
The availability of public codes under permissive licenses
analysis of resolved stellar populations and molecular clouds (G.
offers an opportunity to bring the benefits enjoyed by galaxy S. Anand et al. in prep; J. C. Lee et al. in prep.).
studies to studies of stellar clusters. Here, we report on an 5 There are a number of star formation history (SFH) and sin-
augmentation of the publicly available SED fitting pack- gle stellar population (SSP) modules available by default within
age cigale: Code Investigating GALaxy Emission 1 (Bur- cigale. The SFH modules included are a double exponential,
garella et al. 2005; Noll et al. 2009; Boquien et al. 2019) a delayed SFH with optional exponential burst or constant
burst/quench, a periodic SFH, and a user specified SFH read in
from an input file. The SSP models included by default are Bruzual
& Charlot (2003) and Maraston (2005).
1 https://cigale.lam.fr 6 https://gitlab.lam.fr/cigale/cigale.git
MNRAS 000, 1–22 (2020)CIGALE for Star Clusters 3
Table 1. HST Integrations for NGC 3351
Name F275W F336W F438W F555W F814W
[s] [s] [s] [s] [s]
PHANGS 2190 1110 1050 670 830
LEGUS 2361 1062 908 1062 908
Table 1. HST WFC3 UVIS imaging exposure times corresponding
to the footprints illustrated in Figure 1. New data for NGC 3351
were obtained by PHANGS–HST in all five filters, in order to
better cover the region mapped in CO with ALMA.
This paper is part of a series which documents the ma-
jor components of the overall PHANGS–HST data products
pipeline: survey design and implementation (J. C. Lee et al. in
prep.); source detection and selection of compact star cluster
candidates (D. A. Thilker et al. in prep.); aperture correction
and quantitative morphologies of star clusters (S. Değer et
al. in prep.); star cluster candidate classification (B. C. Whit-
more et al. in prep.); neural network classification proof-of-
concept demonstration (Wei et al. 2020); stellar association
identification and analysis (K. L. Larson et al. in prep.); and
constraints on galaxy distances through analysis of the Tip of
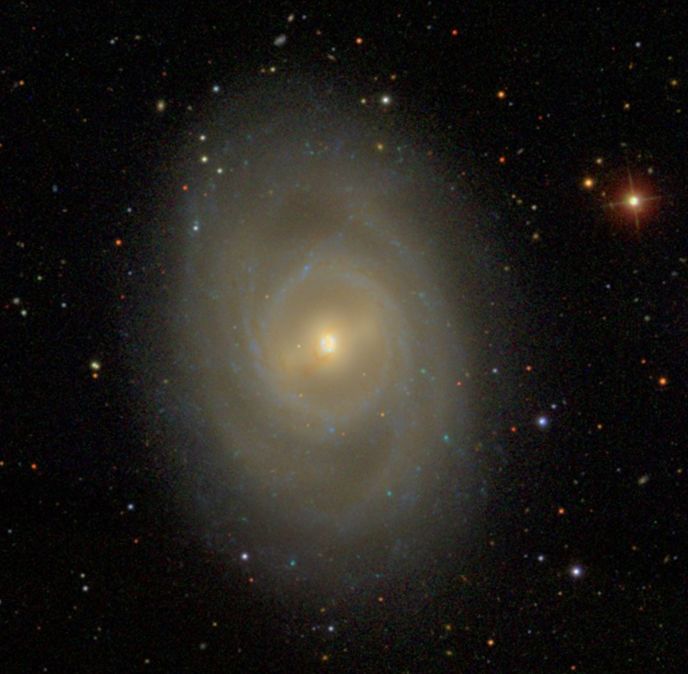
the Red Giant Branch (TRGB) as observed in the PHANGS– Figure 1. WFC3 observation footprints from PHANGS–HST
HST parallel pointings (Anand et al. 2020). (green) and LEGUS (orange) overlaid on a Sloan Digital Sky sur-
Here, we focus on the methodology for fitting the N U V - vey g-r-i image of NGC 3351 (David W. Hogg, Michael R. Blanton,
and the Sloan Digital Sky Survey Collaboration). The WFC3 field
U -B-V -I photometry for star clusters with cigale. In Sec-
of view is 16200 ×16200 .
tion 2, we review the data utilized in this work. In Sec-
tion 3, we present the results of a benchmark analysis to
validate the code.7 We use cigale to fit mock cluster pho- et al. 2010). Measurements using PHANGS–MUSE H ii re-
tometry and examine the accuracy of the recovered proper- gions confirm this, and also show a flat radial metallicity gra-
ties. We also use cigale to fit photometry for stellar clusters dient across our field of view (K. Kreckel priv. comm.), which
in NGC 3351 published by the LEGUS project, and compare simplifies the interpretation of results based upon the stan-
with results from their proprietary stellar cluster SED fitting dard assumption of a single metallicity model for the entire
code (Adamo et al. 2017). In Section 4, we use new imag- cluster population of a galaxy.
ing data obtained by PHANGS–HST for a larger region of Though 80 per cent of the PHANGS–HST galaxy sample
NGC 3351 to help establish procedures for the PHANGS– had no existing HST wide-field imaging prior to the start
HST SED fitting pipeline using cigale (e.g., single stellar of the program, NGC 3351 is one of the exceptions. It was
population models to be adopted, treatment of nebular emis- observed by LEGUS in 2014 and was one of the first tar-
sion and dust), and quantify model dependencies in the re- gets to be observed in the PHANGS program in 2019 May.
sults. In Section 5, we take an initial look at the stellar cluster While LEGUS observations were taken to maximize radial
age, mass, and reddening results for NGC 3351 and explore coverage of the galaxy including the nucleus, PHANGS–HST
spatial dependencies as well as the mass functions. Addi- seeks to maximize the coverage of available PHANGS–ALMA
tionally, we explore the application of physically-motivated CO(2–1) mapping, which leads to overlapping but comple-
Bayesian priors. Finally, in Section 6, we discuss possible fu- mentary observations as shown in Figure 1. Exposure times
ture additions and tweaks to the SED modelling pipeline. We are given in Table 1. Star cluster photometry along with
end by summarizing our findings in Section 7. masses, ages, and reddening from SED fitting for sources de-
tected in the area observed by LEGUS (Adamo et al. 2017)
are publicly available through MAST from LEGUS.8 Not only
2 DATA does this make NGC 3351 an excellent choice for a benchmark
analysis, but the galaxy has been well studied due to its cir-
2.1 NGC 3351 HST Imaging cumnuclear star formation (e.g., Buta 1988; Elmegreen et al.
To exercise our SED-fitting procedures, we use pho- 1997), and it is also in the SINGS sample (Kennicutt et al.
tometry of stellar clusters measured from Hubble Space 2003). Hence, there is a wealth of ancillary data available,
Telescope (HST ) N U V -U -B-V -I (F275W-F336W-F438W- which provide independent constraints on parameters of in-
F555W-F814W) imaging of the nearby galaxy NGC 3351. terest here, such as dust reddening and metallicity, albeit at
NGC 3351 is an Sb spiral at 10.0 Mpc (Freedman et al. lower resolutions.
2001) with an approximately solar metallicity (Moustakas NGC 3351 is also an interesting subject for a first look at
the variation of cluster properties in different environments
7 See also Hunt et al. (2019) for a recent benchmark study involv-
ing cigale for the modelling of galaxy SEDs. 8 https://legus.stsci.edu
MNRAS 000, 1–22 (2020)4 J. A. Turner et al.
using the PHANGS–HST dataset, again due to its morpho- 3 BENCHMARK TESTING CIGALE
logical and dynamical structure. This barred spiral galaxy
3.1 CIGALE: Basic Considerations
exhibits a large range in optical surface brightness and lev-
els of obscuration by dust between its inner and outer star- cigale operates by generating a grid of models based on the
forming rings (the latter of which is now completely sampled user’s input parameters. In our case, the model grid samples
with the addition of new PHANGS–HST imaging as shown two free parameters: age and reddening based on our cho-
in Figure 1). sen single-age stellar population (SSP) model, e.g., the BC03
models. The sampling of the age and reddening grids is cho-
sen by the user. For the age grid, we have ten linearly spaced
models for 1 to 10 Myr (∆T = 1 Myr, the highest precision
available to cigale) and 100 evenly log-spaced models for 11
2.2 NGC3351 Star Cluster Photometry to 13 750 Myr (∆ log(T /Myr) ≈ 0.3). Although cluster mass
is an output of the SED modeling, it is not treated as a third
For our SED fitting analysis, we use N U V -U -B-V -I pho- dimension of the model grid. The masses corresponding to
tometry of star clusters which have been identified by the a particular model on the age-reddening grid are determined
PHANGS–HST pipeline, visually inspected and classified. directly from the chosen IMF and star formation history. The
The PHANGS–HST methodology for source detection, can- masses are normalized to 1 M at birth and once cigale fits
didate selection, and cluster classification builds upon the a cluster’s SED based on the age and reddening, the mass
process developed by LEGUS. The LEGUS procedure is de- is appropriately scaled based on the cluster’s luminosity. A
scribed in detail in Grasha et al. (2015) and Adamo et al. fully-sampled IMF is assumed. The effect of a stochastically
(2017), and we give a brief overview here. Source detection sampled IMF is discussed in Section 5.5. Model assumptions
was performed with SExtractor on the V -band image. are listed in Table 2B.
Clusters selected for analysis and whose properties were de- cigale compares the cluster’s photometry with each model
rived via SED fitting were those objects which: (1) had a of the grid and calculates the χ2 value to determine the
concentration index (CI) greater than 1.3 (i.e., a difference in goodness-of-fit. The χ2 value is converted into a likelihood
magnitudes between circular apertures with radii of 3 and 1 via exp(−χ2 /2). Once each model has been tested, cigale
pixels, which indicates that the object is more extended than estimates the best-fit parameters in two ways: simple χ2 min-
a point source); (2) had MV < −6 Vega mags (after aperture imization and a likelihood-weighted mean (see Boquien et al.
correction) and were detected in at least 4 of 5 filters; (3) had 2019, section 4.3). The model with the lowest χ2 is the ‘best-
been visually inspected and classified as either a class 1: sym- fitting’ result and allows for easy comparison with other SED
metric compact cluster, class 2: asymmetric compact cluster, fitting procedures commonly used in the past (e.g., Chan-
class 3: multi-peaked compact association. dar et al. 2010; Adamo et al. 2017). 1σ uncertainties can be
In the PHANGS–HST and LEGUS footprints, we find a calculated by the difference between the best-fitting model
total of 468 clusters (with 133, 166, 166 visually inspected and the models with χ2reduced values of 1 + χ2reduced,min . The
to be class 1, class 2, and class 3 objects using the same likelihood-weighted mean of all the models on the grid is com-
classification criteria as LEGUS). Of these, 136 are within the puted which is used as a Bayesian estimate for the physical
new area of NGC3351 observed by PHANGS–HST (with 18, properties. 1σ uncertainties are determined by the likelihood-
56, and 61 visually inspected to be class 1, class 2, and class 3 weighted standard deviation of all the models.9 Note that
objects). Details of the PHANGS–HST cluster identification while the figures of this paper present the ages and masses
methodology is presented in D. A. Thilker et al. (in prep.) in logarithmic units, cigale performs all analyses in linear
and B. C. Whitmore et al. (in prep.). units.
A detailed comparative analysis of the PHANGS–HST and For the first part of our analysis we examine results based
LEGUS clusters catalogs is presented in D. A. Thilker et al. on the best-fitting (χ2 minimized) values, which facilitates
(in prep.), and comparison with the stellar association cata- comparison to the body of previous star cluster work. Later in
log is presented in K. L. Larson et al. (in prep.). Overall, the Section 5.6, we explore differences when additional Bayesian
PHANGS–HST and LEGUS catalogs for the imaging obser- priors are imposed on the age and mass distributions and how
vations originally obtained by LEGUS for NGC 3351 contain to estimate the cluster properties from the posterior proba-
a comparable number of clusters to MV < −6 Vega magni- bility distribution functions.
tude (after aperture correction) with ∼75 per cent overlap.
Photometry is performed on each cluster with an aperture
radius of 4 pixels which, at the distance of NGC 3351, corre- 3.2 Recovery of Mock Clusters
sponds to a physical scale of 7.7 pc. To account for extended First, to determine how well cluster properties can be con-
emission beyond the 4 pixel radius, an aperture correction strained, we generate mock cluster photometry for known
of 0.68 mag in the V -band is applied (N U V : 0.87 mag, U : cluster ages, masses, and reddenings to estimate how well
0.80 mag, B: 0.71 mag, I: 0.80 mag) independent of cluster cigale recovers these cluster properties. As our starting
profile. Foreground extinction to NGC 3351 due to the Milky point, we adopt the 296 model SEDs (i.e., model N U V , U ,
Way is computed following Schlafly & Finkbeiner (2011),
which adopt Schlegel et al. (1998) reddening maps and the
Fitzpatrick (1999) reddening law with RV = 3.1. The details 9 In other words, we calculate the likelihood-weighted mean of the
of the aperture correction derivation is presented in S. Değer marginalized probability distribution function (PDF) with only a
et al. (in prep.). The median signal-to-noise ratio for a cluster flat, bounded prior. The 1σ uncertainties describe the width of the
in the V -band is ∼45 (min: ∼8, max: ∼310). peak of the PDF.
MNRAS 000, 1–22 (2020)CIGALE for Star Clusters 5
B, V , I fluxes, ages, masses, and reddenings) that best fit with cigale, and compare to results from the SED mod-
(χ2 minimized) the PHANGS–HST visually-classified class 1 eling performed by LEGUS as described in Adamo et al.
and 2 star clusters in NGC 3351 which have photometric de- (2017). For the benchmark testing, we focus only on the 289
tections in all five bands. The mock cluster fluxes are then LEGUS clusters with photometric measurements in all five
produced by randomly selecting a flux from a Gaussian distri- bands. We adopt the same assumptions used to produce the
bution centered on the model flux with a standard deviation LEGUS “reference” catalogs (Adamo et al. 2017); Table 2A
based on the median photometric uncertainty in each band of summarizes the parameters adopted for the benchmark com-
our PHANGS–HST cluster catalog. The median uncertainties parison. Briefly, Adamo et al. (2017) utilized the Padova–
(for photometry within a 4 pixel radius aperture; see D. A. AGB stellar evolution isochrones and the yggdrasil pop-
Thilker et al. in prep.) are 5.02 per cent for F275W, 5.12 per ulation synthesis code (Zackrisson et al. 2011) to generate
cent for F336W, 3.51 per cent for F438W, 2.24 per cent for single-aged stellar population models. The LEGUS work as-
F555W, and 3.21 per cent for F814W. We then run cigale sumes a Kroupa (2001) IMF from 0.1 − 100 M ; the Cardelli
on this mock catalog and compare the resulting best-fitting et al. (1989) Milky Way extinction law; flux from the nebular
values with the ‘true’ input values as shown in Figure 2. continuum and emission lines with a fixed covering fraction
As Figure 2 shows, cluster ages are well recovered across of 0.5; and solar metallicity isochrones. The minimum red-
the sample within the uncertainties except at 1 Myr, at just dening is E(B−V ) = 0 mag and the maximum is set to be
below 10 Myr, and for the oldest clusters. From 10 Myr to E(B−V ) = 1.5 mag with steps of 0.01 mag. The models are
∼30 Myr, the evolutionary tracks loop back onto themselves reddened before being fitted to the observed photometry.
(see Figure 5) which introduces degeneracies of the available Figure 4 provides the residuals when comparing our
SEDs which map to the SSP models at those ages. Across cigale-derived stellar cluster ages and masses to those
the entire sample, the standard deviation of the difference given by LEGUS. The agreement between the LEGUS and
between the ‘true’ and recovered ages, masses, and reddenings CIGALE SED fitting results is good. The median value
are 0.31 dex, 0.18 dex, and 0.09 mag, respectively. There is no of the age ratios, defined as log(AgeCIGALE /AgeLEGUS ), is
significant systematic offset between the true and recovered 0.001 ± 0.017 dex. The median value of the mass ratios, de-
ages. fined as log(MassCIGALE /MassLEGUS ), is 0.003 ± 0.011 dex.
The clusters with large residuals are found to be mostly Looking at the best-fitting SED models of the outliers, we
those with probability distribution functions (PDFs) which do not find poor fitting models (i.e., large χ2 values) or inac-
exhibit bimodality where the young models with high red- curate/unreliable photometry, but we find that the outliers
dening and older models with less reddening are both likely. tend to be faint as seen in Figure 4. In short, cigale is able
We find ∼20 per cent of the estimated cluster sample to have to derive similar physical properties as LEGUS for the vast
bimodal PDFs. Figure 3 shows the distribution of recovered majority of clusters in the test case galaxy NGC 3351, estab-
ages for the bimodal cases as a fraction of the total number lishing cigale as a reliable star cluster SED modeling code
of mock clusters across ten age bins. The grouping of clus- and consistent with previous star cluster SED fitting codes.
ters with true ages around 100 Myr and underestimated age
results have PDFs which are all bimodal. In this case, the
χ2 minimization chose the young mode when the old mode
was the true age. A majority of the clusters with true ages 4 DERIVATION OF PHYSICAL PROPERTIES FOR
at 10 Myr and overestimated age results are bimodal as well. PHANGS–HST STAR CLUSTERS
In this case, the opposite is true; the χ2 minimization chose In this section, we review the process for deriving the masses,
the old mode when the young mode was the true age. The ages, and reddening for PHANGS–HST star clusters with
bimodality causes an increase in the scatter for the estimated cigale. We use the aperture and foreground Milky Way ex-
E(B−V ) versus the true E(B−V ) values. Aside from these tinction corrected photometry and propagate an additional
cases, for the most part, the reddenings are recovered well 5 per cent uncertainty within cigale into the photometric
with a median difference from the ‘true’ reddening value of errors to account for systematic errors in the flux calibration.
0.0 mag with a dispersion of 0.09 mag. The cluster masses are Throughout the rest of the paper, our focus is on compar-
also recovered well across the mock catalog sample within the isons with the class 1 and 2 clusters (i.e., potentially bound),
uncertainties. The median logarithmic mass ratio is 0.01 dex rather than the class 3 compact associations. Cluster classes
with a dispersion of 0.18 dex. Overall, we can expect cigale are defined in the same way as in LEGUS – class 1 clusters
to behave consistently within our photometric uncertainties are symmetric and compact, class 2 clusters are asymmet-
with the exception of the bimodal cases which are discussed ric and compact, and class 3 clusters are multi-peaked com-
in depth in later sections. pact associations. We note that, while we still include class 3
compact associations detected by our cluster pipeline in our
catalogs, and provide visual classifications (D. A. Thilker et
3.3 Comparison with LEGUS SED Modeling al. in prep. and B. C. Whitmore et al. in prep.) and SED
fitting for those objects, we will use a more systematic hi-
As a second method of benchmark testing, we use the pub- erarchical approach (watershed algorithm) for identification
lished photometry10 for the 292 clusters identified by LE- of younger star-forming associations, which is distinct from
GUS in their HST imaging of NGC 3351, fit the photometry the cluster pipeline. This is detailed in K. L. Larsen et al.
(in prep.) and will also include comparisons between age es-
timates using cigale for stellar associations identified with
10 https://archive.stsci.edu/prepds/legus/cluster_ a watershed algorithm and the LEGUS and PHANGS–HST
catalogs/ngc3351.html class 3 objects. The focus on class 1 and 2 clusters for this
MNRAS 000, 1–22 (2020)6 J. A. Turner et al.
4 7
1.5
Estimated log(Mass) [M ]
Estimated log(Age) [Myr]
3 6
Estimated E(B-V)
1.0
2 5
1 4 0.5
0 3
0.0
−1 2
0 1 2 3 4 2 4 6 0.0 0.5 1.0 1.5
True log(Age) [Myr] True log(Mass) [M ] True E(B-V)
Figure 2. cigale best-fitting values compared to the ‘true’ input values. 1σ error bars are given for each cluster’s estimated property and
account for most of the scatter about unity. Cluster ages are well recovered across the sample except for clusters with ‘true’ ages at 1 Myr
(0.25 dex scatter), at around 10 Myr (0.34 dex scatter), and at the oldest ages (0.39 dex scatter). Both the masses and reddenings are
well recovered across the sample.
Table 2. SED Fit Choices
A) LEGUS Benchmark Testing
Star formation history instantaneous burst
Reddening & Extinction E(B−V ) = [0 : 1.5] mag; ∆ = 0.01 mag; RV = AV /E(B−V ) = 3.1
SSP model Yggdrasil Padova-AGB
Metallicity Z = 0.02 (i.e., solar metallicity)
IMF Kroupa; [0.1 : 100] M ; fully sampled
Gas covering fraction 0.5
B) PHANGS–HST
Star formation history instantaneous burst
Reddening & Extinction E(B−V ) = [0 : 1.5] mag; ∆ = 0.01 mag; RV = AV /E(B−V ) = 3.1
Ages [1 : 10] Myr with ∆T = 1.0 Myr; [11 : 13 750] Myr with ∆ log(T /Myr) = 0.3
SSP model Bruzual & Charlot (2003)
Metallicity Z = 0.02
IMF Chabrier (2003); [0.1 : 100] M ; fully sampled
Gas covering fraction 0.0
Table 2. (A) Parameter ranges adopted in the benchmark comparison between cigale and LEGUS SED fits. The extinction curve adopted
for this comparison is from Cardelli et al. (1989) appropriate for the Milky Way. (B) Parameters adopted for PHANGS–HST SED
modelling.
paper makes this cluster sample “exclusive” (see Krumholz tested this method against directly fitting to the SSP models
et al. 2019; Adamo et al. 2020, for discussions on exclusive themselves and verified that the results are consistent. We
versus inclusive cluster samples). also adopt solar metallicities as the PHANGS–HST galaxies
are all approximately solar (Section 2). By adopting a fully-
The set of SEDs available in the model grid is determined sampled IMF, Chabrier (2003) in our case, the SED modeling
by the choice of input parameters. Table 2B summarizes our is “deterministic.”
choices and the following sections discuss these choices. We
study single-aged stellar populations, as the clusters do not
have complex SFHs and, for the purposes of PHANGS sci-
ence, can be effectively modeled by an “instantaneous burst” As given in Section 3.1, the model grid of ages consists
of star formation. With the functionality available in cigale, of ten linearly spaced models from 1 to 10 Myr with ∆T =
we implement this SFH by utilizing the double-exponential 1 Myr and 100 log-spaced models from 11 to 13750 Myr with
SFH module sfh2exp and inputting a very short e-folding ∆ log(T /Myr) ≈ 0.3. We check if any differences arise when
time for the stellar population (a microburst) and a zero mass assuming a fully linearly sampled age grid and find no signif-
fraction of the second/late starburst population. This effec- icant changes to the resulting cluster properties even for the
tively acts as an instantaneous burst of star formation. We bimodal PDF cases.
MNRAS 000, 1–22 (2020)CIGALE for Star Clusters 7
4.1 Single-Age Stellar Population Models & Nebular
19/39 1/2 Emission
0.5
Fraction Within Each Bin
We plan to consistently use the same single-aged stellar popu-
lation models as the baseline for PHANGS–HST stellar clus-
0.4 ter analyses. In this section, we compare two common mod-
4/12 els: BC03 and yggdrasil (Zackrisson et al. 2011), the latter
0.3 of which were adopted for the SED fitting of the LEGUS
20/78 star clusters (Adamo et al. 2017). Tracks from both mod-
els are shown in Figure 5 overplotted on the PHANGS–HST
0.2 class 1 and 2 cluster photometry. Included in the figure are
2/14 the model tracks with and without nebular emission, specified
5/32 by a parameter describing the gas covering fraction. The gas
0.1 3/54 6/47
covering fraction, opposite of the escape fraction, determines
1/16 the fraction of the Lyman continuum photons that ionize the
0/2 surrounding gas. Nebular continuum and line emission can
0.0
0 1 2 3 4 significantly contribute to the observed fluxes within broad-
log(Age) [Myr] band filters, especially for spatially integrated observations
of star-forming galaxies (e.g., Anders & Fritze-v. Alvensleben
2003; Groves et al. 2008; Boquien et al. 2010; Reines et al.
Figure 3. Histogram of the recovered ages of the bimodal cases as 2010; Pellegrini et al. 2020). PHANGS–HST observations,
a fraction of the total number of mock clusters within each bin. however, benefit from the combination of HST ’s angular reso-
The fraction of bimodal cases to the total number clusters is given lution and relative proximity of PHANGS galaxies, such that
at the top of each bin. The majority of the bimodal cases are star clusters and surrounding HII regions can often be spa-
concentrated at around 10 Myr and 100 Myr. tially disentangled, except for (1) crowded regions where it
is still often unclear which star clusters are responsible for
ionizing a given patch of Hα emission, and (2) clusters with
compact Hα morphologies (Hannon et al. 2019). The yg-
0.5
gdrasil tracks with zero covering fraction (i.e., no nebular
emission) are relatively consistent with the BC03 tracks with
0.0 no nebular emission; the main difference is in between 5 and
1.00 −2 −1 0 1 2
24 10 Myr where the yggdrasil tracks dip to much redder col-
0.75 ors than the BC03 tracks. The addition of nebular emission
log(MassCIGALE/MassLEGUS)
23
is insignificant for most ages in both yggdrasil and BC03.
0.50 As expected, only for the youngest ages (∼0−5 Myr) is there
22
0.25 a difference: a hook-like feature towards redder colors in the
MF555W
21 yggdrasil track with a covering fraction of a half while the
0.00 BC03 track with nebular emission branches towards slightly
20
bluer colors.
−0.25
19 While both the yggdrasil and BC03 tracks show good
−0.50 agreement with the photometry in color-color space as is ap-
18 parent in Figure 5, we decide to adopt the BC03 tracks be-
−0.75
cause they were originally designed to match galactic star
17 clusters as well as reproduce the colors of star clusters in the
−1.00
−2 −1 0 1 2 0.0 0.5
Magellanic Clouds. The yggdrasil stellar population models
log(AgeCIGALE/AgeLEGUS)
were developed for constraining high redshift galaxies (Zack-
risson et al. 2011).11
Figure 4. The residuals in cigale versus LEGUS stellar cluster We check how the inclusion of a nebular emission compo-
ages and masses. Both approaches utilize the yggdrasil stellar nent into the SED fitting affects the results. In Figure 5, we
tracks with a 50 per cent covering fraction (Table 2A) and both see the BC03 model tracks only differ slightly at very young
the cigale and LEGUS values are based on χ2 minimization. Dot- ages when including the nebular emission. Figure 6 shows the
ted lines mark ±0.2 dex around perfect agreement. Data are col- best-fitting SED models for three example PHANGS–HST
ored by V -band (F 555W ) Vega magnitude. The histogram above clusters. The grey dashed line is the best-fitting SED model
the scatter plot shows the distribution of the age ratios and the while including a nebular emission component. In this case,
histogram to the right shows the distribution of the mass ratios.
we assume an ionization parameter log U = −2.0, line width
The median age ratio is 0.001 ± 0.027 dex. The median mass ratio
of 300 km s−1 , and a covering fraction fcov = 0.5 (i.e., 50 per
is 0.003 ± 0.011 dex. Clusters with poor agreement are generally
found to be faint with large photometric uncertainties. cent of the Lyman continuum photons ionize the surround-
ing gas). The first two clusters in Figure 6 are young, blue
clusters where the nebular emission could have the largest
11 We note that both the BC03 and yggdrasil models do not
account for possible binary stars within the clusters.
MNRAS 000, 1–22 (2020)8 J. A. Turner et al.
impact on the SED fitting. The first cluster’s SED fit with -2.0 1 Myr
nebular emission gives a larger reduced χ2 value (8.2) than
compared to the non-nebular fit (2.44). For the second clus- 10 Myr
ter, we find similar reduced χ2 values between the nebular and -1.5
F336W - F438W
non-nebular SED fits. As a contrast to these young clusters,
the best-fitting SED for an old, red cluster is also given in 30 Myr
-1.0 5 Myr
the bottom panel of Figure 6. The difference between SEDs 50 Myr
with and without nebular emission is negligible. Therefore,
for the PHANGS–HST sample, we use SED fitting without a -0.5
100 Myr
nebular emission component. We note that Krumholz et al.
500 Myr
(2015) perform a similar analysis and find the resulting clus- 0.0
ter properties are robust to choice of evolutionary track and
the inclusion of a nebular emission. 10 Gyr
0.5 1 Gyr 5 Gyr
4.2 Dust
For the PHANGS–HST model grids, we make use of a Milky -2.0
Way-like extinction curve from Cardelli et al. (1989) with
F275W - F438W
RV = 3.1. Krumholz et al. (2015) find that Milky Way- -1.0
like extinction curves provide better results over other mod-
els for solar metallicity, face-on spiral galaxies when work- 0.0
ing with deterministic models. We allow the internal redden-
ing to range from E(B−V ) = 0 to 1.5 mags in 0.01 mag
steps – the same range adopted by LEGUS.12 For refer- 1.0
ence, the drift scan spectroscopy for NGC 3351 from Mous- Yggdrasil fcov = 0.0
takas et al. (2010) indicates E(B−V ) for nuclear (aperture of 2.0 Yggdrasil fcov = 0.5
∼6 arcsec2 ), circumnuclear (400 arcsec2 ), and large-scale ra- BC03 fcov = 0.0
dial strips (∼few arcmin2 ) of 0.03±0.05 mag, 0.64±0.02 mag 3.0 BC03 fcov = 0.5
and 0.55±0.07 mag, respectively. Though the regions sampled
by Moustakas et al. (2010) exhibit smaller values of redden- −0.5 0.0 0.5 1.0 1.5 2.0
ing than E(B−V )max = 1.5 mag, we have chosen to keep F555W - F814W
the maximum value since sight lines to some individual clus-
ters will inevitably exceed the large-scale spatial averages.
As a sanity check, we perform a test SED fitting run with Figure 5. Top: F 336W −F 438W vs F 555W −F 814W (U −B vs
a maximum reddening of 3.0 mag allowed and find only two V −I) color-color diagram for a collection of theoretical single-age
stellar population models, along with the PHANGS–HST stellar
clusters with a reddening greater than 1.5 mag (1.72 and
clusters for NGC 3351. Magnitudes are in the Vega system. The
1.74 mag). Therefore, we decide to use a maximum value of stellar clusters have been aperture corrected as well as corrected
E(B−V ) = 1.5 mag over smaller values to allow for individ- for foreground Milky Way extinction. The BC03 (green) and yg-
ual sight lines with large reddening. gdrasil (orange) tracks are shown both with (dashed) and with-
It could be possible to derive accurate maximum red- out (solid) nebular emission. The y-axis has been flipped so the
dening values for the youngest (.10 Myr) stellar popula- top left-hand corner of the diagram is the ‘bluest’ and the bot-
tions using the PHANGS–MUSE integral field unit (IFU) tom right-hand corner is the ‘reddest’. The top panel annotates
data and Balmer decrement measurements. The IFU maps various ages along the SSP tracks; ages where the tracks deviate
cover an area of the galaxies similar to our HST footprint significantly from each other are pointed out with two arrows. The
but, the ground-based MUSE ∼100 angular resolution is too class 1 and 2 star clusters are plotted in grey. Both panels include
a reddening vector for AV = 1 mag as well as a typical error bar
coarse to be directly applicable to our HST-resolution maps
for the cluster photometry computed from the median uncertainty
(∼0.0800 ). Still, the AV maps generated from Balmer decre- in the colors. Bottom: Same as the top panel except with F 275W
ment measurements from PHANGS–MUSE (E. Emsellem et (N U V ) instead of F 336W (U ).
al. in prep.) can be used as a independent check of our
allowable reddening values. E(B−V ) values for each pixel
in the PHANGS–MUSE map are computed by assuming
RV = AV /E(B−V ) = 4.05 (Calzetti et al. 2000). The distri-
bution of the reddening values by pixel is given in Figure 7 how to deal with dust extinction to break the age–reddening
which shows a roughly power-law distribution with a median degeneracy. A star cluster can appear to be red due to age
value of 0.171 mag and a maximum value of 1.24 mag. This or due to reddening by dust. In our sample, we find ∼70 (20
distribution aligns fairly well with the chosen reddening pa- per cent) of the clusters appear to be bimodal in the age
rameters for the SED fitting. and reddening PDFs. There are a number of possible ways
A well known problem in all star cluster SED fitting work is to move towards breaking the degeneracy. In Section 5.6, we
make use of Bayesian priors as an attempt to help limit the
number of degenerate cases. See Section 6 for a discussion on
12 The cluster photometry is corrected for foreground Milky Way additional methods we might employ in the future to break
extinction before the SED fitting. the age–reddening degeneracy in the PHANGS–HST sample.
MNRAS 000, 1–22 (2020)CIGALE for Star Clusters 9
−1
−2
(9.7 ± 3.1) × 103 M 1 ± 2 Myr 0.2 ± 0.0 mag reddening
log(fν ) [mJy]
−1.5
−2.0
(1.0 ± 2.9) × 104 M 9 ± 2 Myr 0.1 ± 0.0 mag reddening
−2
−4
(6.2 ± 0.5) × 104 M 1.3 ± 1.1 Gyr 0.0 ± 0.5 mag reddening
200 400 600 800 1000
Wavelength [nm]
Figure 6. Example cigale fits (black line) for three PHANGS clusters (two young, one old) in NGC 3351. Blue circles mark the observed
fluxes and orange diamonds indicate the fluxes extracted from the best-fit model. Error bars denote 3σ uncertainties on the observation
and model fluxes. In some cases, the error bars are smaller than the data markers. Colored strips in the top panel illustrate the filter
bandpass rectangular widths. The black solid line is the best-fitting SED model using the parameters outlined in Table 2B; the grey
dashed line is the same SED model while including the nebular emission component (fcov = 0.5). Best-fitting star cluster masses, ages,
and reddenings are given for each cluster. A 100×100 false-color (B-V -I) image of the cluster is given to the right of each SED. The same
image stretch is used for all three images to allow for easy visual comparison.
4.3 Use of Fluxes vs. Magnitudes in SED Fitting erage, much larger uncertainties for the ages, masses, and
reddenings.
SED fitting can be carried out inputting either linear flux Understanding how the uncertainties in our flux measure-
units (e.g., da Cunha et al. 2008) or logarithmic magnitude ments are distributed—preferentially Gaussian in linear or
units (e.g., Chandar et al. 2010). We explore here if significant logarithmic units—is essential for determining if fitting in
differences arise in key extracted output parameters (clus- flux or magnitudes is more accurate. However, we find the
ter age, mass, and reddening) when utilizing fluxes versus distribution of the uncertainties to be similarly non-Gaussian
magnitudes as input to the SED fits. To perform the SED for both fluxes and magnitudes for all five filters; all distribu-
fitting in logarithimic magnitude units, we use the cigale tions display similar positive skewness with long tails out to
branch SSPmag which expects the input photometry to be of high uncertainties. We cannot come to a conclusion on using
the form 2.5 log(fν ). The uncertainties must be properly con- fluxes or magnitudes based on their uncertainty distributions.
verted from linear fluxes. Comparing the best-fitting results A more thorough study of the photometric uncertainties is
from fluxes to those from magnitudes reveals they are quan- presented in D. A. Thilker et al. (in prep.). An advantage
titatively very similar. The median age residual, defined as of working in linear fluxes is in the case of non-detections
log(Ageflux /Agemag ), is 0.000 ± 0.026 dex. The median mass (i.e., insignificant positive flux measurements or even slightly
residual is −0.001 ± 0.011 dex, and the median reddening negative measurements). In linear fluxes, meaningful infor-
residual is 0.000 ± 0.009 mag. The main difference between mation can still be fed into the SED fitting using flux upper
the two results is that the magnitude-based fits have, on av- limits which is not as easily accomplished with magnitudes.
MNRAS 000, 1–22 (2020)10 J. A. Turner et al.
MUSE Pixels 101
Star Clusters
100
10−1
7 0 1
Inner ring 2 3 4
Globular Clusters
10−1 6
log(Mass) [M ]
5
10−2 4
3
10−3 1.5 0 1 2 3 4 10−1 101
1.0
E(B−V)
10−4
0.0 0.2 0.4 0.6 0.8 1.0 1.2 1.4
E(B-V) 0.5
Figure 7. Normalized logarithmic distributions of E(B−V ) val-
0.0
ues for the pixels (0.200 in size) across the PHANGS–MUSE map
of NGC 3351 as determined by Balmer decrement measurements
0 1 2 3 4 10−1 101
(red) and the individual star cluster best-fitting reddenings as
log(Age) [Myr]
found by our SED fitting (blue). Only the reddening values of star
clusters found where the Balmer decrement has been measured are
used. Colored dashed lines mark the median values for each distri- Figure 8. Best-fitting cluster masses and reddenings versus ages for
bution: 0.171 mag for the MUSE pixels and 0.18 mag for the star the visually-classified class 1 and 2 clusters of NGC 3351. Clusters
clusters. of the inner star-forming ring are shown as blue stars and visually
identified globular cluster candidates are shown as red circles. Log-
arithmic histograms beside each axis give the distributions of the
Additionally, at low signal-to-noise, errors in magnitude units cluster properties. Typical error bars, computed from the median
of property uncertainties, are given in the corner of the two pan-
are not expected to be symmetric and the χ2 minimization
els. The inner ring star clusters are found to be mostly young and
assumes errors to be symmetric and Gaussian (Hogg et al.
massive with a large range in reddening. All but one of the glob-
2010). Hence, these assumptions will not hold when using log- ular cluster candidates are found to have ages > 100 Myr and to
arithmic units in the low signal-to-noise regime. Given these be massive following along the MV = −6 Vega mag observational
results, we choose to perform all the SED fitting in linear limit (grey line).
fluxes.
fitting results for NGC 3351 using PHANGS–HST photom-
4.4 Summary of SED Modelling Assumptions
etry and the cigale SED fitting as described in Section 4.
We summarize our SED modelling assumptions here and Figure 8 shows the derived cluster masses and reddening val-
in Table 2B. The age model grid consists of ten linearly- ues as a function of the cluster ages as well as the distribu-
spaced models from 1 Myr to 10 Myr with ∆T = 1 Myr tions of the cluster properties. We find a large population of
and 100 log-spaced models from 11 Myr to 13 750 Myr with young clusters at 1 Myr with reddening values ranging from
∆ log(T /Myr) ≈ 0.3. We assume a Milky-Way like extinction 0.05 mag to 0.74 mag. The most highly reddened clusters are
curve (Cardelli et al. 1989) with RV = 3.1. The reddening within ages from ∼3 Myr to 10 Myr. A noticeable dearth
E(B−V ) model grid spans from 0 mag reddening to 1.5 mag of clusters at ages from 10 and 30 Myr is found due to the
with ∆E(B−V ) = 0.01 mag. This gives a final age-reddening inherent degeneracy of the SSP model at these ages where
model grid with 16 610 models. Each model on the grid has clusters of similar colors can be found to be either above or
a corresponding mass based on the BC03 SSP track and the below 10 Myr with corresponding reddening. The χ2 min-
fully-sampled Chabrier (2003) IMF. We assume solar metal- imization seems to prefer the younger models with slightly
licity and a gas covering fraction of zero. higher extinctions. We also find a trend of the older clus-
ters to be more massive, an expected selection effect, due to
the absolute magnitude limit of the observations of around
MV = −6 mag. As star clusters grow older, they will become
5 RESULTS & DISCUSSION
less luminous due to the evolution of the stellar population.
We provide a first presentation of the star cluster ages, Given the morphology of NGC 3351, we can break down
masses, and reddenings based on the χ2 minimized best- the galaxy into distinct regions, allowing us to probe different
MNRAS 000, 1–22 (2020)CIGALE for Star Clusters 11
but the bulge is home to significantly older star clusters on
average. Over time, star clusters tend to migrate away from
their natal gas clouds and disperse more uniformly with age
over the galaxy (Gieles & Bastian 2008; Bastian et al. 2009;
Davidge et al. 2011; Kruijssen et al. 2011; Grasha et al. 2019).
The bulge has few signatures of current star formation, hence
any star clusters found in that area must be old enough to
Inner Ring
have had the time to migrate there or have been left in place
by past star formation.
We show the spatial distribution of the clusters and their
properties across the galaxy in Figure 10. The majority of
Bulge the clusters found in the outer ring and disk have masses less
than 104.5 M . Higher mass clusters are generally found to
be in the stellar bulge and inner star-forming ring. The ma-
Outer Ring Outer Disk jority of clusters in the inner ring are young as well. Kruijssen
(2014) and Reina-Campos & Kruijssen (2017) predict higher
mass clusters at small galactocentric radii due to higher ISM
pressure which our result supports. These young, massive
4 clusters can also be formed from the funneling of gas into
the center by the galactic bar (Swartz et al. 2006). Approxi-
mately 70 per cent of the clusters have reddenings less than
log(Age) [Myr]
3 0.3 mag (AV < 0.93 mag). There is most likely a population
of faint, low mass clusters in the inner ring which we are miss-
ing due to the bright background level. For the more heavily
2 reddened and dust-obscured clusters, a high-resolution study
with James Webb Space Telescope would provide a more ro-
bust examination of the dust. We note that the most massive
1 cluster is found in the outer ring.
There are valid concerns regarding the ages of intermedi-
ate and older (>100 Myr) clusters due to the age-reddening
degeneracy. In Section 5.3, we will discuss the how the SED
0 fitting handles clusters which are likely old globular clusters.
(43) e (32
) (124) (103) Here, we check on the intermediate-aged (100 Myr to 1 Gyr)
Ring Bulg Ring Disk
Inner Ou t e r
Out e r clusters based on their location in color-color space (Figure 5)
and location within the galaxy. A cut in color-color space
is made to isolate the clusters redder than (i.e., below) the
Figure 9. Top: Color image of NGC 3351 with the four regions BC03 track at ∼50 Myr. This gives 135 clusters with 25 clus-
outlined and labeled. Bottom: Box and whisker plot showing the ters (∼ 20%) found to have ages of 10 Myr and younger and
distribution of the star cluster ages within the four regions moving corresponding high reddening values. Nine of these clusters
radially outward from the center: the inner star-forming ring (43 are found within the dusty inner ring of the galaxy mean-
clusters), the inter-ring or bulge region (32 clusters), the outer star- ing they are likely highly reddened as the SED fitting results
forming ring (124 clusters), and the outer disk beyond the outer
suggest. One cluster is found in the bulge and the remaining
ring (103 clusters). The blue lines in each box mark the median
15 are found in the outer ring and disk. In these regions, it is
best-fitting cluster age and the red triangles mark the mean. Boxes
extend from the lower to upper quartiles and the whiskers extend unlikely to have the high reddening as returned by the SED
to the minimum and maximum ages found in each region. fitting. Overall, this represents only 5% of the clusters (16 out
of the total 302) which are likely intermediately aged (based
on the location in the color-color diagram) but given incor-
star-forming environments within a single galaxy. Environ- rect young (12 J. A. Turner et al.
11◦4400000
4.0
3.5
4300000
3.0
log(Age) [Myr]
2.5
4200000
2.0
1.5
4100000
log(M/M ) ≤ 3.5 1.0
3.5 < log(M) ≤ 4.5
4.5 < log(M) ≤ 5.5
0.5
5.5 < log(M) ≤ 6.5
4000000 log(M) > 6.5
0.0
10h44m04s 00s 43m56s 52s
Figure 10. Color image of NGC 3351 with the location of the clusters overplotted. Clusters are color-coded by best-fitting log(Age/Myr).
Data point symbols differentiate between five log(Mass/M ) bins. The majority of clusters found in the outer ring and disk fall in the
two lowest mass bins (downward triangles and circles). Higher mass clusters (stars and crosses) are generally found to be in the stellar
bulge and the inner star-forming ring. The most massive cluster (upward triangle) is located in the outer ring.
gions as discussed in the previous section. We find better 5.2 Clusters with HII regions
agreement of the best-fitting cluster ages in the outer ring
(median residual = 0.050 ± 0.125 dex; N = 70 clusters)
and outer disk (0.0 ± 0.077 dex; N = 67) than compared
to the inner ring (−0.125 ± 0.131 dex; N = 33) and bulge HST Hα imaging was obtained by Hα–LEGUS for the LE-
(0.313 ± 0.217 dex; N = 29). For the bulge clusters, the best- GUS pointing of NGC 3351 (PI: R. Chandar; S. Hannon et al.
fitting reddening is slightly lower compared to LEGUS with 2020, in prep.). We adopt the following classification scheme
an median residual of −0.040±0.070 mag, while the inner ring for the Hα emission for each star cluster: (i) Hα emission di-
(0.070 ± 0.039 mag), the outer ring (0.005 ± 0.037 mag), and rectly on top of cluster, (ii) Hα emission in a ring around the
outer disk (0.060 ± 0.021 mag) show good agreement if not cluster, (iii) Hα emission possibly associated with the cluster,
slightly higher. The masses are well matched with LEGUS or (iv) no Hα detected. We check our ability to accurately
across all regions of the galaxy. recover the ages of these young clusters by looking at the
clusters which have strong Hα emission directly on top of the
We note that in a recent study of LEGUS star clusters cluster or in a ring around the cluster. There are 60 class 1
in NGC 4449, Whitmore et al. (2020) show issues with LE- and 2 clusters with such Hα emission which implies that they
GUS cluster ages and reddenings. In particular, LEGUS finds must be young (< 10 Myr). The PHANGS–HST SED mod-
young ages for spectroscopically confirmed old globular clus- elling recovers best-fitting ages of 10 Myr and younger for 93
ters. This issue should be considered while comparing our per cent of these clusters which bodes well for the validity of
cluster results with those from LEGUS. our results for young clusters.
MNRAS 000, 1–22 (2020)CIGALE for Star Clusters 13
-2.0 deed likely to be globular clusters. We note that the SED
fitting derived ages for most of the candidate globular clus-
ters are younger than the expected ∼10 Gyr (Figure 8). This
-1.5 is a well-known problem with most SED fitting approaches to
F336W - F438W
age-dating cluster populations when the focus is on the young
-1.0 population. It is caused by two effects: (1) using high metal-
licity model isochrones appropriate for young, but not old,
populations; (2) the age-reddening degeneracy which allows
-0.5 the SED fitting to find a better fit with large reddening values
even in cases where it is not physically reasonable (e.g., there
0.0 is very little dust in the bulge region used to select the candi-
date globular clusters). These two effects can compound each
other since the use of the wrong isochrones for low-metallicity
0.5 Globular Clusters objects results in a gap between the main grouping of points
in the color-color diagram (most clearly seen in the bottom
panel of Figure 11) and where the solar-metallicity isochrone
-2.0 would predict a 10 Gyr cluster should be. This increases the
number of cases where a better fit is found using a large red-
dening value (i.e., backtracking down the reddening vector)
F275W - F438W
-1.0 to an age of around 100 Myr on the isochrone (see Figure 5).
These issues are discussed in more detail in Whitmore et al.
0.0 (2020) where the same phenomena of understanding ages for
old globular clusters is found for sample of spectroscopically
1.0 age-dated globular clusters in NGC 4449.
Figure 11 also shows sub-solar metallicity BC03 SSP
2.0 Solar Metallicity tracks. We find roughly half of the globular cluster candidates
1/5 Solar benefit (i.e., return ages ∼10 Gyr) from the use of a lower
metallicity model. The other half of the candidates must be
3.0 1/50 Solar
suffering from the age-reddening degeneracy. We test this by
−0.5 0.0 0.5 1.0 1.5 2.0 enforcing the reddening E(B − V ) to zero (following Whit-
F555W - F814W more et al. 2020) and the globular cluster candidates with
ages originally around 100 Myr are shifted 1 Gyr and older.
Given these results, we must be cautious using the SED de-
Figure 11. Color-Color diagram similar to Figure 5 highlighting the rived ages of globular clusters due to both the metallicity and
visually-identified globular clusters candidates (red circles). The age-reddening degeneracy effects.
green track is the BC03 SSP model with solar metallicity used in
the SED fitting. The orange track is the BC03 SSP model with 1/5
solar metallicity and the purple track is 1/50 solar metallicity. Red- 5.4 Mass Functions
dening vectors are given in each panel along with typical error bars
The shape of the star cluster mass function provides im-
on the cluster colors computed by the median uncertainties of the
photometry. As expected, globular cluster candidates are found at
portant information on the cluster formation and evolution.
the oldest end of the SSP track. However, the sub-solar metallicity These distributions can be described to first order by a power
tracks provide a better match to the globular cluster candidates’ law, dN/dM ∝ M β , where β ≈ −2 has been found for the
colors. This is especially apparent in the bottom panel where the young cluster populations in a number of galaxies (e.g., Lada
grouping of globular cluster candidates occupy the region at the & Lada 2003; Portegies Zwart et al. 2010; Krumholz et al.
very end of the 1/50 solar metallicity track. 2019). There have also been claims for an exponential-like
downturn or cutoff at the high end of the mass function (e.g.,
Larsen 2009; Adamo et al. 2015; Johnson et al. 2017; Messa
et al. 2018; Mok et al. 2019; Adamo et al. 2020). This up-
5.3 Globular Clusters
per mass cutoff is often modelled by a Schechter function,
We have visually identified a sub-sample of candidate glob- dN/dM ∝ M β exp(−M/M∗ ), where M∗ is the cutoff mass.
ular clusters within our star cluster sample for NGC 3351 Here, we are interested in addressing two questions: What is
in order to check if the results provided by our SED fitting the power-law index β for young clusters in NGC 3351 and
are as expected for globular clusters, i.e., old (∼10 Gyr) with is there evidence for an upper mass cutoff?
little reddening. This is done by selecting clearly resolved ob- We perform a least squares fit of the form: log dN/dM =
jects with similar red colors in the bulge of the galaxy (see β logM + const to the distributions of the visually-classified
Figure 9). We note that nearly all the objects in this region class 1 and 2 clusters of NGC 3351 which is shown in Fig-
are red in color with almost no blue (i.e., young) objects in ure 12 as the red, dashed line and recorded in each panel.
the vicinity. The results for β range from about −1.4 to −2.2, consistent
Figure 11 shows the location of the globular cluster candi- with the range found for cluster populations in other nearby
dates in the UBVI color-color diagram. The globular cluster galaxies (e.g., Fall & Chandar 2012), with the possible ten-
candidates all group together in a tight region near the old dency to be somewhat shallower at the youngest ages. We
end of the SSP track which demonstrates that they are in- also find a best fit value of β = −1.75 ± 0.23 for clusters in
MNRAS 000, 1–22 (2020)You can also read