PREDICTION OF 'ARTIFICIAL' URBAN ARCHETYPES AT THE PEDESTRIAN-SCALE THROUGH A SYNTHESIS OF DOMAIN EXPERTISE WITH MACHINE LEARNING METHODS - arXiv
←
→
Page content transcription
If your browser does not render page correctly, please read the page content below
P REDICTION OF ‘ARTIFICIAL’ URBAN ARCHETYPES AT THE
                                                          PEDESTRIAN - SCALE THROUGH A SYNTHESIS OF DOMAIN
                                                                  EXPERTISE WITH MACHINE LEARNING METHODS

                                                                                                          A P REPRINT
arXiv:2106.15364v2 [physics.soc-ph] 2 Jul 2021

                                                                                                                              ∗
                                                                                                        Gareth D. Simons

                                                                                                         A BSTRACT
                                                             The vitality of urban spaces has been steadily undermined by the pervasive adoption of car-centric
                                                             forms of urban development as characterised by lower densities, street networks offering poor
                                                             connectivity for pedestrians, and a lack of accessible land-uses; yet, even if these issues have been
                                                             clearly framed for some time, the problem persists in new forms of planning. It is here posited that
                                                             a synthesis of domain knowledge and machine learning methods allows for the creation of robust
                                                             toolsets against which newly proposed developments can be benchmarked in a more rigorous manner
                                                             in the interest of greater accountability and better-evidenced decision-making.
                                                             A worked example develops a sequence of machine learning models generally capable of distinguish-
                                                             ing ‘artificial’ towns from the more walkable and mixed-use ‘historical’ equivalents. The dataset
                                                             is developed from morphological measures computed for pedestrian walking tolerances at a 20m
                                                             network resolution for 931 towns and cities in Great Britain. It is computed using the cityseer-api
                                                             Python package which retains contextual precision and preserves relationships between the variables
                                                             for any given point of analysis.
                                                             Using officially designated ‘New Towns’ as a departure point, a series of clues is developed. First, a
                                                             supervised classifier (Extra-Trees) is cultivated from which 185 ‘artificial’ locations are identified
                                                             based on data aggregated to respective town or city boundaries through a process of iterative feedback.
                                                             This information is then used to train supervised and semi-supervised (M2) deep neural network
                                                             classifiers against the full resolution dataset, where locations are assessed at a 20m network resolution
                                                             using only pedestrian-scale information available to each point of analysis. The models broadly align
                                                             with intuitions expressed by urbanists and show strong potential for continued development.

                                                 Keywords computation · data-science · land-use analysis · machine learning · morphometrics · network analysis ·
                                                 spatial analysis · unsupervised ML · urban analytics · urban planning · urban morphology · urbanism

                                                 1       Prediction of urban archetypes with deep neural networks

                                                 In 2012, Krizhevsky, Sutskever, and Hinton (2012) introduced a revolutionary machine learning model: it combined
                                                 massive datasets, convolutional layers, and deep-learning to attain best-in-class classification accuracies on the ImageNet
                                                 database, consisting of more than 15 million images in over 22,000 categories. The ideas and techniques were not
                                                 necessarily new, but the authors noted that the depth of their neural network, in this case, five convolutional layers and
                                                 three fully connected layers, was pivotal to the model’s performance. The subsequent upsurge in the use of ever-larger
                                                 datasets combined with ever-deeper neural networks has led to machine learning models with human — or better than
                                                 human — levels of performance. Deep learning has attained a near-mythical status and is a prevalent feature in the
                                                 rapid development of AI, with Silver et al. (2017) going on to claim that AlphaGo, an AI underpinned by deep learning,
                                                 had learned ‘superhuman proficiency’ in the game of Go from scratch without the aid of human knowledge.
                                                  On closer scrutiny, claims that such systems are truly capable of developing human-like intelligence, especially from
                                                 ‘tabula rasa’, tend to be overstated, and further breakthroughs will likely be required before truly generalisable artificial
                                                     ∗
                                                         Benchmark Urbanism gareth@benchmarkurbanism.com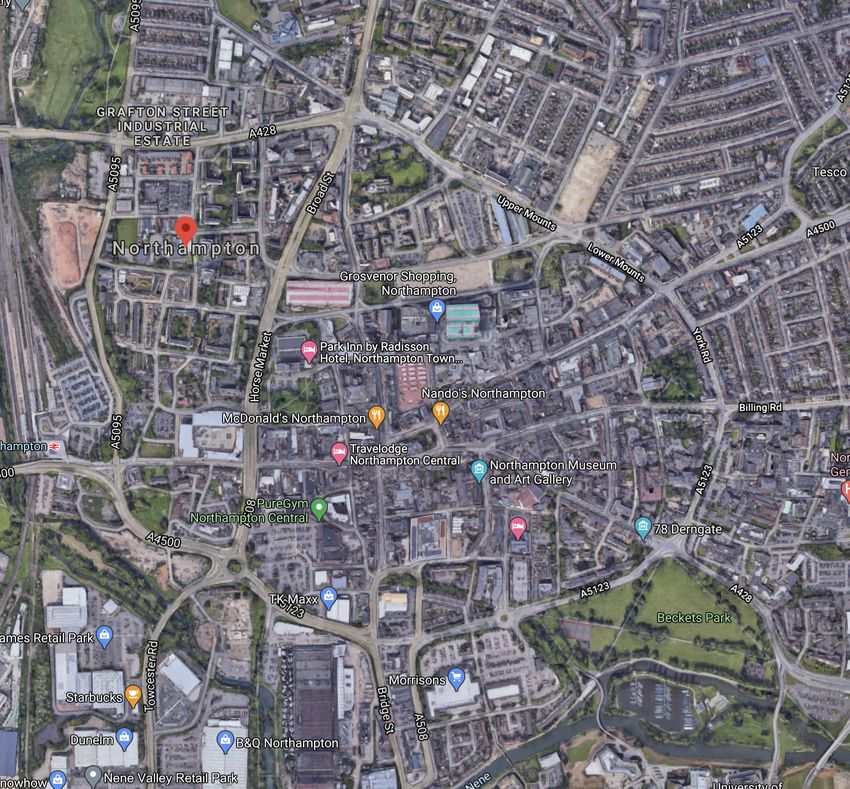
Prediction of artificial urban archetypes                             A P REPRINT

 intelligence can become a reality (Mitchell 2021). Marcus (2018b) argues that AlphaGo’s intelligence is not truly
‘innate’: human knowledge has entered the system in the form of a Monte Carlo tree search algorithm, thus empowering
 the system with the techniques necessary to learn solutions specific to the challenge at hand. Further, the model’s
 intelligence is not generalisable: learning other games implies retraining, and the model cannot solve broader classes
 of problems that young children may trivially solve. The tremendous volumes of data and the great difficulty in
 generalising deep neural nets to other problems draws sharp contrasts to the human mind (Sinz et al. 2019) whose
 innate structures appear to facilitate an ability to form rapid and powerful abstractions that generalise well to varied
 forms of problem-solving. These challenges underscore an important and oft understated reality: deep learning is a
 tremendously powerful, but also fickle, tool (Marcus 2018a). It is brittle by nature: data-hungry, narrowly focused, and
 easily fooled. Neural networks may learn patterns but cannot ‘see the forest for the trees’. If representative patterns are
 not present in the data or go undetected by a model’s structure or loss function, the model ‘does not know what it does
 not know’. Such models may consequently behave contrary to best intentions by being needlessly complex (Rudin and
 Radin 2019), biased or ignorant of unrepresented or unfairly represented classes within the data (Rudin and Radin 2019;
 Corbett-Davies and Goel 2018), and are generally difficult to develop or reproduce (Henderson et al. 2017).
The proverbial notion that machine learning is an autonomous technology that can magically conjure meaning out of
meaningless jumbles of data and that deep-learning infused AI and robotics technologies will soon usher in a utopian
future must therefore invoke cynicism. However, it is also important to note that nascent machine learning methods
remain amongst the most powerful and valuable tools currently at the disposal of the scientific community and that
many of the perceived shortcomings are attributable to a disconnect between the hype associated with the models
and an otherwise more realistic understanding of their nature and limitations. The contributions of humans to model
development tends to be understated (Marcus 2018b): for these models to be meaningful and trustworthy, they require
large amounts of domain-specific information imparted at various stages of the development process. In this sense, ML
is a powerful sidekick, but one that is potentially prone to naive assumptions or misbehaviour if left entirely to its own
devices. The models require interaction and oversight in a process akin to a ‘dance with data’. Datasets have to be
selected and prepared in a manner that accurately represents the nature of the data that we want the algorithms to learn,
targets and loss functions coerce models in the right direction, and regularisation methods and testing procedures are
necessary to ensure that models are capable of generalisation to unseen samples in a manner that is realistic and fair for
the task at hand.
Urban scientists consequently need to be aware of how datasets, data science methods, and machine learning models
may ultimately affect day-to-day decisions and policies (Duarte 2020), and how that misinformed models may end up
being used to justify courses of action affecting city-citizens and the urban environment for the worse. There is a danger
in chasing misguided accuracy metrics or ‘buzz-friendly’ marketing pitches: models can be accurate, but meaningless.
A simple and not uncommonly encountered example is applying simple error or accuracy rates to unbalanced datasets.
Class imbalances are regularly faced by real-world data analysis situations when labels for one class substantially
overpower another’s presence. Credit card fraud data provides an extreme example, where the minority class (fraudulent
transactions) may be infinitesimally more diminutive than the majority class. When training a classifier against an
unbalanced dataset using simple accuracy rates, the algorithm may opt to completely ignore the minority class (e.g.
inferring that all credit card transactions are not fraudulent) while claiming an accuracy approaching 100%.
Various strategies exist for the temperance of class imbalance problems: undersampling the majority class, oversampling
the minority class, adjusting the costs associated with losses from respective classes (Chawla, Japkowicz, and Kotcz
2004); use of more nuanced accuracy metrics such as Receiver Operating Characteristic curves (the true positive rate
plotted against the false positive rate) or F1 scores (weighted average of precision and recall) (García V. and Mollineda
and S 2009); and calibration techniques for correcting the distributions of probabilistic classifications (Pozzolo et al.
2015). Nevertheless, the application of such techniques requires intervention through the role of an informed data
scientist who, in turn, needs to be aware of the potential presence of such imbalances and how overlooking these may
have far-reaching ramifications. This example reflects the broader issue: the development of predictive machine learning
models may require a substantial degree of nurturing, testing, and oversight to understand how the model ‘thinks’ and
‘reacts’ to the data and to guard against unintended forms of behaviour. Visualisation methods can thus be important
because they facilitate comprehension of how the models work while allowing domain experts, who may not have direct
knowledge of how these models function at a lower level, an opportunity to provide feedback on suspicious forms of
predictive behaviour.
Whereas the misuse of data science methods for any variety of problematic workflows or end-purposes exists, these
methods also hold the potential for scalable and rigorous forms of sensible analysis if used with sufficient safeguards
and rigorous oversight from those with detailed knowledge of the domain of interest. Contrarily, it bears emphasis that
throngs of architects, urban designers, planners, engineers, civic officials, and NIMBYs have, in turn, been directly
responsible for a trail of ill-conceived urban interventions, and this cannot be blamed on statistics or models so much as
a human proclivity towards reductionism and self-interest. Although humans are better than machines at generalising

                                                             2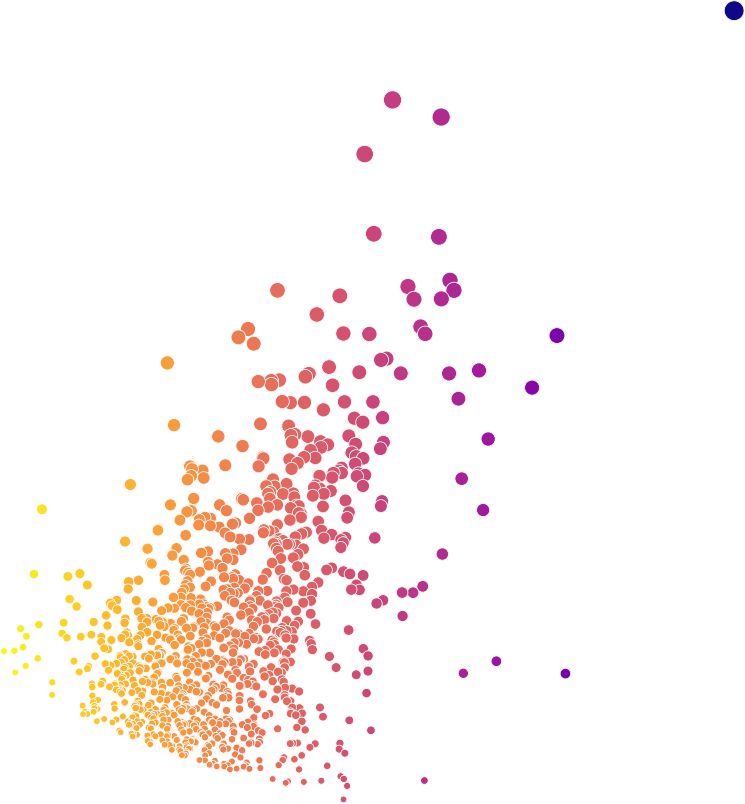
Prediction of artificial urban archetypes                             A P REPRINT

problems, they can also be susceptible to wistful narratives or easily waylaid by idealistic pursuits or profit-driven
motives. Further, even where skilled and perceptive urban designers and planners are well-aware of implicit biases
underpinning problematic planning proposals, they may be at a loss to bolster better-informed decision-making against
hearsay or political pressures. Against this backdrop, an interesting question can be posed: can we connect the strong
suits of domain experts, who may intuitively understand the issues at hand, to the strong suits of algorithms capable
of exhaustively exploring and laying bare the solution space in a robust and scalable manner? How might tools that
synthesise qualitative knowledge with quantitative approaches build an accountable evidence base within the context of
politically wrangled decision-making processes?

2   Historical context of New Towns
Ever since the backlash commenced against (to use Christopher Alexander’s term) ‘artificial’ towns and cities (Jacobs
1961; Alexander 1967), modernity’s failed planning experiments have been easy to reject out-of-hand as unsuccessful and
misguided. An endless stream of discourse continues to reinforce this narrative while lamenting the state of artificially
planned communities, perhaps best epitomised by discussions framing the broken planning paradigms enshrined by
suburban sprawl (Katz 1994; Langdon 1994; Duany et al. 2000; Ellin 1999). Nevertheless, the undermining of the
pedestrian and public realm continues unabated (Transport for New Homes 2018) and, as has been argued for Smart
Cities, idealised conceptions of urban life re-imagined in the name of engineered efficiencies echo a hauntingly familiar
refrain (Greenfield 2013; Hill 2013; Townsend 2013; Sterling 2014).
Whereas these forms of development are doubtlessly problematic, it is also true that they are often guided by good, if
waylaid, intentions. From this perspective, historic discussions surrounding the formulation of the New Towns Act of
1946 may appear more nuanced than might be expected. Second World War bombing raids had left untold destruction on
London’s urban fabric. The magnitude of this damage is hard to comprehend or convey and is perhaps best epitomised
by a historic photograph: ‘St. Paul’s Survives’, wherein St. Paul’s Cathedral — which by sheer luck had been spared
substantial damage — stands surrounded by destruction and smoke emanating from nearby fires (Wikipedia 2020b).
By War’s end, bombing damage from air-raids had greatly exacerbated any existent need for housing; meanwhile,
Letchworth and Welwyn Garden Cities, for which development had commenced in the decades before the War, provided
templates for the development of new housing peripheral to London, and it is against this backdrop that discussion on
the New Towns Act took place. Parliamentary discussions (UK Parliament 2020) were wide-ranging and touched on
several themes that would not be out of place in contemporary discussions. Some participants, such as the Minister of
Town and Country Planning, advanced arguments against the expansion of existing towns and in favour of development
from scratch:

             Many towns have built new housing estates on the outskirts. These have largely failed in their
         purpose of providing a better life for their people, and have almost invariably become dormitories
         consisting of members of one income group, with no community life or civic sense. Today there is
         a need for additional houses, possibly equal in number again to those built between the wars. Are
         these to be built on the outskirts of our towns, with the same lack of planning and ill consequences as
         before? If so, I dread to think what sort of place this still fair land of ours will be in 10 or 15 years
         time. This is our last chance. Many of the houses now to be built must be carefully located in new
         self-contained communities, if the existing evils are not to be aggravated.

Others, such as Viscount Hinchingbrooke, argued for the redevelopment of existing towns and cities:
             Surely, what we want to do is to remodel our old towns and prevent the gradual invasion of the
         Countryside by the extension of these towns, leaving behind great masses of derelict property. I am
         afraid that we may be only too easily exchanging that policy of unplanned ribbon development for
         a policy of planned cannibalism. What ought to be done is to go to the full extent in remodelling
         existing towns. Many of my hon. Friends represent London constituencies. . . and we know that
         their problem is appalling. They are faced with the most acute housing shortage, and they sense the
         admirable desire of the people for better conditions. Cannot it be done within the framework of the
         Greater London Plan by developing blitzed sites, by moving the people from the houses they now
         inhabit to the blitzed sites while remodelling their own houses, leaving the parkways and open spaces
         proposed by Professor Abercrombie? My point is that the whole thing can be done by remodelling
         the Greater London area without any extensions of the number of new towns.
Themes range from congestion; to Plato and oligarchies; to the need for a diversity of industry for sufficient employment
and resilience; to the need for intermingled societal classes and how the “friendliness and neighbourliness of the slums
is lost when displacing inhabitants to new estates”; to “golf courses made available for all”; and, even, beheadings:

                                                            3
Prediction of artificial urban archetypes A P REPRINT
My researches on new towns go back to the time of Sir Thomas More. He was the first person I
have discovered to deplore the “suburban sprawl” and in his “Utopia” there are 54 new towns, each
23 miles apart. Each town is divided into four neighbourhoods, each neighbourhood being laid out
with its local centre and community feed centre. Incidentally, Sir Thomas More was beheaded, but
that must not be regarded as a precedent for the treatment of town planners. . .
The New Towns Act of 1946, and interventions since mandated the creation of officially designated ‘New Towns’
for urban growth and expansion and were to be overseen by development corporations. Though ideally ‘greenfield’
development, numerous instances entailed the expansion of existing towns, though in either case tended towards lower
density single-family development and the separation of land-uses. The majority of New Towns took root from the
1940s through the 1960s, and information about their formation can be found interspersed across numerous issues of
official publications such as The London Gazette (The Stationary Office 2020), though more conveniently collated lists
(including references to respective London Gazette issues) can also be found (Wikipedia 2020a).
Subsequent discussion will here refer to ‘artificial’ urban archetypes and ‘historical’ equivalents. The ‘artificial’
archetype includes ‘New Towns’, though also applies to newer forms of development more broadly, including character-
istics in keeping with car-centric, single-family suburban enclave, big-box-store-and-parking-lot morphologies. At the
risk of confusion, the ‘historic’ archetype does not preclude newer developments as long as they reflect characteris-
tics — such as granular, walkable, mixed-use morphologies — that would not be out of place in historical forms of
development.
3 Overview of the New Towns dataset
The data used for training the artificial town classifiers is based on a subset of locations drawn from a larger dataset
spanning 931 towns and cities in England and Wales. The boundaries are identified per a network percolation method
based on road intersections method described by Arcaute, Molinero, et al. (2016) after which the census population
statistics are aggregated to each boundary, and locations with fewer than 5,000 inhabitants are subsequently discarded.
In a later step, all New Town and new-town-like locations are identified, and the subsequent analysis proceeds by further
discarding all locations with populations larger or smaller than this band of town sizes; however, prior to this step, the
whole dataset is used and will now be introduced by way of some high-level observations.
A = cP where c = 0.26 = 0.83 60
log(A) = log(P) + c where = 0.87 c = 1.95
105
50
City Area (hectare - excluding parks)
104 40
30
Population density
103
P.O.I. falloff at pop xmin = 5000 20
102
104 105 106 107 10 20 30 40 50 60 70
City Population City Density (persons per hectare)
Figure 1: Left: Scatter plot and regression for population and area. Right: Population density
Town areas increase sublinearly in relation to population sizes (compare Batty 2013, p.41). Densities tend to be higher
for larger cities, but this does not preclude smaller towns from having relatively high densities, and ample variation
is evident in Figure 1. The definition of city land-area here excludes large encircled undeveloped parcels (such as
4Prediction of artificial urban archetypes A P REPRINT
100
CCDF F(x) = P(X > x) = 1 F(x)
10 1
10 2
10 3
powerlaw: xmin = 10515.0, = 1.91 powerlaw: xmin = 50000.0, = 2.09
lognormal: = 3.57, = 2.9 lognormal: = 0.52, = 3.32
data data
10 4 4
10 105 106 107 104 105 106 107
Population xmin = 10515.0 Population xmin = 50000.0
Figure 2: Left: CCDF for city population vs. Lognormal and Powerlaw fit with Xmin = 10, 515. Right: CCDF for city
population vs. Lognormal and Powerlaw fit with Xmin = 50, 000
undeveloped hills or significant green spaces), which would otherwise unduly inflate the area variable. Ordinary least
squares (OLS) regression on log-transformed variables results in a power-law scaling parameter of α = 0.87. However,
non-linear least-squares curve-fitting (Levenberg-Marquardt algorithm) applied to untransformed variables suggests a
scaling parameter of α = 0.83. Whereas these parameters provide some sense of the scaling relation between area and
population, it is important to note that these values are inherently sensitive to boundary definitions (Cottineau et al.
2017).
In keeping with Zipf’s Law, the larger a population, the less frequent. This is often ascribed to a power-law distribution
in the form of p(x) = Cx−α (e.g. M E J Newman 2006). Other candidate distributions should be considered before
their exclusion (Stumpf and Porter 2012; Clauset, Rohilla Shalizi, and M. E. J. Newman 2009), which is here performed
with the aid of the powerlaw Python package (Alstott, Bullmore, and Plenz 2014). The package automatically derives
an xmin by minimising the Kolmogorov-Smirnov test statistic distance between the data and the fit, here deriving
xmin = 10, 515. The package includes methods for comparing candidate distributions using loglikelihood ratios,
whereby the lognormal can here be identified as superior to the power-law fit. This marginally remains the case when
using a higher xmin = 50, 000 threshold (per, Arcaute, Hatna, et al. (2015)). Visual inspection of the Complementary
Cumulative Distribution Function (CCDF) in Figure 2 reveals that the data follows the lognormal distribution closely,
but only up to populations ≈ 1, 000, 000 after which the populations of Leeds, Birmingham, Manchester, and London
show divergence towards the longer tail of the power-law fit-line.
The above provides a brief overview of scaling relationships for town areas and populations, but the attention now shifts
to an overview of statistics for, specifically, locally computed metrics. Data is sourced from Ordnance Survey Open
Roads, Ordnance Survey Points of Interest, and Office for National Statistics census datasets from which a variety of
centrality, land-use accessibility, mixed-use, and population density measures is derived. These are computed point-by-
point for each street intersection at a selection of pedestrian distances ranging from 200m to 1600m. This workflow is
performed with the cityseer-api Python package (Simons 2021a), which employs a local windowing-methodology
with distances computed directly over the network and with aggregations performed dynamically and with respect to
the direction of approach, thus preserving the relationships between the variables and retaining contextual precision.
Figures 3 and 4 show kernel density estimate plots: larger boundaries tend to have longer tailed distributions and higher
median values for local population densities, local closeness centralities, and local mixed-uses. The same variables
are averaged and plotted against global city populations in scatterplots 5 and 6, with the mean for bundled values
for all New Towns compared to equivalently sized towns. Average local population densities are not substantially
different between New Towns and ‘other’ towns, but more notable differences emerge once comparing local closeness
centralities and, especially, the degree of local land-use diversity. This pattern repeats with lower local accessibilities to
5Prediction of artificial urban archetypes A P REPRINT
land-uses in general. The differences likewise persist when comparing the correlations between the variables, as shown
in Figures 7 and 8, indicating a weakening of the associations between population densities, network centralities, and
land-use diversity for New Towns.
KDE plots for population density by distance threshold
global x = 50.868 global x = 239.2 global x = 501.188 global x = 1217.842
london x = 88.43 london x = 376.21 london x = 803.571 london x = 2078.183
Towns & cities by population size
Letchworth Letchworth Letchworth Letchworth
Cambridge Cambridge Cambridge Cambridge
London London London London
0 250 500 750 1000 0 500 1000 1500 0 500 1000 1500 2000 0 1000 2000 3000 4000
200m 400m 800m 1600m
Figure 3: KDE for local population densities to all city boundaries from smallest (blue) to largest (red)
4 Detection of artificial towns with machine learning models
Thus far, the plots shown are reliant on the official designations, in this case, 22 New Town labels. The starting
dataset also contains an additional 27 locations that have been identified as ‘Expanded Towns’. Whereas the respective
designations may in some cases be clear-cut, the interpretations thereof are not necessarily so. This conundrum can
be illustrated with the use of some examples. The town of Yate (Figure 9a), though not designated as a New Town,
is characteristic of artificial forms of planned development and features a shopping mall surrounding by parking lots,
an automobile-centric roadway system, and clusters of residential enclaves. Conversely, the town of Northampton
(Figure 9b), though designated as a New Town in 1968, retains parts of a historic core that had existed well before this
time.
6Prediction of artificial urban archetypes A P REPRINT
KDE plots for weighted mixed-use richness by distance threshold
global x = 0.179 global x = 1.376 global x = 3.173 global x = 8.515
london x = 0.313 london x = 1.996 london x = 4.795 london x = 13.343
Towns & cities by population size
Letchworth Letchworth Letchworth Letchworth
Cambridge Cambridge Cambridge Cambridge
London London London London
0 5 10 0 10 20 30 0 20 40 0 20 40 60 80
200m 400m 800m 1600m
Figure 4: KDE for local mixed-uses to all city boundaries from smallest (blue) to largest (red)
4.1 Fleshing-out town boundary designations
Potential inconsistencies between the character of the respective towns and their official designations and large degrees
of variation within respective town boundaries mean that New Town designations offer an incomplete starting point for
teaching machine learning classifiers how to distinguish between artificial and historic urban archetypes. Therefore,
the first step is to flesh out the dataset by identifying the bulk of other locations that have new-town-like or expanded-
town-like characteristics. The identification of artificial from historical development is a relatively trivial endeavour for
domain experts, though this faces two problems: it is, firstly, a tremendously tedious process in the case of reviewing
931 locations; secondly, it is challenging to comparatively review such a large number of locations without some form
of a yardstick against which these locations can be compared. To this end, a machine learning algorithm is used as
a ‘sidekick’ to speed up the identification of candidate town boundaries, which can then be inspected and classified
accordingly.
As shown in the preceding plots, there is a tendency for New Towns to lag other towns when comparing bundled
averages for pedestrian-scale metrics such as closeness centralities, land-use accessibilities, and mixed-use diversity.
This data, complete with existing classifications (i.e. new town and expanded town designations), is fed to a classifier
tasked with learning and subsequently identifying artificial forms of development from historic. The model will then
repeat back many of the already classified New Towns and expanded-towns and report false positive classifications for
other locations that show similar characteristics. These false positives are reviewed with the aid of domain knowledge
to identify candidate locations for designation as artificial forms of development, the labels for the town boundaries
are updated accordingly, and the process subsequently repeats. The model initially identifies the more extreme cases
of artificial development and, in later iterations, increasingly identifies locations such as historic cores that were later
surrounded to varying degrees by suburban sprawl. In reality, few historic locations have not been affected to some
degree, and there is no clear cut-off at which towns are either mostly artificial or primarily historic. The determination
of this threshold is left to human judgement, and the model aligns accordingly.
7Prediction of artificial urban archetypes A P REPRINT
new towns = 2.465
Brighton
Nottingham
Redditch
Basildon
Birmingham
Newcastle
Leceister
Closeness dmax = 200m 7 equiv. towns = 2.645
6
5
4
3
Welwyn Garden City
Hemel Hempstead
Newton Aycliffe
2
Milton Keynes
Bournemouth
Peterborough
Northampton
Skelmersdale
Washington
Portsmouth
Manchester
Warrington
Stevenage
Cwmbran
Newtown
Liverpool
Bracknell
Sheffield
Runcorn
Peterlee
Crawley
Hatfield
London
Harlow
Telford
Bristol
Corby
Leeds
1
104 105 106 107
City population by town / city boundary
new towns = 39.941
Brighton
Nottingham
Redditch
Basildon
Birmingham
Newcastle
Leceister
120 equiv. towns = 46.808
Closeness dmax = 1600m
100
80
60
40
Welwyn Garden City
Hemel Hempstead
Newton Aycliffe
Milton Keynes
Bournemouth
Peterborough
Northampton
Skelmersdale
Washington
Portsmouth
Manchester
Warrington
Stevenage
20
Cwmbran
Newtown
Liverpool
Bracknell
Sheffield
Runcorn
Peterlee
Crawley
Hatfield
London
Harlow
Telford
Bristol
Corby
Leeds
104 105 106 107
City population by town / city boundary
Figure 5: Local simplest-path harmonic closeness centrality by city size
The above process leads to the identification of 185 towns (Figure 10) consisting of either artificial development or a
relatively substantial amount of artificial development added to previously existing. The final model attains a 96%/89%
train/test f1-score (weighted average of precision and recall) based on a 20% test-set; however, it is important to not read
too much into the accuracy metric in this instance for several reasons: firstly, as described above, the exact threshold at
which the model delineates between mixtures of artificial and historical development is not clear-cut; secondly, the use
of an iterative procedure means that there is leakage from the test set into the training set through the process of human
interaction when updating the dataset in response to newly identified locations. This is a known and intentional aspect
of this procedure, and this stage of the model development is not intended for generalisation to other applications.
The classification task has been performed with a Scikit-learn Extra-Trees classifier (Pedregosa et al. 2011) which
was selected for its speed and classification performance for the given dataset and task at hand. Several other classifiers,
particularly Random Forests, showed similar (if slower) performance and would likewise be suitable for the current
analysis step. Extra Trees classifiers consist of an ensemble of decision trees which filter data through binary decision
steps to predict an outcome: starting from a single node, the classifier consequently builds a tree-like structure capable of
filtering data into distinct bundles of classifications. Decision trees are grown using algorithms employing one of several
techniques, though the intuition is that each node seeks a splitting point for a given feature that would subsequently
reduce the ‘impurity’ of the data passing through that step, e.g. Gini impurity or cross-entropy for classification tasks,
or mean-squared-error for regression tasks. Despite their simplicity, decision trees can fit complex non-linear data but
suffer a tendency to overfit and can produce notoriously noisy results. They consequently function better in ensembles
— such as Extra Trees — which reduce variance by averaging between collections of the inherently noisy, but low bias,
decision trees (Hastie, Tibshirani, and Friedman 2013; Géron 2017; Raschka 2016). Hyperparameters were selected
using a cross-validated grid-search, giving a final Extra Trees ensemble of 500 estimators using the entropy criterion
and a maximum tree depth of 10.
8Prediction of artificial urban archetypes A P REPRINT
new towns = 0.355
Brighton
Nottingham
Redditch
Basildon
Birmingham
Newcastle
Leceister
1.2
equiv. towns = 0.471
Hill wt. q = 0 dmax = 200m
1.0
0.8
0.6
0.4
Welwyn Garden City
Hemel Hempstead
Peterlee Aycliffe
Milton Keynes
Bournemouth
Peterborough
Northampton
Skelmersdale
Washington
Portsmouth
Manchester
Warrington
0.2
Stevenage
Cwmbran
Newtown
Liverpool
Bracknell
Sheffield
Runcorn
Crawley
Newton
Hatfield
London
Harlow
Telford
Bristol
Corby
Leeds
104 105 106 107
City population by town / city boundary
new towns = 8.961
Redditch
Basildon
Brighton
Nottingham
Birmingham
Newcastle
Leceister
equiv. towns = 11.437
Hill wt. q = 0 dmax = 1600m
20
15
10
Welwyn Garden City
Hemel Hempstead
Peterlee Aycliffe
Milton Keynes
Bournemouth
Peterborough
Northampton
5
Skelmersdale
Washington
Portsmouth
Manchester
Warrington
Stevenage
Cwmbran
Newtown
Liverpool
Bracknell
Sheffield
Runcorn
Crawley
Newton
Hatfield
London
Harlow
Telford
Bristol
Corby
Leeds
104 105 106 107
City population by town / city boundary
Figure 6: Local mixed-uses by city size
4.2 Tapping into the full resolution data with a deep neural network
The first step, which resorted only to pedestrian-scale metrics averaged to town boundaries, is to a large degree sufficient
to distinguish artificial development from historical in a sense that is arguably consistent with human observations on a
town-by-town basis. However, it lacks spatial specificity, and its utility is limited to averaged bundles of data. Further,
as already described above, the delineation between artificial and historic archetypes is not always entirely clear-cut:
even the most ‘historical’ of towns are in reality somewhat mixed, with newer residential enclaves, business parks,
and shopping malls having been added to varying degrees. Therefore, it would be preferable to apply this analysis
directly at the scale of localised points on the road network instead of bundled averages aggregated to town boundaries
so that variations between artificial and historic archetypes can be explored at the level of streets and neighbourhoods.
Regardless of scale, it is advantageous to adopt a more nuanced perspective dropping the binary yes/no designations of
‘artificialness’ in favour of probabilities that indicate the degree to which particular locations, neighbourhoods, or towns
may reflect different morphologies.
For this step, a more expansive dataset is used: it contains points sampled at 20m intervals on the road network with the
same (as before) centrality, land-use, mixed-use, and population metrics computed at a range of pedestrian distances for
each point. Points are only included if they belong to town boundaries with populations falling within the population
band of artificial towns identified in the previous step; this results in a dataset containing approximately 5.2 million
points. All points within artificial town boundaries are labelled accordingly, and a classifier then attempts to learn
a mapping from the input variables to the labelled classification. Due to these variances within towns, a minority
of cases now arise where blatantly artificial development has been labelled as historic, or vice-versa. However, the
momentum established by the majority of data points is nevertheless sufficient to steer the model in the correct direction.
Consequently, the model learns to associate patterns occurring predominately in one or the other category with a higher
degree of confidence, whereas patterns that feature prominently in both artificial and historic archetypes will trigger a
more ambiguous outcome.
9Prediction of artificial urban archetypes A P REPRINT
Closeness centrality correlated to mixed-uses
new towns r = 0.193
Basildon
Brighton
Nottingham
Redditch
Birmingham
Newcastle
Leceister
0.6 equiv. towns r = 0.289
spearman dmax = 200m
0.4
0.2
0.0
Welwyn Garden City
Hempstead
Newton Aycliffe
Milton Keynes
Bournemouth
Peterborough
Northampton
Skelmersdale
Washington
Portsmouth
Manchester
Warrington
Stevenage
Cwmbran
Newtown
0.2
Liverpool
Bracknell
Sheffield
Runcorn
Peterlee
Crawley
Hatfield
London
Harlow
Telford
Hemel
Bristol
Corby
Leeds
104 105 106 107
City population by town / city boundary
1.0 new towns r = 0.642
Brighton
Redditch
Basildon
Nottingham
Birmingham
Newcastle
Leceister
equiv. towns r = 0.733
spearman dmax = 1600m
0.8
0.6
0.4
Welwyn Garden City
Hempstead
Newton Aycliffe
Milton Keynes
Bournemouth
Peterborough
Northampton
Skelmersdale
Washington
Portsmouth
Manchester
0.2
Warrington
Stevenage
Cwmbran
Newtown
Liverpool
Bracknell
Sheffield
Runcorn
Peterlee
Crawley
Hatfield
London
Harlow
Telford
Hemel
Bristol
Corby
Leeds
104 105 106 107
City population by town / city boundary
Figure 7: Correlations for local simplest-path harmonic closeness centrality and local mixed-uses by city size
The classifier used for this step is based on a deep neural net with four hidden layers feeding a sigmoid activation output
layer producing the probability associated with the degree of artificiality. Aggressive regularisation is applied (50%
dropout) to ensure that the model does not ‘short-cut’ by attempting to overfit the data. This strategy is combined with
spatially compartmentalised train/validation sets (75%/25%) to prevent spatial leakage of information from the training
set into the validation set. Neural networks confer several advantages: they tend to outperform linear methods; scale
relatively well to large datasets, and do not suffer the sometimes severe performance penalties associated with other
non-linear strategies such as polynomial features or kernel-based methods; their architecture is inherently flexible in
that the model is free to transform, isolate, and combine themes within the data; and their implementation is easily
adapted to specific model architectures or workflows when using a library such as Tensorflow (Abadi et al. 2016). A
more detailed description of neural networks is provided in Simons (2021b).
Four artificial towns are plotted to Figure 11: Milton Keynes, Stevenage, Letchworth, and Crawley. The first line
shows the input classifications derived from the boundaries identified in the previous step; the second line shows
the output probabilities from the DNN model. Areas with the most robust probability of being artificial (deep red)
predominately include big-box-like districts, car-centric commercial areas, and suburban enclaves with low walkable
access to land-uses. Areas with lower probabilities of being artificial (and therefore higher probabilities of being
compatible with historic) include shopping areas more akin to walkable high streets and suburban areas with improved
access to walkable land-uses such as schools or retail. In this regard, it can be seen that certain pedestrian-intensive
retail zones such as Letchworth’s Leys Ave. are capable of emulating a mix of walkable land-uses in a manner that is
not dramatically removed from historic towns. The same holds for some residential regions within walking distance of
functional land-uses such as schools or food stores.
Four historic towns are likewise plotted to Figure 12: York, Cambridge, Hitchin, and Dorchester, the latter of which
is included so that Poundbury can be compared. In these cases, the more walkable and mixed-use historic cores of
York, Cambridge, and Hitchin are associated with higher probabilities of being historical (bright blue). In contrast,
10Prediction of artificial urban archetypes A P REPRINT
Population correlated to mixed-uses
new towns r = 0.012
Brighton
Nottingham
Redditch
Basildon
Birmingham
Newcastle
Leceister
0.4 equiv. towns r = 0.041
spearman dmax = 200m
0.3
0.2
0.1
0.0
0.1
Welwyn Garden City
Hempstead
0.2 Newton Aycliffe
Milton Keynes
Bournemouth
Peterborough
Northampton
Skelmersdale
Washington
Portsmouth
Manchester
Warrington
Stevenage
Cwmbran
Newtown
Liverpool
Bracknell
Sheffield
Runcorn
Peterlee
Crawley
Hatfield
London
0.3
Harlow
Telford
Hemel
Bristol
Corby
Leeds
104 105 106 107
City population by town / city boundary
1.0 new towns r = 0.235
Brighton
Nottingham
Redditch
Basildon
Birmingham
Newcastle
Leceister
equiv. towns r = 0.4
0.8
spearman dmax = 1600m
0.6
0.4
0.2
0.0
Welwyn Garden City
Hempstead
Newton Aycliffe
0.2
Milton Keynes
Bournemouth
Peterborough
Northampton
Skelmersdale
Washington
Portsmouth
Manchester
Warrington
Stevenage
Cwmbran
Newtown
Liverpool
Bracknell
Sheffield
Runcorn
Peterlee
Crawley
Hatfield
London
0.4
Harlow
Telford
Hemel
Bristol
Corby
Leeds
104 105 106 107
City population by town / city boundary
Figure 8: Correlations for local population density and local mixed-uses by city size
Yate Northampton
Imagery ©2020 Google, Imagery ©2020 Getmapping plc, Infoterra Ltd & Bluesky, Maxar Technologies, Map data ©2020 Imagery ©2020 Google, Imagery ©2020 CNES / Airbus, Getmapping plc, Infoterra Ltd & Bluesky, Maxar Technologies, Map data ©2020
(a) Although not officially designated as a New Town, (b) Designated a New Town in 1968, fragments of the
Yate displays many features consistent with artificial town centre display characteristics consistent with
forms of planned development. earlier historical development.
Figure 9: Discerning historic from artificial forms of development.
11Prediction of artificial urban archetypes A P REPRINT
Abingdon, Addlestone, Amesbury, Andover, Ashford, Aylesbury, Banbury, Bargoed, Barry & Gibbons Down, Basildon,
Basingstoke, Baughurst, Belah, Bexhill, Bicester, Bishops Cleeve, Bodmin, Bognor Regis, Bordon, Brackley, Bracknell,
Braintree, Brandon & Meadowfield, Bridgend, Broadmeadows, Broadway & Littlemoor, Bromsgrove, Brough,
Burgess Hill, Burnley, Burntwood, Bury St Edmunds, Calne, Cambourne, Cambourne & Redruth, Canvey Island,
Carcroft, Carterton, Castleford & Normanton, Chadwell St Mary, Chapeltown, Chippenham, Cinderford, Clacton
On Sea, Clevedon, Coalville, Copperhouse, Corby, Cramlington, Crawley, Cwmbran, Daventry, Deeside, Didcot,
Downside, Droitwich, Dunmow, Eastleigh, Eaton Ford, Ellesmere Port, Euxton, Fair Oak, Farnborough, Farncombe,
Felixstowe, Gainsborough, Gloucester, Grantham, Grays, Hadfield & Brookfield, Hailsham, Hammonds Green,
Harlow, Harwich, Hastings (& Bexhill), Hatfield, Haverhill, Haywards Heath, Hemel Hempstead, High Wycombe,
Hipswell, Honiton, Horley, Horsham, Hoyland, Huntingdon, Keynsham, Kidderminster, Kidlington, Killamarsh,
Kings Lynn, Kingsteignton, Kirkby, Larkfield, Leabrooks, Lee-on-the-Solent, Leighton Buzzard, Letchworth (Garden
City), Leyland, Littlehampton, Llandudno Junction, Locks Heath, Lowton, Luton, Maghull, Melksham, Mid Norfolk,
Mildenhall, Milton Keynes, Moons Moat South, Morton, Mount Sorrel & Environs, New Addington, Newbury,
Newhaven Town, Newton Aycliffe, Northampton, Northwich, Nuneaton, Peterborough, Peterlee, Plymstock, Port
Talbot & Neath, Primethorpe & Broughton Astley, Raunds, Redditch, Rochford, Rotherham, Rugeley, Runcorn,
Rushden, Ryton & Crawcrook, Sandy, Seaton Delaval, Shepton Mallet, Shirehampton & Avonmouth, Sittingbourne,
Skelmersdale, Slough, Snodland, South Woodham Ferrers, Southwater, St Neots, Stafford, Stanford-le-Hope, Stevenage,
Stocksbridge, Stowmarket, Sudbury, Swadlincote, Swallownest, Swanley, Swindon, Tamworth, Taunton, Taverham,
Telford, Thetford, Tidworth, Tiverton, Tonbridge, Trowbridge, Vickerstown, Warrington, Washington, Wath Upon
Dearne & environs, Wellingborough, Welwyn Garden City, West Ravendale, Westwells & Pickwick, Widnes, Winsford,
Winshill, Witham, Wombourne, Wymondham, Yate, Yeovil
Figure 10: List of locations deemed as predominately artificial development
newer forms of peripheral development, variously including morphologies such as suburban enclaves, big-box stores,
and business parks, veer towards artificial archetypes instead (red). Poundbury, a planned development that has been
designed to emulate specific traditional urban morphological characteristics, shows that newer forms of development
can buck the trend by adopting a more granular, mixed-use, and walkable character.
The upper line of Figure 13 shows the distribution of probabilities and a scatterplot of probabilities aggregated by
town for the DNN model. As may be expected, towns such as Grays, Stevenage, Crawley, Burnley, Slough, Milton
Keynes, Luton, and Bracknell take the dubious distinction of being amongst the most artificial. In contrast, older
towns such as Scarborough, Chesterfield, Halifax, Margate, York, Sunderland, Norwich, Blackpool, and Birkenhead
feature on the opposite end of the spectrum. Interestingly, historical towns with larger populations, such as Blackpool,
Birkenhead, and Eastleigh, show clear expanses of planned development; however, unlike the more recent planned
developments of the 20th century, these locations demonstrate older planning influences containing enmeshed street
networks and assortments of land-uses that have more readily been intermingled with residential. Conversely, as is the
case with Cambridge, towns with picturesque historic cores that may have been expected to feature more prominently
in the historical category can be held back by newer peripheral development. Examples include business and industrial
districts, residential enclaves, and larger-scale forms of institutional development that fragment the urban fabric while
leaving little room for granular land-uses to take root.
Whereas the model points in the right direction, there are situations that can be confounding on closer scrutiny. These
are likely attributable to three scenarios. The first is the case of murky exemplars, where certain types of newer land-use
morphologies such as light industrial or big box stores can feature relatively prominently even in historic towns. The
model may therefore deduce that these morphologies are, to a certain degree, not entirely out of place in historical
locations. The second situation may be due to the inclusion of larger pedestrian thresholds (up to 1600m), in which
case the model may override impressions given by an immediately adjacent street (e.g. an apparently walkable retail
street) due to more distant considerations (such as a lack of nearby population densities). A third situation may be
attributable to probability distributions, where potentially ambiguous locations may skew in one direction or the other.
These are not insurmountable challenges and can be addressed through subsequent research by using semi-supervised
methods involving smaller sets of curated exemplars and consideration for methods to calibrate probabilities to sets of
qualitatively selected locations as a form of benchmark.
12Prediction of artificial urban archetypes A P REPRINT
New Development: localised predictions of newer vs. historic development
Predictions by boundary
Milton Keynes Stevenage Letchworth Crawley
DNN local predictions
Milton Keynes Stevenage Letchworth Crawley
DNN extracted labels (input to M2)
Milton Keynes Stevenage Letchworth Crawley
M2 local predictions
Milton Keynes Stevenage Letchworth Crawley
0% 20% 40% 60% 80% 100%
Probability of "artificial" development
Figure 11: Comparative predictive methods for selected artificial towns: The top row shows all local points labelled
according to the containing town boundary. The second row shows the outcome of the deep neural network, the
third-row shows which points are fed to the M2 model in a supervised capacity. The bottom row shows the outputs
from the M2 model.
13Prediction of artificial urban archetypes A P REPRINT
Historic towns: localised predictions of newer vs. historic development
Predictions by boundary
York Cambridge Hitchin Poundbury / Dorchester
DNN local predictions
York Cambridge Hitchin Poundbury / Dorchester
DNN extracted labels (input to M2)
York Cambridge Hitchin Poundbury / Dorchester
M2 local predictions
York Cambridge Hitchin Poundbury / Dorchester
0% 20% 40% 60% 80% 100%
Probability of "artificial" development
Figure 12: Comparative predictive methods for selected historic towns: The top row shows all local points labelled
according to the containing town boundary. The second row shows the outcome of the deep neural network, the
third-row shows which points are fed to the M2 model in a supervised capacity. The bottom row shows the outputs
from the M2 model.
14n n
100000
150000
200000
250000
300000
350000
400000
100000
120000
50000
20000
40000
60000
80000
0
0
0%
0%
20%
20%
40%
40%
60%
60%
80%
80%
M2 - Distribution of new (vs. historic) probabilities
DNN - Distribution of new (vs. historic) probabilities
100%
100%
15
M2 - Average of new (vs. historic) probabilities by town DNN - Average of new (vs. historic) probabilities by town
100
100
20
40
60
80
20
40
60
80
0
0
New Addington New Addington
Kirkby Kirkby
Scarborough Scarborough
50000
Carlisle
Grays 50000 Carlisle
Grays
Prediction of artificial urban archetypes
Chesterfield Chesterfield
Halifax Stevenage Halifax Stevenage
Lincoln Crawley Lincoln Crawley
Margate Margate
Blackburn Burnley Blackburn Burnley
York Slough York Slough
Mansfield Peterborough Mansfield Peterborough
Sunderland Sunderland
Norwich Swindon Norwich Swindon
Preston Preston
City Population
City Population
Rochester Rochester
Blackpool Northampton Blackpool Northampton
Milton Keynes Milton Keynes
Plymouth Plymouth
Farnborough Farnborough
Birkenhead Luton Birkenhead Luton
Eastleigh Eastleigh
Figure 13: Distributions and predictions for the step 2 Deep Neural Network and the step 3 M2 model.
Bracknell Bracknell
100000 150000 200000 250000 300000
100000 150000 200000 250000 300000
New (vs. historic) probabilities compared for towns between 8,200 and 290,000 people.
A P REPRINTPrediction of artificial urban archetypes A P REPRINT
DNN "pre-hat", M2 latents split by "historic" (OT), M2 latents split by "artificial" (NT).
1200
1600
1200
1600
1200
1600
1200
1600
1200
1600
1200
1600
1200
1600
1200
1600
100
200
300
400
600
800
100
200
300
400
600
800
100
200
300
400
600
800
100
200
300
400
600
800
100
200
300
400
600
800
100
200
300
400
600
800
100
200
300
400
600
800
100
200
300
400
600
800
harm. closen.
betw.
mixed-uses
eating
drinking
commerc.
manuf.
retail food
retail other
transp.
total
total pop.
dwellings
DNN #1 DNN #2 DNN #3 DNN #4 DNN #5 DNN #6 DNN #7 DNN #8
100
200
300
400
600
800
100
200
300
400
600
800
100
200
300
400
600
800
100
200
300
400
600
800
100
200
300
400
600
800
100
200
300
400
600
800
100
200
300
400
600
800
100
200
300
400
600
800
harm. closen.
betw.
mixed-uses
eating
drinking
commerc.
manuf.
retail food
retail other
transp.
total
total pop.
dwellings
M2 OT #1 M2 OT #2 M2 OT #3 M2 OT #4 M2 OT #5 M2 OT #6 M2 OT #7 M2 OT #8
harm. closen.
betw.
mixed-uses
eating
drinking
commerc.
manuf.
retail food
retail other
transp.
total
total pop.
dwellings
M2 NT #1 M2 NT #2 M2 NT #3 M2 NT #4 M2 NT #5 M2 NT #6 M2 NT #7 M2 NT #8
1.00 0.75 0.50 0.25 0.00 0.25 0.50 0.75 1.00
Spearman correlations against source variables
Figure 14: The top row shows ‘mock latents’ of the pre-sigmoid layer for the deep neural network model. The second
row shows the latents for the M2 model. The third row shows the M2 latents isolated by artificial locations whereas the
fourth row shows the M2 latents isolated by historic locations.
4.3 Filling-in the gaps with a semi-supervised model
The DNN model can resolve the broader intent of artificial as opposed to historical forms of development in a more
nuanced and spatially precise manner. In the interest of probing the logic within the model, the fourth layer of the neural
network (which feeds into the sigmoid output layer) has been reduced to eight neurons, and the (pre-output) state of the
model can then be correlated with respect to the source features. These are shown in the top line of Figure 14 and give
an indication of the features that tend to correspond to the outputs of the model. It can be seen that harmonic closeness,
mixed-uses, land-use accessibilities, and dwelling densities correlate to varying degrees, whereas betweenness centrality,
manufacturing land-uses, and transportation have a lesser bearing. The model tends to focus on the larger pedestrian
thresholds, and it can be theorised that this is a side-effect of the blanket-wise targets imposed on the DNN model
(based on town boundaries), thereby encouraging focus on wider-area characteristics that remain more consistently
aligned with the target labels that have been imposed as a whole.
In order to release the model from the ‘tension’ between blanket-wise labels and local details, a semi-supervised M2
model is here considered as an additional step with the aim of recovering more local detail. The M2 model was proposed
by Kingma et al. (2014) as a semi-supervised method intended for applications that have access to large quantities of
data wherein only a limited number of samples are labelled. It was introduced alongside discussion of the M1 model,
which uses a variational autoencoder to transform the input data into reduced dimensional latent features (variational
autoencoders are discussed at length in Simons (2021b). The M2 model is a generalisation of variational autoencoders
to include a latent class variable y from which unknown classes are inferred: it can be used either in isolation or stacked
on top of the outputs of the M1 model, in which case the data is first transformed into a lower-dimensional feature
space using M1 and is then fed to the M2 model. Although the authors found that stacked models offered the best
performance for their use-case, for the dataset at hand, it was found that unsupervised dimensionality reduction resulted
in feature spaces that did not necessarily improve the M2 model’s ability to discriminate between the target classes; the
16Prediction of artificial urban archetypes A P REPRINT
M2 model is therefore applied directly to the source variables. Joint optimisation of a reduced dimensionality subspace
in concert with class inference was also considered (in the spirit of the VaDE model discussed in Simons (2021b)), but
did not, in this instance, move beyond tentative development.
Samples with the most confident predictions from the DNN model are now used as labelled inputs to the M2 model,
meaning that the very highest (artificial) and very lowest (historic) probability-based classifications are retained while
the more ambiguous labels are discarded. The upper and lower probability thresholds are set at 25%, and the larger
class (historical locations) is then randomly downsampled so that the classes are balanced (which prevents the model
from being pulled excessively in one direction). The result is 5% of samples in each of the artificial and historical
classes for a combined total of 10% labelled samples. In this sense, the model is ‘supervised’: it is anchored at either
extreme by locations that are almost certainly historic or almost certainly artificial. (See the third lines of Figures 11
and 12 for an indication of the points selected as labelled instances.) The remaining 90% of labels has been discarded,
and the model is free to extrapolate by extrapolating the natural patterns and distributions within the data, and it is in
this sense that the model is ‘unsupervised’.
The scatterplot (Figure 13) of M2 probabilities by town shows a relatively similar picture to the DNN model, though
with subtle changes to the ordering of locations. The lower line of figures within, respectively, Figures 11 and 12,
show that the M2 model adopts a more opinionated disposition and has a tendency to pull the probabilities towards
either extreme. Part of the reason for considering the M2 model is that the model’s latent features can be explored
per Figure 14. Whereas the interpretation of latents is complex (because they can vary and interact across multiple
dimensions), it remains possible to tease out subtle distinctions by comparing correlations for latents split by artificial
instead of historic locations. Historic locations show more substantial and consistent collinearity between closeness
centralities, land-uses, and densities (latent #8); artificial locations, in contrast, show more pronounced shear between
all of the major classes of variables: between network centralities and land-uses (latents #1, #6); network centralities
and population (latent #1, #3); and between densities and land-uses (latents #1, #2, #3, #4, #5, #7). Historic locations
place greater emphasis on local land-uses (inverses of latents #2 and #7) in contrast to artificial locations, which place
greater emphasis on manufacturing land-uses through all latents, with manufacturing land-uses tending to be more
clearly separated from other land-uses when compared to historical locations (latent #8).
5 Summary
Machine learning methods are tremendously powerful, but their capabilities are often oversold: they can be dangerous
if used without sufficient oversight and, as with statistics and mathematical modelling more generally, can be misused.
On the other hand, planners, policymakers, and politicians have struggled to translate the need for walkable and diverse
urbanism into a tangible form, and there tends to be a disconnect between good intentions and oft defunct artificially
planned communities. It is here that supervised and semi-supervised machine learning models — if developed with
rigorous input and oversight from domain experts — offers the opportunity to create scalable workflows that, on the
one hand, align with the instincts of urbanists and, on the other, help to better convey the ramifications of planning
decisions.
A worked example shows how that strictly pedestrian-scale information derived from the road network, the mix and
accessibility of land-uses, and the density of dwellings and populations can be linked to different types of machine
learning models in support of discriminating between artificial and historical urban archetypes. These examples are not
meant to be construed as optimal but are here provided as ‘proof-of-concepts’ that can almost certainly be improved
through more extensive exploration and testing tailored to available sources of data and the envisioned end-goals. For
emphasis, such tools are not intended to replace but rather reinforce existing design specialities by making it possible
to gauge the potential outcomes of decisions better. Further, these are not envisioned to replace existing review and
approvals processes but rather to bolster these by providing robust and repeatable methods that can help to improve the
transparency and accountability of decision-making processes.
It is encouraging that the models, which have been trained using only the supervised targets derived from artificial or
historic towns, have naturally emphasised characteristics of closeness centralities, the mix and accessibility of land-uses,
the density of dwellings and populations, and the relationships between these. This behaviour is broadly consistent with
intuitions expressed by urbanists and shows that such methods hold potential for further development.
17You can also read