Evolution of surface deformation related to salt-extraction-caused sinkholes in Solotvyno (Ukraine) revealed by Sentinel-1 radar interferometry
←
→
Page content transcription
If your browser does not render page correctly, please read the page content below
Nat. Hazards Earth Syst. Sci., 21, 977–993, 2021
https://doi.org/10.5194/nhess-21-977-2021
© Author(s) 2021. This work is distributed under
the Creative Commons Attribution 4.0 License.

Evolution of surface deformation related to salt-extraction-caused
sinkholes in Solotvyno (Ukraine) revealed by Sentinel-1 radar
interferometry
Eszter Szűcs1 , Sándor Gönczy2 , István Bozsó1 , László Bányai1 , Alexandru Szakacs3,4 , Csilla Szárnya1 , and
Viktor Wesztergom1
1 CSFK    Geodetic and Geophysical Institute, Sopron, 9400, Hungary
2 Department   of Geography and Tourism, Ferenc Rakóczi II Transcarpathian Hungarian College of Higher Education,
Berehove, Transcarpathia, Ukraine
3 Institute of Geodynamics, Romanian Academy, Bucharest, Romania
4 Sapientia Hungarian University of Transylvania, Cluj, Romania

Correspondence: Eszter Szűcs (Szucs.Eszter@csfk.mta.hu)

Received: 17 March 2020 – Discussion started: 2 April 2020
Revised: 3 January 2021 – Accepted: 21 January 2021 – Published: 15 March 2021

Abstract. Rock salt has remarkable mechanical properties          repetition time of Sentinel-1 observations, the evolution of
and high economic importance; however, the strength of salt       surface changes can be detected in quasi real time, which
compared to other rocks makes it a rather vulnerable mate-        can facilitate disaster response and recovery.
rial. Human activities could lead to acceleration of the disso-
lution of soluble rock salt and collapse of subsurface caverns.
Although sinkhole development can be considered a local
geological disaster regarding the characteristic size of sur-
face depressions, the deformations can result in catastrophic     1   Introduction
events. In this study we report the spatiotemporal evolution
of surface deformation in the Solotvyno salt mine area in         Large-volume rock salt deposits formed in the Carpathian–
Ukraine based on Sentinel-1 interferometric synthetic aper-       Pannonian region in its both internal (in the Transylva-
ture radar measurements. Although the mining operations           nian Basin) and external (along the outer margins of the
were finished in 2010, several sinkholes have been opened up      Carpathian fold-and-thrust belt) parts during Badenian times,
since then. Our results show that despite the enormous risk       when those areas were communicating with each other. The
management efforts, the sinkholes continue to expand with         Transylvanian Basin is a place of unique rock salt storage,
a maximum line-of-sight deformation rate of 5 cm/yr. The          where salt layers of a few tens of meters thick were deposited
deformation time series show a rather linear feature, and un-     and later deformed by diapirism. Large volumes of salt mi-
fortunately no slowdown of the processes can be recognized        grated towards the margins of the basin due to the uneven
based on the investigated 4.5-year-long data set. We utilized     loading of the overburden, forming two basin margin-parallel
both ascending and descending satellite passes to discrimi-       belts of large-sized diapirs (Krézsek and Bally, 2006). Like-
nate the horizontal and vertical deformations, and our results    wise, the salt layer deposited at the outer margin of the
revealed that vertical deformation is much more pronounced        Carpathians was deformed, generating diapiric bodies known
in the area. Analytical source modeling confirmed that the        and exploited at many locations along the East Carpathians
complex deformation pattern observed by Sentinel-1 radar          and South Carpathians in Ukraine and Romania. Solotvyno
interferometry has a direct connection to the former mining       (Aknaszlatina, according to its local Hungarian name), lo-
activity and is confined to the mining territory. With the 6 d    cated at the Ukrainian side of the northern East Carpathians,
                                                                  is one of them.

Published by Copernicus Publications on behalf of the European Geosciences Union.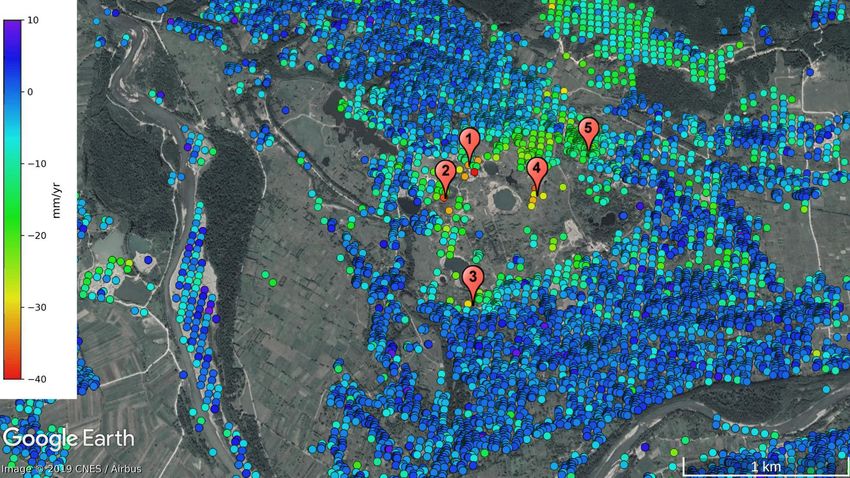
978                           E. Szűcs et al.: Evolution of surface deformation related to salt-extraction-caused sinkholes

   The western and eastern salt lineaments along the Tran-         pollution originating from Romanian mining accidents at the
sylvanian Basin, as well as the salt bodies along the external     beginning of 2000.
East and South Carpathians, offered a valuable mineral re-
source for centuries in the past. Salt is still extracted indus-
trially at some of them. Nowadays, salt mines are again in         2   Geological background and salt mining activities in
the spotlight but for a different reason. Many of them, par-           Solotvyno
ticularly the abandoned ones, pose a threat to populated res-
idential areas, infrastructure and environment because of the      Of the Ukrainian Subcarpathian territory, 80 % is a moun-
uncontrolled processes of suffusion and collapse of the old        tainous area; the remaining 20 % comprises a low-lying flat
underground exploitation cavities (Deák et al., 2007; Móga         topography including two parts: the Chop–Mukachevo plain
et al., 2015, 2019; Zechner et al., 2019). One of the severely     and the Marmarosh or Solotvyno basin extending southward
affected localities is Solotvyno, where collapse of subsurface     in Romania across the state border (Chis and Kosinszki,
caverns in the past resulted in dolines, temporally filled with    2011; Nakapelukh et al., 2017). The Solotvyno basin hosts
brine and with a size of 150–230 m in diameter. Figure 1 il-       most of the shallow subsurface salt domes, 16 of 19 in total,
lustrates the most recent sinkholes that developed in the area     known in the Ukrainian Subcarpathians (Bosevs’ka, 2015).
in 2012.                                                           Starting from the town of Khust in the west, this 50 km long
   Continuous monitoring of the evolution of such depres-          and 22 km wide elongated basin extends with diminishing
sions and progression of sinkholes that develop on top of old      width in the ESE direction. Its Ukrainian part is bounded by
human-made excavations is essential to delineate unstable to-      the Vihorlat–Gutin Neogene volcanic range to the west and
pographic surfaces and identify risk-prone areas in order to       south and the Carpathian thrust-and-fold belt to the north and
mitigate the threats. This requires high-resolution spatiotem-     east (Fig. 2).
poral observations (e.g., a dense network of measurement              The Solotvyno salt diapir has a remarkable size (Bo-
points) to follow and map the dynamics of the ongoing pro-         sevs’ka and Khrushchov, 2011). It has an elongated pear
cesses. Such a goal can be accomplished by using recently          shape, oriented in the northwest–southeast direction, with a
developed Earth observation techniques (Elliott et al., 2016;      surface area of approximately 1 × 10⁶ m2 (Fig. 3a and c).
Li et al., 2016).                                                  The largest depth of the salt body is ca. 2 km, whereas its
   The objective of this study is to assess the current state      width varies between 200 and 800 m in the westernmost and
of the salt-mine-related deformations in the Solotvyno area        easternmost parts, respectively. The salt diapir lies beneath a
caused by ground collapses in the past and to identify po-         thick layer of gravel, embedded in sandstone at an average
tential small-scale and dynamic surface variations related to      depth of 25–30 m. The formation is covered with a thin, gray
dissolution cavities, which could result in further ground de-     salt layer, the so-called pallag (layers of salt and clay), which
pressions and collapses of the abandoned salt-exploitation         functions as a waterproof layer, hindering the formation of
cavities in the future. Although the issue is well-known, no       natural salt karst. The earliest salt extractions were started by
dedicated terrestrial monitoring network has been installed        the method of dissolution, where the pallag layer was miss-
in the area yet. Therefore, Sentinel-1 satellite interferometry    ing. As a result of the large-volume industrial mining, cutting
can offer a unique opportunity to support the early identi-        through the sealing pallag layer was inevitable which raised
fication of areas prone to sinkhole occurrence. The impact         the possibility of flooding. Another factor, which makes the
of salt-dissolution-related cavity collapse is not merely a lo-    situation much more severe, is the closeness of the Tisa.
cal problem, but it could be amplified to a regional-scale is-     The riverbed changed over time as the diapir emerged, and
sue in the future owing to the proximity of the Tisa, one of       nowadays the river flows around the salt body from a south-
the main rivers in central and eastern Europe crossing sev-        ern direction. The gradient of the riverbed is rather high,
eral borders (Ukraine, Slovakia, Hungary, Romania, Serbia).        about 15 m within a few kilometers (Fig. 3b). During the
As the water-infiltration-caused sinkhole development prop-        great floods of the river the water infiltrates towards the salt
agates beyond the boundary of the mining area, inhabited ar-       body and causes serious damage, where the waterproof lay-
eas will be endangered. Some parts of the city of Solotvyno        ers are missing. Such events happened in 1998, 2001 and
have already been evacuated. However, besides the economic         2007 (Móga et al., 2015, 2017), contributing to the shutdown
loss, the ecological impact of brine migrating into the un-        of the mines.
derground freshwater system and eventually into the Tisa              Exploitation of salt in Solotvyno has a long history; how-
can be catastrophic. Recognizing the environmental threat,         ever, industrial-scale production only began in the 18th cen-
the European Commission has devoted considerable funds to          tury. Since the opening of the first mine in 1778, a total of
support emergency preparedness, environmental protection,          10 mines have operated in the area (Fig. 3d, Table 1). The
safety and security in the area. Pollution of the freshwater       8th (Lajos) and the 9th mines were used for the longest time
river with brine can have unforeseeable consequences similar       span; the others were operated for a relatively short period of
to the environmental disaster caused by sequences of metal         time. At the end of the 1980s and beginning of the 1990s a
                                                                   new so-called 10th mine was developed, but there was no ex-

Nat. Hazards Earth Syst. Sci., 21, 977–993, 2021                                    https://doi.org/10.5194/nhess-21-977-2021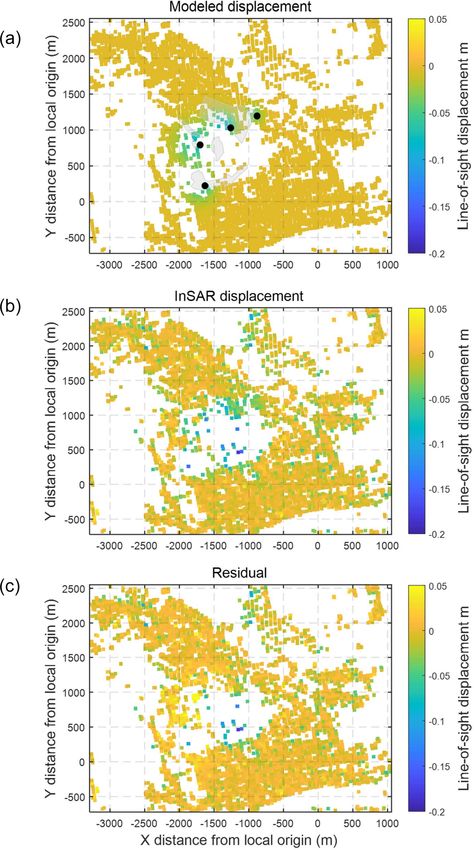
E. Szűcs et al.: Evolution of surface deformation related to salt-extraction-caused sinkholes                                    979

Figure 1. Pictures of some sinkholes in the Solotvyno salt mining area (credit: Sándor Gönczy).

                                                                       formation conditions of the salt diapir and the possibilities
                                                                       of salt exploitation. Gaidin (2008) has drew attention to the
                                                                       problems of salt karst formation processes in 2008. He ana-
                                                                       lyzed karst development thoroughly and presented the disso-
                                                                       lution process of the pillars and the resulting change in sta-
                                                                       bility of mine shafts. Diakiv and Bilonizhka (2010) presented
                                                                       an overview of the geological outline of the Solotvyno salt
                                                                       mine, and in addition they described the stage of salt karst
                                                                       formation in 2010 in detail. They also highlighted the poor
                                                                       conditions of the drainage system around the cultivated ar-
                                                                       eas with an emphasis that it could lead to the leakage of
                                                                       an increased amount of freshwater into the karst system. Di-
                                                                       akiv (2012) has also investigated the salt karst formation in
                                                                       the area based on the studies of two mines. Bosevs’ka and
                                                                       Khrushchov (2011) discussed the possibilities of disaster re-
Figure 2. Geological sketch map of the Ukrainian Subcarpathians        sponse and mitigation. Meanwhile, several research teams
compiled from © Cis, 1962; © Shakin, 1976; © Tyitov et al., 1979;
                                                                       have simultaneously started to examine the ongoing surface
© Herenchuk, 1981; © Glusko and Kruglov, 1986; © Kyiv State
                                                                       processes and resulting formations mainly by ground-based
Cartographic Office, 2000; © Kuzovenko, 2001.
                                                                       geomorphological mapping procedures or participatory GIS
                                                                       analysis, respectively (Móga et al., 2015, 2017; Onencan et
                                                                       al., 2018).
ploitation here at all (Bosevs’ka and Khrushchov, 2011). The
available total salt reserves are estimated at about 2 × 10⁹ t.
At the beginning of the 1990s about 10 % of Ukrainian salt             3    Material and methods
production was mined in Solotvyno, with an estimated yearly
rate of 5×10⁵ t. Prior to the industrial extraction of rock salt,      Interferometric synthetic aperture radar (InSAR) is a re-
only small-scale karst formations were observed at the sur-            mote sensing technique which operates with microwaves.
face of the area affected by mining. The development of salt           The satellite emits electromagnetic radiation and detects the
karst processes accelerated in such a way after the beginning          signal reflected from the surface. By exploiting the coher-
of the large-volume industrial mining operations that nowa-            ent phase difference in the time-separated synthetic aper-
days it is almost impossible to mine rock salt at all.                 ture radar (SAR) scenes, information on the possible ground
   Environmental and economic problems of Solotvyno salt               deformation can be retrieved. The great advantage of mi-
mines gained more and more public attention after 2000, and            crowave radar interferometry is that it allows for the moni-
at the beginning of 2010 the city was categorized by author-           toring of areas in all-weather conditions and the studying of
ities as a disaster-prone area. Several studies have been con-         surface deformations of natural or anthropogenic origin even
ducted in the past related to the salt operations, but these           in areas with difficult access. The ESA Copernicus Sentinel-
were limited to the investigation of the location, geology and         1 mission is the first of its kind in the sense that it ensures

https://doi.org/10.5194/nhess-21-977-2021                                         Nat. Hazards Earth Syst. Sci., 21, 977–993, 2021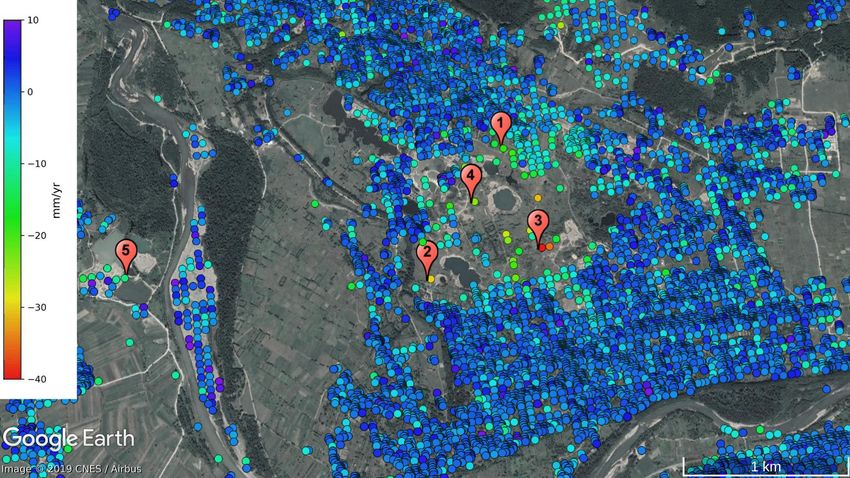
980                             E. Szűcs et al.: Evolution of surface deformation related to salt-extraction-caused sinkholes

Figure 3. The investigated area. (a) Overview map of Solotvyno and its surroundings, showing the approximate location of the salt dome.
Lakes with hatch pattern show sinkholes opened after the detailed geomorphological mapping of © Móga et al. (2015). (b) Topographic
profile across the section (black line) marked in (a). (c) Geological cross section of the Solotvyno salt dome. Legend: (1) fluvial sediments;
(2) Tereblya Formation; (3) Solotvyno Formation; (4) Novoselytsa Formation. (d) Detailed picture of the area with the salt mines shown on
a UAV map. (1) Kristina mine; (2) Albert mine; (3) Kunigunda mine; (4) Nicholas mine; (5) Joseph mine; (6) Old Louis mine; (7) Francis
mine or mine 7; (8) New Louis mine or mine 8; (9) mine 9; (10) mine 10. Lakes are depicted in blueish shades.

Table 1. Summary of mining activity in Solotvyno.

                The name of the mine          Start of      Completion of     Cause of the completion of extraction
                                              extraction    extraction
          1     Kristina mine                 1778          1781            low-quality salt
          2     Albert mine                   1781          1789            water inrush because of the implosion of the surface
          3     Kunigunda mine                1789          1905            water inrush because of the implosion of the surface
          4     Nicholas mine                 1789          1905            water inrush because of the implosion of the surface
          5     Joseph mine                   1804          1850            low-quality salt, water inrush
          6     Old Louis mine                1804          1810            low-quality salt
          7     Francis mine or mine 7        1809          1953            water inrush
          8     New Louis mine or mine 8      1886          2007            water inrush
          9     Mine 9                        1975          2008            water inrush
          10    Mine 10                                       made at the end of the 1980s but has never worked

coordinated global observations with unprecedentedly wide                   Sentinel-1 is a twin constellation (Sentinel-1A was
spatial coverage and with unrivaled measurement frequency                launched in 2014, Sentinel-1B in 2016) of C-band (wave-
(6 d for Europe and 12 d for other parts of the globe) and is            length ∼ 5.5 cm) satellites separated by 180◦ in orbit. The
freely accessible for users (European Space Agency, 2013).               main acquisition mode of Sentinel-1 over land is TOPS
Therefore, Sentinel-1 radar interferometry enables the detec-            (terrain observation with progressive scans), which em-
tion of surface topographic changes from a small scale to                ploys the generation of the wide-swath so-called IW mode
high magnitude with a high density of measurements points,               (250 km) SAR products with a medium spatial resolution
and due to the frequent repetition time of the satellite it al-          (ca. 5 m × 20 m in the range and azimuth directions, respec-
lows for the studying of the dynamics of numerous surface                tively). The narrow orbital tube of the satellites and the
processes (Strozzi et al., 2013; Elliott et al., 2016).                  almost-synchronized bursts of SAR scenes makes the IW
                                                                         products suitable for interferometric analysis.

Nat. Hazards Earth Syst. Sci., 21, 977–993, 2021                                            https://doi.org/10.5194/nhess-21-977-2021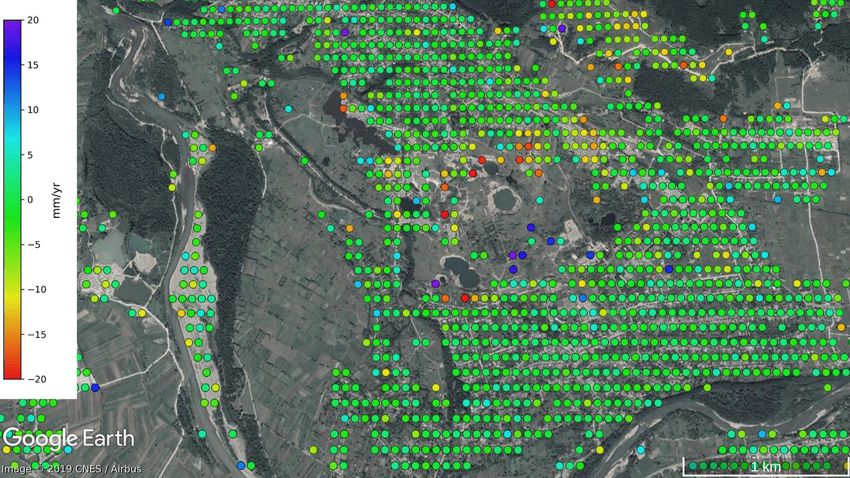
E. Szűcs et al.: Evolution of surface deformation related to salt-extraction-caused sinkholes                                981

3.1   Data set                                                        Time series analysis of interferograms requires coherent
                                                                   scatterers with quite stable geometric and electromagnetic
To assess the surface deformation caused by salt dissolution,      properties over time. There are various techniques to select
we used the available Sentinel-1 SAR collection covering           pixels, either dominated by a single scatterer or using av-
the area of interest. The time period covered by Sentinel-1        eraged (multi-looked) noise-reduced distributed scatterers.
is more than 4 years, and it is sufficient to investigate the      These measurement points form the base of the time series
longer-term (i.e., multi-annual) behavior of surface deforma-      analysis of differential interferograms computed from either
tion processes and to detect possible new surface develop-         a single-reference or a multi-reference stack (for more details
ments. Both ascending and descending data sets were utilized       on the comparison of different techniques see, e.g., Crosetto
to facilitate the separation of total line-of-sight (LOS) de-      et al., 2016; Osmanoğlu et al., 2016; Manunta et al., 2019).
formation into east–west and vertical components which are         To capture the high deformation rate of sequential depres-
more easily interpretable as well as to better constrain the an-   sion and to maximize the coherence offered by the short
alytical modeling with combined data tracks. Details of the        spatial baselines and high revisit time of the Sentinel-1 mis-
Sentinel-1 SAR data set used in this study are summarized          sion, we used a multi-baseline approach of interferogram for-
in Table 2. Significant change in surface scattering proper-       mation (usually called small baseline subset – SBAS; Be-
ties (e.g., snow cover) results in low-quality interferograms;     rardino et al., 2002). The interferograms were generated us-
therefore winter scenes with snow cover were excluded from         ing Gamma software (Wegmüller et al., 2016). We consid-
the analysis.                                                      ered pairs of four consecutive SAR scenes to include redun-
                                                                   dancy in the interferogram network, which facilitates reduc-
3.2   Multi-temporal, multi-baseline InSAR analysis                tion in errors. We utilized both phase-stable single scatterers
                                                                   (PSs) and distributed scatterers (DSs), which ensures long-
The interferogram formation of Sentinel-1 IW SLC (Sin-
                                                                   term coherence. The initial set of PS candidates was selected
gle Look Complex) images requires co-registration in the
                                                                   based on the high temporal stability of the backscattering as
azimuth direction of extreme accuracy due to the strong
                                                                   well as on the low spectral diversity. For the DSs we used
Doppler centroid variation within each burst (for more de-
                                                                   multi-looking with a factor of 5×1 (5 samples in range and 1
tails see, e.g., Yague-Martinez et al., 2016; Fattahi et al.,
                                                                   in azimuth) to increase the signal-to-noise ratio but keeping
2017). For the precise co-registration of S1 scenes we fol-
                                                                   in mind the spatial extent of the sinkholes. Distributed tar-
lowed the strategy described in Wegmüller et al. (2016). We
                                                                   gets resulted in a 15 m × 15 m pixel size in the range and az-
applied S1 precise orbit ephemerides and the 1 arcsec resolu-
                                                                   imuth direction, which enables the detection of localized de-
tion SRTM surface model (Reuter et al., 2007; Shuttle Radar
                                                                   formation caused by surface depression. The flat-earth phase
Topography Mission 1 arcsec global digital object identifier
                                                                   and topographic phase were removed from the interfero-
– https://doi.org/10.5066/F7PR7TFT) to consider the effect
                                                                   grams. In the multi-baseline approach interferograms were
of terrain topography during a matching procedure of SAR
                                                                   unwrapped in space first, finding the unambiguous phase
images, the results of which were further refined using the
                                                                   values. The phase unwrapping was accomplished in an it-
enhanced spectral diversity (ESD) method in the burst over-
                                                                   erative way with quality control, keeping PS and DS pixels
lapping regions to reach a co-registration accuracy on the or-
                                                                   for the next step, which satisfy the phase model with rea-
der of 0.001 pixels. The ESD method considers the double-
                                                                   sonably small (< 1 rad) residuals. A two-dimensional phase
difference interferograms to determine the fine azimuth off-
                                                                   model involving height corrections relative to the reference
set; therefore it is required to have coherent regions in the
                                                                   model (SRTM heights mapped to radar coordinates) and lin-
burst overlapping area. This requirement was met with sev-
                                                                   ear deformation rate was chosen. The residual phase consists
eral difficulties as the investigated area is sparsely populated
                                                                   of the non-linear deformation phase, atmospheric propaga-
and lacks phase-stable natural scatterers. Therefore, we ap-
                                                                   tion delay, error in the height correction estimates and other
plied a cascade co-registration strategy selecting a so-called
                                                                   noise terms. The spatially correlated, low-frequency part of
primary reference scene in the middle of the time series in
                                                                   the residual phase was separated by spatial filtering from
the early spring period. Two secondary reference scenes were
                                                                   the residual phase, since unwrapping the residual phase of
selected for each year, one in spring when the vegetation
                                                                   point differential interferograms is much simpler than un-
has not started to thrive and one in late autumn when only
                                                                   wrapping the original point differential interferograms. The
light vegetation covers the surface. These S1 scenes were co-
                                                                   whole process was iterated starting from dividing the area
registered directly to the primary reference scene, and the
                                                                   into patches, where the linear phase model approximation
rest of the scenes were co-registered to the primary refer-
                                                                   was suitable. Using a multi-reference stack based on con-
ence using the nearest secondary reference scene in time for
                                                                   secutive SAR scenes, the deformation phase can be kept as
ESD estimation. Based on the co-registered stack, the inter-
                                                                   small as possible. With the constant refinement of the phase
ferograms can be calculated in a standard way (Simons and
                                                                   model, a single regression was applied to the whole area. The
Rosen, 2007).
                                                                   main output of the regression analysis was the unwrapped
                                                                   phase. The various phase terms were summed up, and then

https://doi.org/10.5194/nhess-21-977-2021                                   Nat. Hazards Earth Syst. Sci., 21, 977–993, 2021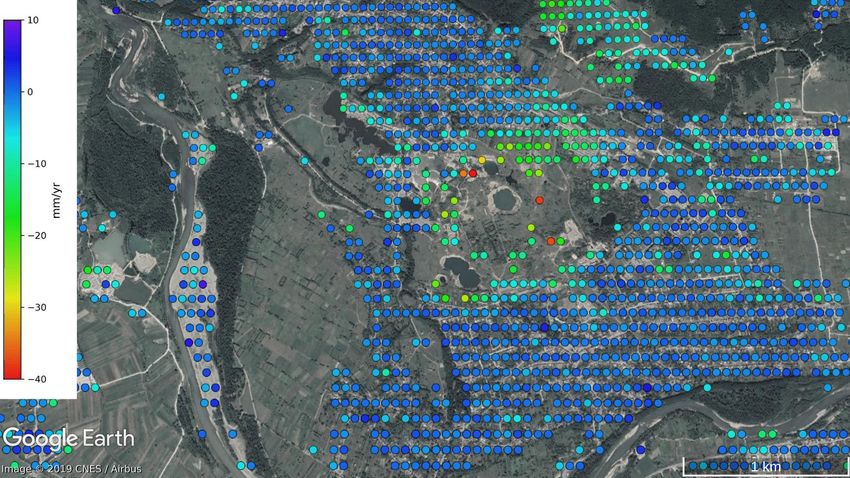
982 E. Szűcs et al.: Evolution of surface deformation related to salt-extraction-caused sinkholes
Table 2. Summary of Sentinel-1 data used in this study.
Time span (yyyy/mm/dd) Track Heading Incidence Number of
angle images
2014/10/31–2019/04/14 29 (ascending) −14.6◦ 41.4◦ 207
2014/10/23–2019/06/23 80 (descending) 194.6◦ 36.3◦ 211
the unwrapped phases were connected in time and inverted
to deformations using a least-squares approach minimizing
the sum of the square-weighted residual phases (Berardino
et al., 2002; Wegmüller et al., 2016). The atmospheric phase
and non-uniform deformation phase are present in the time
series of unwrapped phases. To discriminate between the
two, we identified areas with a high deformation rate and ex-
cluded those phase values to estimate atmospheric propaga-
tion delay. Atmospheric phases were determined as a combi-
nation of height-dependent atmospheric delay plus the long-
wavelength component of the SBAS-inverted residual phase.
We used a low-pass filter with a characteristic length of 5 km.
Therefore, long-wavelength (> 5 km) non-linear deformation
was mapped onto atmospheric correction. However, the area
affected by subsidence is rather localized, so we can assume
no long-wavelength non-uniform deformation. Figure 4. Decomposition of the total deformation into ascending
and descending LOS components as well as to into vertical and
3.3 Decomposition of surface deformation quasi-horizontal (east–west) components.
The ascending and descending satellite passes offer the pos-
sibility of resolving the observed LOS deformations into ver- hole growth and constrain the location and depth of under-
tical and horizontal components (Hanssen, 2001; Pepe and ground cavities which could result in sinkhole collapse in the
Calò, 2017; Fuhrmann and Garthwaite, 2019). The viewing future. The cavity deflation was modeled using rectangular
geometry of the LOS vector is defined by the ϑ incidence dislocation sources (Okada, 1992; Segall, 2010) within a ho-
angle, measured between the surface normal and look vector mogeneous and isotropic elastic half-space. We used a rect-
and the α satellite heading: angular pressurized crack model, since deformations are pre-
sumably related to the destruction of abandoned mines. De-
dEAST spite their simplicity and the inherited approximations, an-
dLOS = [− sin ϑ cos α sin ϑ sin α cos ϑ] dNORTH . (1) alytical formulations are convenient to model and explain
dUP deformation patterns described by a few model parame-
Since the satellite passes pole to pole and illuminates the sur- ters. The elasticity assumption implies that the half-space
face at a right angle to the path, the observed LOS deforma- obeys Hooke’s law; therefore displacements are considered
tion is the least sensitive to movements in the north–south infinitely small compared to the characteristic size of source
direction. This component is usually neglected, and the hor- dimensions (Lisowski, 2007). The observed gradual subsi-
izontal component of the movement is interpreted in terms dence (see Sect. 4.1) also supports the assumption of pure
of deformation only in the east–west direction. Based on the elastic deformation. We fit simple Okada rectangular dislo-
ϑ incidence angle of the reflecting point of the ground (Ta- cation models to the InSAR data using a grid-search method
ble 2), the dUP vertical and the dEAST east–west component to estimate the initial model parameters. We made an exhaus-
of the deformation can be resolved (Fig. 4): tive search for the best-fitting models using the misfit func-
ASC tion:
dLOS sin ϑ1 cos ϑ1 dEAST
DSC = . (2) 2 i1/2
dLOS − sin ϑ2 cos ϑ2 dUP hXN XM
δ= i=1
d
j =1 i
− d i,mj /N , (3)
3.4 Source modeling where N is the total number of measurement points, M is
the number of source models, di is the observed cumulative
We modeled the deformation observed by InSAR in order to surface deformation and di,mj is the modeled deformation
better understand the mechanisms responsible for the sink- from the j th source model projected onto the satellite LOS.
Nat. Hazards Earth Syst. Sci., 21, 977–993, 2021 https://doi.org/10.5194/nhess-21-977-2021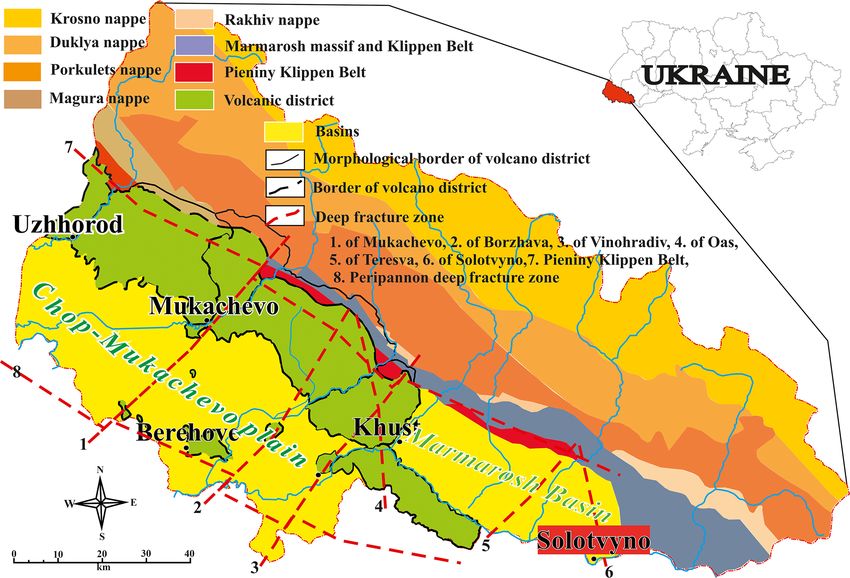
E. Szűcs et al.: Evolution of surface deformation related to salt-extraction-caused sinkholes                                983

   To refine the source parameters and estimate associated        to 2 cm/yr is found north of the central sinkhole in an urban-
uncertainties, we performed a Bayesian probabilistic inver-       ized area (around point 1). Larger deformation rates occur
sion (Bagnardi and Hooper, 2018). We modified open-source         south of the central sinkhole. Here, we identified two clusters
GBIS (Geodetic Bayesian Inversion Software, http://comet.         of anomalous points, one patch located south-southeastward
nerc.ac.uk/gbis/, last access: 15 November 2020) code to          from the central sinkhole with deformation rates varying be-
handle custom source models of multiple rectangular dis-          tween 4–5 cm/yr (around point 3). The other pattern is con-
locations. We also jointly inverted the cumulative ascend-        centrated at the southwestern edge of the larger deforming
ing and descending InSAR data to determine deformation            area (point 2) with an average rate of 1–3 cm/yr. A localized
source parameters, i.e., horizontal dimensions and horizon-       deformation zone was found farther away, ca. 2 km from the
tal coordinates of rectangular source, depth of dislocation,      mining area in the west direction, on the left bank of the Tisa.
strike angle of horizontal edge with respect to the north, and    Its average rate is 1.2 cm/yr, and it is located in the area with
opening of the model (related to volume change), for every        some small lakes (point 5).
model in a single run. Within a Bayesian inversion approach           The deformation rate is almost linear in the whole area;
the characterization of posterior probability density functions   individual deformation time series for some selected points
(PDFs) of source model parameters is accomplished by tak-         (mentioned in the text above) are given in Fig. 7. No signif-
ing into account uncertainties in the data. The optimal set of    icant sudden movement was detected. The time evolution of
source parameters can be extracted from the posterior PDF         the LOS surface deformation is shown in Fig. 9 along a cross
by finding the maximum a posteriori probability solution.         section directed almost north–south (cross section A–B). The
The PDFs of source model parameters are determined from           path was selected to have the highest point density, and a
the likelihood function of the residuals between the obser-       natural-neighbor interpolation method was applied based on
vations and the model prediction weighted with the inverse        the points satisfying a distance criterion (< 50 m) around the
of the variance–covariance matrix of the observations. The        location of the profile. The location of cross sections was se-
Bayesian inversion approach requires the quantification of        lected to obtain information in roughly perpendicular direc-
errors in the data, which are assumed to be multivariate Gaus-    tions of the area; it was chosen by visual inspection of point
sian with a zero mean and covariance matrix. For multiple         distribution. Figure 9 nicely shows the different magnitudes
independent data sets, the likelihood function can be formu-      of the deformation rate between the northern and southern
lated as the product of the likelihoods of the individual data    parts of the area, as well as the highly linear characteristics
sets. To increase numerical efficiency, the GBIS inversion al-    of surface evolution.
gorithm samples the posterior PDFs through a Markov chain             Regarding the descending Sentinel-1 interferogram time
Monte Carlo method, incorporating the Metropolis–Hastings         series, the average deformation rate shows a similar pattern
algorithm, with automatic step size selection. For more de-       compared to the ascending pass. This suggests that the defor-
tails, we refer to Bagnardi and Hooper (2018).                    mation shows primarily vertical behavior. Results from the
                                                                  multi-temporal InSAR analysis are shown in Fig. 6 in terms
                                                                  of the average linear deformation rate. The movement north
4     Results                                                     from the central sinkhole is much more pronounced and af-
                                                                  fects an extended area (see point 5). Deformation possibly
4.1    Observations                                               related to landslide activity is captured on the hillside in the
                                                                  upper northern part of the figure, which was previously iden-
Time series analysis of Sentinel-1 interferograms reveals sur-    tified by Velasco et al. (2017). This movement along the gra-
face deformations beneath the city of Solotvyno and its sur-      dient of the slope was not pronounced in the ascending satel-
roundings. Based on the scattering properties of resolution       lite geometry. The growth of the disturbed area in time is
elements, a large number of pixels were identified (> 35 000      illustrated in Fig. 10 on an east–west cross section (marked
on a ca. 9 km × 9 km area (Supplement Figs. S1 and S2)            by C–D) in the northern part of the investigated area. The
which densely cover the populated areas. Coherent points          motion is very linear in time but shows an asymmetric shape
were also detected in the direct vicinity of the existing sink-   in the east–west direction. The western part of the cross sec-
holes in low-vegetation fields.                                   tion (the distance from point C is about 600 m) is much more
   Figure 5 shows the linear LOS displacement rate deter-         similar to a classical subsidence bowl, whereas the eastern
mined from Sentinel-1 ascending data. The spatial pattern of      side (between 600 and 1200 m) shows a sharp step (section
the surface deformation computed from the ascending satel-        from 600 to 800 m). This part of the area, which moves like
lite pass data clearly shows the circular outline of the de-      a solid block, is covered with buildings. Figure 8 shows the
forming area around the main sinkhole. The maximum de-            individual time series of the points marked in Fig. 6.
formation rate reaches almost 5 cm/yr (point 3 in Fig. 5) and
is located at the south-southeast part of the central sinkhole.
The detected surface deformation forms patterns. Moderate,
but persistent, surface displacement with a magnitude of up

https://doi.org/10.5194/nhess-21-977-2021                                  Nat. Hazards Earth Syst. Sci., 21, 977–993, 2021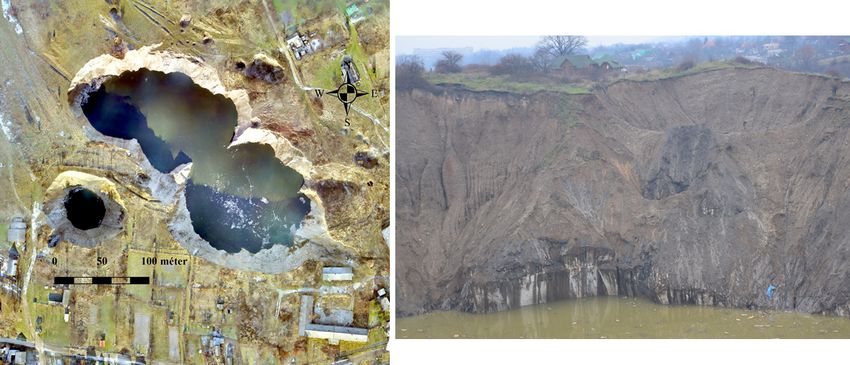
984                            E. Szűcs et al.: Evolution of surface deformation related to salt-extraction-caused sinkholes

Figure 5. Linear rate of line-of-sight deformation from Sentinel-1 ascending pass for the investigated area (see explanation of numbers in
the text). Contains modified Copernicus Sentinel data (2014–2019), background © Google.

Figure 6. Linearly estimated LOS deformation rate in millimeters per year calculated from Sentinel-1 descending pass data for the investi-
gated area. Contains modified Copernicus Sentinel data (2014–2019), background © Google.

4.2   Decomposition of surface deformation                             were referred to the same reference point, which is located
                                                                       far enough from the deforming area in the east direction
                                                                       (marked with white cross in the Supplement figures). As the
The different acquisition geometry results in dissimilar mea-
                                                                       time series analysis revealed that the surface deformation
surement points for the ascending and descending passes. To
                                                                       is quite linear, we combined the deformation rates and not
overcome this limitation and combine deformation rate re-
                                                                       the deformations directly. Results of LOS decomposition are
sults from ascending and descending passes, the data sets
                                                                       given in Figs. 11 and 12 for the vertical and east–west (posi-
are usually interpolated to a common grid, resulting in so-
                                                                       tive towards east) directions, respectively. The interpretation
called pseudo measurement points (Ferretti, 2014). Besides
                                                                       of vertical and horizontal deformations is more straightfor-
the common spatial grid, a common zero reference point is
                                                                       ward than the explanation of LOS displacements and gives a
required to make data sets obtained from different acqui-
                                                                       coarse estimate of the ongoing processes. As Figs. 11 and
sition geometries comparable. In our study both data sets

Nat. Hazards Earth Syst. Sci., 21, 977–993, 2021                                         https://doi.org/10.5194/nhess-21-977-2021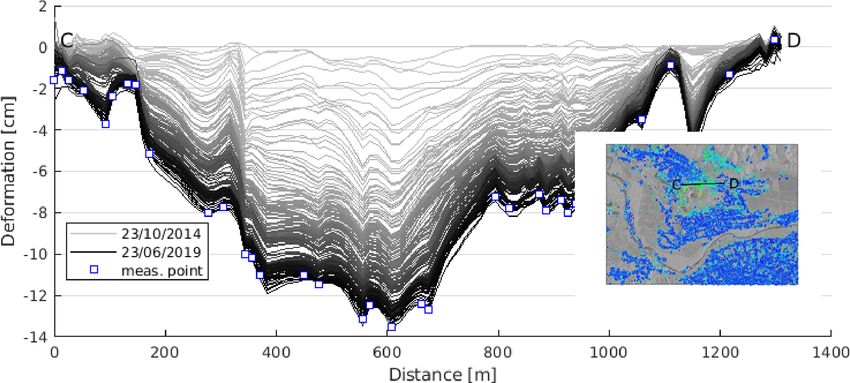
E. Szűcs et al.: Evolution of surface deformation related to salt-extraction-caused sinkholes                                    985

Figure 7. LOS deformation of some selected points (see Fig. 5 for location) determined from the ascending scenes.

Figure 8. Time series of some selected points (see Fig. 6 for location) from the analysis of Sentinel-1 descending scenes.

12 show, vertical deformation is more pronounced in the                  therefore it can be only concluded that the deforming area is
area and the vertical velocities are about twice the magnitude           still actively growing nowadays.
compared to the horizontal velocities. Although the most re-
cent cavity collapse related to the abandoned mines occurred             4.3   Comparison with previous results
in around 2012, in the northern (mine 9) and in the south-
ern (mine 8 with the twin dolinas) parts of the area subsi-              A previous study conducted by TRE Altamira (Velasco et
dence is still in progress. The highest rates, ranging from              al., 2017) investigated the potential of radar interferome-
2.5–4.5 cm/yr, are recorded in the inner zone of the central             try to monitor surface deformations caused by mining op-
sinkhole, whereas at the northern and southern edges of the              erations in the Solotvyno area in the framework of a con-
deforming area deformation is still remarkable with a mag-               tract with the Hungarian National Directorate General for
nitude of 0.5–1.5 cm/yr. Regarding deformations in the east–             Disaster Management. An exhaustive study was conducted
west direction (Fig. 12), the magnitude of the displacement              based on archive C-band SAR data sets such as ERS (1997–
is much smaller, the maximum rate being about 2 cm/yr. The               2001), Envisat (2002–2010) and Sentinel-1 (2014–2016) as
complex surficial depression pattern suggests that the subsi-            well as high-resolution X-band COSMO-SkyMed (2016–
dence presumably originates from several individual sources              2017, 4 months) acquisitions utilizing the SqueeSAR algo-
or from the superposition of subsurface caverns. The north-              rithm (Ferretti, 2014) which combines high-resolution PS
ern part of the deforming area clearly shows a westward dis-             points with coherent DSs. Although the study covers almost
placement, whereas its southern part shows displacement to-              20 years, the number of images used from former missions is
wards the east. The lack of InSAR observations impedes the               quite low for the archive data set: 29 (ERS) and 30 (Envisat)
retrieval of the whole deformation signal, i.e., the alternat-           images were used compared to the contemporary Sentinel-1
ing east–west pattern generated by a single subsidence void;             mission with 44 SAR scenes. Archive data cover the inves-
                                                                         tigated time period unevenly; therefore the resolution of the

https://doi.org/10.5194/nhess-21-977-2021                                          Nat. Hazards Earth Syst. Sci., 21, 977–993, 2021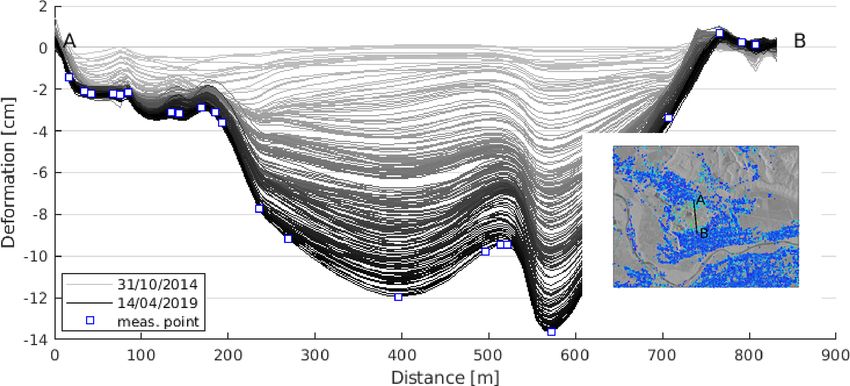
986                              E. Szűcs et al.: Evolution of surface deformation related to salt-extraction-caused sinkholes

Figure 9. Temporal evolution of LOS surface deformation for the A–B cross section from ascending Sentinel-1 data. For the location of the
section see the insert. The shade of gray varies from light to dark as time advances (lightest: October 2014, darkest: April 2019); blue squares
show location of InSAR observations along the profile.

Figure 10. Progress of LOS surface deformation from descending pass Sentinel-1 data. Location of cross section is given in the insert. The
shade of gray varies from light (October 2014) to dark (June 2016); blue squares show location of InSAR observations along the profile.

deformation time series may be inadequate which inherently                10 cm/yr assuming a constant characteristic. It is quite in-
raises the question of potential signal aliasing. The large col-          teresting, however, that the pronounced deformation pattern
lection of data from ESA’s Sentinel-1 mission with frequent               located northeast of the main sinkhole in an industrial area,
acquisitions guarantees the maintenance of the coherence in               detected in all C-band data sets, was not identified at all. Al-
general and fosters the analysis of the dynamics of surface               though it should have an average value of around 5–7 mm/yr,
deformation.                                                              taking into consideration the short time span of the investi-
   Using the C-band satellites, Velasco et al. (2017) could               gated data set, no measurement points were identified in the
not really identify phase-stable points in the direct vicin-              area of question. The study by Velasco et al. (2017) utilized
ity of the sinkholes. Deformation rates (maximum 25 mm/yr                 satellite data only for the descending pass unlike our investi-
away from the satellite, on average) occur in north and south             gations. For a meaningful comparison of the two studies we
directions from the main sinkhole mostly in urbanized ar-                 focused only on the data sets from C-band satellites. Velasco
eas. The three C-band results are very consistent with each               et al. (2017) concluded that there was a lack of coherent scat-
other in both magnitude and pattern. Investigations based on              terers over the area around the sinkhole and the deformation
the COSMO-SkyMed data identified many more measure-                       rate could be detected for inhabited areas only. These sur-
ment points and gave almost uniform point distribution for                face changes were concentrated mostly to the north of the
the whole area. Several locations were detected in the in-                deforming area, also identified in this study, but we detected
ner zone around the main sinkhole with a cumulated magni-                 measurement points in thinly vegetated areas too. The longer
tude of deformation as high as 40 mm for 4 months, which                  time span of this study confirmed that in the area of inter-
is equivalent to an average deformation rate of more than                 est deformation is still ongoing. For the displacement history

Nat. Hazards Earth Syst. Sci., 21, 977–993, 2021                                             https://doi.org/10.5194/nhess-21-977-2021
E. Szűcs et al.: Evolution of surface deformation related to salt-extraction-caused sinkholes                                       987

Figure 11. Vertical deformation rate determined from Sentinel-1 data from track 29 and track 80. Contains modified Copernicus Sentinel
data (2014–2019), background © Google Earth.

Figure 12. East–west (positive in east direction) deformation rate of the area of interest computed from ascending and descending deforma-
tion rates. Contains modified Copernicus Sentinel data (2014–2019), background © Google Earth.

curves (Figs. 7 and 8) it can be concluded that the uniform            mining underground. The estimated depth of underground
deformation model is adequate to interpret the results; no ac-         mines varies between 50 and 400 m, from the center to the
celeration or slowing-down trend can be identified.                    perimeter of the mining area. The approximate location of
                                                                       the mines was estimated based on the available maps. The
4.4   Source modeling                                                  parameter space of the dislocation models was constrained
                                                                       based on the rough location, geometry and orientation of un-
                                                                       derground mines available on maps as well as on the ap-
The coarse estimation of model parameters was accom-
                                                                       proximate depth of the salt layer. Lack of coherence, due
plished by forward modeling varying source model param-
                                                                       to either change in ground cover or a high rate of deforma-
eters on a predefined interval using the misfit function of
                                                                       tion, does not allow for the retrieval of the entire deformation
Eq. (3). Unfortunately, no reliable information is available
                                                                       pattern associated with sinkhole evolution. Therefore, cumu-
on the exact position, extension, orientation and depth of the

https://doi.org/10.5194/nhess-21-977-2021                                        Nat. Hazards Earth Syst. Sci., 21, 977–993, 2021
988 E. Szűcs et al.: Evolution of surface deformation related to salt-extraction-caused sinkholes lative deformations from ascending and descending satellite erate value of volume change suggests that this depression passes covering the same time period were utilized simulta- marks an early stage of sinkhole development. The sec- neously to increase the reliability of source model parameter ond source model (model no. 2) lies approximately 400 m estimation. The lack of deformation signal around the center southwest from the first one and has horizontal dimensions of the area of interest makes it difficult to identify the number of 63.5 m × 187.8 m; the required height change explaining of source models required to explain the subsidence pattern. the deformation pattern is −1.2 m. The elongated shape in Our results suggest a quad-source configuration of subsur- a roughly north–south direction of the source model is in face cavities. The best-fitting model parameters are summa- agreement with the subsurface mining activity. Between the rized in Table 3. main corridors of mines 9 and 10, long working panels were To refine the dislocation model parameters and estimate cut with varying lengths of between a few tens to a few hun- associated uncertainties, we performed a Bayesian proba- dreds of meters. The third dislocation model (model no. 3) bilistic inversion (Bagnardi and Hooper, 2018). This requires is located on the western periphery of the area affected by the error estimation of the data sets. Noise covariance of in- deformations. The model is roughly symmetric with a hor- dividual interferograms has been well studied; the main er- izontal side length of about 80 m and located at a depth of ror sources are the noise caused by the temporally correlated 273.1 m. There are several shallow mines there (numbered 1 phase decorrelation and the spatially correlated atmospheric to 5 in Fig. 3d), established around the 18th–19th century. phase delay. Since InSAR observations are inherently rela- These were completely destroyed as the numerous, small- tive, the additive phase delays make the accuracy of mea- scale dolines filled with brine indicate on the surface. The surements strongly dependent on the distance. There have source model parameters suggest that the inverse model- been several endeavors to provide an error analysis of time ing tried to find a global solution for the observed subsi- series InSAR output (see, e.g., Agram and Simons, 2015; dence pattern. However, a single source is unable to suffi- Cao et al., 2018, and references therein); however, we fol- ciently explain the complex deformation pattern; a number lowed the method of Parizzi et al. (2020) and estimated the of near-surface, small-scale voids, related to salt dissolution, variance–covariance matrix of InSAR data sets experimen- are needed as well. The fourth source model (model no. 4) tally. As Parizzi et al. (2020) point out, short-time-separated is located beneath the working panels of mine 8, where interferograms (supported by Sentinel-1 mission with multi- heavy subsidence occurred in around 2010, which resulted baseline analysis) are much more dominated by atmospheric in the formation of the twin lakes. The depth of the model propagation delay than by phase variation due to deforma- is about 296 m; the horizontal extension of the model is tion. After atmospheric phase correction the interferomet- 72.3 m × 82.1 m. The estimated opening is equal to an ap- ric measurement error is practically the residual atmospheric proximately 18×103 m3 volume change. Taking into account phase delay, as short-time-separated interferograms can be the horizontal extension of the existing surface depressions considered deformation-free. The mean variograms of the of the nearby twin lakes, 15 × 103 and 17 × 103 m2 , respec- residual atmospheric phase show a stationary behavior and tively, our modeling results seem reasonable. The questions can be approximated by a covariance function. Since both of whether a new doline will form and will merge with the ex- deformation and average velocity are related to the phase by isting two in the future and whether the boundary of the area a scale factor, the error estimates can be simply computed. affected by subsidence will expand towards the south require We used an exponential covariance model fitted to the data further observations with other tools besides radar interfer- to determine the variance–covariance matrix of deformation ometry. in the Bayesian inversion. For both the ascending and de- scending data sets, similar models were obtained with mod- erate range values of 2.4 and 2.2 km for the ascending and 5 Discussion descending data sets, respectively. Best-fit model parameters obtained from the forward mod- Although the detection of small-scale, episodic deformation eling were utilized as starting values for the Bayesian param- related to sinkhole generation can be challenging, several eter estimation. During the inversion the parameters were al- studies have demonstrated the potential of radar interferome- lowed to vary within reasonable limits taking into account try to characterize the post-collapse deformation of sinkholes the geological constraints and information on past mining (Baer et al., 2002; Galve et al., 2015; Kim et al., 2016; La activity. The optimal model parameters are summarized in Rosa et al., 2018), and there have been successful attempts to Table 3; coordinates are given in a local rectangular coor- identify precursory deformations before the catastrophic col- dinate system. Our final model assumes four rectangular- lapse (Nof et al., 2013; Jones and Blom, 2014; Malinowska et shaped subsurface cavities, developed in the salt layer. One al., 2019). In this study Sentinel-1 radar interferometry was source with a rectangular dislocation (model no. 1) of size utilized to investigate surface evolution in a salt karst envi- 24.1 m × 64 m is located above the eastern edge of work- ronment, where land cover differs significantly from area to ing panels of mine 9 at an estimated depth of 199.7 m. This area, and sinkhole detection can be monitored almost semi- mine was closed in 2008 due to water inrush. The mod- automatically. Several factors such as the complex geolog- Nat. Hazards Earth Syst. Sci., 21, 977–993, 2021 https://doi.org/10.5194/nhess-21-977-2021
E. Szűcs et al.: Evolution of surface deformation related to salt-extraction-caused sinkholes 989
Table 3. Analytical model parameters used in the source modeling. I refers to initial values and R to refined values; coordinates are given in
a local rectangular system, shown in Fig. 13.
Model no. 1 Model no. 2 Model no. 3 Model no. 4
I R I R I R I R
Length [m] 36 24.1 72.5 63.5 80 78.2 80 72.3
Width [m] 42 64.0 176 187.8 80 81.8 90 82.1
Depth [m] 180 199.7 222 231.9 280 273.1 295 295.9
Strike angle [◦ ] 5 12.8 21.5 19.1 22 18.7 21 17.1
X center [m] −870 −880.3 −1195 −1259.1 −1600 −1630.8 −1700 −1700.5
Y center [m] 1160 1195.8 956 1029.6 230 224.9 810 793.1
Opening [m] −3.2 −2.8 −1.4 −1.2 −3.9 −2.3 −3.8 −3.1
ical conditions (relatively large and shallow salt structure), Apart from larger discrepancies at some individual points,
the specific hydrological setting (wet and warm continen- the modeled deformation pattern fits well to the observed
tal climate with increased precipitation rate in warm season, one. However, one has to keep in mind when evaluating the
close proximity of a main river) and the mining conditions inversion performance that it was not possible to properly
(damaged waterproof layer, mining levels at different depth, sample the deformation pattern with InSAR, as only the mar-
cracks in the rock masses) increase the susceptibility to sink- gins of the area were mapped adequately. Due to the sparse
hole evolution. In this regard a single case study cannot serve InSAR observation distribution in the middle of the area,
to draw general conclusions on sinkhole generation mecha- we could not fit a proper source model there, which can be
nisms; however, the experiences can be invaluable for mak- seen immediately when inspecting the modeled and observed
ing assessments and optimizing future monitoring method- deformations along selected profiles given in Fig. 15 (same
ologies. profiles as cross sections A–B and C–D). Regarding the as-
The Sentinel-1 radar interferometry results show that the cending data set, the same north–south-oriented profile was
detection of sinkhole evolution is feasible in the area, al- used to check the model fit to InSAR observations as shown
though it should be remarked that the point density of PSs in Fig. 9 to check the subsidence evolution in time. In the
and DSs is not sufficiently homogeneous. The complexity of northern part (starting from point A to approx. 200 m) of
the mechanism driving surface deformation as well as the in- the cross section the source models are capable of explain-
adequate sampling of the deformation pattern was revealed ing reasonably well the observed deformation. The misfit of
while explaining the subsidence pattern above the mining the modeled deformation is characterized by a standard de-
area by utilizing analytical modeling. viation (SD) of ±0.49 cm. However, for the second half of
InSAR analysis showed that there is a continuous subsi- the investigated profile, between 200 and 800 m, the mod-
dence with a pronounced linear trend. Therefore, as a first- eled deformation differs significantly from the observed one.
order approximation, elastic modeling was utilized to ex- The reason for the large discrepancies in the middle of the
plain the sinkhole formation. The quantitative analysis of the cross section comes from the fact that it was not possible to
source modeling is shown in Figs. 13 and 14 in terms of find a proper source model based on the very scarce InSAR
the LOS deformation determined from the best-fitting quad- observations in the center of the area. On the southern edge
configuration source model (top) and the Sentinel-1 cumu- of the cross section (between 700 and 800 m) the applied sin-
lative LOS deformations (middle) as well as from the dif- gle source model is not capable of resolving the observed de-
ference between the observed and modeled values (bottom), formation. The InSAR-derived deformations probably reflect
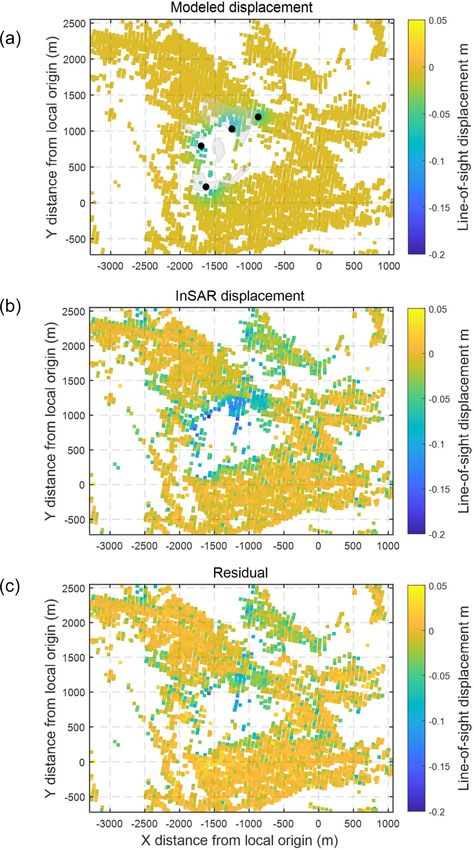
for both the ascending and descending passes, respectively. It the effect of more than one subsurface cavern. Figure 15b
can be asserted that the main features of the subsidence pat- shows the observed and modeled deformations in a roughly
tern on the northern and southern periphery are reasonably east–west cross section (C–D; for the location please check
well captured by the source models. However, the modeled Fig. 10). The modeled deformation shows a reasonably suffi-
deformation in the western part of the area does not fit the ob- cient fit to the InSAR deformations. The misfit of the model
servations, especially when compared to the ascending data is characterized by a ±1.87 cm SD. The magnitude of the
set, where modeled deformation overestimates the observed observed deformation is adequately described by the model;
one. As it was pointed out earlier, under this area the salt however, the location of extremities is slightly misestimated.
layer upwells close to the surface and many small dropout The profile crosses the area in the north, where model no. 1
dolines form, and a single source model cannot adequately and model no. 2 are located. The effect of the two source
explain the surface deformation pattern. models can be separated in the modeled deformations. Of
course, the fine details revealed by InSAR observations can-
https://doi.org/10.5194/nhess-21-977-2021 Nat. Hazards Earth Syst. Sci., 21, 977–993, 2021990 E. Szűcs et al.: Evolution of surface deformation related to salt-extraction-caused sinkholes
Figure 13. Cumulative LOS deformation (a) computed from the Figure 14. Cumulative LOS deformation (a) of the best-fitting
quad-configuration source model (black dots denote the location model using four dislocation sources (black dots denote the location
of source models; gray polygons show the boundary of mines), of source models; gray polygons show the mining area), (b) from
(b) from the ascending Sentinel-1 observation and (c) from resid- the descending Sentinel-1 observation and (c) from residuals after
uals after subtracting the best-fitting model. subtracting the modeled displacement from the cumulative defor-
mation.
not be reproduced by analytical modeling. Despite the sim-
ple formulas, analytical models can produce reasonable first- a more complex rheology can better constrain the precur-
order results of the subsurface processes. Besides the above sory subsidence of sinkhole-prone areas as Baer et al. (2018)
limitations, it should be mentioned that the possible interac- demonstrated. The gradual surface subsidence suggested by
tion between the sources was not considered during the com- the elastic deformation also agrees with the geological con-
putation. As Pascal et al. (2013) pointed out, superposition ditions of the area. Geomorphological investigations (Móga
of analytical models requires attention for adjacent models. et al., 2015) confirmed that the main driving mechanism of
Despite the limitations of the analytical formulas, the as- sinkhole formation in the area is much more like the mech-
sumed elastic rheology fits well to the temporal behavior of anism of the perfect suffosion of non-cohesive soils than the
surface deformation, which implies that the cavity evolution sudden dropout of cohesive soils. The spatial distribution of
is in its early stage. However, it should be mentioned that observed surface deformations supports that the subsidence
Nat. Hazards Earth Syst. Sci., 21, 977–993, 2021 https://doi.org/10.5194/nhess-21-977-2021E. Szűcs et al.: Evolution of surface deformation related to salt-extraction-caused sinkholes 991
1 interferometry, which is a cost-effective way to obtain an
overview of ground movements. Our results suggest that fur-
ther steps should be taken by local authorities in order to sta-
bilize the mine shafts and improve the drainage system. Al-
though several sinkholes have opened in the last 20 years, the
geomorphological processes have not ended yet, and there
are hundreds of meters of intact mining holes that could pose
a natural geohazard risk in the future.
Code availability. This paper uses the proprietary Gamma software
and the publicly available GBIS code (Bagnardi and Hooper 2018).
Data availability. Raw Sentinel-1 data is distributed by the Euro-
pean Space Agency. The data that support the findings of this study
are available from the corresponding author, Eszter Szűcs, upon rea-
sonable request.
Supplement. The supplement related to this article is available on-
Figure 15. Observed cumulative LOS and best-fitting model LOS line at: https://doi.org/10.5194/nhess-21-977-2021-supplement.
deformations along selected profiles (given in Figs. 9 and 10) for
the ascending (a) and descending (b) passes.
Author contributions. Conceptualization was by ES and VW;
methodology and SAR data analysis was by IB, LB and CS; SG
is confined to the territory of the mining area, which im- and AS were responsible for the geological and geographical back-
plies that natural salt karst processes are initiated and ac- ground; ES and VW were responsible for interpretation. All authors
celerated by the anthropogenic intervention. No deceleration contributed to writing the original draft and making corrections dur-
of the ground movement was observed, which suggests that ing the review process.
the dissolution of subsurface salt layers has become a self-
sustaining geological process.
Competing interests. The authors declare that they have no conflict
of interest.
6 Conclusions
Special issue statement. This article is part of the special issue “Re-
Salt mining operations in Solotvyno obviously demonstrate
mote sensing and Earth observation data in natural hazard and risk
the severe and long-term consequences of reckless industrial studies”. It is not associated with a conference.
salt exploitation. In a sense, the mining area has now be-
come a natural laboratory, where salt karst processes evolv-
ing much faster than in carbonate rock can be studied in Acknowledgements. Sentinel-1 data are copyrighted by the Euro-
great detail. Based on Sentinel-1 SAR interferometry we pean Space Agency and are additionally distributed by the Alaska
have demonstrated that significant surface deformation is still Satellite Facility. We thank the editor Mahdi Motagh and the two
ongoing nowadays related to the former salt mining oper- anonymous reviewers for their careful and thorough reviews.
ations. We revealed a cumulative line-of-sight deformation
of up to nearly 15 cm in 4.5 years. It was also shown that
the deformation has neither accelerated nor decelerated dur- Financial support. This research has been supported by the Na-
ing the investigated time period. Elastic inverse modeling of tional Research, Development and Innovation Office (National Ex-
the observed deformations was utilized to constrain the ge- cellence Program, grant no. 2018-1.2.1-NKP-2018-00007).
ometry of the subsurface cavities. Although Sentinel-1 inter-
ferometry was capable of capturing the deformation history
of individual points, the modeling failed in some cases due Review statement. This paper was edited by Mahdi Motagh and re-
to the insufficient InSAR point density, resulting in signifi- viewed by two anonymous referees.
cant discrepancies between observed and modeled deforma-
tion. Despite the limitations of the study, it was shown that
precursory sinkhole formation may be detected by Sentinel-
https://doi.org/10.5194/nhess-21-977-2021 Nat. Hazards Earth Syst. Sci., 21, 977–993, 2021You can also read