Appendix 0 Sea Dumping Permit Application (SDPA) Lanco Australia Pty Ltd - April 2012
←
→
Page content transcription
If your browser does not render page correctly, please read the page content below
Appendix 0
Sea Dumping Permit Application (SDPA)
               Lanco Australia Pty Ltd
                                April 2012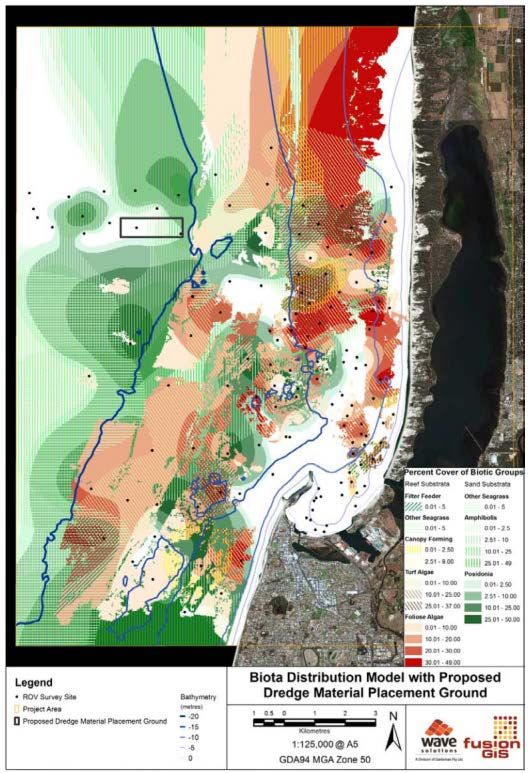
Sea Disposal Application
                  Dredged or Excavated Material

                                 Important Information

ABOUT THIS FORM

Important – Please read this information carefully before you complete your application. Once
you have completed your application we strongly advise that you keep a copy for your
records.

WHO SHOULD USE THIS FORM?

This application form was approved on 26 June 2012, pursuant to subsection 18(2) of the
Environment Protection (Sea Dumping) Act 1981 (the Sea Dumping Act). If you propose to
dispose of dredged or excavated material at sea then you must complete this form.

COMPLETE APPLICATIONS

The department encourages the lodgement of complete applications. If further information is
required to assess your sea disposal application, then the time within which the Minister is
required to assess your application will be paused and reset pursuant to section 18 of the
Environment Protection (Sea Dumping) Act 1981 (Sea Dumping Act).

You should read this application in conjunction with the National Assessment Guidelines
for Dredging 2009 (NAGD). The NAGD detail the procedures which should be followed in
sampling, testing and assessing the suitability of material to be disposed of at sea. The
guidelines also detail how disposal sites are to be evaluated and monitored. The NAGD are
available at: www.environment.gov.au/coasts/pollution/dumping/guidelines.html

Where you require a specialist report to fulfil the requirements set out in the NAGD, then you
should attach the specialist report to your application. You should also provide brief answers
to the questions provided, cross-referenced to the relevant sections of the report.

Your application must clearly:

•   demonstrate that you have considered alternatives to sea disposal;

•   describe the material to be disposed of at sea including how it will be transported from the
    origin to the disposal site and how it will be disposed of at sea;

•   identify the origin and quantity of the material to be disposed of at sea;

•   provide details of the physical and chemical composition of the material to be disposed of
    at sea;

                                                                                               1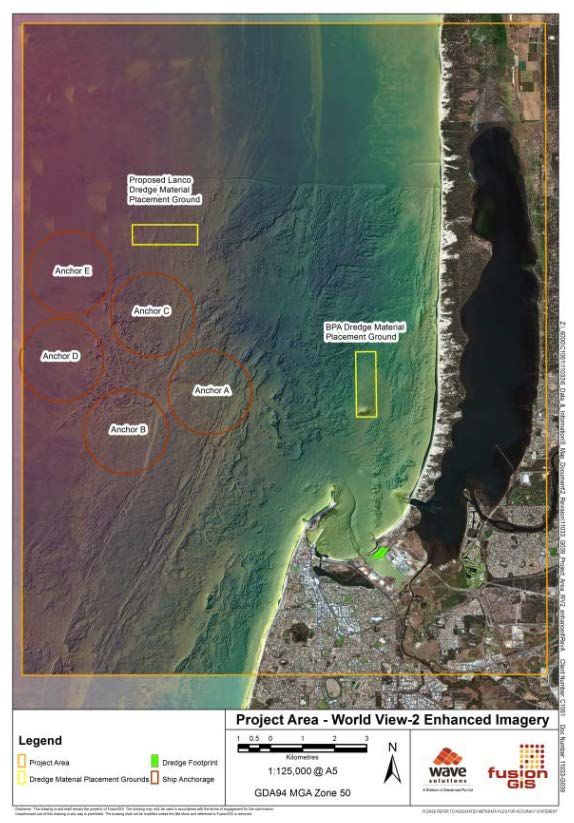
•   detail any toxicity characteristics of the material to be disposed of at sea; and

•   provide details regarding the disposal locality and any potential environmental impacts at
    the disposal site.

OBLIGATION TO COOPERATE WITH INSPECTORS

Sections 26 to 32 of the Sea Dumping Act provide amongst other things that the Minister may
appoint inspectors for the purpose of policing the Sea Dumping Act. An inspector may board
vessels, aircraft or platforms or stop and detain vessels or aircraft.

ENVIRONMENT PROTECTION AND BIODIVERSITY CONSERVATION ACT 1999

The Environment Protection and Biodiversity Conservation Act 1999 (the EPBC Act) is the
Australian Government’s central piece of environmental legislation. It provides a legal
framework to protect and manage nationally and internationally important flora, fauna,
ecological communities, heritage places, the Commonwealth marine area and the Great
Barrier Reef Marine Park — defined in the EPBC Act as matters of national environmental
significance. For a detailed discussion of assessment under the EPBC Act and how it
interacts with the Sea Dumping Act refer to Section 2.1.2 of the NAGD.

The EPBC Act affects any group or individual (including companies) whose actions may have
a significant impact on a matter of national environmental significance. Persons who may
have a significant impact on a matter of national environmental significance must refer their
proposed action pursuant section 68 of the EPBC Act.

Section 160 of the EPBC Act requires the a decision maker in some circumstances to seek
advice under the EPBC Act prior to making a decision with respect to a sea disposal permit.
To ensure efficient co-ordination of the assessment process, it is important that the
department is aware of any referrals the proponent has made under the EPBC Act. As such,
it is advisable that proponents discuss proposed actions with the department prior to
submitting a sea disposal application.

Please note that if the project has been referred under the EPBC Act that a decision on a sea
disposal permit application cannot be made until the project has either been determined to be
“not a controlled action” or the Minister has approved the proposal.

APPLICATION FEE

The Environment Protection (Sea Dumping Regulations) 1983 (the Sea Dumping
Regulations) prescribe the fee payable for a sea disposal application. For an application for a
permit to dispose of dredged or excavated material into any part of the sea, the following fees
are prescribed pursuant to clause 5(2) of the Sea Dumping Regulations as follows:

                                                            3
    (a)   if the volume of the material exceeds 100 000 m       -- $23 500;
                                                                      3
    (b)   if the volume of the material does not exceed 100 000 m         -- $10 000.

Clause 5B of the Sea Dumping Regulations requires the application fee to be paid no later
than 30 days after the application is submitted. A failure to pay the application fee within the
prescribed timeframe will result in the application been invalid. This means that if your
application is invalid you will need to submit a new application to the Department if you wish
to pursue an application.

METHOD OF PAYMENT

                                                                                                   2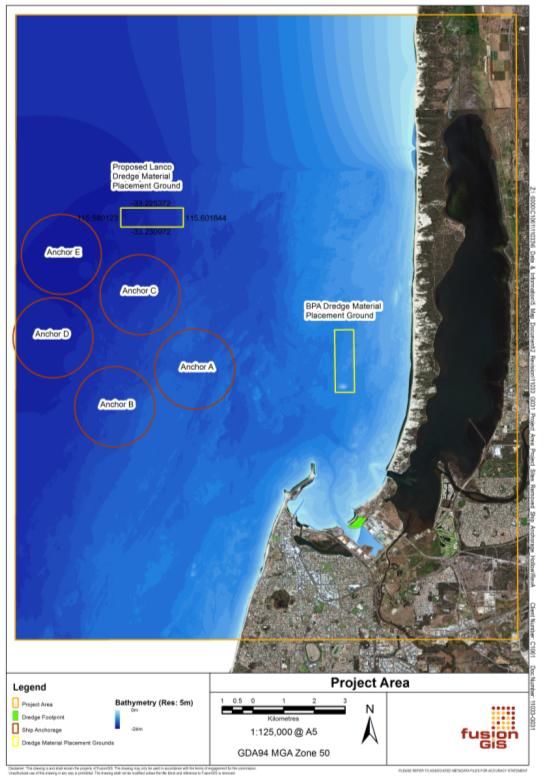
To make a payment, the department’s preferred methods of payment are by credit card, bank
cheque, money order or by electronic funds transfer (EFT).

Cheques

You must make your payment payable to “Department of Sustainability, Environment, Water,
Population and Communities”. You should include a remittance advice.

EFT Payments

EFT Payments can be made to:

BSB: 092-009
Bank Account No. 115859
Amount: $
Account Name: Department of Sustainability, Environment, Water, Population and
Communities
Bank: Reserve Bank of Australia
Bank Address: 20-22 London Circuit Canberra ACT 2601
Reference: Cost Centre 12106, GL A/c 52300
Description: Sea Disposal Permit Application – Name of Project

LODGING YOUR APPLICATION

You may lodge your application at the following address:

Director
Ports and Marine Section
Department of Sustainability, Environment, Water, Population and Communities
GPO Box 787
Canberra ACT 2601

WHAT HAPPENS NEXT?

Your application will be considered and you may be asked to provide additional information to
enable a decision to be made.

FURTHER INFORMATION

Further information may be obtained from: portsandmarine@environment.gov.au

                                                                                            3
PART A – APPLICATION SUMMARY
What is the legal name of the business, organisation or company?
Lanco Resources Australia Pty Ltd
Contact Person:
Mr David Trench
PO Box 568
West Perth, WA, 6872
08 6188 2277 / 0417 900 156
Type of Material Requiring Disposal:
✕ Capital ✕ Dredge
Maintenance ✕ Excavation
WGS84 co-ordinates of disposal site:
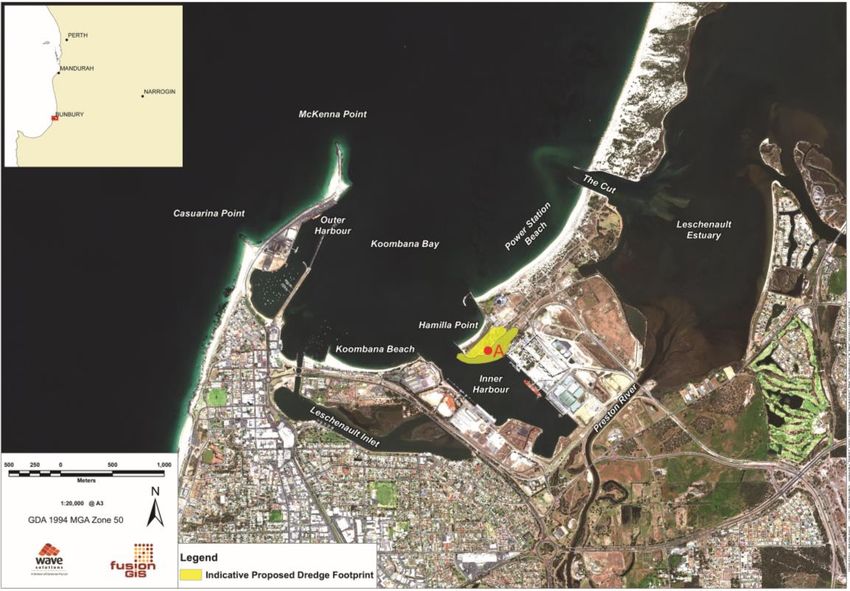
The disposal site is located and the following WGS84 co-ordinates and is shown in Figure 1:
Latitude Longitude
-33.225372 115.580123
-33.225372 115.601844
-33.230792 115.601844
-33.230792 115.580123
Dates of proposed disposal operations:
Dredging is proposed to commence in approximately October 2015.
Dredging works below sea level are estimated to take approximately 40 weeks plus five
weeks for rock removal (if required) and includes both marine and terrestrial footprints.
Volume (cubic metres) of material to be disposed of:
2,700,000 m³ (of which up to 1,900,000 m³ is proposed for ocean disposal).
Length of permit applied for in this application:
2 years
Details of previous sea disposal permits that you have been granted:
No previous sea disposal permits have been granted to Lanco Resources Australia.
4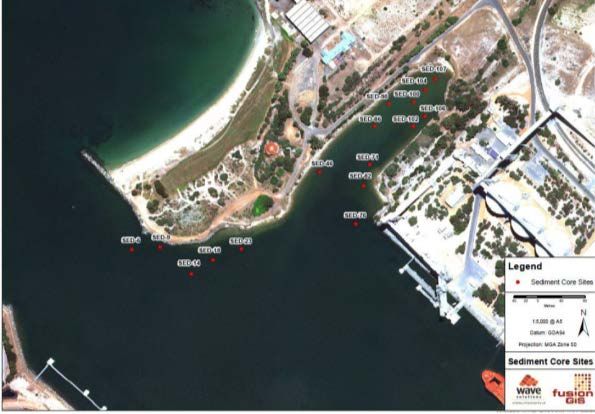
Figure 1 - Location of the proposed Lanco material placement ground.

                                                                       5
PART B - APPLICANT

2.0 Identity of applicant

2.1 Applicant Details

What is the legal name of the business, organisation or company?

Lanco Resources Australia Pty Ltd

What is the registered business name or trading name under which you operate? (if different
from legal name):
As above

Australian Business Number (ABN):

30 147 835 452

Australian Company Number (ACN) (if applicable):

147 835 452

Street address of the business (where the business is physically located):

 st
1 Floor, 677 Murray Street

West Perth, Western Australia 6005

Postal address of the business (If same as street address, write ‘AS ABOVE’):
PO Box 568

West Perth, WA, 6872

2.2 Contact Person

Contact person for enquiries: David Trench

Phone: (08) 6188 2277

Email: d.trench@griffincoal.com.au

3.0 Identity of the owner of the material to be disposed of at sea
    (if different to 2.0)

3.1 Owner Details:

Bunbury Port Authority.

What is the legal name of the business, organisation or company?:

Bunbury Port Authority.

What is the registered business name or trading name under which you operate? (if different
from legal name):
Australian Business Number (ABN): 30 044 341 250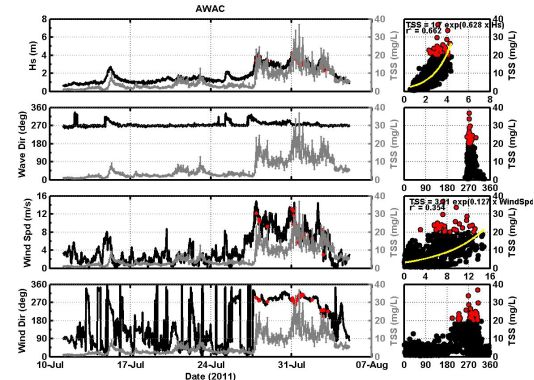
Australian Company Number (ACN) (if applicable): n/a

Street address of the business (where the business is physically located):
54 Casuarina Drive

Bunbury, Western Australia, 6230

Postal address of the business (If same as street address, write ‘AS ABOVE’)
Bunbury Port Authority

PO Box 4

Bunbury, Western Australia, 6230

3.2 Contact Person

Contact person for enquiries: Duncan Gordon (HSE Manager)

Phone: (08) 9729 7072

Email: hse@byport.com.au

                                                 2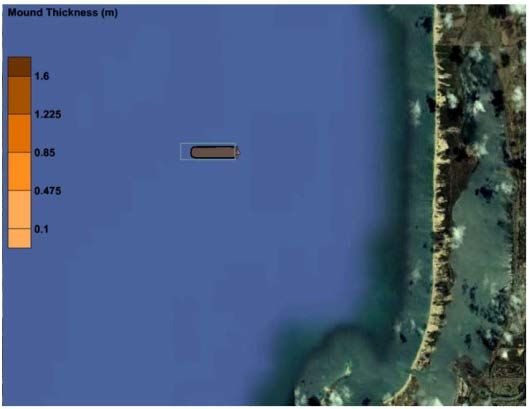
PART C – ALTERNATIVES TO SEA DISPOSAL

4.0      Consider alternatives to sea disposal

4.1 You should identify alternative options for the disposal of dredged or excavated material other
than sea disposal. These options should include:

•     not dredging or excavating;
•     re-use (e.g. land creation, beach nourishment, offshore berms, fill);
•     off-site recycling (for example, as construction material);
•     treatment to destroy or remove hazardous constituents for beneficial use; and
•     disposal on land.
Please specify the options you have considered.

Potential beneficial uses for the dredge material derived from Berth 14A for considered and included the
following options:

a)      nourishment of eroding beaches to the north of Bunbury
b)      fill material for building up low level construction areas within the site
c)      fill material for building up low level construction areas in offsite locations

Option A – Nourishment of eroding beaches

Assessment of the dredge material within the footprint has been the subject of a number of previous
geotechnical and contaminant related studies. The particle size distribution (PSD) was analysed from
four samples from three sediment cores from within the dredge footprint taken during the assessment of
this site (Attachment A – Marine Sediment Sampling and Analysis Plan).

In addition, 27 PSD samples from previous studies undertaken within the Project area were extracted
and adjusted to Australian Height Datum (AHD) and added to the data collected for this study. The
average percentage passing across the depth profile is shown in Figure 2. The fine particle fraction
( 250µm,
suggesting a sandy layer. The 8.0 to 9.0m below AHD depth interval has a lower PSD, 50% passing for
particles < 30µm, suggesting a clay lens. The results of this analysis indicate that, as expected in an
estuary mouth, the dredge material is comprised of silty sand with finer material located deeper in the
profile. This type of material is therefore generally unsuitable for potential beneficial use in the
nourishment of beaches because of the high silt and clay content (~30%). Consequently Option A was
excluded from further assessment.

                                                        3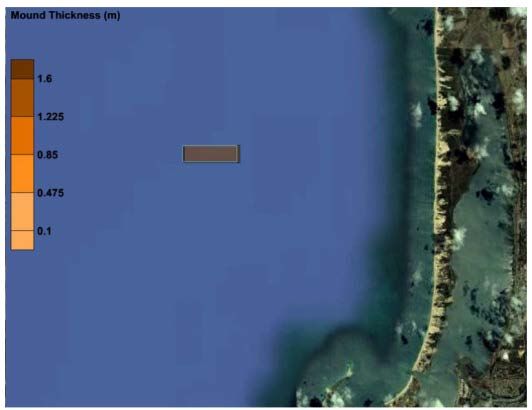
100%

                       80%

                       60%
  Percenatge Passing

                                                                                      >500µm PSD
                                                                                      250-500µm PSD
                                                                                      125-250µm PSD
                       40%                                                            63-125µm PSD
                                                                                      30-63µm PSD
                                                                                      10-30µm PSD

                       20%
An additional problem with reclamation of deeper material for off-site disposal is the limited land area
available for a dewatering facility at the Berth 14A site that can contain the material and adequately treat
tailwater to suitable water quality criteria. The area is highly constricted and suitable material to build
bunding for containment of a facility is not available nearby. The area is also located in a low lying area
with sensitive wetlands adjoining the area. Compounding this impediment is the very significant trucking
required to move the material off-site through a high traffic urban corridor that services the township of
Bunbury.
Given the high risk of PASS being present in the deeper dredge material renders the material a high
long-term risk for onshore placement. In addition the high level of fines identified in the material makes it
a low quality fill material that is unsuitable for meeting even basic engineering loads in construction
sites. Moreover, the Berth 14 onshore site footprint available for onshore reclamation of material
removed from below sea level in the dredge footprint is of inadequate area for even the most limited of
dewatering of the material and treatment of tailwater. The activity envisaged in this Option would also be
further compounded by the highly urbanised route that material would have to be trucked through to any
possible site that would be able to accept the material.
Consequently Option C was excluded from further assessment.
4.2 Explain why your preferred option for disposal of the dredged or excavated material is sea
disposal. In explaining why sea disposal is your preferred option you should provide:
• comparative cost estimates of the above alternatives (including sea disposal);
• detail any risk(s) to human health of the above alternatives (including sea disposal); and
• detail any risks to the environment of the above alternatives (including sea disposal).
As discussed above, Options A and C were not considered feasible and no further assessment was
undertaken. The beneficial use of Option B is being considered and where possible fill material above
the water table will be used for earthworks on the site.
As beneficial use of below water table dredge material was not feasible in this instance, offshore
placement of dredge material was chosen as the preferred method for placement of dredge material. To
evaluate the suitability of different sites for the at-sea placement of dredge material, a site selection
assessment framework was used. This site selection framework was based on NAGD criteria and is
described further in the Site Selection and Assessment for Offshore Placement of Dredge Material
Report (Wave Solutions, 2012b. Section 2).
A logistical assessment was included during the site selection assessment (Wave Solutions, 2012b.
Section 4). Based on a hopper barge carrying 60% capacity of dense material, the loading time for a
barge would range between 78 and 106 minutes. Based on an unloading time of 10 minutes and a
mooring time of 5 minutes, the cycle time to travel to and from the placement ground is between 63 and
91 minutes. At an average speed of 10 knots, the disposal ground would need to be no further than 14
km from the dredge footprint if the use of additional hopper barges was to be avoided as this would lead
to increased cost and loss of efficiency of dredge plant utilisation.
Benthic habitat assessments were undertaken with results of the survey used to optimise the location of
the dredge material placement ground in relation to benthic habitats occurring in the region. Further
details of the characteristics of the disposal site are included in Section 10.5.
Results of the contamination assessment of the dredge material and surficial sediments of the proposed
placement site reported no exceedances at either site. Further details are provided in the Marine
Sediment Sampling and Analysis Plan (Attachment A).
5Literature Cited – Part C
• Evans and Peck, (2009) Bunbury Port Authority, Inner Harbour Expansion, Berth 14 Option Study
Report. Prepared for Bunbury Port Authority
• Wave Solutions (2012a). Bunbury Port Berth 14 Expansion and Coal Storage and Loading
Facility – Marine Environmental Quality Studies
• Wave Solutions (2012b). Bunbury Port Berth 14 Expansion and Coal Storage and Loading
Facility – Site Selection and Assessment for Offshore Placement of Dredge Material Report
6PART D – DETAILS OF TESTING AND MONITORING PREVIOUS TO
THIS APPLICATION
5.0 Testing and Monitoring
5.1 Details of previous permits
Not applicable
6.0 Exemptions
Has an exemption from detailed testing requirements been given? (refer to section 4.2.1 of the NAGD
for grounds for exemption).
No
7PART E - DESCRIPTION AND ANALYSIS OF MATERIAL TO BE
DISPOSED OF AT SEA
7.0 Description of the material to be disposed of at sea
7.1 Type of Material Requiring Disposal:
✕ Capital ✕ Dredge
Maintenance ✕ Excavation
7.2 What is the volume of material (in situ) in cubic metres to be disposed of?
2,700,000 m³ (of which up to 1,900,000 m³ is proposed for ocean disposal).
7.3 Describe the project that will generate the dredged or excavated material.
The dredge material will be generated from the construction of Berth 14A within the Inner Harbour of
Bunbury Port, Western Australia. The construction of Berth 14A is to support the operation of a land
based coal handling facility.
7.4 Location of material to be dredged or excavated.
The location of the material to be dredged is identified in Figure 3 below. The location of point “A” shown
on the figure is -33.318670°, 115.661233° (WGS 84 coordinates). Figure 4 shows the bathymetry for
Koombana Bay.
Figure 3: Locality plan showing location of material to be removed.
8Figure 4: Bathymetry of the modelled domain
7.5 Physical description of material
Core sampling from within the dredge footprint determined the physical description of the material. The
material from the dredge footprint ranges from sand to heavy clay. Typically the surface 0.5 m of the
marine dredge footprint consists of clay loam to light clay and underlying material (up to 2 m deep) is
typically sandy clay to heavy clay. Typically the surface, up to 3 m, of the terrestrial dredge footprint is
sand to loamy sand and the underlying material ranges (up to 13.5 m deep) from sand to heavy clay.
A qualitative assessment of core logs sampled during the current and previous studies within the
proposed dredge footprint was also undertaken. The sediment types within the indicative sediment
profile are shown in Figure 5 below. This indicative profile depicts a clay lens at 8.5 to 10 m below AHD
and 12.5 to 14 m below AHD.
9Figure 5: Indicative sediment profile. Yellow: sandy loam (10-20 %clay); Brown: medium heavy clay
(50% or more clay); Tan: silty clay loam (20-30% clay); and BA: basalt (McDonald and Isbell, 2009).
107.6 Chemical description of material
Tables 1- 3 provide a summary of the composition of metals, inorganics and organics within the
proposed dredge footprint.
Table 1 Metal levels within the proposed dredge footprint
Screening 95% Upper
Parameter Units Mean
Level Confidence Limit
Aluminium N.A. mg/kg 7,160 2,203
Antimony 2 mg/kg 1.09 0.13
Arsenic 20 mg/kg 5.6 1.1
Cadmium 1.5 mg/kg 0.06 0.01
Chromium 80 mg/kg 24.5 2.8
Cobalt N.A. mg/kg 2.6 0.6
Copper 65 mg/kg 6.78 2.09
Iron N.A. mg/kg 10,113 2,648
Lead 50 mg/kg 5.20 1.26
Manganese N.A. mg/kg 88.1 16.9
Mercury 0.15 mg/kg 0.02 0.01
Nickel 21 mg/kg 5.1 1.4
Selenium N.A. mg/kg 0.31 0.14
Silver 1 mg/kg 0.07 0.01
Vanadium N.A. mg/kg 19.46 4.79
Zinc 200 mg/kg 15.9 4.8
Table 2 Inorganic parameters within the proposed dredge footprint
Screening 95% Upper
Units Mean
Level Confidence Limit
Nitrogen, total N.A. mg/kg 1,432 422
Ammonium N.A. mg/kg 4.2 1.1
Nitrite N.A. mg/kgTable 3 Organic parameters within the proposed dredge footprint
Screening 95% Upper
Units Mean
Level Confidence Limit
Organics
Total PCBs 23 μg/kg 5.00
Pesticides
pp-DDD 2 μg/kg 2.21 1.928
pp-DDE 2.2 μg/kg 1.31 0.778
DDT 1.6 μg/kg 0.50 0.000
Dieldrin 0.02 μg/kg 1.00 0.000
Chlordane 0.5 μg/kg 0.50 0.000
Lindane 0.32 μg/kg 0.50 0.000
Endrin 0.02 μg/kg 1.00 0.000
PAH
Acenapthene 16 μg/kg 5.000 0.000
Acenapthalene 44 μg/kg 5.000 0.000
Anthracene 85 μg/kg 5.000 0.000
Fluorene 19 μg/kg 5.000 0.000
Napthalene 160 μg/kg 5.000 0.000
Phenanthrene 240 μg/kg 5.000 0.000
Low Molecular μg/kg
552
Weight PAHs
Benzo [a] μg/kg
261 5.151 0.297
anthracene
Benzo [a] pyrene 430 μg/kg 5.000 0.000
Dibenz[a,h] μg/kg
63 5.000 0.000
anthracene
Fluoranthene 600 μg/kg 5.909 1.240
Chrysene 384 μg/kg
2-methylnapthalene 70 μg/kg 5.000 0.000
Pyrene 665 μg/kg 5.606 0.930
High Molecular μg/kg
1700
Weight PAHs
Total PAH 4000 μg/kg 85.000 0.000
Organotins
Tributyltin as Sn 5 μg/kg 8.369
a
7.571
a
Elevated TBT average due to sample spike derived from 2 surface TBT samples (out of 11 initial samples) located in a
downwind “cul-de-sac” in the dredge footprint.
Results (mean and 95% UCL) in Table 3 have been calculated from all samples, both initial and subsequent sampling. No
samples have been omitted from the calculations.
127.6.1 Is the concentration of any chemical constituent above the Screening Levels in Table 2 of
the NAGD?
✕ Yes No
If ‘No’, go to question 7.10.
If ‘Yes’, list the chemical constituents and their levels.
Table 4 provides a summary of the chemical constituents above the NAGD screening levels for each
sample site. Figure 5 identifies the sample location.
Please refer to Attachment C for a further discussion of elevated TBT levels observed at two sample
sites within the downwind area of the dredge footprint.
Table 4 Chemical constituents above the screening level
Tributyltin
Antimony Arsenic Nickel pp-DDE pp-DDD as Sn
Screening Level 2.0 20 21 2.2 2 5
SED6 0-0.5m 2.0 12 12 0.5 0.5 5.4
SED6 0.5-1.0m 1.0 11 12 0.5 0.5 7.5
SED6 1.0-2.0m 1.0 13 15 0.5 0.5 6.4
SED9 0-0.5m 0.5 2 2 0.5 0.5 3.7
SED9 0.5-1.0m 0.5 2 1 0.5 0.5 0.25
SED14 0-0.5m 2.0 19 18 0.5 0.5 4
SED14 0.5-1.0m 2.0 21 20 0.5 0.5 4.2
SED18 0-0.5m 2.0 14 14 0.5 0.5 22
SED18 0.5-1.0m 2.0 15 17 0.5 0.5 0.25
SED18 1.0-2.0m 0.5 2 5 0.5 0.5 5.5
SED23 0-0.5m 2.0 14 16 2.1
SED23 0.5-1.0m 2.0 12 15 0.25
SED23 1.0-2.0m 0.5 5 2 7.8
SED46 0-0.5m 2.0 16 18 2 2.5 1.7
SED46 0.5-1.0m 3.0 16 14 4.8 7.7 1
SED71 0-0.4m 1.0 7 6 1.3 1.9 0.25
SED71 0.4-1.0m 0.5 1 0.5 0.5 0.5 8.8
SED76 0-0.5m 0.5 7 7 15
SED76 0.5-1.0m 2.0 11 12 14
SED76 1.0-2.0m 0.5 8 8 1.9
SED82 0-0.5m 0.5 4 4 0.25
SED82 0.5-1.0m 0.5 1 2 2.5
SED86 0-0.5m 0.5 6 6 3.8 5.6 0.25
SED86 0.5-1.0m 2.0 10 12 6.9 19 0.25
SED86 1.0-2.0m 1.0 6 7 1.9
SED90 0-0.5m 3.0 15 30 0.25
SED90 0.5-1.0m 2.0 7 9 0.25
SED102 0-0.5m 0.5 4 4 0.5 0.5 0.25
SED102 0.5-1.0m 0.5 1 1 0.5 0.5 0.81
SED106 0-0.5m 0.5 6 5 170
SED106 0.5-1.0m 0.5 2 3 140
SED107 0-0.5m 0.5 3 3 0.5 0.5 0.8
SED107 0.5-1.0m 0.5 1 0.5 0.5 0.5 0.25
SED107 1.0-2.0m 0.5 2 0.5
SEDD100-1 0-0.5m 0.25
SEDD100-1 0.5- 3.8
131.0m
SEDD100-2 0-0.5m 0.25
SEDD100-2 0.5-
1.0m 4.9
SEDD100-3 0-0.5m 0.6
SEDD100-3 0.5-
1.0m 2.7
SEDD104-1 0-0.5m 0.25
SEDD104-1 0.5-
1.0m 2
SEDD104-2 0-0.5m 0.25
SEDD104-2 0.5-
1.0m 3.6
SEDD104-3 0-0.5m 0.25
SEDD104-3 0.5-
1.0m 1.4
SEDD106-1 0-0.5m 0.25
SEDD106-1 0.5-
1.0m 0.81
SEDD106-2 0-0.5m 0.25
SEDD106-2 0.5-
1.0m 3.7
SEDD106-3 0-0.5m 0.25
SEDD106-3 0.5-
1.0m 2.8
SEDD107-1 0-0.5m 3
SEDD107-1 0.5-
1.0m 3.7
SEDD107-2 0-0.5m 1.3
SEDD107-2 0.5-
1.0m 1.7
SEDD107-3 0-0.5m 0.91
A further summary and discussion of TBT exceedances at downwind sample sites is included in
Attachment C.
14Figure 6 – Sample locations within the marine dredge footprint.
7.6.2 Are any of the chemical constituents listed in 7.6.1 (that is, those above Screening Levels) also
above the background levels at the disposal site?
Yes ✕ No
If ‘No’, go to question 7.10.
If ‘Yes’, list the chemical constituents and their background levels at the disposal site.
7.7 Elutriate testing
Not applicable
7.8 Bioavailability testing
Not applicable
7.9 Sediment toxicity testing (refer to 4.2.4 of the NAGD)
Not applicable
7.10 Biological Assessment
7.10.1 Have any introduced marine organism surveys been undertaken at or near the dredging
location.
X Yes No
Invasive marine species surveys have been undertaken by Bunbury Port every two years since 1998
(SKM 2006, 2009a, 2009b). Three survey areas, the Outer Harbour, Koombana Bay and Inner Harbour
15were selected as they have areas considered at high risk for containing introduced marine species.
These areas have:
• frequent and persistent domestic and international vessel activity (commercial and recreational);
• permanent artificial structures (e.g. moorings, berths and pylons);
• reduced flow or high residence times of the water column; and
• known intertidal and subtidal habitat characteristic of the region.
7.10.2 Have any introduced marine organisms (including micro-organisms) been identified at or
near the dredging location?
X Yes No
If “Yes”, please provide details.
There were 37 species targeted in the surveys undertaken by SKM. The summer survey of 2008
identified the “putative” presence of two of the 37 targeted species (SKM 2009a). Both of these were
dinoflagellate cysts (uncertain if viable and taxonomy and identification process for dinoflagellate
species based only on cysts is complex and uncertain) in the sediment and it was suggested that they
were likely to have been introduced via ballast waters. The previous survey, undertaken in 2006
identified one species, the Japanese Goby, in the Inner Harbour area.
If “No”, go to question 8.0.
7.10.3 Has the potential for these organisms to be transported in the dredged material been
assessed?
X Yes No
If “Yes”, please provide details.
Based on the results presented the Marine Fauna Studies completed for this site (Wave Solutions
(2012d) Section 4) which reviewed the results of biennial surveys for Introduced Marine Organisms
(IMOs) conducted for the Bunbury Port Authority at Bunbury Port and adjoining Koombana Bay the risk
of translocating IMOs from the dredge area to the proposed dredge material placement ground is
considered very low. This is because the very shallow dredge footprint is not in the main section of the
inner harbour where dinoflagellate cysts (which are negatively buoyant) may be deposited from
discharging ballast water. The present main vector for potentially introducing IMOs (and in particular
exotic dinoflagellate cysts) is ballast water in commercial shipping even with dilution and exchange of
ballast water processes offshore under the AQIS protocol. Bunbury Port is an active commercial
shipping port and proposed disposal site is adjacent to the ship anchoring area. The likelihood of cysts
becoming an established viable population of exotic dinoflagellates is driven more by environmental
conditions in the port than the mere introduction of some cysts.
Biosecurity risk management and mitigation measures associated with equipment to be used for the
capital dredging operations proposed the Draft Dredging and Spoil Disposal Management Plan
(Attachment B – Section 10.8.2) are expected to result in risk being low for translocation of species from
outside the region via this activity.
7.10.4 Has the potential for these organisms to become established at the disposal site been
assessed?
X Yes No
16If “Yes”, please provide details.
The area proposed for dredge material placement consists largely of bare sand and is considered
depauperate as reported in the Benthic habitats near Bunbury Report (Wave 2012c. Section 5.2.5). The
area is also in an open oceanic area where water exchange is unconstrained. In this environment the
establishment of exotic dinoflagellates is considered low. Low nutrients, limited watershed influence and
constant salinity are mitigations for exotic dinoflagellate populations becoming established. Offshore
water exchange requirement is the basis for risk management of dinoflagellates in the AQIS ballast
water exchange requirements for overseas vessels based primarily on these factors. The risk
associated with IMOs becoming established in this area is therefore considered to be low, particularly
given the low incidence of IMOs present in the Bunbury Port.
8.0 Contamination Management
8.1 Provide details of any recent contamination management audit(s) undertaken to identify the potential
source(s) of contamination at or near the dredging or excavation location. Include an evaluation of the:
• types, amounts and cumulative physical impacts of contaminants generated;
• point and diffuse sources of contaminants to which material is exposed; and
• feasibility of strategies to prevent further contamination.
No contamination management audits have been undertaken in the area.
17Literature Cited – Part E
• McDonald, R. and Isbell R. (2009) In Australian soil and land survey field handbook 3rd edition.
National committee on Soil and Terrain. CSIRO Publishing Melbourne
• SKM (2006). Marine Pest Species Survey: Fifth biennial surveillance of Bunbury Harbour 2006.
Produced for the Bunbury Port Authority. 20 July 2006.
• SKM (2009a). Bunbury Port Authority Invasive Marine Species Survey 2008: Preliminary Survey
Report. Produced for the Bunbury Port Authority. 28 January 2009.
• SKM (2009b). Bunbury Port Authority Invasive Marine Species Survey 2008: Part I (Summer
Survey). Produced for the Bunbury Port Authority. 22 May 2009.
• Wave Solutions (2012c). Bunbury Port Berth 14 Expansion and Coal Storage and Loading Facility
– Benthic habitats near Bunbury, Western Australia
• Wave Solutions (2012d). Bunbury Port Berth 14 Expansion and Coal Storage and Loading
Facility – Marine Fauna Studies
18PART F - DESCRIPTION OF DISPOSAL SITE AND PROCEDURES
9.0 Dredging or loading procedures
Briefly describe the dredging procedure, or for excavation, the loading procedure. In doing so you
should provide details of the type of dredger or equipment to be used and the date, time period or
stages over which dredging or excavation will take place.
At this stage of design, the preferred method for dredging and removal of material is to conduct land
based excavation down to approximately sea level. Land based material down to this depth would be
removed for land disposal. Backhoe dredge (BHD) and cutter suction dredging (CSD) would then be
used to remove material from the marine and land footprint down to rock basement for disposal at the
proposed offshore disposal ground. The rock material would be fractured by rock fracturing (blasting)
and barge mounted excavators would be used to remove the final material.
The proposed indicative steps during the dredge operations are outlined below:
• Jumbo size backhoe dredger (BHD) loading into hopper barges;
• BHD: Loads direct into barges as for offshore disposal;
• Large Cutter Suction Dredger (CSD) loading all material other than rock direct into split hopper
barges; and
• CSD Working: Hopper barge will commence overflowing after about 20 minutes then for the
remainder of the loading time overflowing will take place through a hopper overflow system at
about 4 to 5 m below water level.
CSD will be direct-loading into hopper barges. There will be no side-casting or double handling of
dredge material for subsequent pick-up to hopper barges.
The selection of dredgers whether backhoe or CSD would depend on the availability and economics at
the time of final selection of the dredging contractor.
The method of blasting & rock fracturing of basalt would be based on final assessment of the quantity
and area of presence of basalt in the dredge footprint which could be known only on completion of the
detailed geotechnical investigation.
Dredge Schedule
Indicative volumes of material to be dredged and an estimated duration are provided in Table 5.
Table 5 Indicative dredge volumes and durations
Material Indicative Volume (m3) Indicative Duration
Dry excavation 800,000 – to land disposal
Marine sediments 1,150,000
Weakly cemented 590,000
40 weeks
Cemented material 168,000
Total to ocean disposal 1,908,000
A total of 5 weeks rock fracturing
Basalt Rock 20,000
(blasting) and BHD Grab
19It is assumed that a large CSD will direct cut material and alternately load two large self-propelled
3
hopper barges (3,700m ) for disposal at a proposed offshore placement ground. Based on a typical
speed of 10 knots, placement time of 10 minutes and a mooring time of 5 minutes, the cycle time
available to go to and from the proposed dredge material placement ground is 90 and 60 minutes
respectively, for the two hopper barges. These calculations are based on the location of the proposed
placement ground approximately 13km northwest from the Berth 14A construction site. Average
3
production for ocean disposal is conservatively assumed to be 10,000m /day including allowance for
weather.
10.0 Description of Proposed Disposal Site
10.1 Location of site
Attach a suitably scaled map of the proposed disposal site, including WGS84 co-ordinates and
showing bathymetric contours, the boundaries of the disposal site and distance from land.
The proposed disposal site is identified in Figure 7 below.
20Figure 7 - Location of the proposed Lanco material placement ground.
21Has approval previously been granted for disposal at this site?
Yes ✕ No
If “Yes”, provide sea disposal permit number(s).
10.2 Position fixing
A dredge contractor has not yet been engaged for this project. Normally grids are formed in the disposal
area where the sequential disposal would be done through the hopper barge in order to reduce the
dispersion effect. The hopper barge is equipped with echo sounding machine to determine the depth of
the dredged material dumped in each of the grid. The continuous hydrographical survey would
determine the various marine parameters. The material placement shall be done through controlled
barge opening in order to reduce the impact of dispersion and shall cover the area more uniformly.
10.3 Is the disposal site located within the boundaries of or in the vicinity of a Marine Protected
Area?
For the purpose of this application form, ‘Marine Protected Area’ refers to waters declared to be marine
parks, aquatic reserves or any other type of zoning or planning for the purpose of management, protection
and development of marine resources or areas including wildlife and their habitats and for scientific,
educational, or recreational purposes. Typically, Marine Protected Areas are declared under legislation
enacted by the Commonwealth (eg the Environment Protection and Biodiversity Conservation Act 1999;
Great Barrier Reef Marine Park Act 1975), or a State or Territory Government.
✕ Yes No
If “Yes”, provide details.
A Site Selection and Assessment for Offshore Placement of Dredge Material report was prepared for
this project (Wave Solutions 2013). Section 4.10 of this report specifically discusses the proposed
placement ground in relation to the South-west Commonwealth Marine Reserves network
The proposed dredge material placement ground location is located to the north of an area proposed as
a special purpose zone (IUCN category VI). Special purpose zones allow for a wider range of activities
to accommodate socio-economic considerations with demersal trawling the only activity proposed to be
excluded in the zone.
The nearest Western Australian Marine Reserves are the Ngari Capes Marine Park located
approximately 50 km to the south and the Shoalwater Islands Marine Park located approximately 100
km to the north of the offshore disposal location.
10.4 Describe any sensitive areas in the vicinity of the proposed disposal site. Sensitive areas
include, but are not limited to, seabed communities within which algae (e.g. macroalgae, turf and
benthic microalgae), seagrass, mangroves, corals or mixtures of these groups are prominent
components.
A survey of benthic biota in the Project area was undertaken using a combination of high resolution
satellite imagery (Figure 8) and ground-truthing of benthic habitats from ROV surveys. A supervised
classification method (Green et al, 2000) was then used to model the occurrence of benthic habitat
across the Project area. More on-ground samples were collected from the offshore dredge material
placement ground to improve confidence in training sets and subsequent interpolation at this potentially
more impacted site. The full results of this survey are reported in Technical Report 5: Benthic Habitats
near Bunbury, Western Australia of the PER (Wave Solutions 2012c). Results of the survey were used
to optimise the location of the dredge material placement ground in relation to benthic habitats occurring
in the region.
22Figure 8 – Biota occurring across the Project area.
23Key findings from the survey of benthic habitat (Wave Solutions 2012c) showed that only two of the
benthic groups examined in the study occurred in the dredge material placement ground, Posidonia
spp. and Amphibolis spp (Figure 19). The distribution of benthic habitats occurring across the Project
area and in relation to the proposed dredge material placement ground is shown in Figure 8.
Figure 9 – Biota occurring on sand substrata (the only substrata observed) at the proposed
disposal location.
Given the reported maximum depth of Posidonia sinuosa and Posidonia australis in temperate Western
Australian ecosystems is 15m while that of Posidonia angustifolia is 35m (Cambridge and Kuo, 1979),
this suggests the Posidonia spp. observed at the proposed dredge material placement ground (at
depths between 21 m and 23 m CD) is P. angustifolia.
10.5 Provide information on the physical and any other relevant characteristics of the disposal
site. Include the:
• water depth;
• sea-bed topography;
• sediment characteristics;
• biological characteristics;
• information as to whether the site is expected to be dispersive or retentive; and
• other relevant information.
Geomorphological
The location of the proposed dredge material placement ground in relation to the dredge footprint and
the existing BPA dredge material placement ground is shown in Figure 1. The site is located at
approximately - 22m CD. The site is approximately 8.5km offshore and approximately 13 km northwest
of the Bunbury Port. It is separated from the shore by the second reef complex and is on the northern
side of the submarine fan or delta. It appears to be in a depression between two submarine fans and
sediment in the area is coarse sand. Any movement of sediment is therefore likely to be confined. It also
occurs well offshore and seaward of the inshore reefs. Comparatively, the offshore site is the
recommended site. It has a higher capacity for dredge material disposal, partly due to being in deeper
water but particularly because of its location in a depression immediately north of the submarine
sediment fan (pers. comm. Dr Ian Eliot, Coastal Geomorphologist, Damara WA, 19 Aug 2011).
24Geomorphological considerations for the proposed dredge material placement ground are based on the
potential volume of dredge material to be placed at the site which is estimated to be up to almost
1,900,000m³. It is proposed that the mound would not exceed an average height of approximately 1.5 m
above the existing seafloor situated approximately between - 23m CD and -21m CD isobaths. The
proposed layout would be approximately rectangular in an east-west alignment with boundaries
approximately 2km and 1km (Figure 7).
Current and Wave Assessment
Sediment stability is primarily dependent on bottom boundary layer shear stress and sediment
properties such as particle size, composition, bulk density, and water and gas content (e.g. Jepsen et al,
1997; Roberts et al, 1998; Jepsen et al. 2000; Lick and McNeil 2001). Bottom boundary layer shear
stress at the proposed offshore dredge material placement ground was modelled following methods
described by Christoffersen and Jonsson (1985). An acoustic wave and current profiler (AWAC) was
deployed at the proposed disposal ground during July-August 2011, coinciding with the seasonally
strongest storm conditions in this region.
This data provides a conservative assessment of wave and current profiles at the proposed site. The
interpretation of depth averaged turbidity profiles are presented in Figure 10. The plots show depth-
averaged total suspended solids (TSS) plotted with significant wave height, wave direction, wind speed,
and wind direction. Data points with depth-averaged TSS >/= 20 mg/L are highlighted in red. All TSS
values shown are the average of the bottom four bins to remove the surface effects. TSS exceedance
rule of thumb can be characterized by wave heights > 3.5 m from about 270 deg (west) and wind
speeds > 12 m/s from about 270 deg (west).
Figure 10 – TSS response to waves and wind at the proposed dredge material placement site.
Rose diagrams of wind and wave direction with magnitude as depth-averaged TSS provide an
understanding of direction of wind and waves correlated with depth-averaged TSS exceedances above
20 mg/L during the period of measurement at the site (Figure 11).
25Figure 11 – Exceedance of TSS guideline (20 mg/L) in relation to wave and wind direction at proposed site during monitoring period. Rose diagrams for current directions averaged over the bottom four bins (Bottom) and the surface four bins (Surface) direction and with magnitude as depth-averaged TSS provide an understanding of direction of wind and waves correlated with depth-averaged TSS exceedances above 20 mg/L during the period of measurement at the site (Figure 11). The TSS is averaged over the same bins for the Bottom but for the Surface, it's averaged for bin depths 18-20 m above the bottom. TSS is elevated at virtually all current directions. This is likely because current velocities are not great enough to resuspend sediments at this location. Current speeds 1m above the seafloor were relatively constant (at approximately 0.05 m/s or
Sediment resuspension is more directly related to waves as there is a non-linear relationship between
waves and currents. A winter storm from the north-west occurred during the period of monitoring (27
July – 4 Aug, 2011). Wind speeds in excess of 12 m/s and wave heights in excess of 4 m occurred
during this period.

It was determined that during quiescent periods (in the absence of elevated wind and waves), the
average combined current and wave shear stress (Ƭ c+w ) at 1.1 m above bottom was 0.2 Pa, which is
typically below the critical shear stress for resuspension of sandy/silt sized particles. However, during
storm events, Ƭ c+w exceeded 1.0 Pa, which can be enough stress to resuspend some cohesive, fine-
grained materials (Figure 12).

Sediment characteristics

Sediment grab samples from ten locations were collected from the proposed dredge material placement
ground and analysed for particle size distribution. Corelogs taken throughout the dredge profile in two
previous studies from the dredge footprint and sampling conducted during July and August 2011 in
accordance with the National Assessment Guidelines for Dredging (NAGD) (Commonwealth of
Australia, 2009). The disposal location consists of fine and coarse sand. The particle size distribution of
sediment samples from these two locations are presented in Figure 13. As may be expected, the
dredge footprint, which occurs in the bed of the former Preston River estuary, consists of fine grain
sand-silt material.

Figure 13 – Particle size distribution of sediment samples collected from the offshore disposal
location and the proposal dredge footprint.

Sediment contaminant

Contaminant assessment of the dredge material and the surficial sediments at the proposed placement
site has been undertaken in accordance with the National Assessment Guidelines for Dredging
(Commonwealth of Australia 2009). Detailed results are reported in the Marine Sediment Sampling and
Analysis Plan (Attachment A). No exceedances were reported at either site.

10.6   Describe the history of the disposal site if previously used for sea disposal of dredged,
excavated and/or other waste material. If the site is retentive and has been used previously for
sea disposal, provide an estimate of the remaining capacity at the disposal site.

                                                    27
The proposed disposal site has not previously been used for sea disposal of dredged excavated
material. The disposal site used by BPA is shown in Figure 1.
11.0 Disposal Procedures
11.1 Describe the anticipated period and frequency of sea disposal operations and the quantities
of dredged and/or excavated material involved for each.
Average quantity of Quantity of excavated
Period of Proposed
Number of Runs dredged material to be material to be disposed
Sea Disposal
disposed of per Run of per Run
3
April to October Average -3 Average - 5,550m TBC
3
Maximum - 4 Maximum - 7,000m
Note: For the purpose of question 11.1, ‘number of runs’ means the total number of vessel movements from the loading point to the
disposal site.
A dredge contractor has not yet been engaged for this project. The exact period and number of runs is yet
to be determined however it will be determined in consultation with the BPA as barges would be initially
moving along the shipping channel in the inner harbour.
11.2 Describe the route from loading to the disposal site.
The route will be a straight line route from the Berth 14A footprint (located just inside the entrance to
Bunbury Port Inner Harbour) to the placement ground (Refer to Figure 7 in Section 10.1 above).
11.3 Provide details of how the material will be disposed of at sea, in doing so you must provide
information on the rate and duration of the disposal, the proposed method of disposal, the
intended heading and speed of the vessel.
The hopper barge will be used for disposal of dredged material. The barge will be equipped with echo
sounding machine to determine the depth of the dredged material dumped in each of the grid. The
material placement shall be done through controlled barge opening in order to reduce the impact of
dispersion and shall cover the area more uniformly. The vessel speed will be 9.60 Kn.
Literature Cited – Part F
• Australian Government (2009) National Assessment Guidelines for Dredging, Prepared by
Commonwealth of Australia, Canberra, ACT
• Cambridge, M.L. & Kuo, J. (1979). Two new species of seagrasses from Australia, Posidonia
sinuosa and P. angustifolia (Posidoniaceae). Aquatic Botany 6: 307-328
• Christoffersen, J. B. and Jonsson, I.G. (1985) Bed friction and dissipation in a combined current
and wave motion, Ocean Engineering 12: 387-423
• Green, E.P., Mumby, P.J., Edwards, A.J. and Clark, C. D (2000) Remote Sensing Handbook for
Tropical Coastal Management
• Jepsen, R., McNeil, J. and Lick, W (2000) Effects of gas generation on the density and erosion
of sediments from the Grand River. Journal of Great Lakes Research 26: 209-219
28• Jepsen, R., Roberts, J., and Lick, W. (1997) Effects of bulk density on sediment erosion rates,
Water, Air, and Soil Pollution 99: 21-31
• Lick, W and McNeil, J (2001) Effects of sediment bulk properties on erosion rates. Science of
the Total Environment 266: 41-48
• Roberts, J.R., Jepsen, R. and Lick, W. (1998) Effects of particle size and bulk density on the
erosion of quartz particles. Journal of Hydraulic Engineering 124: 1261-1267
• Wave Solutions (2012c). Bunbury Port Berth 14 Expansion and Coal Storage and Loading Facility
– Benthic habitats near Bunbury, Western Australia
• Wave Solutions (2013). Bunbury Port Berth 14 Expansion and Coal Storage and Loading Facility
– Site Selection and Assessment for Offshore Placement of Dredge Material
29PART G - IMPACT HYPOTHESIS
12.0 Projected Impact of Disposal
12.1 Describe the projected physical, chemical and biological impacts on the disposal site and
surrounding areas (see Section 4.3 of the NAGD).
• Predict the turbidity levels and dispersal of disposed material in the water column;
• Delineate the area of sea bed that will be substantially impacted (the zone of impact) and the
movement of disposed dredged material;
• Assess physical impacts such as smothering of biota, change in substrate, light attenuation for sea
grasses;
• Assess the severity of impacts on marine life, including possible translocation of species, increased
predation and loss of available habitat. Also consider the existence and cumulative impacts of other
disposal at the site or other nearby disposal sites;
• Assess changes in the concentration of nutrients, oxygen depletion, and any increased bio-
availability of contaminants; and
• Assess possible effects on other users of the area.
Model Simulation Results
Water Column Effects
Results of the model simulation indicate that a turbidity plume will emanate from the placement area
after each time a barge is unloaded. The direction of the plume is variable with no indication of
persistent declines in water quality in any direction during the program, suggesting water quality
adjacent to the dredge material placement ground will only be temporarily compromised at any one
time. Plume orientation is largely driven by the prevailing currents during and shortly after barge
unloading as the dredge material sinks to the sea floor. Instantaneous plume characteristics for four
different times during the simulation are shown in Figure 14. Turbidity levels outside of the dredge
material placement ground are typically 5 mg/L or less.
Frequency analysis of the model outputs were also made and contours calculated of the 5% and 25%
time exceeded concentrations. Over 75% of the time, the plume is confined to within 250 m of the
unloading point while over 95% of the time the plume is restricted to within 1.5 km of the unloading
point. Results of both the instantaneous and depth averaged concentration analysis indicate that
increased turbidity outside of the placement area are typically 5 mg/L or less above ambient.
30Figure 14 – Instantaneous depth-averaged turbidly plume characteristics for four different times
during simulation.
Frequency analysis of the model outputs were also made and contours calculated of the 5% and 25%
time exceeded concentrations. The exceedance plots are shown in Figure 15 and Figure 16.
31Figure 15 – Depth averaged concentration exceeded 25% of the time during placement of dredge
material based on a 40 week simulation. Concentrations are in excess of ambient TSS
concentrations
32Figure 16 – Depth averaged concentration exceeded 5% of the time during placement of dredge material based on a 40 week simulation. Concentrations are in excess of ambient TSS concentrations Over 75% of the time, the plume is confined to within 250 m of the unloading point (Figure 15) while over 95% of the time the plume is restricted to within 1.5 km of the unloading point (Figure 16). Results of both the instantaneous and depth averaged concentration analysis indicate that increased turbidity outside of the placement area are typically 5 mg/L or less above ambient. Long Term Movement of Dredge Material Following the completion of placement activities, the dredge material at the placement location will form a mound between 1.0 and 1.6 metres high. This material will be subject to erosion and transport from local currents and waves. This section assesses the potential of the disposed material to be transported to nearby areas. Two simulations of mound transport were undertaken, one assuming zero transport of ambient sediments and the other assuming the mound contained sediments with the same median grain size as the ambient sediments (i.e. ~ 1.5 mm). This provided a reference point against which the transport of the dredge mound could be interpreted. Simulations commenced with an initial sediment mound covering the entire proposed dredge area at a constant thickness (1.58 m). The geometry of the initial placement mound is shown in Figure 17. Results indicate that after 12 months, sediment has dispersed to form a thin layer to the north, east and south of the original disposal location (Figure 18). However, the thickness of the dispersed sediment in these areas is small and would not be detectable (
dredge material placement, 53% of the original mound volume is within the original placement ground
boundaries while 47% has dispersed, predominantly in an eastern direction (Figure 19). When
modelling was undertaken based on ambient sediment characteristics, the dispersal of sediment is
much lower, owing to the larger grain sizes and lower mobility of sediment (Figure 20). The results show
a similar eastern migration of the mound but at a lower rate with a total volume loss from the mound of
approximately 9%.

Figure 17 – Geometry of the initial placement mound assuming even distribution across the
placement area.

                                                  34
Figure 18 – Geometry of the placement mound after 12 month simulation.
Figure 19 – Geometry of the placement mound after 12 month simulation assuming ambient
sediment characteristics.
35A time series of sediment loss over a 12 month period was also undertaken (Figure 20). As expected,
the majority of sediment loss occurred during the winter months corresponding to periods of greater
wave heights in this region. This natural diminishment in the dredge mound over time suggests the
proposed site will be available for re-use in future dredging programs.
Figure 20 – Time series of sediment loss from dredge material placement ground.
Erosion rates of sediment upon placement
The stability of dredge material upon placement depends on sediment stability which is driven by particle
size and consolidation. Particle size and consolidation rates can affect the erosion rates and subsequent
stability of a dredge mound upon placement due to self-weight and compaction. To determine the effect of
erosion rate on sediment stability, a Sedflume analysis of two constructed sediment cores was
undertaken using a 25kg sample taken from the entire depth profile of the proposed Berth 14A footprint
(Sea Engineering 2012).
The Sedflume analysis provides information on sediment erosion rates, critical shear stresses, particle
sizes and bulk densities at specific down core intervals in bulk samples taken from the dredge footprint.
This study considers how the properties of the sediment particles themselves affect dispersion upon
placement.
Erosion assessment approach
During sediment coring of the dredge profile at the proposed Berth 14A dredge footprint, 20 L of
sediment was collected from a mixed sample of the entire dredge profile. This sediment was collected
as a composite from the entire dredge profile (0 to -13 m AHD) and sent to the Sea Engineering
Laboratory in Santa Cruz, California. Two sediment cores were constructed from the sediment mixture
provided and placed in an ambient water bath for preservation until analysis. Analysis began on the first
core one day after core construction while the second core was allowed to consolidate for 30 days prior
to analysis.
During analysis, each core was exposed to different water flow rates. The erosion rates and critical
shear stress of each core at different flow rates was then measured. In Sedflume analysis the critical
shear stress for erosion is defined as the shear stress required to erode a sediment sample at a rate of
10 -4 cm/s (Roberts et al. 1998). To reduce uncertainty, critical shear stresses were estimated by
combining a power law regression analysis with thresholds defined by actual erosion measurements.
The effect of consolidation effects on a reduction in mound height was quantified using a one-
dimensional, numerical bed elevation change model called SEDZLJ. Numerical simulations were run
36using shear stresses derived from both direct current measurements and hydrodynamic model outputs
to examine sediment loss from the mound of dredge material.
Results of Sedflume Analysis
The sediment from the Berth 14 dredge profile is comprised of tan and grey coloured medium sand. The
erosion rates of sediment may change significantly over time – particularly for cohesive sediments
which have been found to stiffen with depth due to self-weight and compaction. However, sands
consolidate rapidly due to self-weight and compaction, making their erosion properties largely time
independent for long term considerations. The erosion rate data collected during the Sedflume Analysis
showed only small variations in erosion rates between the 1 (SF1) and 31 (SF2) day consolidation
cores. Critical shear stresses for the Berth 14 sediment ranged from 0.1 to 0.4 Pa.
The one dimensional model SEDZLJ was then used based on Sedflume data from both SF1 and SF2.
The model uses erosion rates and critical shear stresses to compute and track changes in height of the
dredge material mound over time. Two time series of shear stress in the area of the dredge material
placement ground were used as inputs into the SEDZLJ model. A 596 hour (~25 day) shear stress time
series computer run using currents and waves data measured by an AWAC deployed at the proposed
dredge material placement ground during July and August 2011. The AWAC measures wave and
current profiles throughout the water column. The acoustic back-scatter signal was also processed to
provide total suspended solid depth profiles as a time series at the site. This was calibrated against
laboratory measured water samples taken during the logging period. During this period a significant
winter storm occurred, providing useful data for conservative modelling assessment. 12-hourly current
velocity and wave predictions were sourced from a hydrodynamic model of the proposed dredge
material placement site to further investigate trends in bed elevation beyond the time period where
AWAC data were available.
Consideration of mound erosion rates was based on the net erosion rates rather than the gross erosion
of sediment provided in the section above. Following the calculation of erosion from the AWAC collected
data, the mound of dredge material was determined to have eroded between 2.7 cm and 3.4 cm. The
greatest erosion rate occurred during a winter storm event when wind speeds of greater than 15 m/s
and wave heights greater than 4 m were recorded. During this time, calculated shear stresses were
between 0.5 and 1.0 Pa (Figure 21).
Inputs from hydrodynamic modelling allow calculation of mound erosion rates over longer time periods.
This allows the relationship between deposition and erosion to be assessed over seasonal cycles
providing a more accurate assessment of net erosion in an area. Results indicated that shear stresses
above 0.3 Pa caused the mound to erode while shear stresses below 0.3 Pa allowed suspended
sediments to deposit. Over the 40 week period of the simulation, net erosion rates determined that
changes in mound height would be less than 1 cm.
37You can also read