Construction skills gap analysis for the The Marches LEP - CITB ANALYSIS An analysis of the opportunities presented by the construction landscape ...
←
→
Page content transcription
If your browser does not render page correctly, please read the page content below
CITB ANALYSIS

Construction skills gap analysis for the
The Marches LEP

Shopping Centre Redevelopment Shrewsbury

 An analysis of the opportunities
 presented by the construction
 landscape in The Marches LEP
 October 2019

EXECUTIVE SUMMARY
The Marches LEP area can expect sustained spending on new construction projects of more than
£480million per year.
To meet this anticipated demand a total construction workforce of around 20,600 people is required in
2019 increasing to more than 21,400 in 2023. Along with significant demand from neighbouring areas
and an aging workforce resulting in retirement, there are also risks that The Marches LEP area may not
always be able to meet demand for some occupations.
Across the area, new housing accounts for 51% of anticipated spend on new projects in 2019; with
private commercial developments accounting for around 19%; infrastructure 18%; private industrial 9%.

The Marches LEP area’s opportunity
The LEP and local authorities’ opportunities are to: support growing businesses; develop a more
appropriately skilled and flexible workforce; drive higher level skills, match skills and the local economy
and encourage job creation. This will, in turn, support the delivery of infrastructure that will enable
further development and ensure that the area is prepared to exploit opportunities as they emerge and
deliver the new housing that is needed.
Construction on its own makes up a huge part of the UK economy representing more than 7% of GDP.
But crucially it is also an enabler. It will create the new housing that is so desperately needed; will
enhance the environment; will create better public spaces and facilities that we depend on; build the
facilities for new technologies and manufacturing; and create new infrastructure that enables growth
and prosperity. Construction opens up opportunities for major social and economic gains.
 The Marches LEP area will have a huge range of opportunities in construction trades and
 professions over the coming years. With well-paid and highly skilled job opportunities in a wide
 range of trades and professions, the construction industry together with businesses, local authorities,
 education and the third sector should be working together to encourage young people and career
 changers to look at construction as a career of choice with excellent prospects. A skilled workforce
 will help the area’s growth aspirations and leave a legacy for future generations; CITB is working
 with employers to inspire, attract and train this new talent for these valuable and rewarding careers.
 Sandra Stevens, Local Manager Midlands and North

High demand occupations
The top occupations for which there is greatest demand in the LEP area are:
 • Wood trades and interior fit-out • Senior, executive, and business
 • Electrical trades and installation process managers
 • Plumbing and HVAC trades • Other construction professionals and
 • Labourers technical staff
 • Painters and decorators • Non-construction professional,
 • Other construction process managers technical, IT, and other office–based
 staff (excl. managers

At risk occupations
The occupations at greatest risk of a shortfall in numbers available locally are:
 • Scaffolders
 • Construction Project Managers
 • Floorers
 • Plasterers
 • Painters and decorators
 • Specialist building operatives nec*
 • Bricklayers
 • Wood trades and interior fit-out

Priority occupations
The report identifies occupations for which there is high demand AND a high risk of a shortfall.
 • Wood trades and interior fit-out • Painters and decorators

The Marches LEP construction labour & skills research October 2019
 ii

Occupations in context – the challenge
This report sets out a challenge to The Marches LEP, local authorities, colleges universities, training
providers, construction employers and other stakeholders – namely to attract, train, recruit and
maintain a high skilled construction workforce that meets anticipated demand.
Construction offers a range of well-paid high skilled jobs for which there is demonstrable demand. The
opportunity is to exploit the opportunities to achieve social and economic gains by encouraging people
from the area into these roles, providing the associated support and career pathways.
This challenge is set against the backdrop of concerns about the future availability of skilled workers
and demand from other UK regions and major infrastructure projects.
The professions
There is high demand and risk associated with professional roles which require a significant length of
training before candidates become qualified. Architects require higher level qualifications plus
professional accreditation, so the effect of action now will only be felt in five to ten years’ time. These
are jobs in demand the world over. However, these roles do not need to be permanently on-site so it is
likely that some demand may be met by those working outside the region.
There are also opportunities to modernise construction and for The Marches LEP to start to encourage
and adopt new technologies and new practices like off-site and modular construction to help meet
demand.

Training and education
Around 20 training providers have delivered construction related training (including apprenticeships)
over the last five years. A core network of eight providers has delivered around 90% of that.
The Marches LEP area accounts for 9% of construction related training across the West Midlands.
Provision of training reduced between 2012/13 and 2016/17, with new starters decreasing by 25%. In
comparison, across the region construction training has declined by 52%, close to that of The Marches.
Over the same period, apprenticeship starts have increased by 26% in the LEP area, whereas across
the West Midlands the increase has been 22%.

Recommendations
The report proposes recommendations that include:
 Develop and strengthen relevant collaborative partnerships. With a view to building
 collaborative holistic action plans and encouraging local stakeholders to work together and
 input to, and take ownership of, the construction skills actions.
 Establish a construction skills strategy and action plan that recognises collective actions and
 solutions that may be required in and across the area.
 Develop skills and training pathways for both current and future skills needs. Ensure training is
 appropriate for local needs and businesses. Develop LEP area construction training so
 that it is appropriate for the needs of the construction industry and local circumstances,
 addressing risks of supply shortfalls.
 Outreach. Build a more positive image of construction locally with young people. Increase
 recruitment through new entrance points, career changes and reskilling. Emphasise that
 construction offers high value rewarding careers for all.
Use procurement as a lever to enable positive action. Develop smarter approaches to procurement to
encourage wider contract award inclusivity of small and medium sized employers. With those tendering
for construction and infrastructure contracts or those funding developments to be mandated to include
provision for recruitment, training, apprenticeships and outreach.

The Marches construction labour & skills research April 2019
 i

CONTENTS
1. Introduction
 1.1. The Commission ............................................................................................................... 1

2. Labour Demand In The Marches LEP ............................................................ 2
 2.1. Pipeline of Known Projects ............................................................................................... 2
 2.2. Estimate of Future Total Labour Demand ........................................................................ 4

3. Construction Labour Supply in The Marches LEP Area ................................. 8
 3.1. Main Points ....................................................................................................................... 8
 3.2. Existing Workforce ............................................................................................................ 8

4. Training Provision ........................................................................................ 14
 4.1. Main Points – Training Provision .................................................................................... 14
 4.2. Apprenticeships .............................................................................................................. 17
 4.3. Higher Education ............................................................................................................ 20
 4.4. Career Progression ......................................................................................................... 22

5. Mobility of the Workforce .............................................................................. 23
 5.1. Main Points – Mobility ..................................................................................................... 23
 5.2. Work History ................................................................................................................... 23
 5.3. Worker Origins ................................................................................................................ 24
 5.4. Travel to Site ................................................................................................................... 24
 5.5. Site Duration and Change .............................................................................................. 25
 5.6. Sub- Sector and Sector Mobility ..................................................................................... 25
 5.7. Leaving the Sector .......................................................................................................... 25
 5.8. The Impact of Brexit ........................................................................................................ 26

6. The Difference Between Demand and Supply ............................................. 27
 6.1. Main Points ..................................................................................................................... 27
 6.2. Gap Analysis ................................................................................................................... 29
 6.3. Gap Analysis – Training Needs ...................................................................................... 32

7. Conclusions and Recommendations ............................................................ 33
 7.1. Collaborative Partnerships.............................................................................................. 33
 7.2. Skills Strategy: Action Planning and Exploitation ........................................................... 35
 7.3. Develop Future Skills and Training Pathways ................................................................ 37
 7.4. Outreach: Build a More Positive Image of Construction With Young People,
 and Increase Recruitment Through New Entrance Points, Career Changers
 and Reskilling. ................................................................................................................ 38
 7.5. Use Procurement and Planning Regulation to Enable Skills Development ................... 39
 7.6. Maintaining & Enhancing the Evidence Base ................................................................. 39

The Marches construction labour & skills research April 2019
 ii
APPENDIX CONTENTS
Appendix A. Demand analysis methodology .................................................... 3

Appendix B. Occupational definitions............................................................... 7

Appendix C. Glenigan projects removed from The Marches ........................ 10

Appendix D. Significant Glenigan projects in The Marches .......................... 12

Appendix E. NICP and LEP projects in The Marches..................................... 15

The Marches construction labour & skills research April 2019
 iii
LIST OF FIGURES
Figure 1: The Marches and surrounding areas ....................................................................................... 1
Figure 2: Location of significant Glenigan projects included in the analysis ........................................... 3
Figure 3: Total construction labour demand including estimates for both R&M and
 estimates of other work ............................................................................................. 4
Figure 4: Total construction labour demand for 2019 by broad occupational group ............................... 5
Figure 5: Construction labour demand for skilled trades & operative occupations in the
 peak year .................................................................................................................. 6
Figure 6: Construction labour demand managerial, professional & office based
 occupations in the peak year .................................................................................... 7
Figure 7: Year on year change in Construction Employment (Experian/CITB & NOMIS
 2017) ......................................................................................................................... 9
Figure 8: Year on year change in Construction Businesses (UK Business Count, NOMIS
 2017) ....................................................................................................................... 10
Figure 9: Distribution of construction businesses within The Marches LEP (UK Business
 Count, NOMIS 2018) .............................................................................................. 10
Figure 10: Construction employment by area within the Marches LEP area (2018,
 NOMIS) ................................................................................................................... 11
Figure 11: Construction Businesses by Size (UK Business Count, NOMIS 2018) ............................... 12
Figure 12: Average number of weeks from planning to work on site, UK 2010-2013
 (Source: UKCG/Glenigan) ...................................................................................... 27

The Marches construction labour & skills research April 2019
 iv
LIST OF TABLES
Table 1: Local authorities analysed ......................................................................................................... 1
Table 2: New-build construction spend by project type in 2019 (total known projects)........................... 3
Table 3: Construction spend per infrastructure sub-type in 2019 (total known projects) ........................ 4
Table 4: Labour demand by project type in 2019 .................................................................................... 7
Table 6: Competence qualification achievements in The Marches LEP as a % of total
 competence qualification achievements in the West Midlands region
 as a whole (Source: CITB/ESFA) ........................................................................... 15
Table 7: Top seven training providers delivering training to The Marches LEP by number
 of starts – excluding apprenticeships (Source: CITB/ESFA) .................................. 16
Table 8: Unique Learner starts by area, construction subjects, all levels (Source:
 CITB/ESFA) ............................................................................................................ 17
Table 9: Unique apprenticeship starts by area (The Marches LEP), all construction
 subjects (Source: CITB/ESFA) ............................................................................... 17
Table 10: Unique apprenticeship starts by occupation (The Marches LEP), construction
 subjects (Source: CITB/ESFA) ............................................................................... 17
Table 11: Unique apprenticeship starts by provider in The Marches LEP (subjects
 (Source: CITB/ESFA) .............................................................................................. 19
Table 13: Region / nation employer operates in, compared with region / nation working in ................. 24
Table 12: Occupational breakdown of demand for The Marches LEP against current
 employment............................................................................................................. 29

The Marches construction labour & skills research April 2019
 v
1. INTRODUCTION
1.1. THE COMMISSION
Figure 1 shows the area covered by The Marches LEP, and Table 1 shows the local authorities involved.

Figure 1: The Marches and surrounding areas

Table 1: Local authorities analysed
 The Marches
 Herefordshire, County of
 Shropshire
 Telford and Wrekin

The Marches LEP construction labour & skills research October 2019
 1
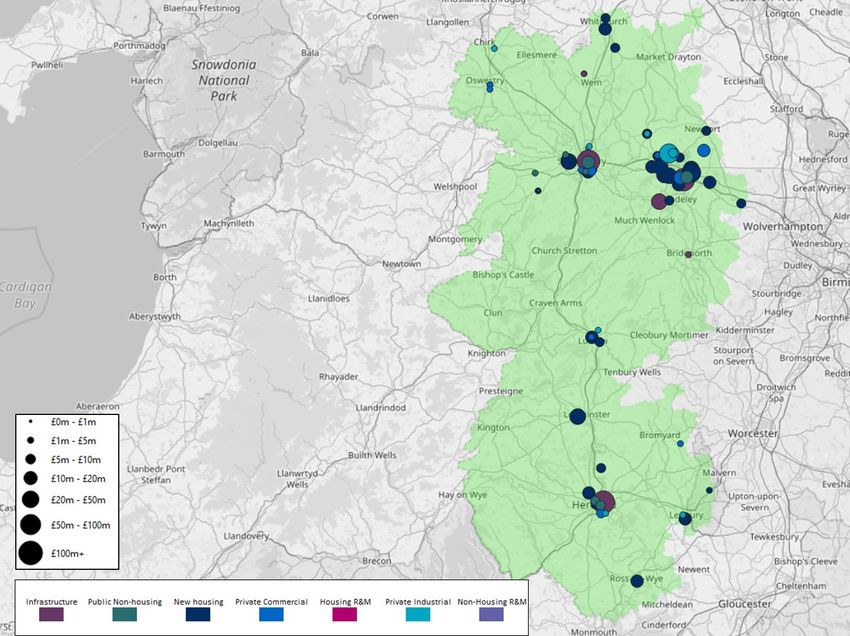
2. LABOUR DEMAND IN THE MARCHES LEP
The following sections provide an estimate of the labour demand predicted by our Labour Forecasting Tool that
construction investment will create across the LEP over the period 2019-2023. The tool and method of analysis are
described in Appendix A.
 SUMMARY OF DEMAND
 • Our estimate of the labour demand in The Marches is around 20,590 people in 2019. The projected
 growth between 2019 and 2023 suggest that the labour demand in 2023 will be around 21,370 people.
 • Around 58% of the workforce is employed in Skilled trades & operatives, the other 42% are in Managerial,
 professional & office-based staff.
 • During 2019 the most labour-intensive occupation group is “Non-construction professional, technical, IT,
 and other office–based staff (excl. managers)” with an annual demand of 2,800 people.
 • The skilled trade & operative occupations in greatest demand are:
 • Wood trades and interior fit-out with a requirement for 2,070 people;
 • Electrical trades and installation follow with 1,530 people.
 • Plumbing and heating, ventilation, and air conditioning trades rank third, with a demand of 1,290
 people

2.1. PIPELINE OF KNOWN PROJECTS
2.1.1. Glenigan pipeline analysis
We have considered projects in the Glenigan database 1 and the National Infrastructure and Construction Pipeline
(NICP)2. These comprise what are referred to as the known projects, and are forward- looking, meaning they are
either ongoing or planned to start after quarter 2 of 2019.
An initial review of the Glenigan database identified 319 projects in The Marches LEP. Of the Glenigan projects, 40
projects were removed due to missing dates. Also excluded was 1 project which was clearly identified as a
consultancy project. A full set of the projects which were omitted from the analysis is provided in Appendix C. The
spend in projects which were removed because of missing dates is around 2.7% of the total pipeline value. It is
possible that this work will take place at some point in the future but as dates are unknown it is most likely that this
will be later in the forecast period. Since dates are not known it is not possible to pinpoint when the labour will be
required. However, an assessment of the labour demand from potential additional projects is included in the
estimates of other work as outlined in Appendix A.
The Mean Value Theorem was applied to the remainder of the pipeline to identify the significant projects. The
process identified 71 significant projects accounting for 76% of the total construction spend in the area. This allowed
a detailed analysis of a large proportion of all the projects and a comprehensive consideration of the project types to
which they were assigned.
Appendix D provides a full breakdown of the Glenigan significant projects and their construction values. The peak
year for the Glenigan spend profile is 2019. The location of the significant projects within The Marches can be seen
in Figure 2Error! Reference source not found.. The values of the projects are proportional to the sizes of the
coloured dots. They are not reflective of the business size or employment numbers, but the actual spend of all
construction incurred within an individual project.

1 The Glenigan database allows contractors to identify leads and to carry out construction market analysis. It is updated every
quarter to provide details of planning applications from local authorities supplemented with additional project-specific data. For the
purposes of this analysis with have used the 2019/Q1 cut of data.
2 The Infrastructure and Projects Authority (formerly Infrastructure UK and Major Projects Authority) compile annually a pipeline of

UK infrastructure and construction projects and the associated annual public and private investment. For this report we have used
the 2018 which includes details of around 700 projects valued at some £627bn.
The Marches LEP construction labour & skills research October 2019
 2
Figure 2: Location of significant Glenigan projects included in the analysis

2.1.2. Glenigan & NICP spend analysis
Implementing the methodology outlined in Appendix A leads to the following findings for the peak year for known
projects of 2019. The peak year is used because the tail off in the known projects is more likely to be due to a lack of
future planning rather than an actual tail off in workload.
Table 2 shows the distribution by project type of new build spend for the total pipeline of known projects.

Table 2: New-build construction spend by project type in 2019 (total known projects)
 Project type Construction spend in 2019 (2018 % of total
 values - £m)

 New housing 244 51%
 Private commercial 91 19%
 Infrastructure 85 18%
 Private industrial 44 9%
 Public non-housing 16 3%
 Total 480 100%

The Marches LEP construction labour & skills research October 2019
 3
Error! Reference source not found. shows the infrastructure construction spend from the known projects in 2019 b
y infrastructure sub-type. Appendix E provides a full breakdown of the NICP and LEP projects and their construction
values.

Table 3: Construction spend per infrastructure sub-type in 2019 (total known projects)
 Project type Construction spend in 2019 (2018 % of total
 values - £m)

 Transport 46 54%
 Water 28 33%
 General infrastructure 7 8%
 Energy 3 4%
 Flooding 1 1%
 Communications - 0%
 Mining - 0%
 Total 85 100%

2.2. ESTIMATE OF FUTURE TOTAL LABOUR DEMAND
The known project pipeline may not include smaller projects or repair and maintenance work. Figure 3 shows the
outcomes of the analysis of future labour demand with the forecast regional employment growth rate applied. The
solid purple area shows the labour demand arising from the new build Glenigan and NICP projects. This is projected
forward from the peak as shown in green. The R&M (including any in Glenigan or the NICP) is also shown along with
the likely total labour demand arising from estimates of other work. The method for calculating these is provided in
Appendix A. The total construction labour demand is around 20,590 people in 2019. The projected growth between
2019 and 2023 suggest that the labour demand in 2023 will be around 21,370.

Figure 3: Total construction labour demand including estimates for both R&M and estimates of other work

The Marches LEP construction labour & skills research October 2019
 4
2.2.1. Breakdown of labour demand by occupation
Figure 4 presents the breakdown of labour for skilled trades & operatives and managerial, professional & office-
based staff. Around 58% of the workforce are in skilled trades & operative occupations.

Figure 4: Total construction labour demand for 2019 by broad occupational group

For the peak year in Glenigan of 2019, Figure 5 shows the detailed breakdown for the 20 skilled trade & operative
occupational groups for the pipeline of known projects, the estimates of other new-build work and the R&M work.
These occupations will be predominately based at or near the location of the work.

The Marches LEP construction labour & skills research October 2019
 5
Figure 5: Construction labour demand for skilled trades & operative occupations in the peak year

Figure 6 shows a breakdown of the managerial, professional & office-based occupations. Since it is possible for
many of these people to work remotely from the site, they will not necessarily generate a local demand.

The Marches LEP construction labour & skills research October 2019
 6
Figure 6: Construction labour demand managerial, professional & office-based occupations in the peak year

2.2.2. Breakdown of labour demand by project type
Table 4 shows the labour demand generated by the known projects and the estimates of other work in 2019 broken
down by project type.

Table 4: Labour demand by project type in 2019
 Project type Known pipeline Estimates of other Total labour demand % of total in 2019
 labour demand in work labour demand in 2019 (people)
 2019 (people) in 2019 (people)

 Private commercial 1,690 4,860 6,550 32%
 Non-housing R&M - 6,380 6,380 31%
 New housing 2,580 530 3,110 15%
 Housing R&M 50 2,490 2,540 12%
 Private industrial 830 70 900 4%
 Infrastructure 830 - 830 4%
 Public non-housing 280 - 280 1%
 Total 6,260 14,330 20,590 100%

The Marches LEP construction labour & skills research October 2019
 7
3. CONSTRUCTION LABOUR SUPPLY IN THE MARCHES LEP
 AREA
When looking at the supply of workers there are two main elements to consider: the size of the current workforce
and the existing training provision.
The first element is to take a view on construction employment in the Marches LEP and how this relates to
employment across the West Midlands (into which The Marches LEP falls entirely) and the UK, thus comparisons
are made between these three areas. Data from CITB’s Construction Skills Network (CSN) is used along with official
Government sources. Employment and employers are considered together as they are intrinsically linked,
particularly as a large proportion of construction workers are employed within micro businesses or are self-
employed, where the business location is also the home location.
For the second element, whilst training occurs at Further Education (FE) and Higher Education (HE) levels, the main
focus of this report is on the FE that takes place. FE tends to be sourced and delivered in a closer proximity to the
home and workplace, whereas the length of study time and specialisms for Universities for HE typically gives much
greater degrees of mobility. Nevertheless, Higher Education in the region is also analysed, but should be considered
in the context of the greater mobility levels of the learners at this level.
Finally, the demand forecasts are compared against employment, training and workforce mobility to give an
indication of possible gaps and/or occupational pinch points.

 3.1. MAIN POINTS
 • Current construction workforce within the LEP area is estimated at around 26,400 workers.
 • The majority of the workforce is located in Shropshire (45%), followed by Herefordshire (31%) and finally
 Telford and Wrekin (23%).
 • It accounts for approximately 12% of the West Midlands total current construction workforce and 7% of its
 construction firms.
 • Employment levels in The Marches LEP have steadily increased over the last seven years.
 • Over the last five years approximately 45 training providers have delivered construction related training
 within the LEP; the top seven main providers delivered over 90% of provision.

3.2. EXISTING WORKFORCE
 • The Marches LEP construction workforce has experienced a substantial increase of 32% in the last 7 years
 • 94% of The Marches LEP businesses are Micro sized (0-9 employees), identical to the West Midlands region
 as whole
An analysis of the Annual Population Survey shows that The Marches LEP area accounts for approximately 12% of
construction employment in the West Midlands region as a whole. This is the number of workers employed by
employers within The Marches LEP. Table 5 applies this percentage share across the CSN occupational breakdown
for the West Midlands region as a whole to give an estimate of total employment at occupational and industry level in
The Marches LEP area. For comparison, the West Midlands region has been included.
Over the last few years workforce growth has been steady in the LEP, following a small dip in 2012/ 13, which can
be observed in Figure 7. Overall, 2010/ 11 to 2014/ 15 were relatively stagnant, but in 2015/16 the increase was
noticeable, with an accelerated growth of 14% between 2014/15 and 2017/ 18.

The Marches LEP construction labour & skills research October 2019
 8
Year on year change in Construction Employment: 2010/11 - 2017/18
 300000 15.0%

 Growth in construction workforce
 Size of Construction Workforce

 250000 10.0%

 200000 5.0%

 150000 0.0%

 100000 -5.0%

 50000 -10.0%

 0 -15.0%
 2010/ 11 2011/ 12 2012/ 13 2013/ 14 2014/ 15 2015/ 16 2016/ 17 2017/ 18

 Size of Construction Workforce (The Marches)
 Size of Construction Workforce (West Midlands)
 Growth in construction workforce (The Marches)
 Growth in construction workforce (West Midlands)

Figure 7: Year on year change in Construction Employment (Experian/CITB & NOMIS 2017)

The number of construction businesses within the LEP has stayed consistent at 15% of all construction businesses
across the West Midlands between 2010 and 2015, decreasing marginally to 14% since. In actual numbers there
has been a rise in construction businesses within the LEP, from around 3,000 in 2011 to 3,400 in 2018, an 11%
increase in actual numbers. Looking at the South East, there was an increase of around 4,000 businesses within the
area, over the same timeframe, a rise of 19% on 2011 levels.
Figure 10 shows the distribution of construction businesses within the West Midlands and Figure 11 shows the
distribution of the construction workforce. There are clear differences between the two;
 • Comparing business to workforce distribution indicates that the shares between Shropshire, Herefordshire
 and Telford and Wrekin and relatively similar
 • Around 94% of firms within the LEP are micro sized (less than 10 employees), similar to that of the West
 Midlands as a whole.

The Marches LEP construction labour & skills research October 2019
 9
Year on year change in Construction Businesses: 2010/11 - 2017/18
 30000 8.0%

 Growth of construction businesses (%)
 Number of construction businesses

 6.0%
 25000
 4.0%
 20000
 2.0%

 15000 0.0%

 -2.0%
 10000
 -4.0%
 5000
 -6.0%

 0 -8.0%
 2010/ 11 2011/ 12 2012/ 13 2013/ 14 2014/ 15 2015/ 16 2016/ 17 2017/ 18

 Number of Businesses (The Marches) Number of Businesses (West Midlands)
 Growth in Businesses (The Marches) Growth in Businesses (West Midlands)
 Growth in Businesses (UK)

Figure 8: Year on year change in Construction Businesses (UK Business Count, NOMIS 2017)

The local authority in the LEP with the largest share of the businesses and workforce is Shropshire, accounting for
51% and 45% of the total, respectively.

 Telford and Wrekin,
 17%

 Herefordshire, 32%

 Shropshire, 51%

Figure 9: Distribution of construction businesses within The Marches LEP (UK Business Count, NOMIS
2018)

The Marches LEP construction labour & skills research October 2019
 10
Telford and Wrekin,
 23%
 Herefordshire, 31%

 Shropshire, 45%

Figure 10: Construction employment by area within the Marches LEP area (2018, NOMIS)

When assessing the patterns between workforce and number of businesses it is important to note two main factors
when looking at the construction sector:
 • Direct employment vs self-employment
 • Size of business.
The construction sector has high levels of self-employment with around 40% of the UK construction workforce being
self-employed; this is higher in The Marches at 46%. The figure is marginally higher than that for self-employment in
the West Midlands, at 42%.
When looking at business size, the distribution of companies across the LEP area is similar to the West Midlands
and the United Kingdom. The majority of companies are micro sized: 94% apiece.

The Marches LEP construction labour & skills research October 2019
 11
0.1%
 5.0% 0.6%
 0.1%
 5.5% 0.6%
 5.5% 0.1%
 0.6%

 Micro (0 to 9)
 Small (10 to 49)
 Medium-sized (50 to 249)
 Large (250+)

 The Marches
 93.9%
 West Midlands
 93.9%
 UK
 94.2%

Figure 11: Construction Businesses by Size (UK Business Count, NOMIS 2018)

Table 5: Current construction workforce - occupational breakdown, 2017 (Source Experian & CITB)

 Construction workers in The Marches area listed by occupation West
 The Marches
 [Calculated as 12% of the CSN data for the West Midlands Region] Midlands

 Senior, executive, and business process managers 2,460 20,870
 Other construction process managers 2,460 20,820
 Other construction professionals and technical staff 1,810 15,300
 Surveyors 710 6,050
 Construction Trades Supervisors 480 4,090
 Civil engineers 320 2,720
 Construction Project Managers 290 2,460
 Architects 180 1,540
 Electrical trades and installation 1,990 16,870
 Wood trades and interior fit-out 1,920 16,280
 Plumbing and HVAC Trades 1,650 13,970
 Labourers nec* 1,310 11,120
 Building envelope specialists 930 7,890
 Plant mechanics/fitters 920 7,830
 Painters and decorators 830 7,020
 Bricklayers 510 4,340
 Roofers 480 4,060
 Specialist building operatives nec* 420 3,590
 Logistics 390 3,280

The Marches LEP construction labour & skills research October 2019
 12
Glaziers 390 3,270
 Plasterers 320 2,740
 Steel erectors/structural fabrication 320 2,720
 Plant operatives 300 2,500
 Civil engineering operatives nec* 280 2,330
 Scaffolders 260 2,170
 Floorers 170 1,440
 Non-construction professional, technical, IT, and other office-
 3,910 33,160
 based staff
 Non–construction operatives 390 3,320
 Total 26,400 223,750
Note: numbers rounded to the nearest 10 (explaining difference in value between occupations and total)
Note: nec*: not elsewhere classified; HVAC: Heating, ventilation and air-conditioning.
 Key
 Manager/Professional occupations
 Skilled Trades
 Office-based Staff

The Marches LEP construction labour & skills research October 2019
 13
4. TRAINING PROVISION

 4.1. MAIN POINTS – TRAINING PROVISION
 • Over the last five years around 45 training providers have delivered construction related training within the
 LEP; the top eight main providers delivered 90% of provision.
 • Over the last five years, training volumes in the LEP have fallen, while apprenticeships starts have
 increased slightly
 • Good levels of competence qualifications achievements are found within the following occupations:
 Electrical trades and installation, Wood trades and interior fit-out, Plumbing and HVAC Trades, Plant
 operatives and Civil engineering operatives nec*
Overall, the volume of training in The Marches LEP has reduced significantly between 2012/13 and 2016/17, with
the number of new starters decreasing by 25% over this period. This fall is larger than the decline witnessed in the
West Midlands region as a whole of 19% over the same period.
CITB analysis of Education and Skills Funding Agency (ESFA) Individualised Leaner Records from 2012/13 through
to 2016/17 academic years for construction learners shows that:
 • The Marches LEP accounts for 9% of identified construction related training across the West Midlands region
 • There has been a reduction in the total number of construction learners starting in The Marches LEP (-25%).
 A reduction is also found in the South East region of approximately -20%.
 • Apprenticeship starts within The Marches LEP have increased over the period from 2012/13 to 2016/17 by
 26%. This increase is slightly higher than the West Midlands Region, which saw a 22% increase over the
 same period.
 • When looking at other Education and Training construction learner starts (i.e. non-Apprenticeship
 construction qualifications) there have been reductions both in The Marches LEP and in the West Midlands (-
 35% and -26% respectively).
 • Over the last few years, Telford and Wrekin has experienced the largest reduction in construction learner
 starts, of almost 80%; Shropshire has reduced by almost 30%, whilst Herefordshire has experienced small,
 but positive growth (of almost 5%)
“Knowledge” based qualifications describe those qualifications that typically have a theoretical basis so are more
likely to be ‘classroom based’. “Competence” based qualifications, in the main, achieve a recognised NVQ and so a
link can be made between the qualification title and the likely occupation that an individual will have. For example,
someone starting or achieving a Bricklaying qualification is highly likely to be working as a Bricklayer as
competence-based qualifications are based on an assessment of work-based skills.
Table 6 shows qualification achievements over the last five years for the identified competence-based qualifications,
comparing achievement volumes against the overall pattern for the West Midlands as a whole. From this analysis
there appear to be patterns for particular occupations. 3
The majority of the achievements referred to in Table 6 are at:
 • Level 2 (60%),
 • Level 3 (40%)
 • Level 4 and above (1%).
The percentage comparison with the West Midlands region as a whole is used to demonstrate how the provision of
training in The Marches LEP by occupation is relatively high or low against the regional context.

3The information shown in Table 6 has been produced by mapping qualification reference numbers and titles to the most
appropriate Construction Skills Network occupations. This has been built up over a number of years by CITB with over 1,800
qualifications reviewed and linked where possible. Note: there are some qualifications that have broad or generic titles that
cannot be linked to distinct occupations
The Marches LEP construction labour & skills research October 2019
 14
The main training volumes identified are very similar to the overall training patterns seen in the West Midlands –
although there is slightly less emphasis on Bricklayers in the LEP. The first group, ‘Main occupations’ contains
Electrical, Wood and Plumbing and HVAC trades, as well as Plant operatives and Civil engineering operatives nec*
(those that work in road, rail and in the quarry). The qualification achievements are consistent with or slightly higher
than the overall share of training being achieved in the LEP area or there is a larger volume of training being
delivered against them – in this case, both apply. For Plumbing and HVAC Trades, the volume of training will be
related to its share of employment, while for others such as plant operators, training will be more related to the need
to demonstrate competence for these roles through card scheme monitoring (for example the CPCS Card scheme
for Plant Operatives).

Table 6: Competence qualification achievements in The Marches LEP as a % of total competence
qualification achievements in the West Midlands region as a whole (Source: CITB/ESFA)
 Total
 Construction occupations 12-13 13-14 14-15 15-16 16-17 Total
 Achievements
 Main Occupations
 Electrical trades and installation 18% 11% 11% 13% 11% 320 13%
 Wood trades and interior fit-out 16% 13% 11% 13% 12% 300 13%
 Plumbing and HVAC Trades 9% 3% 20% 16% 14% 290 12%
 Plant operatives 5% 9% 6% 5% 0% 280 6%
 Civil engineering operatives nec* 26% 10% 3% 22% 12% 240 14%
 Occupations to monitor
 Bricklayers 9% 5% 6% 13% 4% 100 8%
 Specialist building operatives nec* 11% 9% 2% 7% 11% 80 8%
 Low Overall Learner Volumes
 Glaziers 0% 4% 2% 23% 2% 30 4%
 Scaffolders 11% 6% 6% 7% 6% 20 7%
 Building envelope specialists 0% 3% 1% 4% 21% 20 3%
 Floorers 2% 15% 5% 12% 7% 20 7%
 Construction Trades Supervisors 8% 3% 0% 3% 7% 20 6%
 Painters and decorators 5% 2% 5% 1% 0% 20 2%
 Roofers 7% 4% 20% 2% 0% 20 6%
 Construction managers 14% 39% 100% - - 20 23%
 Plant mechanics/fitters 0% 4% 4% 5% 3% 20 3%
 Other construction professionals and
 technical staff 0% 7% 0% 9% 9% 10 6%
 Plasterers 1% 8% 0% 2% 0% 10 2%

There is a second group of occupations with good provision: where there appears to be a higher level of provision
for occupations such as Bricklayers and Specialist building operatives nec*. It could be that there are providers with
particular specialisms in these areas operating with the LEP, or a particular need for this type of training.
The third group – occupations to monitor: identifies a number of occupations where we would expect higher levels of
training, again linked to either the occupational size and/or demonstrating competence. It is possible that individuals
within The Marches LEP area may be travelling outside the area for this type of training.
Lastly there is a group of occupations where the low level of learner volumes makes it difficult to judge patterns
across the years. Whilst the training provider network can adjust to cover changes in demand, there will be a
requirement for a certain volume of training to make it viable for a provider to deliver it. These occupations could
suffer from this intermittent demand or learners could be travelling further afield to more specialist training providers.
In the Marches LEP between 2012/13 and 2016/17, 21 different providers have been delivering training. The
majority of training is being delivered by the seven main providers shown in Table 7.
Of the 79 qualifications covered in table 6, 6 compromise 52% of all qualification outputs. The top performing are:
 • NVQ Diploma in Wood Occupations (Construction) (QCF) - 15%
 • NVQ Certificate in Plant Operations (Construction) (QCF) - 10%
 • NVQ Diploma in Plumbing and Heating (QCF) - 9%

The Marches LEP construction labour & skills research October 2019
 15
• NVQ Diploma in Construction Operations and Civil Engineering Services - Construction Operations
 (Construction) (QCF) - 8%
 • NVQ Diploma in Trowel Occupations (Construction) (QCF) - 5%
 • NVQ in Electrotechnical Services - 5%
While it is not possible to determine the dropout rate on courses from this data, it is possible to isolate occupational
courses on a national level. The following two occupations are considered priority by this report and the LEP
themselves, and we can see the average overall achievement rate for both are very high: 4
 • Painters and decorators 84%
 • Plasters 87%

Table 7: Top seven training providers delivering training to The Marches LEP by number of starts –
excluding apprenticeships (Source: CITB/ESFA)
 Total % share % Quals
 Provider 12-13 13-14 14-15 15-16 16-17 (Learner of Total Ofqual
 Aims) Quals Regulated
 Shrewsbury College of Arts and
 1080 630 360 390 - 2460 25% 68%
 Technology*
 Herefordshire and Ludlow College* 350 340 620 520 420 2250 23% 74%
 LTE Group 510 650 580 180 70 1990 20% 18%
 Telford College of Arts & Technology* 330 290 270 210 90 1200 12% 80%
 Shrewsbury Colleges Group* -
Table 8: Unique Learner starts by area, construction subjects, all levels (Source: CITB/ESFA)

 % Quals
 % Net
 Local Authority 2012-13 2013-14 2014-15 2015-16 2016-17 at Level
 change
 2+

 Herefordshire 500 460 490 500 550 9% 58%
 Shropshire 910 790 770 780 770 -16% 56%
 Telford and Wrekin 640 470 310 380 190 -70% 61%
 Grand Total 2000 1720 1560 1650 1500 -25% 58%

As a whole, The Marches LEP area is showing a significant decrease in the number of construction learner starts of
-25% across the five years, when the wider South East region experienced a lower, but still significant decline of -
19% over the same period.
In the LEP there has been a 23% increase in the number of apprenticeship starts between 2012/13 and 2016/17.
Whilst the college-based courses are an important stepping stone or progression route for learners to acquire
knowledge, construction employers tend to have a preference for practical or competence-based skills, so it is
positive that the LEP has witnessed this increase in apprenticeships over these four years. Apprenticeships are
investigated in more detail in the next section.

4.2. APPRENTICESHIPS
In the Marches LEP area overall volumes of training are declining, whereas numbers of apprenticeship starts within
the area are increasing.
The only Local Authority within The Marches LEP making a contribution to this increase from 2012/13 to 2016/17 – a
large one at that - is Shropshire, with an increase of approximately 70 apprenticeship starts. This is in spite of a
neutral contribution from Herefordshire and Telford and Wrekin. Encouragingly, there is no negative growth in the
area and overall apprenticeship growth is strong.
When looking at Table 10 the number of apprenticeship starts rose by 23% from 2012/13 to 2016/17, compared to a
decrease (-25%) throughout the same time frame for the total number of construction learner starts within the LEP
area. The increase in apprenticeship starts within the West Midlands region from 2012/13 to 2016/17 was almost the
same as The Marches LEP, with a 22% increase.

Table 9: Unique apprenticeship starts by area (The Marches LEP), all construction subjects (Source:
CITB/ESFA)
 Increase/ % Net
 Local Authority 2012-13 2013-14 2014-15 2015-16 2016-17
 decrease Change
 Shropshire 150 150 170 160 220 70 47%
 Herefordshire 110 90 80 90 110 0 0%
 Telford and Wrekin 50 60 50 100 50 0 0%
 Grand Total 300 290 300 360 370 70 23%

When considering apprenticeship starts by occupation between 2012/13 and 2016/17 the biggest increases in
volumes have been in Plumbing and HVAC trades, and Electrical trades). Otherwise, movement is positively small,
non-existent, or negatively small. In fact, numbers are so low that most of the LEP can be considered unmoving in its
apprenticeship starts over the last few years.

Table 10: Unique apprenticeship starts by occupation (The Marches LEP), construction subjects (Source:
CITB/ESFA)
 Increase /
 Occupation 12-13 13-14 14-15 15-16 16-17
 decrease
 Plumbing and HVAC Trades 70 60 80 90 100 30
 Electrical trades and installation 60 60 60 70 80 20
 Bricklayers 20 30 30 30 30 10
 Building envelope specialists 0 10 20 10 10 10

The Marches LEP construction labour & skills research October 2019
 17
Floorers
Table 111 considers apprenticeship starts by provider. Over 50 different providers in total have delivered
apprenticeships in construction for The Marches LEP area between 2012/13 and 2016/17. The bulk of training is
being delivered by three providers which account for almost 70% of all provision in the LEP. Shrewsbury College of
Arts and Technology delivered over 90 construction apprenticeships within the LEP in 2015/2016 and appears to be
the leading provider in apprenticeship starts.

Table 11: Unique apprenticeship starts by provider in The Marches LEP (subjects (Source: CITB/ESFA)
 2012- 2013- 2014- 2015- 2016- %
 Local Authority Total
 13 14 15 16 17 Share
 Shrewsbury College of Arts and Technology 110 120 120 90 0 440 27%
 Herefordshire and Ludlow College 100 70 70 100 100 440 27%
 Shrewsbury Colleges Group 10 40 60 80 150 340 21%
 CITB 10 20 30 40 50 150 9%
 Telford College of Arts & Technology 10 10 20 30 10 80 5%
 JTL 10
4.3. HIGHER EDUCATION
There are five broad HE qualifications that relate to construction: Architecture, Building, Landscape & garden design,
Planning, Civil Engineering, and a small number of other courses linked to architecture, building & planning. All
these courses are offered at universities accessible to The Marches LEP area. Of these construction related
courses, the three that are most relevant to delivering construction projects are Civil Engineering, Architecture, and
Building.
There are a number of significant challenges to address in understanding Higher Education’s place in UK
construction. Most significantly, those starting and completing HE level qualifications tend to be willing to travel
significant distances to study and then find employment. For many students the opportunity to leave home and move
to a new town or city is one motivation for entering Higher Education. In the UK, this has become normalised.
University students are more likely to move into a region to study and then, once graduated, out of a region to find
employment.
A 2014 study undertaken by Education Phase on behalf of TV Licensing indicated that the average distance from
home to place of HE study was around 90 miles. This also indicated that of the sample, only around 5% of HE
students were studying within 20 miles of home but that 78% moved 60 or more miles or were from overseas.
However, when questioned, different institutions respond differently – with some universities indicating that they
believe they attract students from closer to home while others have a more national and often international focus.
This is, in part, down to the course type and its availability elsewhere. But there appears to be a rough correlation
between the UCAS points required for entry to some universities and the distance students’ travel. Typically the
most demanding universities draw students from a greater average distance.

4.3.1. Local provision
Within the area, higher education is provided in:

 • Shropshire
 • Herefordshire
 • Telford and Wrekin

Specifically, there are four major higher education establishments within the area:

 • University Centre Shrewsbury
 • NMiTE – New Model in Technology and Engineering
 • Harper Adams University
 • University of Wolverhampton (which has a campus in Telford)

Data from the Higher Education Statistics Agency reveals more (external) providers to the Marches LEP:

 • Aston University
 • Birmingham City University
 • The University of Birmingham
 • Coventry University
 • The University of Warwick

Principal subjects delivered by these universities and number of their achievements in 2017/2018:

 • Civil engineering > 680
 • Building > 500
 • Architecture > 210
 • Planning (urban, rural and regional) > 90
 • Landscape and garden design < 50
The Marches LEP construction labour & skills research October 2019
 20
Also, worth noting is the New Model in Technology and Engineering (NMiTE), an initiative backed by government,
located in Hereford. Its aim is to address the shortages of Engineers across the UK.

4.3.2. Degree level apprenticeships
Some provision for higher level training for professional roles is available as degree apprenticeship programmes that
attract government subsidy and are available to potential students as debt free education.
This is an attractive opportunity that could be highlighted to applicants and employers but that also requires support
from employers to recruit at age 18 rather than 21 (graduate). This may help fill some higher-level skills gaps earlier
as the apprentice can start to make a contribution in their professional roles after one year of study.

The Marches LEP construction labour & skills research October 2019
 21
4.4. CAREER PROGRESSION
Relatively limited information is available to explain any trends in career progression. The complexity of occupations,
qualifications and the inability to track individuals make establishing a clear picture extremely difficult.
There is some anecdotal evidence to suggestions that:
 i. Some more experienced workers are able to move into supervisory roles.
 ii. Some experienced workers take on a greater variety of occupational skills (and are therefore able to say
 they have experience working in several occupations).
 iii. There is more structured career progression among the professions (backed by professional
 development/CPD routes through professional chartership, to allow individuals to work progressively
 towards Member or Fellow status. However not all professionals will be a part of a professional body).
 iv. The professions are more likely to work to an older age in their chosen field. However, this is balanced
 against professionals tending to start at an older age as a result of the need for higher level education
 and accreditation.
In December 2016 CITB commissioned a report considering “Career progression in the construction industry”. This
identified a number of trends in relation to the Progression of construction workers into teaching and training roles.
Anecdotal evidence suggests that the primary issue, especially amongst full-time teaching staff, is fear about losing
touch with one’s professional or vocational background. There is a view that that regular return to industry should be
facilitated so that technical teachers could refresh their practical knowledge, skills, and stay abreast of innovation.
Results of a 2010 study into what employers wanted from training and trainers showed that, while they prioritised
industry skills and knowledge above education skills and knowledge, a complex mixture of the two was required,
which was generally felt to be lacking.
This suggests that initiatives aiming to utilise ‘retirees’ in Vocational Education Training (VET) needs to consider how
individuals can keep their skills up-to-date.
In this sense whilst any initiative to engage retirees in training has some benefit in terms of keeping skilled people
engaged with the sector it creates another challenge if employers perceive those individuals to have ‘out-dated’
skills.

The Marches LEP construction labour & skills research October 2019
 22
5. MOBILITY OF THE WORKFORCE
Construction workforces are fluid by nature and this section of the report will look at findings from the CITB survey
into Workforce Mobility and Skills in the UK Construction Sector 2015 to give a picture of mobility within the
workforce. Data specific to the West Midlands will be analysed in order to understand how this might impact on
future training interventions and the supply of job opportunities for local people.

 5.1. MAIN POINTS – MOBILITY
 • Almost a third of all West Midlands construction workers have worked in the industry for at least 20 years
 (31%). A total of nearly two thirds have done so for 10+ years (63%).
 • Eight in ten of all construction workers in West Midlands (84%) were interviewed in the same region in
 which they were living in when they started their construction career.
 • Within West Midlands, the average (mean) distance from workers’ current residence (taking into account
 temporary residences) to their current site was 22 miles.
 • Around four fifths of all construction workers in West Midlands are confident that when they finish this job,
 they will get a job that allows them to travel from their permanent home to work on a daily basis (79%).
 • Overall, more than half of all construction workers have only worked on one project type (58%).
 • A third of construction workers say they definitely will be working in the industry in five years’ time (35%)
 and a further almost five in ten think it is very or quite likely (48%).

5.2. WORK HISTORY
Almost a third of construction workers in the West Midlands have worked in the construction industry for over 20
years (31%) and almost two thirds have worked in the industry for at least 10 years (63%). The most likely reason for
working in the region is because they grew up there/have always lived there (52%). Eight in ten (80%) construction
workers in the region have remained in the West Midlands for all or most of their career.
Further proof of the stability of the construction workforce in West Midlands is emphasised by the finding that in the
majority of cases (75%) workers reported their last site was also in the West Midlands.
In terms of the regions or nations in which workers’ current employer operates in, the majority (92%) of workers in
the West Midlands reported that their employer operated within the region they were currently working in, while 24%
operated in the East Midlands, 15% in the South West, 14% in Wales, 11% in the South East and 11% in the North
West. See Table 12.

The Marches LEP construction labour & skills research October 2019
 23
Table 12: Region / nation employer operates in, compared with region / nation working in
 Region / nation currently working in
 Region / nation employer
 operates in EM EE GL NE NW NI SC SE SW WA WM YH
 % % % % % % % % % % % %
 East Midlands 83 16 8 13 3 2 4 12 8 7 24 11
 East of England 12 67 15 11 2 1 4 19 8 7 9 6
 London 10 27 84 13 4 1 5 27 12 7 9 6
 North East 9 9 8 93 3 1 4 6 7 7 8 15
 NORTH WEST 11 9 8 14 93 1 4 6 7 11 11 10
 Northern Ireland 3 3 3 2 1 99 3 2 1 3 2 1
 Scotland 6 4 6 9 1 2 97 2 4 4 5 4
 South East 13 23 27 12 3 * 4 65 21 7 11 6
 South West 9 5 7 10 3 * 4 18 83 10 15 5
 Wales 6 5 5 8 3 * 4 3 10 96 14 4
 West Midlands 21 9 8 12 6 * 4 7 12 9 92 8
 Yorkshire & the Humber 15 10 7 19 4 1 5 6 8 8 8 88
 Republic of Ireland 1 2 3 * * 2 1 1 1 2 2 *
 Other parts of Europe * * * 1 0 0 0 0 * 0 1 0
 Outside Europe * 1 0 * 0 0 0 0 * 0 * 0
 Other / Unsure 1 3 2 3 2 * 1 3 1 * 1 3
 Unweighted bases 410 366 452 427 435 274 463 439 494 290 352 369
Source: Workforce Mobility and Skills in the UK Construction Sector 2015 Report. BMG Research on behalf of CITB.
Base: All respondents. *denotes less than 0.5%

5.3. WORKER ORIGINS
Workers were asked which region/nation they were living in just before they got their first job in construction in the
UK. Overall, eight in ten of all construction workers in West Midlands (84%) were interviewed in the same region in
which they were living in when they started their construction career.
Furthermore, construction workers in the West Midlands are likely to have stayed in the region where they studied
for their first qualification (79%).

5.4. TRAVEL TO SITE
The majority of construction workers were interviewed on a site that was located within the same region/nation as
their permanent home with 1 in 6 (18%) construction workers in West Midlands travelling into the region for work
from another region in which their current residence is based (which includes those travelling to/from work from a
neighbouring region).
Additionally, more than four fifths (82%) of construction workers in the West Midlands were interviewed on a site that
was located within the same region as their current residence.
Workers in the West Midlands were asked to indicate the furthest distance they have worked from their permanent
or current home in the last 12 months. Two fifths have worked more than 50 miles away from their permanent home
(41%), with more than a quarter that have worked between 51 and 100 miles away (28%). Workers based in West
Midlands were amongst those least likely to have travelled more than 100 miles from their permanent home to work
in the last 12 months (13%).
However, the average (mean) distance from workers’ current residence (taking into account temporary residences)
to their current site was 22 miles for West Midlands, the same as the UK average of 22 miles. This indicates that
although workers can travel some distance to work, it is likely to be intermittent.

The Marches LEP construction labour & skills research October 2019
 24
You can also read