Developing experimental estimates of regional skill demand - Stef Garasto, Jyldyz Djumalieva, Karlis Kanders, Rachel Wilcock and Cath Sleeman
←
→
Page content transcription
If your browser does not render page correctly, please read the page content below
Developing experimental estimates
of regional skill demand

Stef Garasto, Jyldyz Djumalieva, Karlis Kanders, Rachel
Wilcock and Cath Sleeman

ESCoE Discussion Paper 2021-02
March 2021

ISSN 2515-4664
Deflation of Distributional National Accounts
Stef Garasto, Jyldyz Djumalieva, Karlis Kanders, Rachel Wilcock and Cath Sleeman
ESCoE Discussion Paper No. 2021-02
March 2021

Abstract

This paper shows how novel data, in the form of online job adverts, can be used to enrich
official labour market statistics. We use millions of job adverts to provide granular estimates
of the vacancy stock broken down by location, occupation and skill category. To derive
these estimates, we build on previous work and deploy methodologies for a) converting the
flow of job adverts into a stock and b) adjusting this stock to ensure it is representative of
the underlying economy. Our results benefit from the use of duration data at the level of
individual vacancies. We also introduce a new iteration of Nesta’s skills taxonomy. This is
the first iteration to blend an expert-derived collection of skills with the skills extracted from
job adverts. These methodological advances allow us to analyse which skill sets are
sought by employers, how these vary across Travel To Work Areas in the UK and how skill
demand evolves over time. For example, we find that there is considerable geographical
variability in skill demand, with the stock varying more than five-fold across locations. At the
same time, most of the demand is concentrated among three categories: “Business, law &
finance”, “Science, manufacturing & engineering” and “Digital”. Together, these account for
more than 60% of all skills demanded. The type of intelligence presented in this report
could be used to support both local and national decision makers in responding to recent
labour market disruptions.

Keywords: big data, labour demand, online job adverts, skills, word embeddings, machine
learning

JEL classification: J23, J24, C18

Jyldyz Djumalieva, Nesta, jyldyz.djumalieva@nesta.org.uk, Stef Garasto, Nesta,
stef.garasto@nesta.org.uk and Cath Sleeman, Nesta, cath.sleeman@nesta.org.uk

Published by:
Economic Statistics Centre of Excellence
National Institute of Economic and Social Research
2 Dean Trench St
London SW1P 3HE
United Kingdom
www.escoe.ac.uk

ESCoE Discussion Papers describe research in progress by the author(s) and are published to elicit
comments and to further debate. Any views expressed are solely those of the author(s) and so
cannot be taken to represent those of the Economic Statistics Centre of Excellence (ESCoE), its
partner institutions or the Office for National Statistics (ONS).

© Stef Garasto, Jyldyz Djumalieva, Karlis Kanders, Rachel Wilcock and Cath Sleeman
Developing experimental estimates of regional skill demand
Stef Garasto1 , Jyldyz Djumalieva1 , Karlis Kanders1 , Rachel Wilcock1 , and Cath Sleeman1
1
    Nesta

March 2021

Abstract
This paper shows how novel data, in the form of online job adverts, can be used to enrich official labour market statistics.
We use millions of job adverts to provide granular estimates of the vacancy stock broken down by location, occupation and
skill category. To derive these estimates, we build on previous work and deploy methodologies for a) converting the flow of
job adverts into a stock and b) adjusting this stock to ensure it is representative of the underlying economy. Our results
benefit from the use of duration data at the level of individual vacancies. We also introduce a new iteration of Nesta’s skills
taxonomy. This is the first iteration to blend an expert-derived collection of skills with the skills extracted from job adverts.
These methodological advances allow us to analyse which skill sets are sought by employers, how these vary across Travel To
Work Areas in the UK and how skill demand evolves over time. For example, we find that there is considerable geographical
variability in skill demand, with the stock varying more than five-fold across locations. At the same time, most of the demand
is concentrated among three categories: “Business, law & finance”, “Science, manufacturing & engineering” and “Digital”.
Together, these account for more than 60% of all skills demanded. The type of intelligence presented in this report could be
used to support both local and national decision makers in responding to recent labour market disruptions.

Introduction
The aim of this paper is to illustrate how novel data can be combined with official statistics to enhance the
quality of available labour market intelligence.
The coronavirus pandemic has highlighted how a system shock can result in very distinct impacts specific
to, for example, industry [7] and location [19]. Because of this, and in line with their growing responsibilities
for skills policy and funding, local governments are seeking timely and detailed indicators on local skill
demand, supply and mismatch [5]. However, after the discontinuation of the UK Jobcentre Plus Vacancies
series, official statistics on job vacancies are mainly available by industry and company size [25], with sparser
information on vacancies disaggregated by other variables [10]. In our research, we attempt to supplement
the insights from existing official statistics using novel sources of data. In this particular paper we begin by
producing experimental estimates of regional skill demand and its composition by industry, occupation and
skill category.
The generated insights can help decision makers to improve their understanding of employers’ demand for
skills and how this varies regionally and over time. Comparing local skill demand and supply may also provide
more clarity on drivers of regional skill mismatches [5]. This intelligence, which is currently lacking [3, 5, 28],
can inform regional policies on skill provision and retraining.
The main contributions of this paper are three-fold. First, we build on previous work to deploy a robust
methodology for extracting insights on skill demand using a novel source of data : online job adverts from
Textkernel (TK). The advantage of this data source is that it contains detailed information on the duration
of individual vacancies. Second, we produce granular measures of skill demand disaggregated by location,
occupation and skill category. These indicators are currently not captured in official statistics. Finally, we

                                                               1
generate preliminary evidence on skill demand that could support local and national decision makers in
developing response plans for labour market disruptions. This evidence, and the analysis that underpins
it, could provide early-warning indicators on changes in the demand for skills or benchmarks to investigate
comparisons between areas.
The generated experimental estimates of skill demand are delivered in tables showing annual average compo-
sition of demand in 2015-2019. These are broken down by geography (and further by industry), occupation
and skill category. The estimates of skill demand will be released on Github1 , together with the code under-
lying key pieces of our methodology (such as mapping job adverts to official classifications). These resources
can benefit other public sector organisations working with online job adverts.
The remainder of the paper is organised as follows. In the Data sources section we introduce the different
datasets used in this research and the new iteration of Nesta’s skills taxonomy. In the Methods section we
describe how we convert the flow of vacancies into a stock and how we correct for biases in online job adverts.
In this section, we also illustrate the process of mapping job adverts to the standard industrial classification
and to categories in Nesta’s skills taxonomy. In the Results section, we provide an overview of skill demand
broken down by location, industry, occupation and skill category. We then discuss contributions of the
research along with its potential applications in the Discussion section and conclude with suggestions for
future work.
Data sources
For the purposes of the analysis, we used a range of data sources, which included official labour market
statistics from the ONS, a dataset of online job adverts and a new iteration of Nesta’s skills taxonomy.
ONS data sources
Vacancy Survey
We used the ONS Vacancy Survey [25] to obtain information on the number of vacancies by industry in
the United Kingdom (UK). The Vacancy Survey is a monthly survey of approximately 6,000 businesses. It
provides information about the total number of vacancies, for which employers are actively recruiting, by
industry and company size.
The information from the Vacancy Survey was used to adjust the breakdown of online job adverts to reflect
composition of vacancies by industry in the underlying UK economy.
Annual Population Survey
The Annual Population Survey [26] is a continuous household survey that provides information on social
and socio-economic variables at a local level. It has a sample size of approximately 320,000 respondents and
is the recommended source for employment statistics.
We used this survey to gather the number of economically active residents in Travel To Work Areas (TTWAs)
in Great Britain. The number of economically active residents was used to normalise the number of vacancies
that are open in a given TTWA2 . A TTWA is a self-contained geographical area within which most people
both live and work [23]. We used the TTWAs defined following the 2011 Census. Currently, there are 228
non-overlapping TTWAs covering the whole of the UK3 . We analysed skill demand at the level of TTWAs
because they are intended to approximate self-contained, and local, labour markets. One of the assumptions
1 https://github.com/nestauk/skill demand report
2 Vacancies are usually normalised by the number of employee jobs, rather than numbers of economically active residents.
These two measures are related but not the same, most notably because the same person could have multiple jobs. However,
the number of employee jobs is only available at the level of regions, rather than TTWAs. In future, we could approximate the
number of employee jobs by adding up the number of employees to the number of people with a second job [22]. We could then
align these estimates, aggregated by region, with the regional distribution of employee jobs.
3 Employment data for TTWAs in Northern Ireland was sourced from the Northern Ireland Statistics and Research Agency
and from 2011 Census [24].
2behind this choice is that job seekers would be interested in data about vacancies to which they can commute.
Such a geographical area is approximated by a TTWA.
Official UK industrial and occupational classifications
To enable the analysis of hiring activity along an industrial and occupational dimension, we mapped online
job adverts to the Standard Industrial Classification 2007 (SIC 2007) and to the Standard Occupational
Classification 2010 (SOC 2010), using the structure and group descriptions provided by these classifications.
To analyse industry breakdown, we used broad industrial categories (e.g. 1-digit SIC, K - “Financial and
Insurance Activities”). Occupational analysis was conducted up to the level of unit groups (4-digit SOC),
which describe occupations at the most granular level.
Online job adverts
In this analysis, we used a dataset of online job adverts provided by Textkernel. The adverts were collected
by TK by scraping active job postings from webpages on a daily basis. The total dataset contains over 40
million adverts4 , collected between March 2015 and October 2019.
Information extracted from online job adverts by TK
The dataset is a rich source of information on skill demand. As shown in Figure 1, for each job advert TK
captures a number of vacancy characteristics such as job title, location, posting date, offered salary and type
of contract. These characteristics are extracted by TK using a proprietary algorithm.
Figure 1: Example of job advert illustrating various elements that can be extracted programmatically from
text.
In addition, TK programmatically maps job adverts to official occupations (using SOC 2010) and to its
own industrial classification. Since the full descriptions of adverts were provided as well, we were able to
independently evaluate the quality of the occupation assignment. We have done this by manually reviewing
a random selection of job adverts. Whilst there are margins for improvement, we found the SOC codes
assigned by TK to be of sufficient quality to be used “as is”.
4 TK preprocesses collected adverts to identify and remove duplicates.
3TK also annotates each job advert with a list of required “skills”. In the context of job adverts, the
term “skills” refers to a set of keywords that are deemed relevant for a specific post. In our dataset this
field includes terms and phrases that describe knowledge, competences, personal characteristics, tools and
certifications.
Additional indicators
For the purposes of this research, we have enriched the online job adverts with additional indicators.
To enable analysis of online job adverts by geography, we assigned each job advert to a TTWA based on
its location coordinates and the geographic boundaries of 2011 TTWAs. In order to disaggregate online job
adverts by industry, we have also automatically mapped job adverts to SIC 2007 (at 1-digit level). The
process for deriving SIC codes is described in further detail in the Methods section. Finally, to later convert
the flow of online job adverts to stock, we also calculated the vacancy duration as the difference (in days)
between when the advert first appeared and when it was removed from online job portals.
Skills frameworks
European Skills, Competences, Qualifications and Occupations (ESCO)
ESCO is the European multilingual classification of Skills, Competences, Qualifications and Occupations.
It is a rich source of information on the labour markets in Europe. One of its main resources is a freely
available database that contains information on tens of thousands of standardised and occupation-specific
skills. Specifically, ESCO provides descriptions for more than 13,000 skills linked to 2,942 occupations.
New iteration of Nesta’s skills taxonomy
In 2018, Nesta published the first open and data-driven taxonomy of skills for the UK, using online job
adverts [11]. The taxonomy was funded by the ONS as part of ESCoE (the Economic Statistics Centre of
Excellence). The taxonomy represented a hierarchical grouping of skills into meaningful categories, based
on co-occurrences of skills in online job adverts.
We have now produced an improved version of the skills taxonomy, which integrates the knowledge contained
in the expert-derived ESCO framework with data-driven insights extracted from online job adverts. The
updated skills taxonomy (henceforth referred to as combined skills taxonomy, updated skills taxonomy or
skills taxonomy) was constructed using ESCO as a base and then enriching and expanding it using UK
online job adverts. This approach ensures that the taxonomy still covers those occupations (such as low-paid
agricultural roles) that are less frequently advertised in online job adverts.
To create the taxonomy, we first organised ESCO skills into hierarchical groups based on how often they
are required together within the same ESCO occupation. This process involved representing skills as a
graph, automatically clustering the skills using the Leiden community detection algorithm, and performing
consensus clustering to ensure robustness of the results. Subsequently, the resulting clusters were manually
profiled, evaluated and labelled based on the set of most relevant keywords among the constituent skills. We
then mapped individual skills mentioned in online job adverts to the clusters in the derived taxonomy. This
process is described in greater detail in Appendix 1.
The updated skills taxonomy comprises three layers. The top layer contains 15 broad clusters of skills; these
are split into 76 clusters, and then further split into 201 skill clusters (henceforth also referred to as skill
categories). The full structure of the taxonomy will be published in a separate report.
Methods
Online job adverts could be used to produce more timely and detailed indicators of skill demand. In
principle, it is possible to build data infrastructure for analysing insights from adverts in near real-time or
with a shorter lag than in existing statistical surveys. More importantly, online job adverts can enhance the
granularity of estimates enabling researchers to study composition of skill demand by dimensions that are
currently not reflected in official statistics. Due to these advantages, a growing number of organisations have
4Figure 2: Summary of the process used to estimate the stock of skill demand from online job adverts.
been using online job adverts to perform economic analysis. A non-exhaustive list includes the ONS [27],
Burning Glass in collaboration with the Department for Digital, Culture, Media and Sport [21], Indeed [1],
also in collaboration with the Centre for Cities [19], the Institute for Employment Studies [18], the Bank of
England [38, 37] and the Organisation for Economic Co-operation and Development [4].
At the same time, there are limitations to using this novel source of data. First, online job adverts may not
be representative of all vacancies. There are alternatives to advertising vacancies online, which are often
used in some occupations. Online postings tend to be biased toward high-skilled professional occupations,
and therefore estimates of vacancy levels in the economy cannot be directly inferred from online job postings.
Descriptions of roles and employer requirements also vary to a large extent in terms of completeness and
language used, which makes it difficult to standardise information on required skills. Finally, there is limited
historical data available. However, data availability is bound to improve with time. Furthermore, we can
mitigate the remaining limitations as follows. As detailed in subsequent sections, we can align the composition
of online job adverts to that in the underlying economy using data from official surveys. We can also organise
tens of thousands of skills mentioned in job adverts into meaningful categories using Nesta’s skills taxonomy.
The following sections provide further information on each step in the process of generating estimates of
stock of skill demand (Figure 2).
Conversion from flow to stock
Mapping to SIC 2007
Figure 3: Summary of the process used to map online job adverts to SIC 2007.
5Mapping online job adverts to SIC 2007 is an important procedure which enables us to correct for some of
the misalignments between the makeup of the TK dataset and the true population of vacancies. Assigning
SIC codes is also necessary for subsequent analysis of vacancies by industry.
As shown in Figure 3, we combined several strategies to programmatically assign online job adverts to SIC
codes (at 1-digit level). The first approach involved using TK’s own industrial classification. For each
category in TK classification, we manually identified the best matching SIC codes5 . For the most accurate
results, we grouped some SIC codes together based on their relationship with TK’s industrial categories (the
groupings are described in Appendix 2.
The second strategy was to match names of employers (e.g. “NHS”) in our dataset to companies registered
with Companies House6 . We performed automated matching of the 50 most common employers7 to Compa-
nies House data and then evaluated their corresponding SIC codes. To improve the accuracy of matching, we
also checked company names for the presence of keywords that relate to a specific industry (e.g. “police”).
However, for many job adverts the name of the hiring organisation was not known, as the posting had been
advertised by a recruiting company8 . Because of this, we developed a third approach that involved building
a mapping from occupations (4-digit SOC) to industries (1-digit SIC). We used semantic similarities9 and
the presence of shared known keywords in descriptions of official occupations to identify the closest matching
descriptions of industrial categories. Only the first digit (e.g. “K: Financial and insurance activities”) of the
chosen 4-digit SIC codes was retained.
Since not all occupations are necessarily concentrated in a particular industry, we operated conservatively
and only kept the strongest matches from occupations to industries10 . The wider the spread of an occupation
across industries was, the less likely we were to include that occupation in the final mapping. If none of the
three strategies worked, a job advert was classified as “uncertain” (this applied to around 35% of all adverts).
Overall, we prioritised having a higher level of confidence in the industry label over tagging a larger number
of job adverts.
The main limitation of our approach for mapping online job adverts to industries is that it introduces a po-
tential bias in the composition of skill demand by occupation and industry. This is because, by construction,
some of the industry labels are now derived from the occupation. Therefore, in this report we do not analyse
the breakdown of skill demand by industry and occupation simultaneously.
Flow to stock model
Job adverts represent a flow of vacancies appearing on a given day, rather than the total number of vacancies
that are open at any given time. The latter is what we refer to as the stock of vacancies. In our analysis,
we convert flow to stock for two reasons. First, in order to correct the composition of online job adverts
for reasons mentioned earlier, we use data from the ONS Vacancy Survey, which measures stock. Second,
in future research, we will compare indicators of skill demand and supply. Defining skill demand as a stock
of vacancies and skill supply as the number of workers available to fill the openings will then enable us to
assess the magnitude of potential skill mismatches [30, 13, 32].
As shown in Figure 4, to obtain the stock of online job adverts we first computed the net daily flow of postings
by subtracting the number of expired job postings from the number of new job postings on that day. We
5 This operation involved reviewing examples of job adverts within each category and was independently performed by two
researchers. It was found that the two resulting maps were in agreement.
6 Companies House is the UK’s registrar of companies. Companies choose their own SIC code to list on the registrar, from
a condensed list of codes. Since they can choose multiple SIC codes, we only consider the first one listed.
7 For now, we restricted this list to 50 employers because each new organisation would need to be manually validated while
adding a limited number of vacancies. However, there are ongoing efforts to grow the list of employers mapped to SIC codes.
8 Around 55% of job adverts are classified by TK as “Staffing / Employment Agencies” (40%) or “Other / Unknown” (15%).
9 This was computed using a word-by-word comparison between the SOC and the SIC descriptions. We calculated the final
similarity score as the average cosine similarity of word embeddings (using Word2vec [20]) across all possible pairs of words
(each pair being made by a word from the SOC description and a word from the SIC description).
10 To perform the evaluation we check whether derived mappings are consistent with results produced by the first and second
approaches.
6Figure 4: Summary of the steps used to transform the flow of vacancies into a stock.
then summed daily flows across all days in a month to obtain the net monthly flow. Finally, the monthly
stock was estimated by adding the net monthly flow to the stock of vacancies in the previous month11 [39].
Instead of making assumptions about the value of the stock before the period of time for which we have data
available, we discarded the first two months in the time series12 .
Duration of online job adverts
In order to transform the flow of vacancies into the stock we used information about the life cycle of each
job advert (that is, how long each vacancy remained open). In previous relevant studies, researchers used
a fixed duration for all job adverts when calculating stock [38, 34]. This decision is justified when online
job adverts are collected from a single job board or recruiter. In that case, as in a recent Bank of England
paper [38], it is reasonable to assume that job adverts are posted and removed in a consistent manner after a
standard period of time. This assumption may not hold true for datasets generated by aggregators of online
job adverts that webscrape postings from multiple websites. A common workaround is to use the median
duration of vacancies [34].
However, our analysis of duration of online job adverts shows that only 26% of postings have a duration
that is within 7 days of the overall median (32 days) and that certain jobs have consistently longer (e.g.
“nurse”) or shorter (e.g. “customer assistant”) durations. This is illustrated in Figure 5, where we show
the distribution of job advert durations (in days) together with the median, and the range of job adverts
that fall within 7 days of the median. We restrict the horizontal axis to be between 0 and 55 days for ease
of visualisation. The observations derived from our analysis raise the question as to whether applying the
median duration to all job adverts is an appropriate assumption. Being able to incorporate more detailed
information on the life cycle of job adverts is therefore an improvement offered by our dataset.
In the TK dataset, the duration of each job advert was calculated as the difference (in days) between when
the advert first appeared and when it was removed from online job portals. If the same job advert was
posted multiple times, it was assumed to have expired when the last posting of that job had expired. Since
most websites are checked on a daily basis, changes in their vacancy lists are detected with a high degree
of reliability. There might be instances when job adverts are not removed from the job portal when they
expire [2]; this might artificially increase the duration of those vacancies. In future iterations, we could
minimise the possibility of overestimating the vacancy duration by extracting relevant information directly
from the text of job adverts (e.g. “this post is no longer active”).
Approximately 23% of job adverts have durations that are longer than 55 days. For these types of adverts, it
is hard to determine exactly how many genuine vacancies they represent. For example, they may represent
ongoing hiring needs [8] or “phantom” vacancies, that is job posts that are not withdrawn after having been
filled [2, 6, 8, 31]13 . Therefore, we capped the duration at 55 days14 . This was based on the assumption
11 Thiscorresponds to taking the cumulative sum of the net monthly flow.
12 Ultimately,this did not influence the final result. This is because the whole time series changed by a constant and we
subsequently adjusted the overall stock level according to the number of vacancies estimated from the ONS Vacancy Survey, as
described in the following section.
13 However, these studies have used data from France and the United States.
14 Another option to explore in future work would be to “slice” online job posts with long durations into multiple posts, as
7Figure 5: Histogram of the duration (in days) of job adverts (up to 55 days). The histogram shows counts of
job adverts for different duration values. The solid line refers to the median duration across all job adverts;
the dashed lines indicate the range of durations within 7 days from the median.
that after a certain period of time, a vacancy is less likely to receive any applicants, as some research
suggests [8, 2]15 . For example, Albrecht et al. [2] report that job seekers may adopt this strategy as a
reaction to the existence of phantom vacancies. Finally, very few job adverts (around 1%), for which the
end date was missing, were assigned the median duration.
Adjusting the stock of skill demand by industry
For a number of reasons, such as imperfect coverage and variation in recruitment practices, the composition of
online job adverts by occupation and industry is likely to be different than that in the underlying economy [38,
4]. To correct for these discrepancies, we re-weighted the stock of vacancies from online job adverts using
the ONS Vacancy Survey16 . These two datasets were aligned along their only common dimension, which is
industry or SIC code.
Figure 6: Overview of the process used to compute per-vacancy post-sampling weights.
done by Davis and Samaniego de la Parra [8].
15 However, this pattern is subject to variation. For example, in the US labour market, on the one hand Davis et al. [9] report
a large share of vacancies posted and filled within a month. On the other hand, Faberman and Kudlyak [14] found that, on the
SnagAJob website, “just under 14 percent of applications are sent to newly-posted vacancies”.
16 We do not currently correct for seasonality in the stock of online vacancies, which is why we used the non-seasonally
adjusted time series from the ONS Vacancy Survey. Since we report yearly averages, seasonality should have less of an effect
on our results.
8The methodology for adjusting the composition of skill demand by industry is outlined in Figure 6. First,
we computed the ratio between the monthly stock of vacancies by industry according to the ONS Vacancy
Survey, and the monthly stock of vacancies by industry according to online job adverts. This provided us
with a set of “post-sampling” weights for each month and industry17 . Our aim was to obtain a weight for
each individual vacancy, as this allowed us to aggregate the weighted data along other dimensions, such as
occupation and location, which are not included in the official vacancy statistics.
To derive individual vacancy weights, we matched each vacancy to an “active month”. This was defined as
the month in which the vacancy stays open the longest. For example, if a job advert is posted on the 14th of
October 2018 and expires on the 8th of November 2018, its active month would be October 2018 (Figure 7).
Each individual vacancy then inherited the post-sampling weight corresponding to its active month and to
the industry to which it has been coded. Vacancies with an uncertain industry were assigned the median18
of the monthly weights across all industries.
Figure 7: Example illustrating the procedure used to assign an “active month” to each individual job advert.
As mentioned above, the weights assigned to each individual vacancy can then be used to compute the stock
of demand by other relevant dimensions, such as occupation or location. To do this, we aggregated the job
adverts according to the variables of interest and then summed the weights of all the vacancies in each group,
instead of simply counting them.
The limitations of our approach for adjusting the stock of online job adverts are twofold. First, we only
correct for the composition of stock by industry and not by any other variable, such as location or occupation.
The official vacancy statistics are currently not broken down by these variables. As a result, we cannot use
them to control for potential biases in regional and occupational breakdown of the stock of vacancies, and
instead we use the composition by these variables as observed in the online job adverts19 . However, since
the post-sampling weights are applied at the level of individual vacancies, disaggregation along these other
dimensions should still produce estimates that reflect the underlying economy more accurately than the
non-adjusted stock of online job adverts.
Another limitation is that we assign a weight to each vacancy based on its active month rather than taking
an average of the weights across all months spanned by that vacancy. Whilst this aspect could be improved
in future work, our analysis shows that the distribution of durations is similar across industries. This means
that this decision is likely to affect all industries equally, and is therefore unlikely to have introduced strong
biases into the analysis.
Mapping job adverts onto the skills taxonomy
In this section, we describe how we linked individual job adverts to skill clusters using the combined skills
taxonomy. The linking was a necessary step for building the crosswalk from occupations to skill categories,
which enabled us to disaggregate skill demand by skill category. Figure 8 shows the overall process.
17 These weights were further adjusted to account for the existence of job adverts with an “uncertain” industry. Specifically,
we computed a multiplicative monthly factor with the purpose of bringing the total stock of vacancies per month (including
the “uncertain” job adverts) as close as possible to the total stock of ONS vacancies per month.
18 The median was chosen to reduce the influence of outliers from the Mining and Quarrying sector.
19 In the future we plan to explore the use of other data sources that can help addressing this limitation.
9Figure 8: Overview of the process used to link individual job adverts to skill clusters.
Mapping job adverts to skill categories
First, we mapped each skill mentioned in a job advert to its respective skill cluster in Nesta’s updated
skills taxonomy, which gave us a list of candidate skill clusters. We then computed the average semantic
similarity20 between each candidate cluster and all the skills referenced in the job advert. This produced a
“score vector” with as many entries as candidate skill clusters. We multiplied each entry in this score vector
by a “discount factor”, which was inversely proportional to how often a skill cluster appeared in the whole
job advert dataset21 . This was in order to prevent job adverts being disproportionately assigned to the
most popular skill clusters. We then considered the cluster with the highest score as the first representative
cluster.
However, we also checked whether a large proportion of skills mentioned in an advert belonged to the same
higher level skill cluster. We refer to this indicator as a shared “context” and use it to identify the second
representative cluster. This procedure also allowed us to take into account that a job advert might belong
to more than one skill category22 . In future work, we aim to improve our approach by expanding on the
concept of multiple representative clusters. The idea would be to compute relevance weights for all candidate
skill clusters, rather than limiting the choice to two clusters.
Building a crosswalk from occupations to skill categories
Finally, we produced a crosswalk from occupations to skill categories. To generate the crosswalk, we began
by counting how often online job adverts were simultaneously assigned to a given occupation and to a given
skill category. We did this for both representative clusters and then took the average of observed counts.
These were then normalised to obtain a probability distribution from occupations to skill category, which
was later used to convert the stock of vacancies by occupation into a stock of vacancies by skill category. To
account for changes over time, we computed a different crosswalk for each year.
The crosswalk shows the skill categories that are often required by employers in each occupation. For
example, the 2019 crosswalk for “Programmers and software development professionals” (SOC code 2136)
shows that the most important skill cluster at the most granular level in the taxonomy is “Programming”,
associated with 64.2% of job adverts assigned to this occupation). This is followed by “Data science &
data engineering” (10.3%) and “Web development” (4.8%). Among the ten most important skill clusters for
this occupation we also see “Engineering”, “Marketing” and “Financial management & investing”, perhaps
showcasing the domain knowledge that is often required by workers in this occupation.
20 The average semantic similarity was computed as the average cosine similarity between the sentence embeddings [29] of
the skills referenced in the job advert and representative sentence embeddings for the skill clusters. Specifically, the average
was taken across the skills referenced in the job adverts. The representative embedding for each cluster was computed as the
average sentence embedding across the skills comprising the cluster.
21 For each skill cluster the discount factor is given by the negative logarithm of the proportion of time that skill cluster is
mentioned in the job adverts, normalised to be between 0.8 and 1.2.
22 It is possible for the two skill clusters to be the same.
10Results
In the first part of the results section, we demonstrate the importance and impact of adjusting the composition
of the stock of online job adverts by industry for improving the representativeness of the dataset. In the
second part we provide new granular estimates of skill demand. These estimates are broken down by industry,
location, occupation and skill category. Aside from the breakdown by industry, none of the other variables
are currently available from official statistics on vacancies at the same level of granularity.
Representativeness of job adverts by industry
Table 1: The table illustrates the representativeness of job adverts by industry and the share of vacancies
for each industry (averaged across 5 years, 2015 to 2019).
Industry* Ratio (pre-/post- adjustment) Vacancies share (%)
Information and communication 1.99 5.36
Construction 1.48 3.16
Manufacturing 1.46 6.72
Transportation and storage 1.26 4.35
Human health and social work activities 1.19 15.72
Financial and insurance activities 1.03 4.28
Educational and professional activities 0.98 15.18
Arts, entertainment and recreation 0.87 2.35
Personal and public services 0.81 6.19
Utilities (energy, water and waste) 0.72 0.92
Wholesale and retail trade; repair of motor vehicles
0.68 17.01
and motorcycles
Accommodation and food service activities 0.66 11.12
Administrative and support service activities 0.60 6.632
*We have not included industries that are not monitored by the ONS Vacancy Survey (”Agriculture, forestry and fishing”
and ”Activities of households as employers”) because they have not been re-weighted based on survey data. Instead, the
post-stratification weights for these industries were computed by averaging the monthly weights across all other industries.
Due to this, shares do not sum to 100 exactly.
This section illustrates the degree to which online job advertisements are representative of all job adverts.
Specifically, Table 1 shows the industry-by-industry ratio between the distribution of the stock of vacancies
before and after we re-weight the online vacancies to ensure alignment with the ONS Vacancy Survey. We
use this ratio to measure the extent to which a given industry is over or under-represented in online job
adverts. If the ratio is more than 1, it means that the industry is likely to be over-represented in the online
job adverts dataset. The opposite is true if the ratio is less than 1.
Table 1 shows that the three most likely over-represented industries are “Information and Communication”,
“Construction” and “Manufacturing”. These observations might increase our confidence in the estimates for
occupations and skill categories that are particularly concentrated in these industries. The three most likely
under-represented industries are “Administrative and support service activities”, “Accommodation and food
service activities”, “Wholesale and retail trade; repair of motor vehicles”. When we compare these findings
with previous work [37], we find that “Accommodation and food service activities” is consistently found to
be under-represented in online job adverts. Given that the ONS Vacancy Survey includes vacancies that are
not advertised online, these results might reflect differences in the propensity of different industries towards
advertising vacancies online. The industries that are under-represented might be less likely to advertise
online, potentially due to the costs associated with online advertisements or the prevalence of informal
recruitment practices.
Insights on industries not currently included in the Vacancy survey
One advantage of online adverts is that we can use them to estimate the stock of vacancies for “Agriculture,
forestry and fishing” and “Activities of households as employers”, which are currently not included within the
ONS’s vacancy data. Figure 9 shows the estimates of the monthly stock of vacancies for these two industries
11(non-seasonally adjusted). While the former industry seems to exhibit a drop in demand towards the end of
2018, the average level of demand for jobs in “Agriculture, forestry and fishing” is steadily increasing.
Figure 9: The monthly stock of demand (non-seasonally adjusted) for “Agriculture, forestry and fishing”
and “Activities of households as employers”.
A similar finding is reported in a paper by the Organisation for Economic Co-operation and Development
on the representativeness of Burning Glass data. Cammeraat and Squicciarini [4] show that the number of
online job postings for “Skilled agricultural, forestry and fishery workers” increased between 2012 and 2018.
While the exact numbers are not directly comparable (authors use the flow rather than the stock of vacancies
and study occupational composition rather than industrial), these two observations seem to support each
other. Given that employment in “Agriculture, forestry and fishing” has remained stable between 2015 and
2019 [26], an increase in the stock of vacancies over the same time period might indicate a growing unmet
demand for agricultural jobs (if the vacancies represent new jobs being created) or an increase in turnover
rate.
Stock of skill demand by occupation
In this section we describe the breakdown of the stock of vacancies by occupation.
As shown in Table 2, the stock of vacancies appears to be dominated by “Professional occupations”, “As-
sociate professional and technical occupations” and “Managers, directors and senior officials”. Together,
these groups account for more than 60% of all openings. A detailed comparison of the stock of skill demand
and supply is beyond the scope of this paper, and will be addressed in future research. At the same time,
contrasting the share of vacancies with the share of employment can help us to detect occupations where
demand and supply might be misaligned.
From the table we can see that the first three major occupational groups account for a higher share of
vacancies than of employment, whilst the opposite is true for the remaining occupational groups. This
finding is consistent with the results by Cammeraat and Squicciarini [4] using Burning Glass data23 . There
are several possible explanations for these findings. First, results may indicate that some occupations are
still under- or over-represented in our estimates of the stock of skill demand24 . This might be because we
cannot directly adjust the stock of vacancies by occupation and instead rely on the observed occupational
composition in the TK dataset. Differences between shares of vacancies and employment might also reflect
23 A direct comparison is not possible because Cammeraat and Squicciarini [4] use a different occupational classification system
(ISCO-08 instead of SOC 2010). Furthermore, they compute the flow rather than the stock of vacancies.
24 This is what Cammeraat and Squicciarini [4] seem to suggest in their paper, together with a method to re-weight the job
adverts based on the corresponding share of employment.
12variation in turnover rates between occupations. If so, occupations with vacancies that are over-represented
with respect to employment might generally have higher turnover rates.
Table 2: Share of vacancies and employment for major occupational groups (SOC 2010)*.
Major group Occupation Vacancies share (%) Employment share (%)
1 Managers, directors and senior officials 13.74 10.79
2 Professional occupations 30.65 20.51
Associate professional and technical occupa-
3 19.26 14.37
tions
4 Administrative and secretarial occupations 8.56 10.26
5 Skilled trades occupations 6.28 10.40
6 Caring, leisure and other service occupations 5.95 9.15
7 Sales and customer service occupations 7.23 7.56
8 Process, plant and machine operatives 3.25 6.38
9 Elementary occupations 5.08 10.58
*The indicators were averaged across all years between 2015 and 2019, together with their respective share of employment [26].
Equivalent breakdowns for sub-major, minor and unit groups are presented in Appendix 3.
Finally, the lack of alignment between the share of vacancies and employment might indicate unmet demand.
For example, “Professional occupations” have the largest difference, in absolute value, between their share
of vacancies and employment, which might support the suggestion by Gambin et al. [15] that a number
of occupations within this major group experience skill shortages. Together with evidence on growth in
employment between 2015 and 2019, these findings might reflect the gradual switching of workers into
professional occupations that have been growing in demand [33].
Changes in composition of skill demand by occupation over time
Table 3: Annual share of vacancies for major occupational groups (SOC 2010) and relative change between
2015 and 2019.
Major 2015 2016 2017 2018 2019 Relative change
Occupation
group (%) (%) (%) (%) (%) 2015 to 2019 (%)
Managers, directors and senior
1 14.63 14.85 13.58 13.13 12.51 -14.49
officials
2 Professional occupations 30.94 31.22 30.3 30.11 30.66 -0.88
Associate professional and tech-
3 19.59 19.8 19.54 19.07 18.28 -6.67
nical occupations
Administrative and secretarial
4 8.64 8.4 8.46 8.97 8.34 -3.44
occupations
5 Skilled trades occupations 6.15 6.13 6.42 6.02 6.67 8.48
Caring, leisure and other service
6 4.21 5.6 6.19 6.55 7.21 71.26
occupations
Sales and customer service occu-
7 8.54 7.22 6.89 6.89 6.63 -22.36
pations
Process, plant and machine oper-
8 3.08 2.83 3.18 3.61 3.56 15.6
atives
9 Elementary occupations 4.23 3.96 5.45 5.66 6.13 45
Next, we investigate how the composition of vacancies by occupation changes over time. The results show
that major occupational groups that are typically associated with lower skill levels (e.g. major groups 6, 8
and 9) seem to have increased their share of vacancies (Table 3). The only exception is “Sales and customer
service occupations”. This could reflect underlying factors such as an increase in turnover within these
occupations.
Using online job adverts, we are able to produce estimates of skill demand by occupation at the highest
level of granularity. As a result of this, it is possible to study changes in the share of demand for a given
occupational group in greater detail. For example, we can compute the share of demand across all minor
13occupational groups (3-digit SOC) residing within the same major group (1-digit SOC)25 .
Figure 10: Share of the stock of vacancies for minor occupational groups within “Caring, leisure and other
service occupations”.
In Figure 10 we use the occupational group “Caring, leisure and other service occupations” as an example.
Within this major group, most minor groups exhibit an increase in their share of demand at comparable
rates. That is, the share of demand for 5 out of 7 minor groups26 has a relative increase between 60% and
100%, including occupations that provide social care (e.g. “Caring personal services”). This echoes findings
from previous Nesta research [12], which found an increase in the relative importance in the labour market
for skills related to providing social care. Overall, the comparable growth rates (in the share of demand)
for most minor groups would suggest that whilst the proportion of vacancies within this major occupational
group as a whole is growing, the relative importance of its constituent occupations remains broadly stable.
Stock of skill demand by location
In this section, we analyse regional variation in the stock of vacancies across the UK. The geographical unit
we use for the analysis is Travel To Work Areas (TTWAs), which have been designed to capture local labour
markets - the majority of the population in a TTWA works and lives within its boundaries [23].
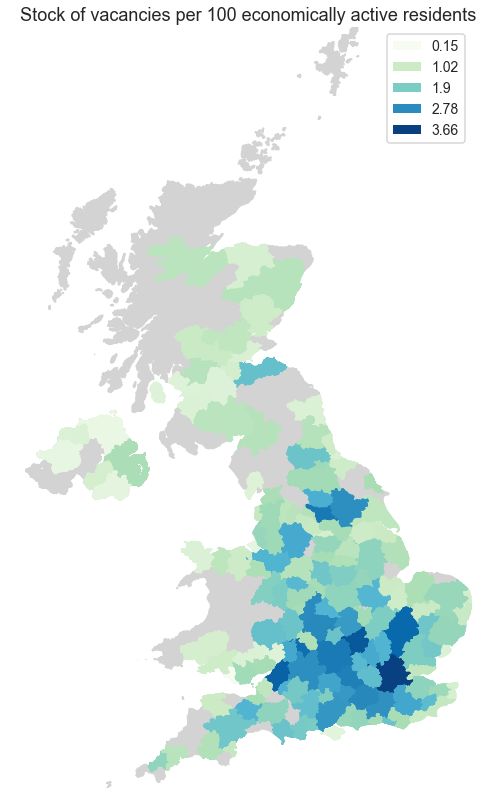
Figure 11 shows novel experimental estimates of the stock of vacancies by TTWA normalised by 100 eco-
nomically active residents [26], averaged across all years from 2015 to 201927 .
There is considerable variability in the relative levels of skill demand, with stock varying more than five-
fold across locations. Excluding small TTWAs, the five TTWAs with the highest ratio of vacancies per
economically active resident are London, Milton Keynes, Bristol, Cambridge and Cheltenham. Overall,
these areas seem to concentrate around London and in the South East.
The five TTWAs with the lowest ratio of vacancies per economically active resident are Bridgend, Ballymena,
Coleraine, Omagh and Strabane, and Birkenhead. It is possible that areas with a higher level of normalised
skill demand is due to them having a greater concentration of industries or occupations with an increased
level of hiring activity. The differences might be also related to population size [1] or levels of economic
activity.
Regional variations in skill demand by industry
In this section we analyse whether there are strong geographical differences in the demand for jobs within
industries. The analysis offers another example of the types of insights that we can obtain from online job
adverts, which, unlike other data sources, contain highly granular information on vacancy location.
25 Only minor groups with a share of demand of at least 0.1% are included.
26 The two exceptions are Animal care and control services (-43%) and Housekeeping and related services (+10%).
27 Only TTWAs with at least 40,000 economically active residents aged 16 and over are shown (the grey areas are the excluded
TTWAs).
14Figure 11: Stock of vacancies by TTWA normalised by 100 economically active residents.
To study variation in demand by geography and by industry, we compare location quotients across TTWAs28
for skill demand in each industry. Location quotients measure the extent to which the demand for skills
in a given industry and region differs from the same indicator for a larger region, where that larger region
is the UK. To obtain location quotients we first computed the composition of demand by industry in each
TTWA, and then normalised these results by the corresponding indicators for the whole of the UK. A
location quotient higher than 1 indicates that industry’s demand for skills is higher in a given area than its
UK average. The opposite is true for location quotients lower than 1.
To measure the extent to which the skill demand in each industry varies across TTWAs, we calculated Gini
indices of location quotients. The Gini index measures the inequality of a distribution and varies between
0 and 1 [16]. A higher index implies a higher degree of inequality. In our analysis, if the Gini index is
particularly high for a given industry, this means that demand for vacancies in that industry varies greatly
across the UK.
28 Only TTWAs with more than 40,000 economically active residents (on average between 2015 and 2019) are included.
15Table 4: Gini indices of TTWA-based location quotients by industry.
Industry* Gini index
Agriculture, forestry and fishing 0.34
Utilities (energy, water and waste) 0.27
Financial and insurance activities 0.27
Transportation and storage 0.24
Information and communication 0.22
Activities of households as employers 0.19
Personal and public services 0.19
Educational and professional activities 0.17
Arts, entertainment and recreation 0.15
Accommodation and food service activities 0.14
Manufacturing 0.14
Human health and social work activities 0.12
Construction 0.09
Administrative and support service activities 0.08
Wholesale and retail trade; repair of motor vehicles and motorcycles 0.07
*Results for Mining and Quarrying are omitted as fewer than 100 online job adverts
were assigned to this industry.
Table 4 shows that across all industries in the UK economy, Gini index values vary between 0.07 and 0.34.
The five-fold difference in indices implies that demand for some industries (i.e. low Gini index) is substantially
more uniform across regions than others (i.e. high Gini index).
To better illustrate the intuition behind Gini indices, Figure 12 contrasts the spread of vacancies across
TTWAs for two industries. From the figure we can see that location quotients for “Information and com-
munication” span a larger range (visualised as the space between the two red-dotted lines) than those for
“Administrative and support service activities”. This means that the former industry is more concentrated
in certain areas than the latter.
Industries with the most and least uniform demand for skills across TTWAs
The three industries that have the lowest regional variation in skill demand are: “Wholesale and retail trade;
repair of motor vehicles and motorcycle”, “Administrative and support service activities” and “Construc-
tion”. These industries are generally considered to be part of the “everyday economy”, and are likely to have
more uniform demand across areas, which is reflected in lower Gini indices. In contrast, the three indus-
tries where vacancies are concentrated in particular regions are “Agriculture, forestry and fishing”, “Utilities
(energy, water and waste)” and “Financial and insurance activities”. It is possible that these industries are
less evenly distributed because companies within them are more constrained to specific locations, or because
they might benefit the most from clustering around other similar companies.
Hotspots for industry skill demand
Ballymena, Spalding and Craigavon are among the areas with an above average demand for jobs in “Agricul-
ture, forestry and fishing”. Likewise, the TTWAs with the highest concentration of vacancies from “Financial
and insurance activities” include Edinburgh, Hereford and Bournemouth. Edinburgh is a major financial
centre in the UK [36] - for example, the Royal Bank of Scotland’s headquarters are located there. London
also appears among the top ten TTWAs with a high level of vacancies in the financial industry. Its relatively
lower ranking might be explained by the fact that in London the financial industry is competing with other
industries, like “Information and communication”, that also have a particularly high concentration.
Insights into the industrial composition of skill demand within a given area
Location quotients can also be used to assess the importance of industries to a local economy. For example,
Table 5 shows the location quotients for all industries in two particular TTWAs, London and Cambridge.
The table suggests that London has a higher concentration of vacancies in “Information and communication”,
16Figure 12: Distribution of location quotients for “Information and communication” and “Administrative
and support service activities”. For clarity of visualisation we only show TTWAs with at least 250,000
economically active residents.
“Financial and insurance activities” and “Arts, entertainment and recreation” than the rest of the UK, while
the opposite is true for industries like “Transportation and storage”, “Utilities (energy, water and waste)”
and “Agriculture, forestry and fishing”.
The three industries that are more concentrated in Cambridge than in the rest of the UK are “Information
and communication”, “Manufacturing” and “Educational and professional activities”. These findings are
consistent with a recent Tech Nation report showing that both London and Cambridge are in the top 20
European cities for tech investment [35]. Cambridge is also the home to a leading university and a hub for
advanced manufacturing.
Thus far, we have only considered the stock of demand averaged between 2015 and 2019. In the future, we
can also analyse how it varies over time and investigate whether some industries have become more or less
concentrated on an annual or quarterly basis. Doing so could help us to detect changes in demand in a more
timely manner.
Stock of skill demand by skill category
This section provides insights on the types of skills that employers have asked for most frequently in online
job adverts. Figure 13 shows the composition of skill demand in the UK by top level skill categories, between
2015 and 2019. Most of the demand is concentrated among the following three categories: “Business, law
& finance”, “Science, manufacturing & engineering” and “Digital”. Together, they account for more than
60% of the share of skill demand. The composition of skill demand also seems to remain stable across time,
17You can also read