UNITED KINGDOM SELECTED ISSUES - IMF
←
→
Page content transcription
If your browser does not render page correctly, please read the page content below
IMF Country Report No. 18/43

                UNITED KINGDOM
                SELECTED ISSUES
February 2018
                This Selected Issues paper on the United Kingdom was prepared by a staff team of the
                International Monetary Fund as background documentation for the periodic consultation
                with the member country. It is based on the information available at the time it was
                completed on January 26, 2018.

                                 Copies of this report are available to the public from

                                  International Monetary Fund • Publication Services
                                        PO Box 92780 • Washington, D.C. 20090
                                   Telephone: (202) 623-7430 • Fax: (202) 623-7201
                                E-mail: publications@imf.org Web: http://www.imf.org
                                             Price: $18.00 per printed copy

                                        International Monetary Fund
                                              Washington, D.C.

                © 2018 International Monetary Fund
UNITED KINGDOM
                   SELECTED ISSUES
January 26, 2018

                    Approved By                  Prepared by Nicolas Arregui, Jiaqian Chen, Lucyna Gornicka
                    The European                 (all EUR), and Weicheng Lian (RES).
                    Department

                      CONTENTS

                   DRIVERS OF UK WAGE GROWTH _______________________________________________________ 3
                   A. Introduction ___________________________________________________________________________ 3
                   B. Determinants of Wage Growth _________________________________________________________ 4
                   C. Assessing Labor Market Slack __________________________________________________________ 5
                   D. Empirical Strategy and Data ___________________________________________________________ 8
                   E. Empirical Findings _____________________________________________________________________ 10
                   F. Wage Outlook_________________________________________________________________________ 13
                   G. Conclusions ___________________________________________________________________________ 13
                   References _______________________________________________________________________________ 15

                   BOX
                   1. Could High Self-Employment Share Affect Wage Growth? _____________________________ 6

                   TABLES
                   1. Summary Statistics for Selected Indicators _____________________________________________ 9
                   2. Unit Root Tests _________________________________________________________________________ 9
                   3. LR Cointegration Relationship: Real Wage ____________________________________________ 10
                   4. Private Sector Average Weekly Regular Pay Growth___________________________________ 11

                   REGIONAL DISPARITIES IN LABOR PRODUCTIVITY IN THE UNITED KINGDOM ____16
                   A. Introduction __________________________________________________________________________ 16
                   B. Understanding Regional Disparities ___________________________________________________ 19
                   C. Industrial Strategy ____________________________________________________________________ 38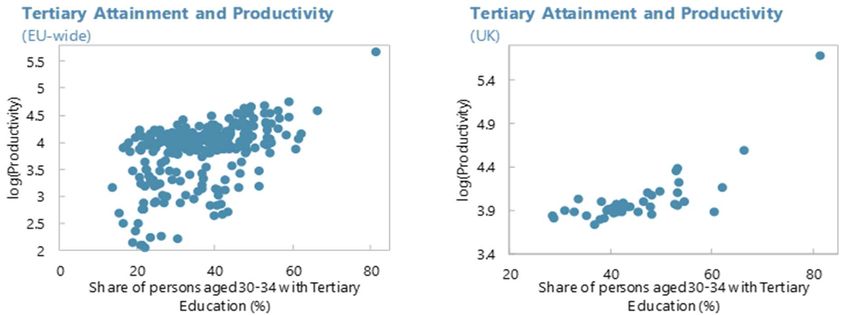
UNITED KINGDOM

D. Conclusion _________________________________________________________________________________ 39
References ____________________________________________________________________________________ 40

BOXES
1. Internal Migration Flows Determinants _____________________________________________________ 25
2. Productivity Growth and the Role of the Regional Frontier _________________________________ 29
3. The Evolving Governance Framework for Regional Development in England _______________ 36

FIGURES
1. National Labor Productivity ________________________________________________________________ 16
2. Regional Labor Productivity ________________________________________________________________ 17
3. Regional Labor Productivity and Human Capital ___________________________________________ 22
4. Regional Capital Formation and Access to Finance _________________________________________ 27
5. Expenditure on R&D _______________________________________________________________________ 28
6. Foreign Presence and Productivity _________________________________________________________ 31
7. Regional Government Expenditures ________________________________________________________ 33
8. The Role of the Government _______________________________________________________________ 35

TABLES
1. Housing Regulations and Income Convergence ____________________________________________ 26
2. Agglomeration Effects______________________________________________________________________ 32

ANNEX
I. Does Sectoral Composition Explain Regional Disparities? ___________________________________ 44

2    INTERNATIONAL MONETARY FUND
UNITED KINGDOM

DRIVERS OF UK WAGE GROWTH1
Since the financial crisis, nominal wage growth has been much weaker than during the previous
decade. This chapter finds that the main factors behind the slowdown include weak productivity
growth, labor market slack (both in the UK and the EU), and low inflation. We consider broader
measures of labor market slack including a newly constructed measure of underemployment, aiming
to capture labor market pressures more accurately than the headline unemployment rate. This
measure signals limited labor market slack in 2017, which should support wage growth going forward.
However, a sustained recovery in wages would require a recovery in productivity growth.

A. Introduction

1.        Nominal wage growth in the UK has remained subdued in recent years despite a
significant tightening of labor market conditions. After several years of robust employment
growth, the headline unemployment rate
has fallen from about 8 percent in 2010 to     Unemployment and Wage Growth
                                               (Percent)
4.3 percent in 2017Q3—the lowest level       9
                                                         Unemployment (percent of LF)
                                                         Wage (regular private sector pay, yoy percent change, rhs)          6
since 1975. The share of long term
                                             8
unemployment has also declined. At the                                                                                       5

same time, labor force participation has                                                                                     4
                                             7
increased and is now equal to its pre-crisis
                                                                                                                             3
peak.2 Moreover, average weekly hours of     6
work have recovered to the average level                                                                                     2

in 2003–2007. Howeover, nominal wage         5
                                                                                                                             1
growth has recovered only modestly and
is still well below its pre-crisis average.  4                                                                               0
                                               2001 2002 2004 2005 2007 2008 2010 2011 2013 2014 2016                 2017
This has renewed the debate on the
                                               Sources: Haver.
strength of the link between labor market
conditions and wages (see Haldane, 2017).

2.      This chapter aims to explain UK’s wage dynamics in recent years. A new measure of
underemployment for the UK is used in the analysis to capture the impact of self-employed workers
on labor market slack. It is then complemented with the share of involuntary part-time workers to
give a broader view of labor market slack. Key factors that have affected the dynamics of wages
since the crisis include low labor productivity growth, significant labor market slack in the UK and
the EU until recently, low actual and expected inflation, and uncertainty about the growth outlook.

1
    Prepared by Jiaqian Chen (EUR) and Weicheng Lian (RES).
2
 This may partly reflect reforms on the pension entitlement age which has pushed up the participation of old aged
workers (HMT, 2011).

                                                                             INTERNATIONAL MONETARY FUND                3
UNITED KINGDOM
B. Determinants of Wage Growth
3. Nominal wage growth is determined by the interaction of a number of factors. Some
are structural in nature, other are cyclical:
Labor productivity growth—the Real Product Wage and Labor Productivity
(Log points)
growth in output per worker—is a key
driver of real wage growth. As
4.59 1.45
productivity increases (which could
happen as firms invest in new
1.4
machines and adopt a better 4.54
technology, for example), the
incentives to expand production and 4.49
Labor productivity (8q MA) 1/
1.35
hire new workers improve, which Real product wage, rhs 2/
should eventually translate into rising 4.44 1.3
2000 2003 2006 2009 2012 2015 2017Q2
pressure on wages. In the UK, the
Sources: Haver and Fund staff calculations.
labor share as percent of GDP has 1/ Real output per worker.
2/ Average weekly private sector regular wages deflated by GDP deflator.
been close to 64 percent over time,
which suggests a broadly stable Labor Share
relationship between labor (Percent of GDP)
68 68
compensation and workers’ Compensation of employees Self-employment income
66 66
productivity. Total labor compensation
64 64
Labor market slack—the gap 62 62
between headline and equilibrium 60 60
unemployment—also has an 58 58
important influence on wages. 56 56
During the expansionary phase of 54 54
the business cycle, firms seek to hire 52 52
more workers to meet increased 50 50
2000 2002 2004 2006 2008 2010 2012 2014 2016
demand for output, which leads to
Sources: Bank of England and Fund staff calculatins.
lower unemployment and eventually
to higher wages as the supply of qualified workers diminishes. The reverse happens during
downturns. Historically, the unemployment rate has been a good indicator of labor market
tightness. More recently, due to the changing nature of work arrangements, one has to look at a
broader range of measures to form a view on the state of the labor market. This topic is
discussed in the next section.
With globalization, goods, capital, and labor move more freely across borders, so global labor
market conditions also matter for domestic wages. In our analysis we consider measures of labor
market slack in the EU as an additional determinant of wage pressures in the UK.
4 INTERNATIONAL MONETARY FUND
UNITED KINGDOM
Expected inflation is another important factor determining nominal wages. In a simple world
with no business cycle fluctuations, constant non-wage costs, and no monopoly power, pay
raises should be approximately equal to productivity growth plus expected inflation.
Finally, uncertainty about medium term growth prospects can also influence hiring decisions and
wage dynamics. At a time of pessimism or uncertainty about the future, firms would be less
willing to hire full-time employees or pay better wages to attract more qualifies workers (even if
current demand is strong). At the same time, workers may be less willing to switch jobs or seek a
wage increase.
C. Assessing Labor Market Slack
4. Historically, the unemployment rate has been a good indicator of slack, but with the
rise of more flexible forms of employment, a broader assessment of labor market conditions
may be warranted. For example, the share of part-time employees who would prefer fulltime
jobs—involuntary part-time workers—
doubled from 9.4 percent in 2007 to Underutilization in the Labor Market
(Percent of employment)
18 percent in 2013, before falling back to
12 percent recently. Involuntary part-time 7
workers may have little wage-bargaining 6
power and may prioritize job security over 5
higher wages. Moreover, the share of self- 4
3
employed workers and zero-hour workers 3 Zero-hour workers
has increased above pre-crisis levels. Some of 2
Part-time and temprary workers could not find full-
these workers may prefer to be in regular 1
time (permanent) job
employment, and could seek to return to it as 0
the economy recovers. Therefore, cyclical 2001 2002 2003 2005 2006 2007 2009 2010 2011 2013 2014 2015 2017
pressures on the labor market can perhaps be Sources: Haver.
assessed better by looking at changes in
broader measures of underemployment. Transition Probability of Self-employed Workers to Regular
Employment and Output Gap (percent)
4.5
5. Analysis of labor flows suggest
that the transition rate from self- 4
employment to regular employment is
3.5
procyclical. Although the increase in self-
Probability
employment has a structural component
3
(some workers may have an incentive to
become self-employed due to the nature of 2.5
their work and/or the relatively more
favorable tax treatment of the self-employed, 2
Output gap
-4 -2 0 2 4
see Tatomir 2015), our analysis suggests that Sources: Fund staff calculations.
3
People in employment on contracts where they are not guaranteed any hours in a given week.
INTERNATIONAL MONETARY FUND 5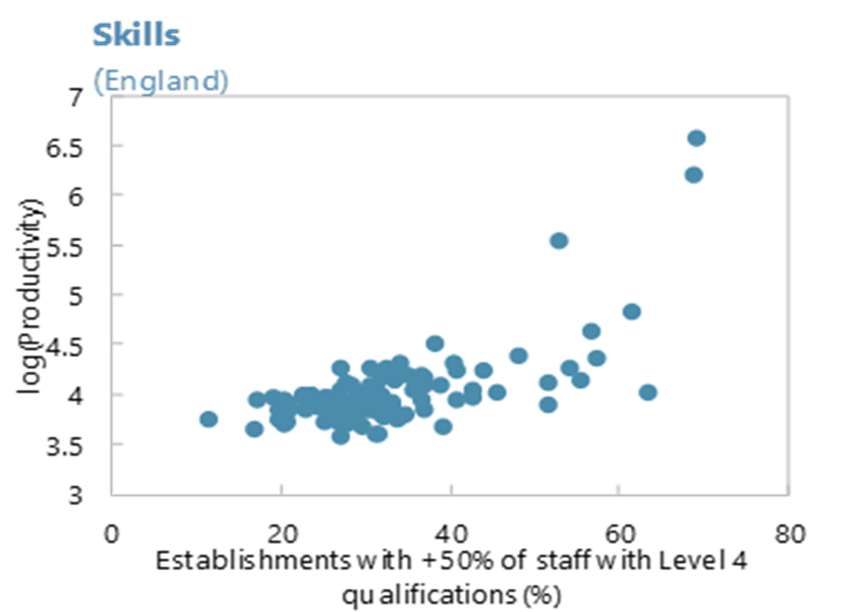
UNITED KINGDOM

it has a cyclical component as well. The share of self-employment rises during recessions (transition
from unemployment to self-employment increases). In addition, transitions from self-employment
to employment increase as economic conditions improve (see chart). Panel regression using data
from 2001–15 (following Rees and Shah 1986) shows that the probability of moving to regular
employment increases when the economy recovers. This is consistent with anecdotal evidence that
some self-employed have been forced out of regular employment as firms try to avoid the legal
obligations that come with an employment contract, such as meeting minimum wage requirements,
national insurance contributions, statutory sick and holiday pay, and fair dismissal. A recent study by
Tomlinson and Corlett (2017) suggests that about 60 percent of the self-employed are in the
“precarious” sectors, where they are more likely to be underemployed. Overall, this evidence
suggests that self-employment could affect the degree of labor market slack and wages (see Box 1).

                Box 1. Could High Self-Employment Share Affect Wage Growth?
 A compositional shift towards greater self-employment would structurally reduce wage
 growth, as self-employed workers typically have lower wage income. On average, self-
 employed workers receive lower labor income, although there is a significant variance, with fat
 tails at both ends of the income distribution (Hatfield 2015). Moreover, Blanchflower and
 Shadforth (2007) show that self-employed (without their own workers) have seen their median
 weekly income drop by about a 20 percent in real terms between 2007–08 and 2014–15, while
 both employees and self-employed with workers have seen milder declines. Self-employed
 workers are not bounded by the national minimum requirement, and are less likely to have made
 contributions to a private pension scheme: in 2010/11 only 21 percent had pensions compared to
 50 percent of employees. Few self-employed in the UK employ staff of their own: only 17 percent
 of self-employed in the UK have workers compared to 44 percent in Germany (Hatfield 2015).

 In addition, high share of self-employed may have a negative influence on wage growth for
 regular employees. Since self-employed workers have lower wages on average, they could
 compete with regular employees for a given task, reducing economy-wide wage pressures.
 Empirically, transitions from self-employment to regular employment increase when economy
 recovers, so some of the self-employed workers will compete with the unemployed for vacancies,
 thus delaying the pace of wage recovery. Indeed, the transition rate from self-employment to
 regular employment has increased in 2016–17 (to about 3.5 percent from an average of 3 percent
 after the crisis).

6    INTERNATIONAL MONETARY FUND
UNITED KINGDOM
Box 1. Could High Self-Employment Share Affect Wage Growth? (concluded)
Panel fixed effect Probability of self-employed Probability of unemployed to
VARIABLES workers to employee employee
Unemployment rate -0.04*** -0.09***
(0.01) (0.03)
Regional unemployment -0.02* -0.07**
(0.01) (0.03)
age 0.03*** 0.03*** 0.06*** 0.05**
(0.01) (0.01) (0.02) (0.02)
age squared -0.0001* -0.0002* -0.0004 -0.0005*
(8.93e-05) (8.93e-05) (0.0003) (0.0003)
Eduction level -0.004 -0.005 -0.004 -0.004
(0.006) (0.006) (0.02) (0.02)
Single 0.02 0.02 0.03 0.03
(0.02) (0.02) (0.07) (0.08)
Constant -0.72*** -0.61*** -0.50 -0.40
(0.21) (0.21) (0.39) (0.40)
Fixed effect Yes Yes Yes Yes
Observations 6,031 5,991 2,200 2,191
R-squared 0.011 0.009 0.027 0.023
Number of pid 1,847 1,842 1,444 1,439
Standard errors in parentheses
*** pUNITED KINGDOM
Kalman filter). There is evidence that the equilibrium unemployment rate has declined over time
due to rising educational attainment in the labor force, and tax and benefit reforms that have
changed incentives to move from unemployment to employment (Saunders 2017).
Unemployment and Adjusted Unemployment Rate Contribution to Adjusted Unemployment Rate
10.5 8.8 (percent of working age population)
Adj. unemployment rate (percent of WAP) 5.5 1.4
8.3
Inactive
10 Unemployment rate (percent of LF)
7.8 5 Unemployed workers
1.3
Self-employed workers, rhs
9.5 7.3
4.5
6.8 1.2
9
4
6.3
1.1
8.5 5.8 3.5
5.3 1
8 3
4.8
2.5 0.9
7.5 4.3
2000 2002 2004 2006 2008 2010 2012 2014 2016
2000 2002 2004 2006 2008 2010 2012 2014 2016
Sources: ONS and fund staff calculations.
Sources: Fund staff calculations.
The hiring rate is defined as those finding new jobs every period (existing workers, inactive, or
unemployed) over total employment. Wage negotiations occur when a worker finds a new job
and as the hiring rate improves, wage pressures may increase.
Involuntary part-time employment as a share of the labor force is added as a separate
variable to the wage regressions to compliment the above measures of labor market slack.
D. Empirical Strategy and Data
7. This chapter uses an error-correction model (ECM) for wage dynamics. Theory suggests
that, over the long run, labor compensation will move in line with labor productivity, thus we assume
that the long-run real wage ( ) is determined by labor productivity ( ), similar to Blanchard and
Katz (1999):5
= , + , + , = ∗
+ , (1)
8. In the short run, nominal wages may temporarily deviate from productivity, driven by
labor market developments and other factors. The short term nominal wage dynamics equation
includes the lagged error term from the long run equation, measures of labor market slack ( ),
lags of inflation expectations ( ), lagged productivity growth (∆ ), and other factors ( )
including growth uncertainty and EU labor market conditions.
∆ = , + − ∗ )+ , + , ∆ + , + , + , (2)
5
Labor compensation is highly correlated with wages over time.
8 INTERNATIONAL MONETARY FUNDUNITED KINGDOM
9. Table 1 provides summary statistics for the key variables. There are several different
measures for wages. 6 This chapter uses average weekly earnings from the Office of National
Statistics, since they exclude earnings of the self-employed (which may be driven by factors other
than regular wages). The nominal wage is deflated by GDP deflator to get the real wage. Labor
productivity is defined as real Gross Value Added (GVA) per worker. Table 2 shows that real wages
and productivity are non-stationary, but their first differences are stationary.
Table 1. United Kingdom: Summary Statistics for Selected Indicators
Obs Mean Max Min Std. Dev
Nominal wage (yoy change) 66 0.03 0.05 0.00 0.01
Labor productivity (yoy change) 66 0.01 0.04 -0.05 0.02
Unemployment rate 70 0.06 0.01 0.04 0.08
Adj. unemployment rate (percent) 70 0.09 0.01 0.08 0.10
Adj. unemployment rate gap (ppt) 70 0.00 0.01 -0.01 0.02
Hiring rate (percent) 63 0.06 0.00 0.04 0.06
Share of involuntary PT workers 70 0.03 0.01 0.02 0.05
Inflation expectations 1/ 70 0.03 0.00 0.00 0.04
EU unemployment gap 70 0.33 0.98 -1.80 2.18
Growth uncertainty 2/ 70 0.50 0.16 0.25 0.94
1/ 5-year ahead inflation expectation derived from government securities.
2/ Standard deviation of one-year ahead growth forecast from consensus.
Sources: Haver, Eurostat, Consensus Forecast, and fund staff calculations.
Table 2. United Kingdom: Unit Root Tests
Variable ADF Phillips-Perron
Testing Levels t-ADF 0.05 Adj t-stat 0.05 Characteristics
Real product wage -2.630 -3.476 -2.624 -3.476 Trend and intercept
Productivity (MA,8q) -2.473 -3.478 -1.996 -3.477 Trend and intercept
Testing first differences
Real product wage -7.635 -2.909 -7.780 -2.905 Intercept
Productivity (MA,8q) -1.825 -1.946 -1.989 -1.946 no intercept
The null hypothesis for the ADF and PP tests is non-stationary.
6
Other wage measures include labor cost index from Eurostat, wage and salaries from National Accounts, labor
compensation from gross domestic product.
INTERNATIONAL MONETARY FUND 9UNITED KINGDOM
10. Error correction models are estimated using quarterly data over the period
2000Q1–2017Q2. The sample is constrained by the fact that weekly earnings data are only available
since 2000. The long run wage equation is estimated by fully modified least squares and the results
are presented in Table 3. A general-to-specific approach is adopted for the short run equation.
E. Empirical Findings
11. As expected, the estimated coefficient on productivity in the long run equation is close
to one, suggesting a tight relationship between predicted versus actual real wage growth (see text
chart). It is interesting to note that real wages did not fall significantly during the crisis, suggesting
some downward wage rigidity. However, wage growth slowed, and by 2013 real wages started to lag
productivity. As of 2017Q2, real wage was broadly in line with the estimated long run equilibrium
value.
Real Wage and Estimated Long-Run Equilibrium
(Log points)
4.63
1.47
4.61
1.45
4.59
1.43
4.57
1.41
4.55
1.39 4.53
1.37 4.51
1.35 Real wage 4.49
1.33 Long-run equilibrium wage, rhs 4.47
1.31 4.45
2000 2001 2003 2004 2006 2007 2009 2010 2012 2013 2015 2016
2017Q2
Sources: ONS and Fund staff calculations.
Table 3. United Kingdom: LR Cointegration Relationship: Real Wage
Variables p
Labor productivity trend 0.86
(0.06)***
Constant -2.50
(0.29)***
Observations 70
Adjusted R-squared 0.93
S.E. of regression 0.01
Cointegration Tests
Engle-Granger Phillips-Ouliaris
tau-statistic -3.09 -3.08
Probability 0.10 0.11
z-statistic -16.38 -15.95
Probability 0.09 0.10
Hansen Instability
Lc statistics 0.07
Probability >0.2
10 INTERNATIONAL MONETARY FUNDUNITED KINGDOM
12. The results from the second equation suggest that labor market slack is a significant
determinant wage growth in the short run. All different measures of labor market slack are
significant and have the expected sign. The results suggest that a one percent increase in
underemployment (measured by the adjusted unemployment rate, the adjusted unemployment gap,
or the hiring rate) reduces wage growth by about 0.35 percent. However, to fully account for
domestic labor market slack, one also needs to consider the share of involuntary part-time workers,
where one percentage point increase reduces wage growth by about 0.3 percent. Moreover, labor
market slack in the EU has a statistically significant impact on wage growth.7 Increased uncertainty
about future economic growth is found to depress wage growth, which could account for the weak
wage growth since the referendum. As expected, the coefficient on the error correction term is
negative and significant, suggesting a correction toward equilibrium over time.
Table 4. United Kingdom: Private Sector Average Weekly Regular Pay Growth
Table 4: Private sector average weekly regulay pay growth
(1) (2) (3) (4)
ecm (t-4) -0.25*** -0.21*** -0.20*** -0.22***
(0.09) (0.07) (0.07) (0.07)
Headline unemployment (t-4) -0.59***
(0.06)
Adj. unemployment rate (t-4) -0.37***
(0.13)
Adj. unemployment rate gap (t-4) -0.32**
(0.13)
Hiring rate (t-4) 0.46**
(0.18)
Involuntary part time employment (t-4) -0.28** -0.34*** -0.29**
(0.11) (0.11) (0.11)
Inflation expectation (t-4) 0.66*** 0.34** 0.34** 0.36**
(0.18) (0.14) (0.15) (0.16)
Productivity growth (t-1) 0.28*** 0.21*** 0.23*** 0.21***
(0.05) (0.04) (0.04) (0.04)
EU unemployment gap (t) -0.44*** -0.43*** -0.54***
(0.10) (0.10) (0.09)
Growth uncertainty (t-2) -2.43*** -2.41*** -2.02***
(0.47) (0.49) (0.60)
Constant 0.04*** 0.07*** 0.04*** 0.01
(0.01) (0.01) (0.01) (0.01)
Observations 66 66 66 59
R-squared 0.78 0.89 0.89 0.88
Standard errors in parentheses
*** pUNITED KINGDOM
13. In-sample forecast points to the importance of controlling for wage drivers beyond
headline unemployment. The figures below compare the in-sample forecast performance of
models 1 and 3 from Table 4.8 The forecast performance improves significantly when controlling for
the share of involuntary part-time workers and other factors (model 1 consistently overpredicts
wage growth). Thus, in the rest of the paper, the discussions are based on results from model 3.
In-sample Projection of Nominal Wage Growth In-sample Projection of Nominal Wage Growth
(yoy percent change) (yoy percent change)
5 5
4 4
3 3
2 Model fit (model 1) 2 Model fit (model 3)
Actual Actual
1 1
0 0
2001 2002 2003 2004 2006 2007 2008 2009 2011 2012 2013 2014 2016 2017
2017Q2 2001 2002 2003 2004 2006 2007 2008 2009 2011 2012 2013 2014 2016 2017
2017Q2
Sources: Fund staff calculation. Sources: Fund staff calculation.
14. Historical decomposition suggests labor productivity and labor market slack (in the UK
and the EU) are the most important drivers of wage growth, explaining well the slowdown in
nominal wage growth post-crisis. The text figure below shows the contribution of different factors
to wage growth (in deviations from the sample average). Low productivity growth (LP) and weak
labor market conditions (slack) contributed significantly to the slowdown in wages since the financial
crisis. In addition, uncertainty about future economic growth appear to have weighed on wage
growth during the crisis, as well as in recent quarters (while optimism about growth prospects
supported wages during the period of steady recovery 2011–16). Low inflation in 2015–16 also
Contribution to Nominal Wage Growth
(percentage points, deviation from mean)
3 3
LP Slack
Inflation EUU
2 Uncertainty Initital 2
Fitting error Actual
1 1
0 0
-1 -1
-2 -2
-3 -3
2001 2002 2003 2004 2006 2007 2008 2009 2011 2012 2013 2014 2016 2017
Sources: Fund staff calculations.
8
Comparison with other models is available upon request.
12 INTERNATIONAL MONETARY FUNDUNITED KINGDOM
played a role in depressing wages during 2016–17. More recently, slack in the labor market has
diminished, providing a modest boost to wages (although the effects have been offset by greater
uncertainty and weak lagged inflation).
F. Wage Outlook
15. Looking ahead, nominal wage growth should strengthen, reflecting improvements in
labor markets. In the baseline, labor markets are expected remain relatively tight, with the
unemployment rate slightly below the estimated equilibrium level and the share of involuntary part-
time workers dropping to pre-crisis levels. This would help raise wages temporarily above the level
implied by productivity growth. Growth uncertainty (which has surged after the Brexit vote) is
assumed to dissipate once a broad agreement on the shape of the future economic relationship
with the EU is reached. In addition, the baseline projection assumes that inflation expectations and
the EU labor market gap remain unchanged at their 2017Q2 level, and productivity growth recovers
to about 1 percent in the medium term. Under these assumptions, annual nominal wage growth is
expected to pick up from 2¼ percent in 2017Q2 to between 2¾ and 3 percent in 2018.
16. However, this baseline projection is subject to significant risks. On the upside, a greater
share of self-employed workers could start seeking regular jobs. We have already seen an increase
in the rate at which the self-employed move to regular employment (to 3.5 percent in 2017 from
3 percent average post-crisis). If the rate doubles to 6 percent, wage growth could be lower by
about 1 percentage point due to a larger pool of labor competing for vacancies. In addition,
uncertainty about the rate of future growth may remain elevated for some time, even after the UK
leaves the European Union. Ultimately, the main determinant of wage growth would be productivity
growth – if it fails to pick up as projected, wage growth would remain weak.
Adjusted Unemployment Rate under Different Scenarios Nominal Wage Growth under Different Scenarios
(percent of working age population) Relative to Baseline (Percentage points)
10.5 0.6
Inactive 0.4
9.5
Unemployed 0.2
8.5
Self-employed 0
7.5 -0.2
6.5 -0.4
-0.6
5.5
-0.8
4.5
-1
3.5 -1.2
No transition from self- Baseline Higher transition from No transition from self-e to regular Higher transition from self-e to
e to regular job 1/ self-e to regular job 2/ job 1/ regular job 2/
Sources: Fund staff calculations. Sources: Fund staff calculations.
1/ Assume transition of self-employed workers to regular employment is 0. 1/ Assume transition of self-employed workers to regular employment is 0.
2/ Assume self-employed workers are 60 percent less likely to become regular 2/ Assume self-employed workers are 60 percent less likely to become regular
employed compared with unemployed workers. employed compared with unemployed workers.
G. Conclusions
17. Recent labor market developments in the UK appear to point to a disconnect between
unemployment and wages. While the unemployment rate has fallen to a 40-year low, wage growth
INTERNATIONAL MONETARY FUND 13UNITED KINGDOM continues to growth at a subdued pace. The analysis in this paper suggests that this puzzle is explained by persistent weak productivity growth and well-anchored inflation expectations, as well as by greater effective labor market slack than suggested by the headline unemployment rate. Broader measures of underemployment—accounting for involuntary part-time unemployment, inactive and self-employed people seeking regular jobs—suggest that slack in the labor market was higher than implied by the unemployment rate in recent years. Models using these broader measures capture well the observed wage dynamics. 18. Persistent tightness of the labor market should prompt some firming of wage growth in the coming year, everything else equal. A mild increase in unit labor costs would help bring domestically generated inflation in line with the inflation target. Of course, the actual outcome for wage growth would also depend on the extent to which Brexit-related uncertainty dissipates, so firms can more easily make long-term decisions. More generally, wage growth will recover in a sustainable way only once productivity growth recovers. 14 INTERNATIONAL MONETARY FUND
UNITED KINGDOM

                                           References

Andrews, D., C. Criscuolo and P. N. Gal, 2015, Frontier Firms, Technology Diffusion and Public Policy:
Micro Evidence from OECD Countries, OECD Productivity Working Papers, 2015–02, OECD
Publishing, Paris.

Blanchard, O. J., and K. Lawrence, 1999, Wage Dynamics: Reconciling Theory and Evidence, NBER
Working Paper 6924.

Blanchflower, D., and C. Shadforth., 2007, Entrepreneurship in the U.K., Foundations and Trends in
Entrepreneurship, Vol. 3, No. 4, pp. 257-364.

Haldane, A, 2017, Work, Wages and Monetary Policy, 2017 Speech at the National Science and
Media Museum, Bradford., June.

HMT, 2011, Autumn Statement 2011.
https://www.gov.uk/government/uploads/system/uploads/attachment_data/file/228671/8231.pdf

Harfield, I., 2015, Self-Employment in Europe, IPPR 2015.

Kudlyak, M., and F. Lange, 2014, Measuring Heterogeneity in Job Finding Rates Among the
Nonemployed Using Labor Force Status Histories, Federal Reserve Bank of Richmond Working
Papers No. 14-18.

Rees, H., and A. Shah., 1986, An Empirical Analysis of Self-employment in the U.K., Journal of Applied
Econometrics, 1, issue 1, pp. 95-108.

Saunders, M., 2017, The Labour Market, Resolution Foundation, London., January.

Tatomir, S., 2015, Self-employment: What Can We Learn from Recent Development? Bank of
England Quarterly Bulletin 2015Q1.

Tomlinson, D., and A. Corlett., 2017, The Nature of Self-employment in 21 st Century Britain and
Policy Implications, Resolution Foundation.

                                                                 INTERNATIONAL MONETARY FUND         15
UNITED KINGDOM
REGIONAL DISPARITIES IN LABOR PRODUCTIVITY IN
THE UNITED KINGDOM1
A. Introduction
1. Labor productivity in the United Kingdom is low relative to that in peer economies. In
2015, GDP per hour worked was between 20 and 25 percent lower than in France, Germany and the
United States (Figure 1). While productivity underperformance is not new, it has worsened over the
last decade. UK productivity growth has declined from 2.1 percent during 2000–07 to 0.5 percent
during 2010–16, which is very low even in the context of subdued global productivity.
Figure 1. National Labor Productivity
GDP per Hour Worked, 2015 GDP per Hour Worked
(USD, constant prices, 2010 PPPs) (USD, constant prices, 2010 PPPs)
70 70 70 70
60 60
60 60
50 50
40 40 50 50
30 30 40 40
20 20
30 30
10 10 France
0 0 20 Germany 20
United Kingdom
Switzerland
Canada
Netherlands
Japan
Spain
Euro area
Belgium
France
Germany
UK
US
Austria
G7
Australia
Italy
10 10
United States
0 0
70 75 80 85 90 95 2000 05 10 15
Source: OECD and IMF staff calculations.
2. Moreover, there are large and long-standing disparities in labor productivity across UK
regions (Figure 2).
Only two regions at the NUTS 1 level show productivity levels above the country average.2 This
means that 70 percent of employment is in regions with productivity levels below average. The
UK’s highest productivity region (London) is nearly 60 percent more productive than its lowest.
The productivity gap within each region is greater than between regions, so regional disparities
are even larger at higher levels of territorial disaggregation (such as at the NUTS 3 level).
From a cross-country perspective, regional disparities are large compared to other advanced
economies. The story is two-fold: London’s economic performance contributes to national
1
Prepared by Nicolas Arregui and Lucyna Gornicka (both EUR).
2
The European Union Nomenclature of Territorial UNITS (NUTS) classification is used in this analysis.
16 INTERNATIONAL MONETARY FUNDUNITED KINGDOM
averages that disguise the weakness in other regions. Indeed, UK low productivity regions
underperform the least productive regions in other advanced economies.
Regional discrepancies in the UK are long-standing and have not shown signs of convergence
over the last decade.3
Wealthier regions have higher productivity across most industry sectors (Annex I), suggesting
that their comparative advantage is not due to a particular type of economic activity but rather
to other, cross-cutting regional characteristics.
Figure 2. Regional Labor Productivity
Regional Productivity, 2015 Regional Disparities in Labor Productivity
(GVA per hour worked at NUTS 1 level; UK=100) (NUTS 3 regions; ratio of upper to lower percentile)
140 140 2.5 2.5
130 130
Nominal Real* 95th to 5th percentile ratio
120 120
110 110 2.0 2.0
100 100 90th to 10th percentile ratio
90 90
80 80 1.5 1.5
70 70
60 60
50 50 1.0 1.0
East Midlands
West Midlands
East of England
Yorkshire/Humber
Northern Ireland
North East
South West
North West
London
South East
Scotland
Wales
0.5 0.5
0.0 0.0
ES IT AT BE FR DE NL UK
Regional Productivity Distribution Regional Divergence
1.4
50
Average growth rate in Real GVA per
1.2
Wales South East London
40
worker 2003-2014 (%)
1.0
0.8
Frequency
30
NE England
0.6
N. Ireland
20
0.4
East Midlands
0.2
10
0.0
10.7 10.8 10.9 11 11.1 11.2 11.3 11.4 11.5 11.6
0
60000 80000 100000 120000
Real GVA per worker, PPP 2010USD
log(Real GVA per worker PPP 2010USD, in 2003)
Sources: Eurostat Regional Statistics, OECD, ONS, and IMF staff calculations.
Note: In chart 1, real productivity is estimated by deflating nominal levels by the latest available regional price
indexes (2010) computed by ONS. Charts 2 to 4 compute labor productivity as GVA per worker instead of
hours. The underlying distribution in chart 3 includes OECD TL2 regions for Austria, Australia, Belgium, Canada,
Germany, Denmark, Spain, Finland, France, Italy, Japan, Luxembourg, Netherlands, Sweden, United Kingdom
and United States (excluding District of Columbia). Productivity levels reported in Eurostat may overstate
productivity differences at the NUTS 3 level in the UK, as hours worked are based on place of reference rather
than of work. Still, using ONS reported data in chart 2 does not alter the UK’s position relative to other
countries.
3
The persistence in regional disparities implies that these are unlikely the reason behind the ¨productivity puzzle¨
(i.e. the flattening in productivity growth in recent years).
INTERNATIONAL MONETARY FUND 17UNITED KINGDOM
3. Reducing regional disparities by boosting labor productivity in underperforming
regions would promote faster and more inclusive growth. Interregional differences in
productivity are related to differences in well-being and inclusion. For instance, UK regions with low
productivity tend to have a larger share of young population that is neither employed, in training or
in education. At the same time, disparities may signal untapped potential for catching up, and if
addressed may contribute to overall growth. The potential benefits of addressing regional disparities
have long been recognized by UK authorities, and all recent major party manifestos promised action
to reduce them.4 Policies should be judged based on their impact on growth and inclusion, rather
than whether they narrow the gap between particular regions.5 The challenge for the government is
to help address failures or frictions underpinning regional disparities, allowing those less successful
regions to build the conditions for economic success, while not cutting off the ability of leading
regions to play their role.
4. This note takes stock of multiple (and interrelated) channels potentially underlying
regional disparities and discusses policy implications. The analysis is focused on six factors:
human capital, investment, innovation, agglomeration effects, international competition, and the
role of the government. Main findings suggest:
Strengthening education and training is likely to play an important role in helping address
regional disparities in productivity.
High housing prices and regulatory constraints have an impact on internal migration, possibly
reducing its effectiveness as a regional convergence mechanism.
While aggregate public investment in the UK has traditionally been below that of its peers,
limited available evidence does not suggest that investment in physical capital and SME access
to finance are particularly worse in underperforming regions.
Investment in research and development (R&D) in the UK lags behind that of its peers and is
uneven across the country’s regions. Improving the ability of underperforming UK regions and
localities to adopt innovations is likely to be crucial in enabling them to catch up.
Agglomeration effects play a significant role in explaining regional disparities in the UK. Major
infrastructure projects like the Northern Powerhouse Rail and the Midlands Rail Hub are aimed
at increasing connectivity to achieve agglomeration effects in areas outside London and the
South East.
Foreign direct investment and exposure to international competition can play an important role
in stimulating regional economic performance. The productivity benefits that external-facing
4
“Improving the economic performance of every country and region of the UK is an essential element of [the
Government’s] objective, firstly for reasons of equity, but also because unfulfilled economic potential in every region
must be released to meet the overall challenge of increasing the UK’s long-term growth rate.” (HMT 2001).
5
“It is helpful to remember that we ultimately care about the effect of policies on people more than on places.”
(Overman 2015).
18 INTERNATIONAL MONETARY FUNDUNITED KINGDOM
firms bring highlight the importance of openness to trade and foreign direct investment for
raising productivity.
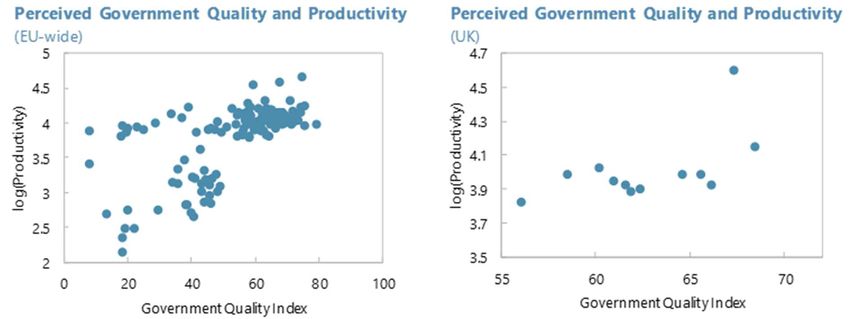
Decentralization of governance arrangements could improve the responsiveness of policy to
local economic conditions.
B. Understanding Regional Disparities
5. Regional disparities in productivity may signal a potential for catching up, a
development that, if realized, would favor growth and inclusion. Differences in productivity
levels across regions within countries may be the result of geographic conditions, agglomeration
forces, and other factors. Therefore, one cannot expect the gaps to entirely close over time.
However, a productivity gap across regions may also be the result of frictions and externalities,
leaving a role for policies to promote convergence.
Neoclassical growth theories predict regional convergence if economic markets function well
and factors of production and technology are mobile.6 Regional disparities can therefore result
for various reasons. First, frictions in labor mobility and access to finance may limit the standard
convergence mechanisms. Indeed, recent cross-country studies have found that significant
barriers to factor mobility within countries are required to make sense of the observed levels of
regional disparities (see, for instance, Gennaioli et al. 2014). Second, the adoption of
technological innovation and best practices is not automatic.7 Evidence suggests that diffusion
processes require certain proximity between regions, such as proximity in geography,
technology, or in skills endowments. Finally, an uneven provision of public goods, such as
physical infrastructure or education, may also underpin regional disparities.8
Productivity in urban areas benefits from agglomeration economies. Workers and firms in larger
cities tend to be more productive. This is partly due to the greater share of highly-skilled and
educated workers in larger cities, but in part it also reflects “agglomeration economies” that
arise from living and working in large cities (Ciccone 2002, Ahrend et al. 2014). Three forces
create agglomeration economies (Duranton and Puga 2004). First, by locating in close proximity,
firms can share suppliers, thereby allowing them to specialize and through that specialization
become more productive. Second, large cities are home to a variety of workers and firms, which
creates more opportunities for workers to find the ideal job and for firms to find the “best-
matching” – most productive – employee for a job. Third, informal interaction and learning from
6
Importantly, the more recent endogenous economic growth theories in which long run growth depends on the
creation of technological knowledge do not predict convergence across regions with different starting positions.
7
See, for instance, Keller (2000), and Girma and Wakelin (2000).
8
Other potential factors include the differential regional impact of successive structural shocks, such as via trade or
technology.
INTERNATIONAL MONETARY FUND 19UNITED KINGDOM
others is facilitated by proximity. This creates knowledge spillovers and therefore better diffusion
of ideas and technologies.
Human Capital and Education
6. There is scope to improve educational outcomes and increase human capital in the UK.
Human capital is a key determinant of economic growth.9 Skilled labor is likely to be more
productive, and regions with easier access to skilled workers may attract technologically more
advanced, productive businesses. On aggregate, adults in the UK have lower literacy and numeracy
skills than the OECD average and the proportion of younger people in England with low skills is
higher than the proportion among people nearing retirement age.10 The share of those aged 15–19
that are enrolled in education is below the OECD average.
7. Large variations in the skills composition of the local workforce across UK regions
correlate strongly with regional disparities in labor productivity (Figure 3). Studies using
regional and firm level data suggest that workforce skills are significantly related to productivity
levels.11 The Manchester Independent Economic Review (2009) found that regional disparities in
skills were the key factors explaining productivity differences. In turn, the skills level of the workforce
in a region depends on both the production of skills in that region through education and training,
and the movement of workers in and out of the region (i.e. the so-called sorting effect).
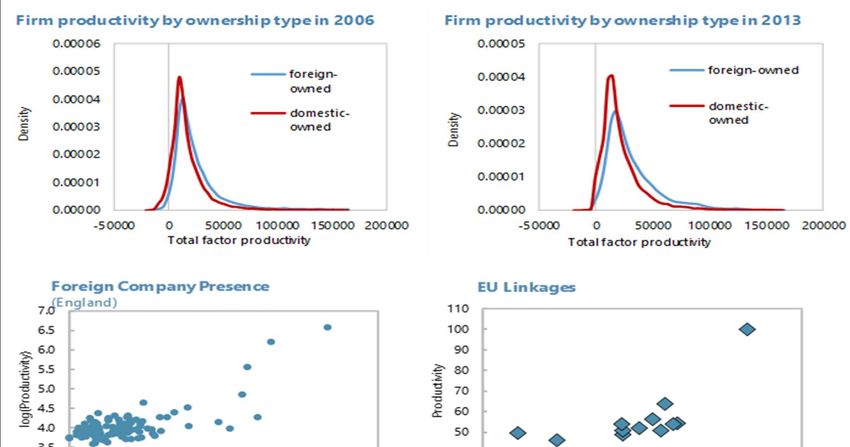
Participation. Early-age education participation is high and homogeneous across UK regions.12
However, regional differences in participation become more pronounced at more advanced
levels of education. For instance, participation in education for students aged 17 in Wales is
remarkably lower than for other regions.
Quality. Comparing the quality of education across UK regions is difficult due to limited
comparable data.13 PISA scores for Wales are below UK and OECD averages. Indeed, this is a
long-standing issue, as it is the fourth consecutive set of PISA results in which Welsh students
have performed worse than the UK average. Within England, the Ofsted’s annual report (2016)
has cautioned that some areas are being left behind. A larger share of secondary schools is
9
See, for instance, Mankiw, Romer and Weil (1992), Benhabib and Spiegel (1994), Aghion and Howitt (1998), Temple
(2000), and Bassanini and Scarpetta (2001).
10
See OECD (2017). For instance, in the OECD Survey of Adult Skills, England and Northern Ireland have some of the
highest proportions of adults scoring at or below the two lowest scores (out of six) in numeracy.
11
See, for instance, Rice et al (2006) and Webber et al (2009).
The percentage of four-year-olds in early childhood and primary education in the UK is one of the highest among
12
OECD countries (OECD EAG 2016)
13
McNally (2015) suggests that, due to the regional differences in how GCSEs are taught, it is more informative to
use international tests when making regional comparisons than the often-used measure of “percentage of pupils
attaining five or more GCSEs at grades A*-C (including English and math).”
20 INTERNATIONAL MONETARY FUNDUNITED KINGDOM
assessed to be “less than good” in the North and Midlands, compared with a relatively lower
number in the South and East of England.14
Sorting. Regional differences in local workforce skills may be exacerbated if high productivity
regions attract a larger share of high-skilled labor from other regions. Six months after
graduation, London employs 22 percent of all working new university graduates, given its ability
to retain students and attract graduates from other regions (including those who grew up in
London but studied elsewhere). London’s appeal is even greater for high achievers (Swinney and
Williams, 2016). D’Costa and Overman (2014) find that sorting effects account for a
considerable fraction of the observed spatial differences in wages.15
8. Strengthening education and training may therefore play an important role in helping
address regional disparities in productivity.16
Basic skills. Webber et al. (2009) suggest that the key problem in terms of productivity relates
to areas with high concentrations of workers lacking basic skills. Along this line, the MIER (2009)
has stressed the need to improve skills across the board, as the whole labor force contributes to
the productivity of the most highly skilled. The effectiveness of recent government initiatives to
improve basic skills will need to be kept under review to assess the need for further action. For
instance, for under 16s, the national curriculum and GSCEs have been reformed to provide
better assurance of core literacy and numeracy than previous standards. Since 2013 math and
English study programs are provided to all 16 to 19-year-old students who have not, by the age
of 16, achieved at least minimum grade in these subjects.
Technical skills. The UK has a shortage of technical-level skills, ranking 16th out of 20 OECD
countries for the proportion with technical qualifications (HM Government Industrial Strategy
Green Paper, 2017). Government initiatives to promote technical and vocational education (such
as the introduction of T-level technical qualifications) could be particularly beneficial for young
people who do not attend university, who are generally more prevalent in low productivity
regions. The expansion in vocational training will require continuous monitoring to ensure good
quality.
Teacher shortages. The government has missed its recruitment targets for the last four years
and indicators suggest teacher shortages are growing at the national level (NAO 2016). The
NAO report calls out the Department for Education (DfE) for not paying enough attention to
local and regional recruitment issues: “The Department has a weak understanding of the extent of
local teacher supply shortages and whether they are being resolved locally.” Indeed, evidence
14
The picture is much more homogeneous for primary schools.
15
Taking a different view, McCann (2016) argues that small differences in the quality of interregional migrants across
regions prove that sorting cannot explain the interregional inequalities observed in the UK. However, he only studies
the quality of cross-regional migrants with a graduate degree, while not looking at other groups of migrants.
16
Expanding the pool of skilled labor to which a region has access may require a wide range of policies including
housing and transport, as discussed in the following sections.
INTERNATIONAL MONETARY FUND 21UNITED KINGDOM
suggests that underperforming schools in disadvantaged areas find it hard to attract high-
quality teachers (NAO 2016, and LSE Growth Commission 2017). 17
Continued reform in Wales. In 2011, Wales embarked on a large-scale school improvement
reform to improve students’ performance in literacy and numeracy, and to reduce the impact of
deprivation on student performance. A review of the school system conducted by the OECD in
2014 recommended a number of priority steps: (i) promoting the use of differentiated (more
personalized) teaching, simplifying the use of targeted funding for students, and investing in
support staff; (ii) raising the status of the teaching profession, improving initial teacher training,
and treating developing systemic leadership as a prime driver of education report; (iii) creating a
coherent assessment and evaluation framework; and (iv) defining and implementing policy with
a long-term perspective. A more recent stock-taking evaluation by OECD (2017) noted that
progress has been made in certain policy areas, including a shift in the approach to school
improvement to one with a long-term vision. The report calls for sustaining the commitment,
deepening investments in key policy areas, and strengthening the implementation process.
Figure 3. Regional Labor Productivity and Human Capital
17
The report recognizes that government has launched initiatives such as National Teaching Service to help improve
certain underperforming schools. However, it also highlights the fact that the DfE’s teacher supply model is not being
used to estimate the need for teachers at a local or regional level, leaving the school system to sort out the gaps.
22 INTERNATIONAL MONETARY FUNDUNITED KINGDOM
Figure 3. Regional Labor Productivity and Human Capital (concluded)
Student Assessment by Subject Education quality in England
(PISA scores 2015) (Percent of secondary schools assessed)
520 520 140 140
Good/Outstanding
Science Reading Math 120 120
510 510 Requires Improvement/Inadequate
100 100
500 500 80 80
490 490 60 60
40 40
480 480
20 20
470 470 0 0
South West
East Midlands
London
South East
NorthEast
East of England
West Midlands
Yorkshire/Humber
Northwest
460 460
450 450
England Northern Scotland OECD avg Wales
Ireland
Sources: Eurostat Regional Statistics, OECD, Oftsed Annual Report (2016), ONS, UKCES Employer Skills Survey (2015). and
IMF staff calculations. Note: Charts 1 and 2 are constructed at the NUTS 2 level. UKCES Employer Skills Survey data used
in Chart 4 cover England only. Data is available at the local education authorities (LEA) level. Mapping into NUTS 3
regions is straightforward for most (but not all) cases. Some LEAs map into NUTS 2 regions: Cumbria, Devon, Essex, Kent,
Lancashire, and North Yorkshire. The following LEAs are not included as the mapping into NUTS regions was not clear:
West Sussex, Nottinghamshire, Norfolk, Northamptonshire, Hampshire, Surrey, Derbyshire, Wokingham, West Berkshire,
Windsor and Maidenhead, Reading, Bracknell Forest, and Slough.
Labor Mobility and the Role of Housing Prices
9. Barriers to labor mobility may reduce its effectiveness as a regional adjustment
mechanism. Migration of workers from
poor, low-productivity areas to rich and Net Internal Migration
7.0
highly productive ones is an important
channel through which cross-region 6.5
convergence may be achieved. Factors 6.0
log(Productivity)
distorting internal labor flows are 5.5
potentially relevant determinants of
5.0
regional disparities in income and
4.5
productivity. Indeed, the pattern of
internal flows for England and Wales 4.0
shows that highly productive regions tend 3.5
18
to have net outflows instead of inflows. 3.0
This suggests that factors other than labor -40 -20 0 20 40 60
market conditions (i.e. productivity Net Migration (per 1k residents)
Sources: ONS, and IMF staff calculations.
18
Also, over time, regional mobility has been declining at the same time differences in productivity between regions
have increased (Resolution Foundation 2017).
INTERNATIONAL MONETARY FUND 23UNITED KINGDOM differentials) are likely significant determinants of internal migration patterns in the UK.19, 20 10. Housing prices (and regulations) have a significant impact on internal migration patterns in the UK. Analysis of bilateral gross flows between regions in England and Wales shows that house prices are negatively related to workers’ movement from one region to another (Box 1). Results are in line with Biswas et al. (2009), who study inter-regional migration in England, Wales, Scotland and Northern Ireland, and Rabe and Taylor (2010), who analyze internal migration flows using household-level data for 11 regions in the UK. In turn, Hilber and Vermeulen (2015) show that housing prices are significantly (causally) affected by housing regulations.21 The impact is economically large: if the South East (the most regulated English region) had the regulatory restrictiveness of the North East, house prices in the South East would have been roughly 25 percent lower in 2008.22 11. Evidence also suggests that local housing regulatory constraints have affected income convergence across regions. Data on local housing regulatory restrictions for 46 English counties is used to test whether housing restrictions have affected interregional convergence in the UK. The specification, following Ganong and Shoag (2015), models the change in workers’ real earnings between 1979 and 2008 as a function of its starting level in 1979, a measure of severity of housing restrictions in the same period from Hilber and Vermeulen (2015), and an interaction term of the two variables (Table 1).23 The coefficient on the starting level of earnings is significant and negative, suggesting income convergence between counties with low initial earnings and counties with a high starting level of earnings. The interaction term of earnings and housing regulations is highly significant and positive, indicating a dampening effect of tighter housing regulations on the speed of convergence across counties. To the extent that earnings are correlated with productivity, housing restrictions have likely contributed to differences in productivity across regions as well. 12. Policy measures to promote housing supply may therefore have a positive impact on labor mobility and growth. Regulatory constraints tend to be higher and more binding in more 19 Additionally, migration flows data shows that skilled workers have a higher propensity to move than low-skilled workers, who are very unlikely to move between regions. Areas with higher unemployment may be within travelling distance of labor markets with high levels of vacancies (HMT 2000). Market failures in workers’ skills acquisition may therefore have consequences for labor mobility, highlighting that education and training policies may have important follow-on effects. High net internal outflows in London may also be indicative of international migrants arriving in London before 20 moving elsewhere. 21 In particular, local regulatory constraints are found to increase the elasticity of house prices to changes in local earnings. The paper disentangles the impact of housing regulations from the effect of local scarcity of developable land, 22 which is found to be important in highly-urbanized areas only. 23 Ganong and Shoag (2015) show that, in the US, increasingly strict housing restrictions and rising house prices in highly productive areas have worked as a barrier to interregional migration of low-skilled workers and have slowed regional income convergence. Hsieh and Moretti (2017) find that the resulting labor misallocation had a considerable negative effect on US GDP. 24 INTERNATIONAL MONETARY FUND
UNITED KINGDOM

developed and productive areas (see Hilber and Robert-Nicoud 2013). Evidence from the US
suggests that lowering regulatory constraints in the more productive cities would favor a more
efficient allocation of labor and have an economically significant effect on growth (Hsieh and
Moretti 2017). Efforts should continue to further boost housing supply, including by easing planning
restrictions, mobilizing unused publicly-owned lands for construction, and providing incentives for
local authorities to facilitate residential development (Hilber 2015, IMF 2016, and OECD 2017).24

                   Box 1. United Kingdom: Internal Migration Flows Determinants
 Migration decisions are likely to be affected by labor and housing market conditions, among
 other factors. On one hand, strong labor market conditions, as exemplified by low unemployment
 rates, should draw migrants into regions. On the other hand, expensive housing can discourage
 movement into a region (or encourage outflows). Additionally, other things equal, people are
 expected to move closer to their original location for several reasons, such as proximity to friends
 and family, and lower relocation costs.
 The empirical analysis focuses on bilateral (gross) migration flows between regions of England and
 Wales at the NUTS 3 level. In particular, the following specification is estimated using a Tobit
 model:

                                =    +    log         +     log       +                 +

 where migration flows from region i to j are scaled by population at the region of origin i, and
 Prod, HP, and U denote productivity levels, housing prices (or house-price-to-earnings), and
 unemployment rates, respectively. In line with the description above, theory predicts a negative
 beta 3, and positive beta 1 and 2. The model is estimated for adults above 30 years old, as
 migration decisions are expected to be less driven by education destinations, and housing
 decisions presumably become more relevant at a later stage in life. The baseline specification uses
 robust standard errors.
 The estimation provides evidence that migrants are drawn by strong labor markets and
 discouraged by high house prices and distance. Results are generally robust to clustering standard
 errors by region of origin, expanding the group of adults from 30 to 59 years old, and excluding
 regions with productivity level or housing prices at the 5 percent tails.

24
  Recent budgets commit additional (and increasing) spending to accelerate new housing supply over the coming
years. This includes the creation of a Housing Infrastructure Fund to finance infrastructure targeted at unlocking new
private house building in the areas where housing need is greatest. Funds are allocated to local government on a
competitive basis. A Housing White Paper published earlier this year explores additional reforms to increase housing
supply.

                                                                           INTERNATIONAL MONETARY FUND             25
You can also read