Deciphering enhancer sequence using thermodynamics-based models and convolutional neural networks
←
→
Page content transcription
If your browser does not render page correctly, please read the page content below
Nucleic Acids Research, 2021 1
                                                                                                                 https://doi.org/10.1093/nar/gkab765

Deciphering enhancer sequence using
thermodynamics-based models and convolutional
neural networks
                                1
Payam Dibaeinia                     and Saurabh Sinha1,2,3,*

                                                                                                                                                                  Downloaded from https://academic.oup.com/nar/advance-article/doi/10.1093/nar/gkab765/6368530 by guest on 12 September 2021
1
  Department of Computer Science, University of Illinois at Urbana-Champaign, Urbana, IL 61801, USA, 2 Carl R.
Woese Institute for Genomic Biology, University of Illinois at Urbana-Champaign, Urbana, IL 61801, USA and
3
  Cancer Center at Illinois, University of Illinois at Urbana-Champaign, Urbana, IL 61801, USA

Received July 16, 2021; Revised August 18, 2021; Editorial Decision August 19, 2021; Accepted August 25, 2021

ABSTRACT                                                                          INTRODUCTION
Deciphering the sequence-function relationship en-                                Transcriptional regulation in metazoans is mediated by pro-
coded in enhancers holds the key to interpreting non-                             teins called transcription factors (TF) that bind to specific
coding variants and understanding mechanisms of                                   sites in regulatory regions called enhancers (1), via TF-
transcriptomic variation. Several quantitative models                             DNA interactions and cooperative DNA binding (2). Many
exist for predicting enhancer function and underlying                             TFs that occupy their respective binding sites interact with
                                                                                  each other and with the transcription start site over long
mechanisms; however, there has been no systematic
                                                                                  and short distances to influence the recruitment of tran-
comparison of these models characterizing their rel-                              scription machinery and transcription initiation (3). These
ative strengths and shortcomings. Here, we interro-                               simultaneous interactions establish a complex regulatory
gated a rich data set of neuroectodermal enhancers                                code that drives a gene’s expression in varying cellular con-
in Drosophila, representing cis- and trans- sources                               ditions or cell types.
of expression variation, with a suite of biophysical                                 Gene regulatory mechanisms encoded in an enhancer can
and machine learning models. We performed rigor-                                  be fairly complex and have been the subject of numerous
ous comparisons of thermodynamics-based mod-                                      studies, notably the detailed experimental dissection of de-
els implementing different mechanisms of activation,                              velopmental enhancers in Drosophila (4–6). Such studies
repression and cooperativity. Moreover, we devel-                                 have significantly advanced our understanding of regula-
oped a convolutional neural network (CNN) model,                                  tory mechanisms. For example, certain TFs that are known
                                                                                  to inhibit transcription (‘repressors’) have been found to
called CoNSEPT, that learns enhancer ‘grammar’ in
                                                                                  function only if bound at short distances from activator
an unbiased manner. CoNSEPT is the first general-                                 binding sites (7–9). As another example, TFs that are re-
purpose CNN tool for predicting enhancer function                                 sponsible for promoting transcription (‘activators’) have
in varying conditions, such as different cell types                               been shown in some cases to contribute synergistically to
and experimental conditions, and we show that such                                the gene’s expression (10,11), possibly due to cooperative
complex models can suggest interpretable mecha-                                   DNA-binding by TFs to adjacent binding sites. These com-
nisms. We found model-based evidence for mecha-                                   plex regulatory mechanisms may be mirrored in rules un-
nisms previously established for the studied system,                              derlying the arrangement of binding sites in an enhancer,
including cooperative activation and short-range re-                              a phenomenon sometimes called cis-regulatory ‘grammar’
pression. The data also favored one hypothesized                                  (12–15). Precise characterization of the sequence-function
                                                                                  relationship encoded in enhancers therefore requires in-
activation mechanism over another and suggested
                                                                                  terpreting how a collection of binding sites for one or
an intriguing role for a direct, distance-independent
                                                                                  more TFs works together and how such combinatorial ac-
repression mechanism. Our modeling shows that                                     tion is influenced by site arrangements as well as varying
while fundamentally different models can yield sim-                               TF concentrations in different cellular contexts. The chal-
ilar fits to data, they vary in their utility for mech-                           lenge goes beyond a general understanding of the under-
anistic inference. CoNSEPT is freely available at:                                lying principles (e.g. ‘TF X is a short-range repressor’ or
https://github.com/PayamDiba/CoNSEPT.                                             ‘TFs X and Y activate synergistically’): often, one seeks a

* To   whom correspondence should be addressed. Tel: +1 217 333 3233; Email: sinhas@illinois.edu
Present address: Saurabh Sinha, 201 N. Goodwin Ave, Department of Computer Science, University of Illinois Urbana-Champaign, Urbana, IL 61801, USA.

C The Author(s) 2021. Published by Oxford University Press on behalf of Nucleic Acids Research.
This is an Open Access article distributed under the terms of the Creative Commons Attribution-NonCommercial License
(http://creativecommons.org/licenses/by-nc/4.0/), which permits non-commercial re-use, distribution, and reproduction in any medium, provided the original work
is properly cited. For commercial re-use, please contact journals.permissions@oup.com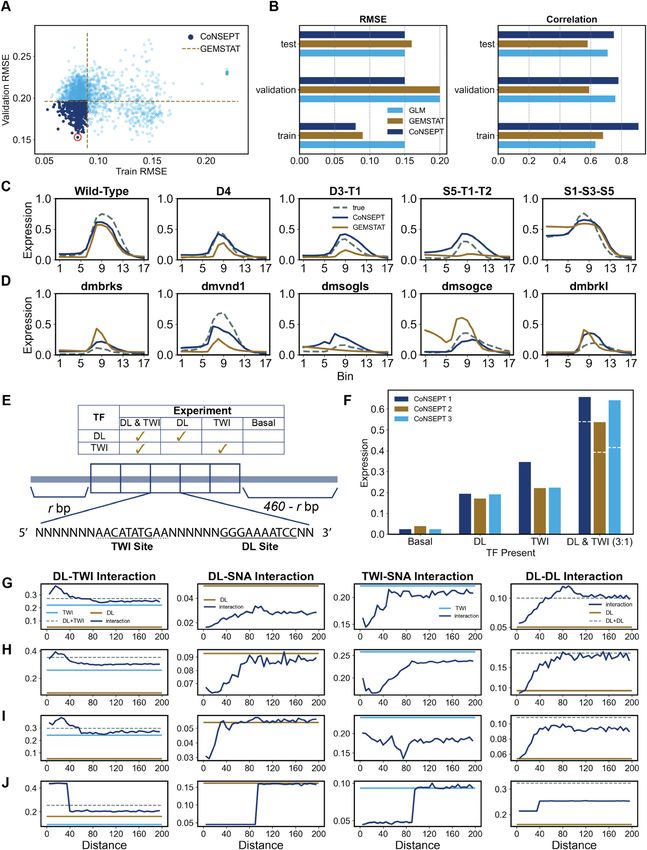
2 Nucleic Acids Research, 2021

quantitative model capable of predicting a given enhancer’s    DNA binding and epigenomic data (37–39), their utility
regulatory output in varying cellular conditions and the       for sequence-to-expression modeling remains to be demon-
effect of sequence variations such as disease-related non-     strated. This is partly because data sets with direct expres-
coding polymorphisms within the enhancer (16). Indeed,         sion measurements on enhancers (14,18,28) in diverse con-
such ‘sequence-to-expression models’ are an active area of     ditions are of relatively modest sizes and the models tend
research today (17).                                           to be heavily parameterized. Thus, the second major mo-
   The most direct efforts to deciphering the cis-regulatory   tivation of this study was to test if ML models and espe-
code of enhancers have been through experiments that           cially neural network models provide a practical alternative
record expression readouts of many variants of an enhancer     to thermodynamics-based models for enhancer sequence-

                                                                                                                                 Downloaded from https://academic.oup.com/nar/advance-article/doi/10.1093/nar/gkab765/6368530 by guest on 12 September 2021
(14,18) or many enhancers under similar control (12,19,20).    function relationships, and to assess their relative merits and
Often, the variants are synthetic constructs that manifest     weaknesses.
a diversity of TF binding site composition and arrange-           Motivated by the above considerations, we tested a
ment; in some cases, their functions (expression level) are    suite of quantitative models, including linear models,
determined in a single cellular context (12) while occasion-   thermodynamics-based models, and a newly developed
ally the expression readout is obtained in varying cellular    convolutional neural network (CNN) model, on a rich
contexts, for example, nuclei of the early Drosophila em-      sequence-expression data set previously reported by Sayal
bryo (5,20–22) or Ciona embryos. Such data sets are then       et al. (14). The data include expression measurements of
analyzed through a specialized mathematical model whose        an enhancer that drives expression of the rhomboid (rho)
structure incorporates mechanistic hypotheses and whose        gene in the Drosophila melanogaster embryo, along with
parameters represent quantitative details of those mecha-      several synthetic variants of the enhancer and several en-
nisms, such as activation strength and distance-dependence     dogenous enhancers with similar regulatory function. The
of cooperative and repressive interactions among binding       spatial expression patterns driven by these enhancers are
sites (17,18,21,23–27). The most effective frameworks for      known to be regulated by two activators, Dorsal (DL) and
such mathematical mechanistic modeling have been based         Twist (TWI) and one repressor, Snail (SNA) (4,14). Impor-
on equilibrium thermodynamics (14,28,29), although non-        tantly, the dataset not only represents variation of enhancer
equilibrium models have also been motivated and proposed       sequences, it also includes changes in cellular conditions.
(30–32).                                                          We used rigorous model comparisons and prior mecha-
   Different thermodynamics-based models implement reg-        nistic studies of this regulatory system to evaluate the suite
ulatory mechanisms in different ways. For example, some        of quantitative models. The thermodynamics-based mod-
models accord the activation by a TF exclusively to its        els we tested included two different activation mechanisms,
DNA-binding ability (18,25), while others (24,28) model        three repression mechanisms, and the presence or absence of
activation by additional free parameters (beyond those for     cooperative activation via proximal binding sites. We tested
TF-DNA binding) that explicitly represent long-range in-       linear and generalized linear models that combine binding
teractions between activators and the basal transcription      site contributions additively, as well as an extension where
machinery (BTM). Similarly, different models employ var-       pairwise TF interactions were allowed. Finally, we devel-
ious representations of short-range repression, for exam-      oped and tested a new neural network model for the expres-
ple, via quenching of a bound activator or mediating local     sion driven by a given enhancer sequence in varying cellular
chromatin remodeling through recruitment of co-repressors      conditions. This model, called ‘CoNSEPT’ (Convolutional
(18,21,25,28), and some even accommodate longer-range          Neural Network-based Sequence-to-Expression Prediction
repression via direct inhibitory interaction between the       Tool), utilizes user-provided DNA binding motifs and
bound repressor and BTM (28,33). Typically, an enhancer        condition- or cell type-specific concentrations of TFs, and
dataset is analyzed using a mathematical model with a pre-     can thus quantify the regulatory role of each TF. Impor-
determined structure (qualitative mechanisms) and its pa-      tantly, it learns salient rules of binding site arrangement in
rameters are tuned to fit the data. It is rare for the same    a purely data-driven manner, without presuming any par-
study to investigate models with varying assumptions about     ticular distance-dependence function of TF–TF interaction
regulatory mechanisms to determine those best supported        as is commonly done in thermodynamics-based models.
by the data. Here, we sought to bridge this gap by asking if      Our modeling shows that the three broad categories of
various existing formalisms differ in their ability to model   models are competitive with each other in terms of their
sequence-to-expression relationships.                          ability to fit the enhancer-expression data set. We found that
   In addition to thermodynamics-based models, statisti-       convolutional neural networks can be reliably trained on
cal and machine learning (ML) models have also pro-            relatively modest-sized training data and can learn aspects
vided useful quantitative descriptions of cis-regulatory en-   of cis-regulatory grammar in a fully data-driven manner. To
coding (34,35). Such models typically avoid strong pre-        our knowledge, this is the first demonstration of a CNN
conceptions about underlying mechanisms, providing a           predicting expression variation across sequences as well
‘data-driven’ approach to quantitative modeling of en-         as across conditions. Our thermodynamics-based modeling
hancers, as a counterpoint to the ‘hypothesis-driven’ ap-      showed that explicitly modeling the strength of activators
proach of thermodynamics-based models. Recently, Avsec         is advantageous compared to ascribing activator strength
et al. (36) trained a deep neural network model on TF–         solely to its DNA-binding, but that different biochemical
DNA binding data and showed how interrogating the              mechanisms of short-range repression cannot be reliably
trained model can reveal mechanistic insights. While neu-      distinguished based on the dataset. Both thermodynamics-
ral network models have been frequently applied to TF–         based and neural network models detected a significant role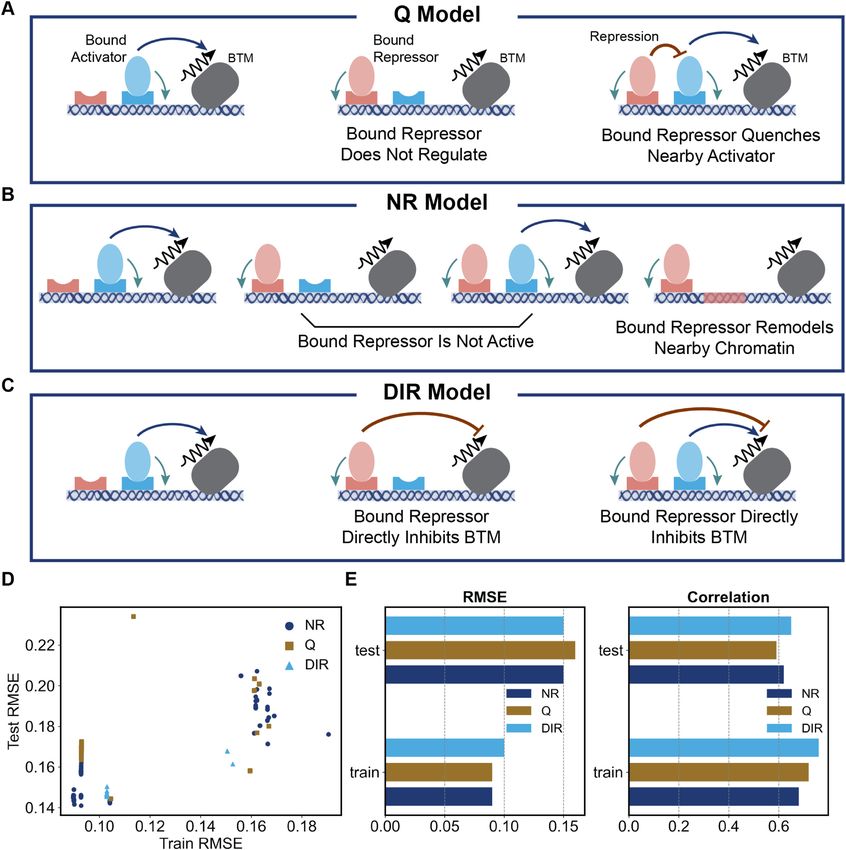
Nucleic Acids Research, 2021 3

for cooperative interaction between activator sites. Intrigu-        quadratic terms ([t]Ft )2 for each TF, this includes a term
ingly, both types of models suggested a potential role for a         for heterotypic cooperativity of DL and TWI, as suggested
direct repression mechanism that is not short-range, the pre-        in the literature (14,41), with a tunable weight UDL−TWI .
dominant theory of repressor action for this system. Our
baseline linear models showed good agreement with data
but were, by design, limited in offering mechanistic insights        GEMSTAT model
into the cis-regulatory code, including rules of binding site        We tested seven thermodynamics-based models named af-
arrangements and interactions. Overall, this work conveys a          ter their main mechanistic aspects, namely Activation by
positive outlook for the modeler, who has at their disposal a        Binding (AB), Activation by Potency (AP), repression by

                                                                                                                                                Downloaded from https://academic.oup.com/nar/advance-article/doi/10.1093/nar/gkab765/6368530 by guest on 12 September 2021
variety of tools of varying complexity with which to under-          Quenching (Q), repression by Neighborhood Remodel-
stand a regulatory system at the level of enhancer sequences.        ing (NR), Direct repression (DIR), Cooperative binding
                                                                     (COOP), and No Cooperative binding (NO-COOP) mod-
                                                                     els. All of the thermodynamics-based models explored in
MATERIALS AND METHODS                                                this work are implemented in GEMSTAT (28), except the
                                                                     AB model, for which the implementation of Sayal et al. was
Linear models                                                        used (14). Thermodynamics-based modeling of gene ex-
We tested three variants of linear models, viz., basic Linear        pression involves enumerating all ‘microstates’ (henceforth,
Model (LM), Generalized Linear Model (GLM) and Gen-                  states) of the enhancer under thermodynamic equilibrium.
                                                                     A state is defined as a configuration specifying the bound or
eralized Linear Model with Quadratic terms (GLMQ).                   non-bound status of each transcription factor binding site
                                                                     (TFBS). Therefore, an enhancer containing n TFBSs has
LM model. Expression (E) driven by an enhancer is a                  2n states. In GEMSTAT, for each of these states the Basal
weighted sum of contributions from TFs that bind to the              Transcriptional Machinery (BTM) may be in the bound or
enhancer:                                                            non-bound state, making 2n+1 states. We define ‘ON’ states
                                                                    of the system as those where BTM is bound; other states are
               E =      Wt [t] Ft + Wb                               called ‘OFF’ states. The expression driven by the enhancer
                             t∈T                                     is assumed proportional to the probability of the system be-
where T is the set of TFs, Wt is a TF-specific weight that           ing in ON state:

reflects its activating or repressive role and strength, Wb is a                                              s∈SON   Q (s)
‘basal’ expression parameter, [t] is the concentration of TF           Expr essi on ∝ Pr (ON state) =                                   (1)
                                                                                                      s∈SON Q (s) +     s∈SOF F   Q (s)
t, and Ft reflects the total binding site presence of t on the
enhancer, defined as:                                                where SON and SOF F denote the set of all ON and OFF
                                                                states of the enhancer, respectively, and Q(s) is the Boltz-
            Ft =      exp LLR (s) − LLR St,opt                       mann weight that prescribes the relative probability of state
                  s∈St                                               s in equilibrium. (The denominator is the partition func-
where St is the set of all putative binding sites of t in the en-    tion.) For simplicity, we set the constant of proportionality
hancer, St,opt represents the strongest possible binding site        in the above equation to 1.
of t and LLR(x) denotes the log likelihood score of site x,             The Boltzmann weight of state s, Q(s), is calculated as the
calculated using the given Position Weight Matrix (PWM)              product of terms representing each molecular interaction in
of t and a provided background nucleotide distribution.              that state; these interactions include TF–DNA interactions
This definition of site strength follows (40).                       at binding sites, BTM-DNA interaction at promoter, TF-
                                                                     BTM interactions representing activation or repression ef-
GLM model. Expression driven by an enhancer is a sig-                fects of TFs, and TF–TF interactions representing cooper-
moid function of the LM model:                                       ativity or antagonism between proximally DNA-bound TF
                                                                     pairs. See Supplementary Table S3 for the parameters used
                           1                                         in different GEMSTAT models in this study.
        E =
              1 + exp − t∈T Wt [t] Ft − Wb
                                                                     TF–DNA interaction. The weight (term contributed to
GLMQ model. This defines the total contribution of TFs               Q(s)) of a TF–DNA interaction at site s for a TF t is given
as a non-linear function of their concentration [t] multiplied       by:
by their site strength Ft and then applies a sigmoid function
                                                                           q (s, [t]) = [t] kt exp LLR (s) − LLR St,opt
to model saturation:
                                 1                                   where kt is a TF-specific free parameter that is learned from
                     E =                                           the data and other terms are as defined above.
                           1 + exp − Ê
                                                                   TF–BTM interaction. The weight (term contributed to
 Ê =         Wt [t] Ft +         Vt ([t]Ft )2 + UDL−TWI [DL][TWI]   Q(s)) of a TF–BTM interaction is a TF-specific positive
        t∈T                 t∈T                                      constant which is >1 for activators (making the ON state
        ×FDL FTWI + Wb                                               more favorable than corresponding OFF state) and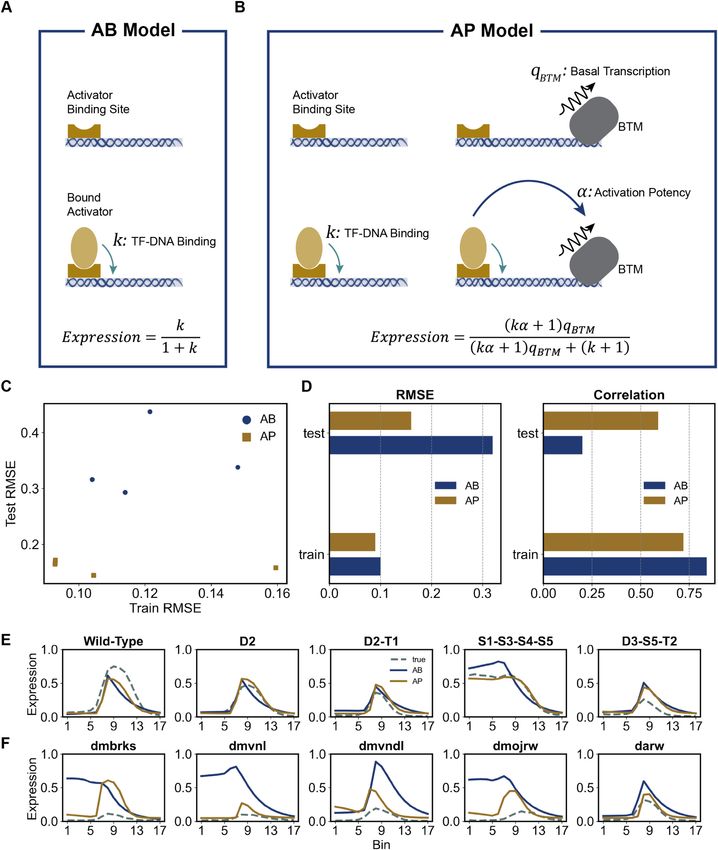
4 Nucleic Acids Research, 2021

long-range repression. We employed the GEMSTAT’s ‘lim-            overall state; a higher value of βr (>1) leads to lower frac-
ited contact’ scheme of activation, where at most one bound       tional occupancy of proximal activator sites, thus achieving
activator can interact with the BTM in any state.                 greater repression. In this study we used a range parame-
                                                                  ter of dr = 100 bp. A third alternative to the ‘Q’ and ‘NR’
TF–TF interactions. Any activator-activator or repressor-         mechanism is the ‘DIR’ (for ‘direct’ repression) mechanism,
repressor pair (i.e. DL–DL, TWI–TWI, SNA–SNA, DL–                 modeled by a repressor-BTM interaction regardless of dis-
TWI) bound within 50 bp of each other is modeled as inter-        tance of repressor binding site from a bound activator site,
acting, with the weight contributed to Q(s) being a learnable     thus making this a ‘long-range’ repression mechanism (28).
free parameter. Such interactions may be configured to be

                                                                                                                                               Downloaded from https://academic.oup.com/nar/advance-article/doi/10.1093/nar/gkab765/6368530 by guest on 12 September 2021
excluded from or included in the model, for example, when
comparing the ‘COOP’ and ‘NO-COOP’ settings of GEM-               CoNSEPT model
STAT. Separately, an activator-repressor pair (i.e. DL-SNA,       CoNSEPT (Convolutional Neural Network-based
TWI-SNA) bound within 100 bp of each other is modeled             Sequence-to-Expression Prediction Tool) is a neural
as interacting, with a learnable weight (≤1). Such interac-       network model that predicts the enhancer activity as a
tions represent short-range repression by quenching, fol-         function of enhancer sequence and TF concentration
lowing Sayal et al. (14), and may be configured to be ex-         levels. The model is parameterized by user-provided PWMs
cluded or included in the model.                                  (motifs) representing TF binding preferences.
   BTM-DNA interaction is modeled as a single learnable              First, the enhancer sequence (of length L) is scanned
parameter.                                                        with user-defined PWMs to score the presence of each mo-
                                                                  tif along the enhancer. The scanning module computes the
                                                                  complementary sequence (negative strand) of the input en-
Activation by Binding (AB) model                                  hancer and converts both strands into a one-hot encoded
                                                                  representation by replacing each nucleotide (A, C, G or T)
We used the implementation of Sayal et al. (14) for the AB        with a 4D vector as follows:
model. Here, the bound or non-bound status of the BTM is
not part of the state definition, and expression is assumed        A = [1, 0, 0, 0] , C = [0, 1, 0, 0] , G = [0, 0, 1, 0] , T = [0, 0, 0, 1]
proportional to the probability of states with at least one          User-defined PWMs are formatted into a set of K x 4 ma-
bound activator that is not repressed by a bound TF nearby.       trices, mt for each TF t, representing the probability of each
The Boltzmann weight of a state is defined as the prod-           nucleotide appearing at each position of the TF’s binding
uct of terms representing TF–DNA and TF–TF coopera-               site of length K. In this study, we used K = 10, and to do
tive interactions, defined as in GEMSTAT. Terms involving         so we had to expand the TWI and SNA PWMs we obtained
BTM interactions are not part of the model and in partic-         from Sayal et al. (14) by three and two bases, respectively,
ular TF–BTM interaction parameters that capture activat-          with a probability of 0.25 over A, C, G and T.
ing and repressive influences in the GEMSTAT model are               Both encoded strands are then scanned with each motif
not included. See (14) for details. We used the ‘binned’ in-      using a convolution operation:
teraction scheme of their model, using one bin and setting
the ranges for TF-TF interactions to match those of GEM-                                       t
                                                                                              b+ = S+ ∗ mt
STAT (50 bp for cooperative interactions, 100 bp for short-
range repression).                                                                         t
                                                                                          b− =∼ (∼ S− ∗ mt )
                                                                          t       t
                                                                  where b+  and b−  represent the binding score profiles of TF
Alternative repression mechanisms in GEMSTAT                      t on the positive and negative strands, respectively, S+ and
In the GEMSTAT model used for testing the AP mech-                S− denote the positive and negative encoded strands. More-
anism of activation, repression is modeled by short-range         over, ∼ (.) represents a ‘flip’ operation that reverses the se-
(≤100 bp) activator-repressor interactions (DL-SNA, TWI-          quence. The flip operation mimics how the negative strand is
SNA). This repression mechanism is referred to as ‘Q’             scanned for motif presence in previous work (14,25,26,28),
(for ‘quenching’). An alternative to this is the ‘Neighbor-       and as far as we know, this is the first time it has been in-
hood Remodeling’ (NR) mechanism of short-range repres-            cluded in a neural network model of sequence-function.
sion, where any repressor site may be in one of three pos-           Next, for each TF t, the positive and negative bind-
sible states (rather than two): ‘non-bound’, ‘bound-only’         ing score profiles, represented by an L̇ x 2 matrix ( L̇ =
and ‘bound-effective’ (28). In the bound-effective state, the     L − K + 1), are passed to a 2-dimensional max-pool layer
bound repressor modifies its neighborhood on the DNA              that extracts the strongest binding site score from the two
such that the neighboring chromatin becomes inaccessible          strands within a window of a certain width. Since we have
for other TFs to bind. This modification is assumed to oc-        three TFs (DL, TWI and SNA) in this study, this step gives
cur within a fixed distance dr from the bound repressor site.     us three L̈-dimensional vectors Bt , where L̈ < L̇ is the re-
States where a repressor site is in the ‘bound-effective’ state   duced length due to max-pooling. These vectors are then
and another site (for any TF) within dr distance is in the        integrated with the TFs’ concentration values to obtain ‘oc-
bound state are considered invalid. The ‘bound-only’ state        cupancy’ vectors Ft :
is akin to the usual ‘bound’ state of a site, with no restric-                                Ft = Bt × [t]
tions on possible states of neighboring sites. A site in the
bound-effective state contributes an additional factor βr (a      where Ft is the vector representing occupancy of TF t along
TF-specific free parameter) to the Boltzmann weight of the        the enhancer, [t] denotes the concentration of TF t in a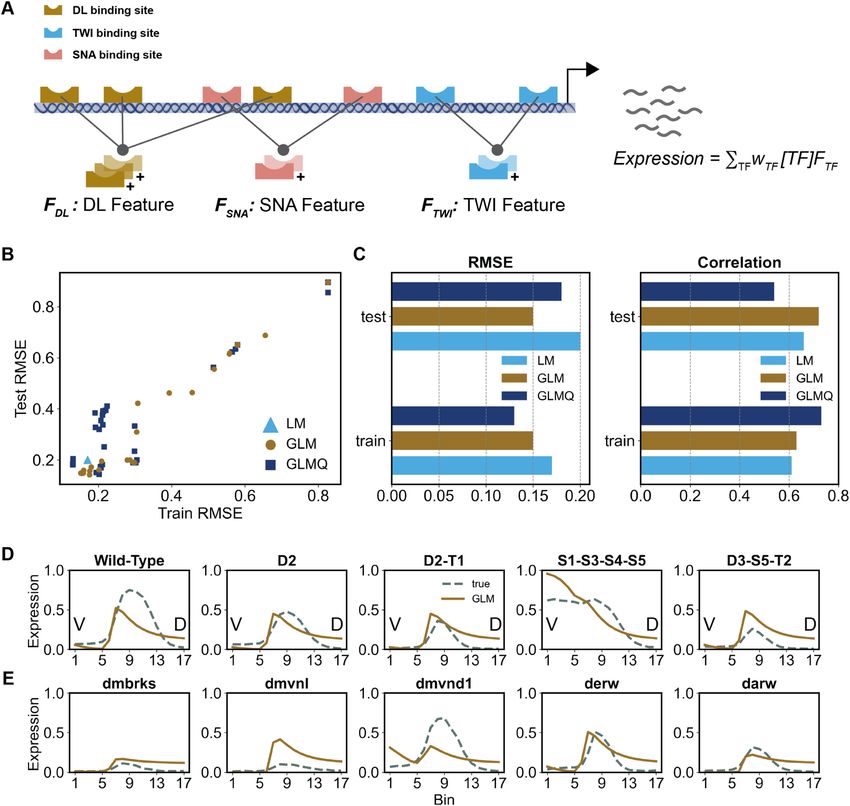
Nucleic Acids Research, 2021 5

particular cellular context, and ‘x’ represents element-wise         ×[T F ] : multiplication by TF concentration values to ob-
product.                                                              tain occupancy as described above
   Next, CoNSEPT incorporates user-specified prior                   Architecture:      BS − LN − Pγ ,δ − × [T F] − PFCα,α −
knowledge of TF-TF interactions. To this end, for a                   σ1 − {C Nk1 − σ1 − LN}c − DRp − P3,3 − FC − σ2
specified interacting pair, (t1 , t2 ), an L̈ x 2 ‘TF pair feature
matrix’ is constructed by stacking Ft1 and Ft2 . The specified          Above, {.} represents an optional block of convolutional
interactions may correspond to homotypic or heterotypic              kernels followed by activation and normalization and c de-
cooperativity or short-range repression. Each TF pair                notes the number of blocks used in the model. Note that for
feature matrix is passed to a separate 2-dimensional con-            c = 0, the additional convolutional layers inside the braces

                                                                                                                                            Downloaded from https://academic.oup.com/nar/advance-article/doi/10.1093/nar/gkab765/6368530 by guest on 12 September 2021
volutional kernel that moves along the enhancer length               are not used. In this study, we tested 2016 different mod-
and captures the                                                     els for various settings of γ , δ, α, σ1 , c, k1 , p, and σ2 and se-
                 ... short-range patterns in...occupancies,          lected the best model based on the performance on a valida-
producing an L-dimensional vector i ( L < L̈ is the
reduced length due to convolution):                                  tion data set. See Supplementary Table S4 for the parameter
                                                                   settings tested.
                    i = Fti,1 & Fti,2 ∗ Ki
where i corresponds to a specified TF-TF interaction be-             Training CoNSEPT
tween ti,1 and ti,2 , Ki denotes the convolution kernel for this
interaction and ‘&’ is the stacking operation. The                   To train a CoNSEPT model we find the settings of param-
                                                      ... outputs    eters θ that minimize the mean squared error between the
i of all convolutional kernels are stacked into a L x N ma-
trix , where N denotes the total number of user-defined             model output ( Ê) and the ground-truth expression (E) over
TF–TF interactions.                                                  the training data:
   In this study, we used DL–DL, TWI–TWI and SNA–
                                                                                                           1
                                                                                                              N
SNA interactions, consistent with the homotypic cooper-                                                                  2
                                                                                    θ = arg min                 Êi − Ei
ativities in COOP model, also DL–TWI interaction, con-                                                 θ   N
                                                                                                             i =1
sistent with the heterotypic cooperativity in COOP model,
and SNA–DL and SNA–TWI interactions, consistent with                 where N is the total number of training samples, each rep-
the short-range repressions in COOP model. The output of             resenting a different combination of enhancer and cellu-
the convolutional kernels, , is activated by a non-linear           lar context (bin along DV axis). For optimization, we em-
function. We also tested passing this activated output into          ployed a stochastic gradient descent algorithm using Adam
two additional convolutional layers with different num-              optimizer (44) for 1000 epochs and a batch size of 20. The
ber of kernels and activated by a non-linear function af-            learning rate of the gradient descent was scheduled to be
ter each layer to capture longer-range interactions. The ac-         decreased during the training. An ensemble of 2016 CoN-
tivated output of the last convolutional layer goes into a           SEPT models with different hyperparameter settings was
dropout layer that is widely used for regularizing neural net-       constructed and the optimal hyperparameter setting was se-
work models (42). We did not use dropout in the previous             lected based on training and validation set performances
layers to maintain any positional feature on the enhancer            (see the Results section).
that might contribute to short-range and long-range regu-
lations. The output of the dropout layer is passed to a non-
overlapping max-pool layer that extracts the strongest sig-          Synthetic constructs for evaluation of DL–TWI synergistic
nals. Finally, the output of this pooling layer is linearly com-     activation
bined through a fully connected layer and goes into a final          In order to guide the training of CoNSEPT models towards
activation function that outputs the expression value. For           capturing the cooperative activation by DL and TWI, we
this last activation function, we tested sigmoid and tanh            used data from Shirokawa et al. (41). We constructed a
functions suitably modified to ensure positive expression            DNA sequence mimicking that tested by Shirokawa et al.,
values upper-bounded by one.                                         consisting of a TWI and a DL binding site located 6bp apart
   We use the following naming conventions to fully demon-           on a construct of length 35 bp with the following sequence:
strate CoNSEPT’s architecture:
                                                                         5’ NNNNNNNAACATATGAANNNNNNGGGAAAATCCNN 3’
                                                                                      TWIbindingsite                DLbindingsite
B S: TF binding-site scanning module
P F Cα,β : Stacking of occupancy vector of each pair of                 where ‘N’ denotes a dummy base. The DL binding site
 TFs and passing the resulting TF pair feature matrix to             is slightly different than that used by Shirokawa et al. (41)
 a 2D convolutional kernel of size (α, 2) and stride (β, 2).         since we used the consensus DL binding site implied by the
 This unit generates the output  described above. In this           PWMs we obtained from Sayal et al. study (14). Also, the
 study we used α = β; i.e. non-overlapping convolution.              TWI site is four bp longer than that in Shirokawa et al. (41)
P γ ,δ : a max-pool layer of size γ and stride δ                     due to the padding of TWI PWM in our study.
CN k : a 1-dimensional convolutional layer with k kernels of            Similar to the experiments of Shirokawa et al. (41), we
 size 3 and stride 1.                                                next created a sequence with five consecutive repeats of the
F C : a fully connected layer                                        above block. Since CoNSEPT was trained on enhancers of
DR p : a dropout layer with probability of p                         length 635 bp (see Supplementary Note S2), we expanded
LN : a layer-normalization layer (43)                                this construct of length 175 to 635 bp by adding dummy
σ : an activation function                                           bases (‘N’) at both ends. To eliminate potential biases, we
6 Nucleic Acids Research, 2021

repeated this expansion with 80 different random distribu-        transcription factors (TFs): Dorsal (DL), Twist (TWI) and
tions of dummy bases at the two ends; therefore, we ob-           Snail (SNA). DL and TWI are known to activate and SNA
tained 80 different constructs of length 635 bp that only dif-    represses rho expression (4,14). Binding sites of these TFs in
fer in their distribution of dummy bases at the two ends.         the rho enhancer are well mapped and shown in Figure 1A.
   Next, we selected the hyper-parameter settings of CoN-         The expression levels of rho driven by the wild-type (WT)
SEPT with the highest validation set performance (referred        enhancer were measured by Sayal et al. as a function of
to as ‘best-validated’ CoNSEPT model) among the ensem-            cellular (nuclear) position along the ventral–dorsal (V–D)
ble of 2016 settings described above. Using these hyper-          axis of the embryo (Figure 1B), using reporter assays. The
parameter settings, we re-trained an ensemble of 200 CoN-         enhancer’s expression profile is quantitatively represented

                                                                                                                                     Downloaded from https://academic.oup.com/nar/advance-article/doi/10.1093/nar/gkab765/6368530 by guest on 12 September 2021
SEPT models on the training data with different random            by a 17-dimensional vector, where the 17 dimensions rep-
initializations of free parameters. We examined the predic-       resent uniformly spaced positions or ‘bins’ along the V-D
tion of each of these 200 trained models on the synthetic         axis from the ventral end to 40% of the V–D axis length.
constructs defined above, assuming DL and TWI concen-             Concentration profiles of the three TFs are also available,
trations in a 3:1 expression ratio (similar to that in exper-     as 17-dimensional vectors analogous to the enhancer ex-
iments of Shirokawa et al. (41)) as well as in the presence       pression profiles (Figure 1B). Moreover, similar expression
of only one of the TFs and a basal level in the absence of        profiles were generated for 37 synthetic variants of the WT
both TFs. For each model, the predicted expression val-           rho enhancer, where each variant was constructed by mu-
ues were averaged over the 80 constructs to obtain four ex-       tagenesis of one or multiple TF binding sites (Figure 1C).
pression values corresponding to the four conditions of TF        (Our nomenclature for the enhancers is different from that
presence/absence––Basal, DL, TWI, DL & TWI.                       of Sayal et al., see Supplementary Table S1.) Thus, the data
                                                                  set captures expression variation across different trans con-
Synthetic constructs for evaluation of distance-dependent in-     texts (cells at different V–D axis positions, with varying TF
teractions                                                        levels) as well as different cis contexts (WT enhancer and
                                                                  synthetic variants).
To characterize distance-dependent interactions learned by           Figure 1D reports on a selection of the synthetic en-
CoNSEPT models, we examined their predictions on ad-              hancers – those representing DL and/or TWI site deletions,
ditional synthetic constructs containing pairs of DL–TWI,         showing the difference in activation by each enhancer com-
DL–SNA, TWI–SNA or DL–DL binding sites at progres-                pared to the WT enhancer. Interestingly, deleting the two
sively increasing separations (from 5bp to 195bp), located at     sites with smallest individual effects (‘D3’ and ‘D4’) simul-
a random location in a 635 bp long sequence. Thus, a collec-      taneously has the largest effect among all variants. Two
tion of 3900 synthetic enhancers was tested, corresponding        other sites––‘D2’ and ‘T1’––individually have at least as
to 39 different inter-site spacings and 100 different locations   much contribution as D3 and D4 individually, but their si-
of the site pair in the enhancer. The TF binding sites were       multaneous deletion has a substantially smaller effect than
set to consensus sites of corresponding PWMs and the re-          the D3–D4 double deletion. This and other aspects of Fig-
maining bases of the enhancers were set to the dummy base         ure 1D suggest non-linear regulatory contributions (Figure
‘N’ (see above). It is worth mentioning that we did not eval-     1E) from sites in the rho enhancer, and present an interesting
uate TWI–TWI distance dependent interactions since the            challenge for current mathematical models of cis-regulatory
training enhancers contain a maximum of two binding sites         encoding: can existing models capture the subtle variations
for this TF (Figure 1A), potentially preventing the reliable      of function encoded in these variant enhancers, and if so,
learning of their distance-dependent interactions.                can they reveal new insights about the underlying regula-
   We used the trained CoNSEPT models to predict expres-          tory mechanisms?
sion driven by each synthetic construct with relative levels         To meet the above challenge, we trained diverse mathe-
of DL, TWI, and SNA set to of 0.4, 0.3 and 0.4 respectively       matical models that map TF concentration profiles and en-
(reflecting the sixth of the 17 ‘bins’ along the V-D axis; this   hancer sequence to the enhancer’s expression profile, for all
bin was selected as it represents the dorsal boundary of SNA      38 enhancers (WT and 37 variants, henceforth called the
expression; Figure 1B). For each TF pair at a specific inter-     ‘training set’) simultaneously. The accuracy, or ‘goodness-
site spacing, we averaged the predicted expression over all       of-fit’, of a model was measured by the root mean squared
100 constructs with different placements of the TF pair. We       error (RMSE) between predicted and real expression pro-
evaluated the GEMSTAT model (NR/COOP) on the same                 files along the V–D axis, over all enhancers; this is referred
constructs containing pairs of TFs; however, we replaced          to as the ‘train error’ below. The data set also includes ex-
the dummy bases ‘N’ with random draws from the set of             pression profiles of 13 other enhancers that have expres-
four nucleotides (A, C, G, and T) with equal probability.         sion profiles similar to rho (Supplementary Figure S1); these
                                                                  are orthologs of the rho enhancer from other Drosophila
RESULTS                                                           species or enhancers of other D. melanogaster genes with a
                                                                  neuroectodermal expression pattern similar to rho. We used
A gene expression data set with cis and trans variations
                                                                  these 13 enhancers, which represent greater sequence diver-
We analyzed a data set generated and first modeled by             sity than do the 38 enhancers in the ‘training set’ (above),
Sayal et al. (14). It includes expression levels driven by a      as the ‘test set’. The RMSE of a model on these enhancers
well-studied enhancer of the gene rhomboid (rho) (Figure          is referred to as ‘test error’ below. By fitting, evaluating and
1A, henceforth called the rho enhancer) in the early D.           comparing various models that differ in their explicit encod-
melanogaster embryo. This enhancer is regulated by three          ing of biophysical mechanisms, we hoped to draw inferences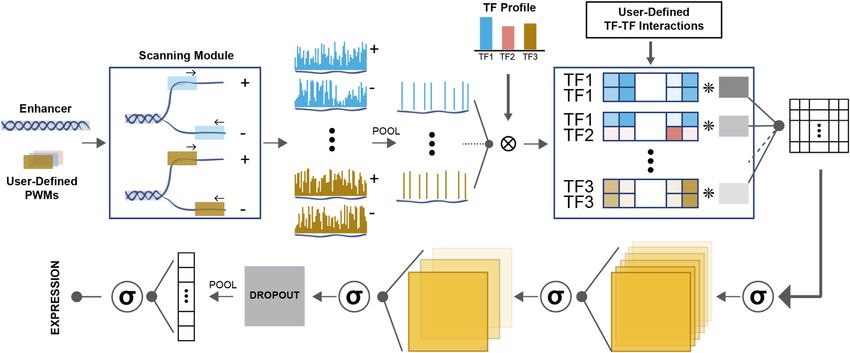
Nucleic Acids Research, 2021 7
Downloaded from https://academic.oup.com/nar/advance-article/doi/10.1093/nar/gkab765/6368530 by guest on 12 September 2021
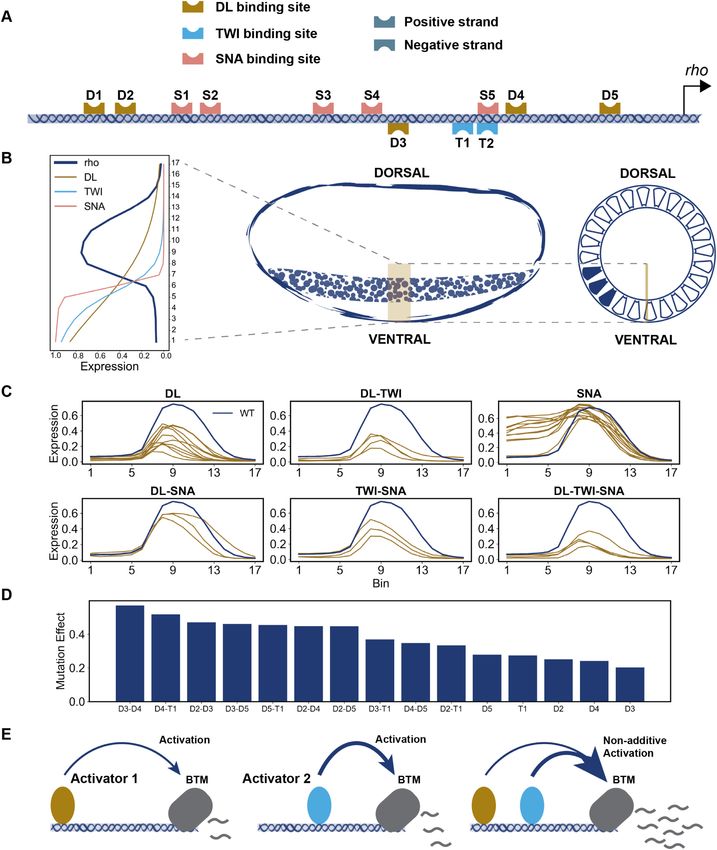
Figure 1. Overview of the data used in this study. (A) Schematic of the wild-type (WT) enhancer of the Drosophila rhomboid (rho) gene. Binding sites of the
three TFs were identified using the PWMs employed in (14). All annotated sites agree with those found in (14) and except for D1 and S2 all the sites match
with the in vitro footprinted sites characterized previously (14). (B) The levels of the three regulators and the expression of rho driven by the wild-type
enhancer in 17 equidistant points along 0–40% of ventral-dorsal (V-D) axis. (C) The expression of rho driven by perturbed enhancers (shown in brown)
representing mutagenesis of binding sites of one or more TFs. Each panel’s title denotes the TF(s) whose sites were mutagenized. (D) Each activator’s
site deletion (or combination thereof) is expected to reduce peak expression of rho (at bin 8 on the V–D axis); we therefore defined the effect of a variant
enhancer (Y-axis) as the difference between the expression driven by it and the wild-type expression at this position of the axis. The effect of T2 single site
deletion is not shown due to its overlap with the SNA site S5.(E) Schematic of synergistic activation, where the activation driven by two bound activators
(right) is greater than the sum of their individual activation effects (left and middle).8 Nucleic Acids Research, 2021
about specific mechanisms that are supported by the data eling TF cooperativity does not consider dependence of the
set. interactions on inter-site distances (2).
Linear models provide a good phenomenological baseline Thermodynamics-based models reveal biochemical mecha-
nisms
We first trained a linear model (LM) to assess the base-
line explanatory power of statistical models on the Sayal We next employed thermodynamics-based models of gene
et al. data set. In these models (35), expression driven expression (14,28) that explicitly incorporate biochemical
by an enhancer is the sum of contributions from all TFs mechanisms of gene regulation, including TF-DNA bind-
Downloaded from https://academic.oup.com/nar/advance-article/doi/10.1093/nar/gkab765/6368530 by guest on 12 September 2021
(Figure 2A). The contribution of a TF is the product of ing affinities, activation and repression mechanisms, syn-
the TF’s concentration, its binding site strength at the en- ergistic activity of multiple TFs, and distance-dependent
hancer estimated using its Position Weight Matrix (PWM) interactions between TFs bound at proximal sites. Differ-
(see Materials and Methods) and a tunable parameter ent models, representing different combinations of mech-
that represents the TF’s regulatory strength and direction anisms, were implemented as variations of the same
(activator/repressor). We also tested a generalized linear thermodynamics-based sequence-to-expression modeling
model (GLM) (23,45), where expression is a sigmoidal func- framework, called GEMSTAT (28). Evaluation of differ-
tion of the sum of TF contributions (see Materials and ent GEMSTAT model variations was performed with the
Methods), such that the response of a gene is less sensitive same parameter fitting techniques, and the compared mod-
to the concentration of its regulators at very low or high els typically shared many parameters, differing only in the
concentrations. Both LM and GLM have only one free pa- desired mechanistic aspect, making their comparison more
rameter per TF and are the simplest of the models evalu- controlled.
ated here. To impose our prior knowledge of TF roles, the
trainable weights for DL and TWI were restricted to posi- Activation mechanisms. We first examined and compared
tive values and the weight for SNA was restricted to negative two different activation mechanisms that have been imple-
values. For LM we computed the globally optimal parame- mented in past modeling studies. In both mechanisms, ac-
ters (on the training set) while for GLM an ensemble of 100 tivation is due to binding of activator TFs to the enhancer
models was trained. and stronger binding leads to greater activation. In one class
Figure 2B shows the train and test errors (RMSE) and of models, for example, that used by Sayal et al. in their orig-
correlation coefficient between real and predicted expres- inal analysis of the data set (14), the contribution of an acti-
sion profiles, for LM as well as the ensemble of GLM mod- vator binding site depends only on the binding affinity of the
els. The GLM model with the smallest train error (hence- site for its cognate TF and the TF’s concentration. (For now,
forth is referred to as ‘best-fit’ model) was selected from we ignore effects of other binding sites on this site’s contri-
the ensemble and its performance was compared against bution.) These two factors together determine the fractional
the LM model (Figure 2C). The GLM model clearly shows ‘occupancy’ of the site by the TF, and its contribution to
better fits than LM model in terms of error (RMSE) and expression depends solely on its occupancy. In the second
correlation on both train and test data sets. Examining its class of models, the site’s contribution additionally depends
predictions more closely (Figure 2D, E), we find that the on the particular TF’s ‘potency’, which may be different for
GLM model often correctly predicts the main features of different TFs. That is, two sites with the same fractional oc-
an enhancer’s readout, for example, location of expression cupancy by their respective TFs may contribute to the acti-
peak along the axis, but is also prone to predicting excessive vation to different extents. This adds additional freedom to
expression at the dorsal end, which is due to inaccurate es- the model, in the form of one extra tunable parameter per
timation of the basal transcription level (the intercept term TF. The mathematical formalisms of the two mechanisms
in the linear function). outlined here, called AB (Activation by Binding) and AP
The above models consider each enhancer as a ‘bag of (Activation with Potency), are illustrated in Figure 3A, B
sites’ (46) where multiple TFs and TF sites contribute ad- and explained in Materials and Methods.
ditively to the regulatory output. In an attempt to cap- We sought to determine if the AP and AB models dif-
ture any non-additive contributions from pairs of TFs, as fer in their ability to explain the data set. In the AP model,
is believed to arise from cooperative activity (11), we ex- an activator’s potency was modelled by stipulating an in-
tended the GLM model (‘GLMQ’) to include quadratic teraction between a DNA-bound activator and the basal
terms that represent products of TF concentrations (see transcriptional machinery (BTM), as in GEMSTAT. (This
Materials and Methods). Though the training RMSE im- interaction is represented by a single free parameter per
proved compared to GLM due to the additional parame- TF.) Other mechanistic details such as cooperative binding,
ters, the test RMSE and test correlation deteriorated sub- short-range repression, etc. are identical between the two
stantially (Figure 2C). Notably, GLMQ shows a negative models. For a rigorous comparison, we trained ensembles of
trained coefficient corresponding to DL-TWI interaction 100 AB models and 100 AP models on the train set of 38 en-
(see Supplementary Table S2 for trained parameters) which hancers and evaluated them on the test set of 13 enhancers.
contradicts the previous findings of the synergistic activity Figure 3C shows the accuracy of all models on train and test
between these two activators reported in literature (41). In sets and Figure 3D reports on the best-fit model (smallest
summary, cooperative interactions were not reliably learnt train error) in both ensembles. In Figure 3D we note that the
by simply adding quadratic terms to the generalized linear AP model achieves lower error on the training set, which is
model. This is not surprising, since this approach to mod- not surprising given that it has additional parameters (TF’sNucleic Acids Research, 2021 9
Downloaded from https://academic.oup.com/nar/advance-article/doi/10.1093/nar/gkab765/6368530 by guest on 12 September 2021
Figure 2. Linear and generalized linear models of gene expression. (A) Schematic representation of linear model (LM). Each TF’s ‘feature’ is obtained by
aggregating the strengths of all of its binding sites in the enhancer. Expression is modeled as the weighted (w) sum of all TF features multiplied by their
corresponding concentration profile ([.]). (B) Train and Test RMSE for LM and the ensemble of GLM (generalized linear model) and GLMQ (GLM with
quadratic terms) models. (C) RMSE and correlation scores of LM and best-fit (smallest train RMSE) GLM and GLMQ models in train and test data. (D)
Predictions of best-fit GLM model on select train enhancers (brown curves) shown versus true expressions (blue curves). Left-most panel corresponds to
the Wild-Type enhancer and the remaining panels correspond to perturbed enhancers titled by the site deletion they represent (e.g. ‘D2-T1’ corresponds
to simultaneous deletion of DL site D2 and TWI site T1). (E) Predictions of best-fit GLM model on select test enhancers (brown curves) shown versus
true expressions (blue curves).
potency and basal transcription level). More importantly, ing enhancers than the variation within the training set. The
it achieves a substantially lower error (RMSE of 0.16 ver- gap between training and test errors is much smaller for the
sus 0.32) and higher correlation (correlation of 0.59 versus AP model, which has more free parameters, which is con-
0.20) on the test set than the AB model, where the additional trary to what we would expect if the gap was primarily due
parameters do not confer an advantage. This performance to overfitting.
gap on test data is apparent at the ensemble level also (Fig- A few illustrative examples of our evaluations are shown
ure 3C), suggesting that it is not an artifact of the optimiza- in Figure 3E, F, where each panel compares AP and AB
tion step. For both models, the test error values are overall model predictions to the real expression profiles. While
higher than training error, but this is likely to be because the both models exhibit similar accuracy on training enhancers
test enhancers are biologically more distinct from the train- (Figure 3E), the AB model predicts ectopic expression in10 Nucleic Acids Research, 2021
Downloaded from https://academic.oup.com/nar/advance-article/doi/10.1093/nar/gkab765/6368530 by guest on 12 September 2021
Figure 3. Evaluations of activation mechanisms. (A) Schematic representation of AB model for an enhancer containing only one binding site for an activator
TF. Shown are the two possible configurations for this enhancer depending on whether the activator is bound or not. The statistical weights (relative
probabilities) of the two configurations are k (bound) and 1 (not bound), and expression is proportional to probability of the bound configuration. (B)
Schematic representation of AP model for an enhancer containing only one binding site for an activator TF. Shown are the four possible configurations for
this enhancer depending on whether the activator and the BTM are bound (or not). Expression is proportional to total probability of the two configurations
in which BTM is bound. (C) Train and Test RMSE for the ensemble of 100 AB and 100 AP models. (There is extensive overlap of models (points) in each
ensemble.) (D) RMSE and correlation scores of best-fit AB and AP models in train and test data. (E) Predictions of best-fit AB and AP models on select
train enhancers (solid curves) are shown along with true expression profiles (dashed curves). (F) Predictions of best-fit AB and AP models on select test
enhancers (solid curves) are shown along with true expression profiles (dashed curves).Nucleic Acids Research, 2021 11
the ventral region (bins 0–5) for test enhancers ‘dmbrks’ versus 0.68) on train enhancers while using the same num-
(D. melanogaster enhancer of gene brk) and ‘dmvnl’ (D. ber of free parameters. Moreover, correlation values on test
melanogaster enhancer of gene vn), while the AP model cor- enhancers are substantially better with the DIR model than
rectly predicts the neuroectodermal peak (bins 7–10) of ex- with the Q model. This suggests that in addition to short-
pression for all shown test enhancers (Figure 3F, Supple- range repression, SNA may have long-range repressive ef-
mentary Figure S2). In light of the above observations, we fect on transcription of rho. We revisit this hypothesis below
infer that the data set supports the AP model over the AB when we discuss the predictions of our Neural Network-
model, arguing for separate ‘potency’ for each activator TF, based model.
beyond its DNA-binding strength, as an important aspect
Downloaded from https://academic.oup.com/nar/advance-article/doi/10.1093/nar/gkab765/6368530 by guest on 12 September 2021
of the underlying activation mechanism. Cooperative activation mechanisms. An important mech-
anism studied in the context of enhancer function is that
Repression mechanisms. Previous studies have shown that of cooperative DNA binding by multiple TFs at proximally
SNA is a ‘short-range’ repressor whose effect is mediated located binding sites (2), which results in a synergistic ef-
by a co-repressor named CtBP (47,48). CtBP can bind to fect greater than the sum of the individual site contributions
histone deacetylases, which in turn causes DNA to wrap (11,41,51). To test if such effects are reflected in the data, we
around the histone more tightly and prevents nearby TFs compared a version of GEMSTAT that models cooperativ-
from binding to DNA (49,50). It implies that a DNA-bound ity between activators (‘COOP’ model, Figure 5B) with one
repressor co-bound with CtBP is likely to be the only re- that does not (‘NO-COOP’, Figure 5A). To implement co-
cruited TF within a small window (∼100 bp) around its operativity, GEMSTAT includes TF–TF interaction energy
binding site. Such a mechanism for short-range repression terms in configurations where two TFs are bound within a
is implemented in GEMSTAT (28), and we will refer to it as certain distance (set to 50 bp here) of each other. Such terms
‘neighborhood remodeling’ (‘NR’, Figure 4B) below. In this were presumed for DL–DL, TWI–TWI and DL–TWI inter-
model, the bound repressor makes the neighboring chro- actions, each represented by a free parameter, in the COOP
matin (within 100 bp in our tests) inaccessible for activa- model. (Both tested versions use the NR model for repres-
tors to bind at. An alternative formulation of short-range sion and include homotypic interaction for the repressor
repression is the ‘quenching’ mechanism (‘Q’, Figure 4A) SNA).
(14,18), which states that a bound repressor will diminish We trained ensembles of models for COOP and NO-
or ‘quench’ the effectiveness of an activator bound nearby; COOP separately. The best-trained COOP and NO-COOP
in the thermodynamic model this is achieved by a decreased models show train error of 0.09 and 0.11 and test error of
equilibrium probability of the configuration where both the 0.15 and 0.16 respectively (Figure 5C), thus providing some
activator and repressor are bound (see Materials and Meth- evidence in favor of the former. To tease apart their differ-
ods). We tested if the data set can discriminate between the ences further, we used a complementary evaluation metric:
NR and Q models of short-range repression using their im- the ability of trained models to predict the effects of activa-
plementations within the GEMSTAT framework. We also tor site deletions (Figure 1D). We defined a model’s ‘effect-
tested a model with so-called ‘direct’ repression (‘DIR’, Fig- error’ as the difference between the predicted effect of the
ure 4C), which, unlike NR and Q, is not a short-range mech- site deletion(s) represented by an enhancer and the real ef-
anism. Here, the regulatory effect of a bound repressor is fect captured in the data set. (Here, ‘effect’ is calculated in
due to interactions with the BTM (similar to how activa- the same way as in Figure 1D, that is, the difference in peak
tion is modeled in the AP model), and the binding site does expression between wild type and variant enhancer.) Fig-
not have to be within a short range of any activator bind- ure 5D compares the effect-error of the best-trained COOP
ing site for its repressive effect to materialize. Although lit- and NO-COOP models on each enhancer shown in Figure
erature evidence points to short-range repression by SNA 1D, where one or two activator sites in the wild type rho en-
(18), we considered it worthwhile to test the direct repres- hancer have been mutagenized. For all enhancers, the effect-
sion model as a simple phenomenological baseline against error in COOP is smaller or as low as that in NO-COOP. In
which more realistic short-range repression models may be particular, in the highlighted region where the effect-error
compared in light of the available data. DIR and NR are of the COOP model is relatively small (smaller than 0.1),
the least complex of the three models, modelling repression we note several enhancers where the NO-COOP model’s
using three free parameters for SNA (DNA-binding, repres- effect-error is substantially worse. These results support the
sion potency, and homotypic cooperativity), while Q uses hypothesis that cooperative DNA-binding at proximally lo-
four free parameters (see Materials and Methods). cated activator binding sites plays a significant role in regu-
Figure 4D compares the performance of trained ensem- latory function of the rho enhancer.
bles of NR, Q and DIR models and Figure 4E summarizes
the performance of the best-trained model in each ensem-
CoNSEPT: a neural network model of enhancer function
ble. We found both short-range repression models (NR and
Q) to yield comparable fits and predictive ability, with the For our final modeling of the data set, we implemented a
NR model being slightly better in terms of both correla- model called CoNSEPT (Convolutional Neural Network-
tion (0.62 versus 0.59) and RMSE (0.16 versus 0.15) on test based Sequence-to-Expression Prediction Tool), that can
enhancers (with one less free parameter than Q model). In- accommodate highly non-linear contributions of TF bind-
terestingly, predictions of the DIR model are as accurate as ing sites to overall enhancer function (Figure 6). Our pri-
NR––they show the same RMSE and better correlation on mary goal was to test if a convolutional neural network
test enhancers, and a significantly better correlation (0.76 (CNN) model, which does not explicitly incorporate known12 Nucleic Acids Research, 2021
Downloaded from https://academic.oup.com/nar/advance-article/doi/10.1093/nar/gkab765/6368530 by guest on 12 September 2021
Figure 4. Evaluations of repression mechanisms. (A) Schematic representation of Q model that employs short-range quenching repression mechanism. A
bound repressor diminishes the activity of nearby bound activators. (B) Schematic representation of NR model that employs short-range neighborhood
remodeling repression mechanism. A bound repressor can be in either active or inactive state. An inactive bound repressor does not interfere with the
binding of activators to nearby regions or with the activity of the nearby bound activators, while an active bound repressor prevents activators from binding
to nearby regions. Any configuration with an active bound repressor and an activator bound nearby is considered invalid. (C) Schematic representation of
DIR model that employs direct repression mechanism. A bound activator directly diminishes the activity of recruited BTM but does not interfere with the
binding of activators. (D) Train and Test RMSE for the ensemble of 6000 models for each of Q, NR and DIR models. (E) RMSE and correlation scores
of best-fit NR, Q and DIR models in train and test data.
rules of cis-regulatory encoding, can learn such rules (reg- to assess each TF’s presence at varying locations in the
ulatory mechanisms, including distance-dependent inter- enhancer, analogous but not identical to occupancy in
actions between sites) from the data. This tool first uses thermodynamics-based models (see Materials and Meth-
pre-determined TF motifs (PWMs) to scan both strands ods). Next, it assembles the presence scores of each TF pair
of an enhancer to identify putative binding sites and es- into a feature matrix, which is passed to a separate convo-
timate their strengths (‘PWM scores’). It then integrates lutional filter to capture short-range interactions between
these strengths with respective TF concentration values the TF pair. Outputs of these filters are aggregated andYou can also read