A synthesis of findings Victorian Climate Initiative - from the (VicCI) - Water and ...
←
→
Page content transcription
If your browser does not render page correctly, please read the page content below
A synthesis of findings
                   from the
Victorian Climate Initiative
                     (VicCI)

     http://www.bom.gov.au/research/projects/vicci/
ii
A synthesis of findings
          from the
Victorian Climate Initiative
           (VicCI)
A Synthesis of findings from the Victorian Climate Initiative (VicCI)

     The Victorian Climate Initiative (VicCI) is supported by funding through the Victorian Department of
     Environment, Land, Water and Planning (DELWP), in partnership with the Bureau of Meteorology (BoM) and
     the Commonwealth Scientific and Industrial Research Organisation (CSIRO). It is hosted at the Bureau of
     Meteorology. The role of the VicCI is to ensure that Victoria’s water policies and management decisions are
     effectively informed by earth systems and climate change science.
     For more information visit http://www.bom.gov.au/research/projects/vicci/

     Research Team
     Theme leaders: Bertrand Timbal (Theme 1), Harry Hendon (Theme 2), Marie Ekström (Theme 3).
     Contributing scientists (by organisation)
     Bureau of Meteorology: Sonya Fiddes, Harry Hendon, Pandora Hope, Eun-Pa Lim, Guo Liu, Jing-Jia Luo, Chris
     Lucas, Hanh Nguyen, Lawrie Rikus, Li Shi, Bertrand Timbal, Yang Wang, Mei Zhao.
     CSIRO: Janice Bathols, Francis Chiew, Marie Ekström, Guobin Fu, Dewi Kirono, Nicholas Potter, Jin Teng,
     Louise Wilson, Hongxing Zheng.
     Program Governance
     Steering Committee: Sharon Davis (chair; DELWP; formerly Graeme Turner), Graham Hawke (BoM; formerly
     Sue Barrell), Francis Chiew (CSIRO), Peter May (BoM).
     Program Management Committee: Peter May (chair; BoM), Michael Manton (independent expert), Rae Moran
     (independent expert), Lu Zhang (CSIRO), Geoff Steendam (DELWP), Grace Mitchell (DELWP; formerly Sabine
     Schreiber), Bertrand Timbal (BoM), Harry Hendon (BoM), Marie Ekström (CSIRO).

     Citation: Hope, P, Timbal, B, Hendon, H, Ekström, M, Potter, N. 2017. A synthesis of findings from the Victorian
     Climate Initiative (VicCI). Bureau of Meteorology, 56pp, Australia.
     Enquiries regarding this report should be addressed to:
     Pandora Hope
     Bureau of Meteorology
     pandora.hope@bom.gov.au

     Published July 2017
     This report is available for download from http://www.bom.gov.au/research/projects/vicci/
     Cover photo credit: MacKenzie Falls, Grampians. iStock
     Report Production
     Technical Edit: Bloom Communication (Karen Pearce)

     Copyright © Bureau of Meteorology 2017

     A synthesis of findings from the Victorian Climate Initiative (VicCI) is licensed by the Bureau of Meteorology for
     use under a Creative Commons Attribution 4.0 Australia licence. For licence conditions see
     https://creativecommons.org/licenses/by/4.0/

     Important disclaimer
     The Victorian Climate Initiative (VicCI) partners advise that the information contained in this publication comprises general
     statements based on scientific research.The reader is advised and needs to be aware that such information may be incomplete or
     unable to be used in some situations. No reliance on or actions based upon this information must therefore be made without seeking
     prior expert professional, scientific and technical advice. To the extent permitted by law, VicCI (including its host organisation,
     employees, partners and consultants) excludes all liability to any person for any consequences, including but not limited to all
     losses, damages, costs, expenses and any other compensation, arising directly or indirectly from using this publication (in part or
     in whole) and any information or material contained in it.

iv
A synthesis of findings from the Victorian
Climate Initiative (VicCI)

Contents
About the Victorian Climate Initiative                                                  vii
Summary of key program findings and implications                                        viii
1. Learning from the past: observed climate and streamflow variability and change        1
   Observed Victorian climate variability and change                                     1
   Implications for water availability                                                   3
2. Understanding climate variability and change                                          7
   Weather systems of relevance to Victorian rainfall                                    8
   Large-scale modes of climate variability – ENSO, IOD and SAM                          9
   Text Box 1: The Interdecadal Pacific Oscillation and its impacts                  10-11
   The mean meridional circulation, including the Hadley circulation                    12
3. The climate models underpinning climate science for Victoria                         17
   Text Box 2: Projecting runoff for a warmer future under climate change            18-19
   Improving climate models                                                             20
   Evaluation of climate models                                                         20
   Projections from climate models                                                      24
4. Victorian climate in the coming season: predictions and predictability              29
   Predictability of Victorian climate                                                 30
   Decadal variation in Victoria’s climate and predictability                          32
   Progress in seasonal climate prediction                                             33
5. Looking to the future: planning Victorian water supply through the 21st century     37
   Victoria’s runoff, and planning for the future                                      37
   Downscaling climate change signals to catchment scale                               38
   Making use of Victorian runoff projections                                          44
6. Directions for future research                                                      47
   Improved understanding of current climate                                           47
   Seasonal climate prediction                                                         48
   Future projections                                                                  48
Glossary                                                                               51
References                                                                             53

                                                                                               v
vi
About the Victorian Climate Initiative
Victoria experiences a highly variable climate, with large variations in rainfall and
streamflow from year-to-year and on longer timescales. A drier climate is projected as a
likely response to increased greenhouse gases. However, much uncertainty still remains
about the causes, prediction and projection of variations and changes in regional
climate and their impacts on water resources over timescales of weeks to decades and
beyond.

The Victorian Climate Initiative (VicCI) was a three-year regional research initiative designed to further develop
our understanding and prediction of climate impacts on water availability to better inform water managers.
Specifically, the research aimed to improve:

1. Understanding of past climate variability and change in Victoria

2. Seasonal climate prediction for Victoria

3. Understanding of future climate and the associated risks to water resources in Victoria.

The VicCI program was launched in May 2013 by the Victorian Department of Environment, Land, Water and
Planning (DELWP) with research partners the Bureau of Meteorology and the Commonwealth Scientific and
Industrial Research Organisation (CSIRO). Research in the program concluded in June 2016.

This synthesis report highlights the key research outcomes and implications for the water sector in Victoria.
These are organised around the observation of the climate (Chapter 1), the understanding of physical processes
(Chapter 2) and their representation in climate models (Chapter 3). In Chapter 4, new understanding about
predictions for the coming season is described while in Chapter 5 improvements to the methods used to derive
future runoff projections across the state are detailed.

Readers who want a more detailed picture of the VicCI science are referred to the annual reports1,2, 3 and two
further reports focusing on the climate change science and its relevance to Victoria4 and future runoff projections
for Victoria5.

                                                                                                                      vii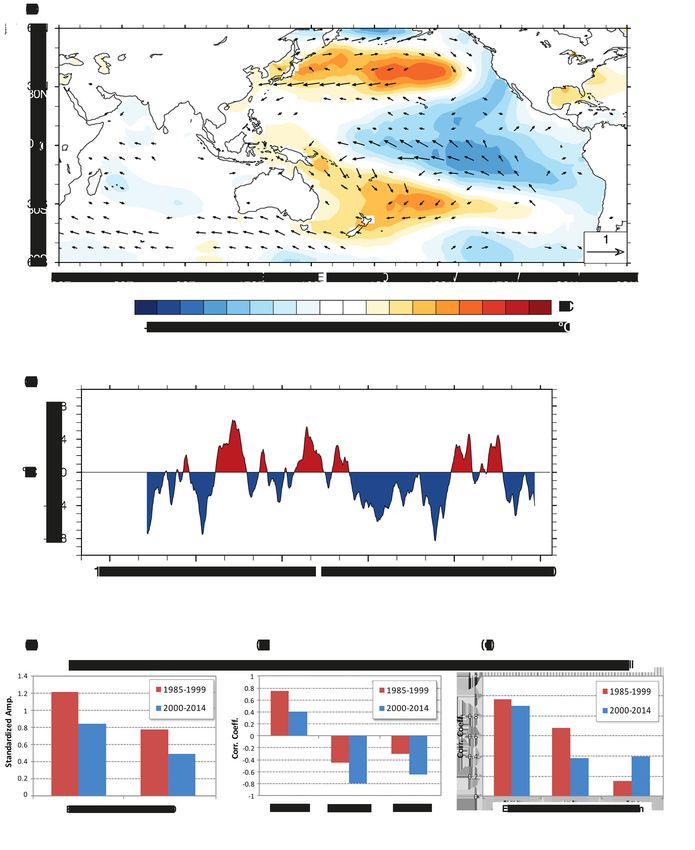
A Synthesis of findings from the Victorian Climate Initiative (VicCI)

       Summary of key program findings and implications
       • Since the turn of the 21st century, Victorian cool season (April to October) rainfall has continued to average
         about 15 per cent less than last century. This decline is likely to persist and possibly intensify in the longer
         term, and will occur more evenly across the whole cool season rather than primarily in the early part, as
         was the case during the Millennium Drought. This change is associated with changes in the global-scale
         circulation, which are at least partly attributable to anthropogenic influences.

       • Streamflows have reduced significantly in response to the cool season rainfall reduction, with reductions in
         rainfall being amplified in the streamflow response. As the downward trend in cool season rainfall is likely to
         continue, a less reliable filling season is likely.

       • The impacts of the cool season rainfall deficit on streamflows may be partially offset by a possible increase in
         warm season rainfall (particularly in northern Victoria) due to an expansion of tropical influences (resulting from
         an expanding Hadley cell and an upwards trend in an index of the Southern Annular Mode). Any increase in
         warm season rainfall is only expected to partially offset cool season reductions because rainfall during the
         warmer season does not usually generate sustained streamflows.

       • In light of the reductions in cool season rainfall over the past 20 years, it is considered likely that the recent
         decades provide a better representation of current climate than does the full historical record extending back
         over the 20th century. This should be a consideration in the evaluation of current and expected future water
         supply system performance.

       • In any one season or year, the impacts of these longer term changes may be intensified or offset by the joint
         state of key drivers of year-to-year climate variability, specifically El Niño – Southern Oscillation (ENSO: El
         Niño and La Niña) and the Indian Ocean Dipole (IOD), with the Southern Annular Mode (SAM) also having an
         impact.

                            Large-scale climate modes and their influence on Victorian rainfall

         La Niña (unusually warm tropical waters to Australia’s north and north east) generally brings wet
         conditions to south-east Australia.
         El Niño is often associated with drier conditions.
         Negative IOD (unusually warm tropical waters to Australia’s north and north west) is often associated
         with wetter than average conditions for Victoria.
         Positive IOD generally brings drier conditions.
         High SAM (higher pressures over southern Australia, and anomalous easterly winds) often brings dry
         conditions to Victoria in winter, but wet in other seasons.
         Low SAM is often associated with wet conditions across Victoria in winter, but dry conditions in spring
         and summer.

viii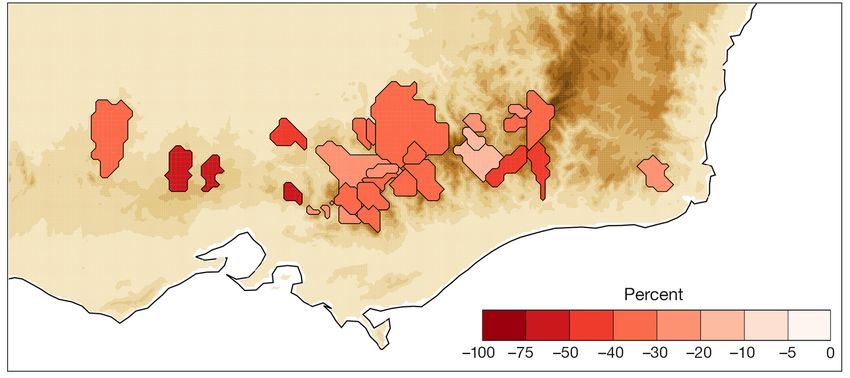
A Synthesis of findings from the Victorian Climate Initiative (VicVI)

• In making short-term assessments of water availability, water managers should consider seasonal forecasts
  (and associated forecast skill), which naturally synthesise the impacts of these drivers and their interaction
  with regional climate. Background knowledge of the state of ENSO will also assist in providing general
  guidance on the climate state from winter through summer, and the IOD from winter through spring.

• Decadal and multi-decadal variations of climate associated with the Interdecadal Pacific Oscillation (IPO)
  affect both the mean climate of Victoria and its variability. The IPO is naturally occurring and describes the
  episodic flip-flopping of conditions in the tropical Pacific between a cold phase, which is La Niña-like, and
  warm phase, which is El Niño-like, with each state lasting ~5-20 years.

• While the IPO is in its cold phase, as was the case from the late 1990s through 2015, there is an elevated
  spring/summer flood risk in Victoria during La Niña and negative IOD because of the stronger linkages of
  ENSO and the IOD with Victorian rainfall. However, during the cold phase of the IPO, the likelihood of a
  positive IOD (dry in Victoria) co-occurring with a La Niña event, as occurred during the Millennium Drought,
  is also increased, meaning that the large increase in rainfall normally expected during La Niña might not
  eventuate. However, actual impacts will depend on whether the status of ENSO, IOD and SAM act to
  reinforce or offset each other.

• The IPO phase affects seasonal predictability as well, with the IPO warm phase promoting longer lead
  prediction of the occurrence of ENSO and the IOD but reduced predictability of Victorian rainfall because of
  weakened teleconnections. Water managers could therefore benefit from monitoring the state of the IPO as
  well as predictions of ENSO and the IOD.

• Forecasting across the autumn period has historically been a ‘predictability barrier’. The Bureau’s new
  seasonal forecasting model (ACCESS-S1) shows promise in improving forecasts across this barrier. Improved
  forecasts from ACCESS-S1, which will potentially be of use to water managers for improving short-term
  outlooks for winter filling, will become available late in 2017.

• VicCI research shows that in broad terms, the range in projected runoff using information from the latest
  generation of global climate models (GCMs) is similar in magnitude to those from earlier models. Future
  runoff and streamflow in Victoria is likely to decline, driven by projected declines in future rainfall (particularly
  cool season rainfall when most of the runoff occurs) and higher potential evapotranspiration. However, there
  is a wide range in the projections. The better performing models tend to project a drier future than the full
  ensemble of models.

• Given the range of plausible outcomes in terms of runoff, users of VicCI runoff projections should adopt a
  scenario-based approach to planning. This means that water resource managers need to ensure that their
  planning and management processes are robust and adaptive across a wide range of future climate, runoff
  and streamflow scenarios and are subject to regular review.

                                                                                                                            ix
1. Learning from the past: observed climate
and streamflow variability and change
Key findings
• During the cool part of the year (April to October), as of 2016, Victoria had just experienced its warmest
and driest 30-year period in the instrumental record. This period captures important variability including
the Millennium Drought and the high rainfall in 2010–12. The dry conditions were in part due to increasing
greenhouse gas concentrations, so they may be indicative of a longer-term change.
• Streamflows have been among the lowest on record over the past twenty years, with major catchments
across the state experiencing declines in streamflow ranging from 25% to 75%, relative to the period 1975-
1997.
Implications
• In the light of the reductions in cool season rainfall over the past 30 years, it is considered likely that
the recent decades provide a better representation of current climate than does the full historical record
extending back over the 20th century.
Observed Victorian climate variability and change
While Victorian rainfall is historically highly variable, it has shown a marked reduction over the past 30 years,
driven primarily by a reduction in the cool-season (April to October) rainfall (Figure 1.1). In contrast, there has
been an increase in rainfall in some parts of the state during the warm season (November to March). A
reduction in the cool-season rainfall was a characteristic of the Millennium Drought (from 1997 to 2009)6. This
has persisted since the break of the drought in 2010 through to 2015 (the end date of VicCI data analysis). Overlying
this recent trend, strong year-to-year variability continues to be a feature of Victorian climate with occasional
extremely wet years such as occurred in 2010 and most recently in 2016.
Figure 1.1: Victorian rainfall deciles for Australia for the last 30 years (1986-2015) for (a) the warm season (November
to March) and (b) the cool season (April to October).
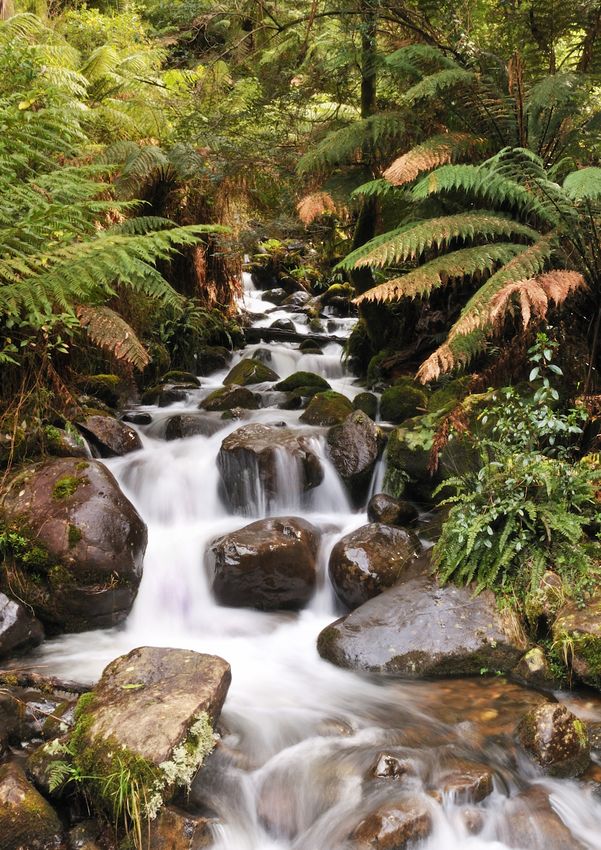
Left: Cement Creek, Warburton.
1A Synthesis of findings from the Victorian Climate Initiative (VicCI)
Temperatures across Victoria have continued to increase (Figure 1.2) as have global temperatures (black line
in Figure 1.2)7. Victoria experienced its hottest year on record in 2014, its eighth hottest year in 2015 and
sixth hottest year in 2016. These years have contributed to an acceleration of the warming trend in Victoria,
particularly during the warm part of the year (for both day time and night time temperatures). During the cool
part of the year, day time temperatures have risen, but there is no significant upward trend in night time
temperatures. This is likely due to the reduction in rainfall since the mid-1990s, and hence reduced cloudiness,
which allows for greater night time heat loss from the surface.
Figure 1.2: Annual Victorian mean air temperature anomalies (in °C) (relative to the 1911 to 2015 average. The black
line shows an 11-year running mean of global average temperature anomalies (relative to the 1961–1990 average).
Changes in mean sea-level pressure (MSLP) are useful for understanding recent rainfall changes. The mean
winter MSLP has had a strong upward trend across southern Australia since 1980 (Figure 1.3). A measure of
the local belt of high pressure, the subtropical ridge (characterised in the Australian region by the intensity and
position of the subtropical belt of high pressure around 150°E), is a significant indicator of Victoria’s rainfall,
especially in the cool season8. During the cool season, trends in MSLP suggest a stronger subtropical ridge
building in the Bight south-west of Victoria, extending across most of the continent including in the eastern
coastal area. This strengthening of the subtropical ridge, which promotes increased air subsidence and deflects
rain-bearing weather systems southward, is conducive to a drying pattern across south-east Australia including
Victoria.
21. Learning from the past: observed climate and streamflow variability and change
Figure 1.3 Trend in winter mean sea-level pressure from 1980 to 2016 (Pa/year).
Implications for water availability
Historically, the cool season provides most of the runoff to Victoria’s rivers. Hence, the recent decline in cool
season rainfall has led to reduced streamflows in major river systems. The Millennium Drought was broken in
the years between 2010 and 20129. High rainfalls resulted in extensive floods in many parts of the State and
streamflows were markedly above the long-term average. However, during 2013-2015 streamflow returned
to levels similar to those recorded during the Millennium Drought.
As an example of how unusually dry the last few decades have been, the total inflows to the Melbourne Water
supply systems from 1996 to 2015 were the lowest 20-year inflows on record, with a reduction of 25% relative
to the historical record going back more than 100 years. Similarly, River Murray inflows over 1996-2015 have
also been the lowest on record at 35% of the long-term average. Overall, declines in streamflow across Victoria
for the period March 1997 to February 2014 compared to March 1975 to February 1997 vary between 25%
and 75% reduction (Figure 1.4), with the largest declines experienced across the western part of the State (as
estimated using the Bureau of Meteorology Hydrologic Reference Stations10 for unregulated catchments with
minimal land use change).
Streamflow typically reduces by around two or three times the percentage reduction in rainfall, and, indeed
VicCI research has shown proportionally larger declines in streamflow than in rainfall in many catchments since
1997. However, in some locations the magnitude of the streamflow decline was larger than expected. The
South Eastern Australian Climate Initiative (SEACI) and other research11 has identified some potential
contributing factors to this larger than expected decline, including the proportionally higher reduction in
autumn and winter rainfall (which in turn has high impact on runoff since most of Victoria’s runoff occurs in
the winter months), changes in the daily rainfall distribution and rainfall sequencing, the lack of high rainfall
years and higher temperature increasing potential evaporation. However, the reasons are still not fully
understood and this is an area for further research.
3A Synthesis of findings from the Victorian Climate Initiative (VicCI)
Figure 1.4: Average change in streamflow for 1997–2014 compared to 1975–1997 at (a) gauge locations and (b)
averaged across climatologically different parts of the state. The greatest reduction (around 60%) was seen in
West Victoria.
45
A Synthesis of findings from the Victorian Climate Initiative (VicCI)

6
2. Understanding climate variability
and change
Key findings
• The key modes of climate variability that affect Victorian rainfall are the El Niño–Southern Oscillation (ENSO),
Indian Ocean Dipole (IOD) and Southern Annular Mode (SAM).
• The dominant impact of ENSO and the IOD on rainfall is during winter/spring, although strong ENSO events
may also have an impact on summer rainfall.
• SAM has different impacts in different seasons, with high SAM being associated with winter drying but a
wetter spring/summer. Expected positive trends in SAM resulting from global warming are expected to result
in drier winter and wetter summer seasons.
• The large-scale circulation affecting Victorian climate has been changing over the last 50 years due to
anthropogenic forcing (human induced, such as fossil-fuel burning) and natural fluctuations. The Hadley
circulation has been expanding, the subtropical ridge has been strengthening, and the storm track has been
shifting poleward.
• During the cool season, the changes associated with a strengthening subtropical ridge and poleward shift
of the storm track contribute to the observed decline in rainfall. The long-term decline of cool season rainfall
associated with these changes in large-scale circulation is likely to continue.
• During summer, the changes primarily associated with an expanded Hadley circulation bring wetter conditions
to Victoria.
• The expansion of the Hadley circulation is linked to global warming. However, the recent enhanced expansion
in the Australian sector (compared to the American and African sectors) is linked to the cold phase of the
Interdecadal Pacific Oscillation (IPO). When the IPO shifts to its warm phase the extra expansion in the
Australian sector may reduce.
Implications
• The downward trend in cool season rainfall is likely to continue, resulting in reduced runoff and a less reliable
water storage filling season. However, future trends in warm season rainfall are less clear. Positive trends
in SAM and expansion of the Hadley circulation are linked to higher warm seasonal rainfall. Positive SAM
trends are likely to continue, however, the current expansion of the Hadley circulation may decrease when the
phase of the IPO changes. It is therefore not yet clear to what extent warm season rainfall increases might be
expected in the future, and whether they will help offset the decline in cool season rainfall.
• The status of the key climate drivers (ENSO, IOD and SAM) and associated trends, provides some guidance
to short- to medium-term outlooks of water availability. Background knowledge of the state of ENSO can
assist by anticipating a persistence of the rainfall anomalies from winter through summer, while the status of
the IOD provides information from winter through spring. SAM, which largely fluctuates independent of ENSO
and the IOD, can act to enhance or offset the impacts of ENSO and IOD.
• Years with extremely low or extremely high rainfall will continue to occur episodically because of the behaviour
of ENSO, the SAM and the IOD in conjunction with longer-term trends.
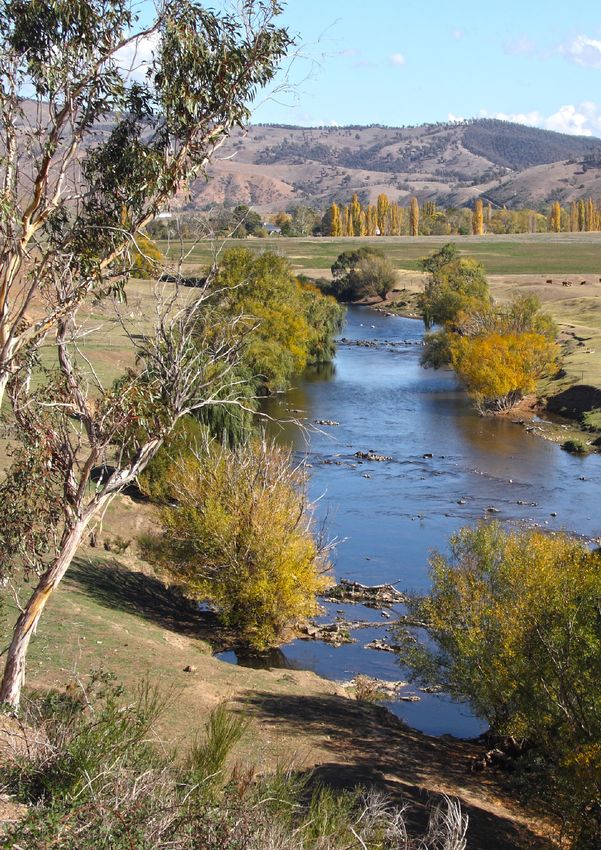
Left: Lake Eildon
7A Synthesis of findings from the Victorian Climate Initiative (VicCI)
Weather systems of relevance to Victorian rainfall
Many different weather systems generate rainfall across Victoria, such as the west to east passage of low
pressure frontal systems embedded within the mid-latitude storm tracks (Figure 2.1). The path of these low
pressure frontal systems is influenced by the local subtropical ridge. During the warmer half of the year
(November to April), the subtropical ridge is generally located to the south of the continent. In autumn, the
subtropical ridge moves northward and remains over the Australian continent for most of the colder half of the
year (May to October). The low-pressure frontal systems tend to occur predominantly south of the subtropical
ridge, bringing good rainfall to south-west Victoria. The low pressure centre associated with these systems
can also become separated from the westerly storm track (known as ‘cut-off lows’) bringing large rainfall totals
across most of southern Australia. “Cut-off lows” are a particularly important source of rainfall for the Murray
Basin. On the Australian east coast, lows can sometimes form over the Tasman Sea. These systems are
commonly referred to as east coast lows and are associated with heavy rainfall events in south-east Victoria.
Figure 2.1: Large-scale climate features of relevance to local climate in Victoria. Thick arrows show the influence
each climate mode has upon either synoptic weather types affecting Victoria or another climate mode. Thin arrows
indicate wind directions associated with certain synoptic weather types. Other features are discussed in this report.
82. Understanding climate variability and change
Large-scale modes of climate variability – ENSO, IOD and SAM
A large part of the naturally occurring variability in weather and climate is random and unpredictable on
timescales longer than a few days. However, some longer-term variations in the climate at interannual to
decadal timescales occur in response to variations of key modes of climate variability. Of primary importance
to Victorian climate, ENSO and the IOD12 are two key modes of variability associated with changes in sea
surface temperatures in the tropical Pacific and Indian Oceans, respectively. The primary mode of variability of
extratropical circulation is the SAM13, which is associated with north-south shifts of the jet stream to the south of
Victoria. Victoria’s climate is modified by these modes as they collectively influence the local weather
(Figure 2.1), so they are often referred to as ‘drivers’. The importance of these drivers is that they are a source
of predictability of climate on seasonal-interannual timescales (e.g., resulting from predictability of ENSO and
the IOD) and forced changes in climate will project onto these drivers (e.g.,Antarctic stratospheric ozone
depletion acts to drive SAM to its high phase). Thus, understanding how these drivers affect Victorian climate
and how these modes ofvariability will respond to climate change can shed light onto future predictability of
Victorian climate.
The impacts of ENSO and the IOD are felt primarily in Victoria during winter and spring; however, impacts from
strong ENSO events can carry over into summer. Rainfall typically decreases during El Niño and positive IOD
events and increases during La Niña and negative IOD events. Positive IOD and El Niño events tend to co-occur
as do La Niña and negative IOD events, so they often act together to affect Victorian rainfall. A tripole index of
sea surface temperature, which is defined by the areal-average sea surface temperature to the north of Australia
minus the mean of the sea surface temperature in the eastern tropical Indian Ocean and western tropical Pacific,
is a useful measure to capture the total effect of ENSO and IOD sea surface temperature variations on Victorian
rainfall.
These interannual variations associated with ENSO and the IOD are affected on decadal timescales by a pattern
of Pacific climate variability referred to as the Interdecadal Pacific Oscillation (IPO, see Text Box 1, page 10).
During the cold phase of the IPO (which is La Niña-like), there is increased tendency for positive IOD events to
occur in conjunction with La Niña, mitigating the expected increase in rainfall associated with La Niña.
The SAM varies on a timescale of around 10 days, but exhibits strong intraseasonal-interannual variations
while also displaying underlying upward long-term trends. SAM in its high phase typically decreases winter
Victorian rainfall because it shifts storms southward, away from Victoria. In contrast, high SAM during summer
typically increases rainfall because the subtropical dry zone shifts poleward, resulting in an expanded tropical
wet zone and increased easterly onshore flow (see Figure 3.3d).
Observed changes in rainfall across Victoria from 1986 to 2015 demonstrate the significance of the large-scale
drivers for Victoria’s climate. The factor providing the largest contribution is the increasing surface pressure of
the subtropical ridge. Other large-scale factors affect the contribution from the subtropical ridge. On longer
timescales, these interactions also respond to global climate change.
9Text Box 1
The Interdecadal Pacific Oscillation and its impacts
The Interdecadal Pacific Oscillation (IPO) refers to a decadal to multi-decadal variation of surface climate in the
Pacific Ocean basin. It has a longer timescale and a broader spatial structure than the El Niño–Southern
Oscillation (ENSO). The IPO tends to reside in its cold or negative (La Niña-like) phase for a period ranging from
five years to a decade or more and then flip to its warm or positive phase (El Niño-like) (Text Box 1 Figure b). The
IPO has been in its negative, or cold, phase since the late 1990s.
In its cold phase, ocean surface temperatures are cooler than normal in the equatorial eastern Pacific and
warmer than normal to the north of Australia (Text Box 1 Figure a). It is also warmer in the mid-latitudes of the
north and south Pacific, with the warmth extending further poleward than the similar pattern of La Niña. This
pattern of ocean surface temperature change is associated with stronger equatorial easterly trade winds in the
central Pacific, blowing from cold conditions in the east Pacific toward warmer conditions in the west Pacific.
Rainfall tends to be suppressed in the eastern Pacific and increased in the far western Pacific to the north of
Australia. The opposite pattern occurs in the warm phase.
VicCI research shows that during the cold phase of the IPO, the variability of ENSO and the Indian Ocean Dipole
(IOD) is weakened14 (Text Box 1 Figure c). The coupling between ENSO and IOD is also weakened15 during the
cold phase (left column of Text Box 1 Figure d), decreasing the predictability of ENSO and the IOD (left two
columns of Text Box 1 Figure e). However, the impacts of ENSO and the IOD on eastern Australian rainfall
are strengthened (Text Box 1 Figure d, right two columns), so the short-lead seasonal predictability of eastern
Australian rainfall increases (Text Box 1 Figure e, right column). The converse is true during the warm phase of
the IPO.
While ENSO and IOD have a strong impact on Victorian rainfall, the wettest conditions occur when La Niña
aligns with a negative IOD, and the driest when El Niño occurs with a positive IOD16,17. However, during the cold
phase of the IPO, the likelihood of a positive IOD (dry in Victoria) co-occurring with a La Niña event, as
occurred during the Millennium Drought, is increased14, meaning that the large increase in rainfall normally
expected during La Niña might not eventuate.
Although the impacts of the different phases of the IPO on ENSO, IOD and eastern Australian rainfall seem
clear, the cause and predictability of the IPO is still a topic of research. One premise is that the IPO reflects the
cumulative effects of random occurrences of a different number or type of El Niño or La Niña events and low-
frequency filtering effects of the ocean in response to random forcing from the atmosphere. As such, we are
not able to predict swings in the IPO yet.
Text Box 1 figures: (a) Pattern of anomalous surface winds (m/s) and temperatures (°C) during the cold phase of the
IPO (the opposite happens during the warm phase). b) Time series of the IPO since 187018.
Impact of the warm (red bars) and cold (blue bars) phase of the IPO on c) ENSO and IOD amplitude as depicted by
the monthly standard deviation of the Nino3 and DMI indices (see Glossary), d) teleconnection between ENSO and
the IOD as depicted by correlation of Nino3 with the DMI, between ENSO and South East Australian rainfall, and
between the IOD and South East Australian rainfall, and e) forecast skill for first season prediction of Nino3, DMI,
and South East Australian rainfall.
102. Understanding climate variability and change
11A Synthesis of findings from the Victorian Climate Initiative (VicCI)
The mean meridional circulation, including the Hadley circulation
While the large-scale modes of variability described above strongly influence Victoria’s climate, its mean state
is determined by the large-scale mean meridional circulation that transports excessive heat from the tropics
towards the polar latitudes. The mean meridional circulation dictates the boundaries between the wet tropics,
the dry subtropics and the mid-latitudes that are subjected to rain-bearing synoptic weather disturbances
(Figure 2.2). Victoria sits primarily within the dry subtropics, but tropical influences extend southward into
Victoria during summer and mid-latitude weather systems extend northward into Victoria during winter.
Figure 2.2: Features of the mean meridional circulation
The tropical portion of the mean meridional circulation is referred to as the Hadley circulation, which describes
the large-scale overturning circulation with upward motion in the tropics and downward motion in the
subtropics. The Hadley circulation forms two ‘cells’ – one predominantly in the northern hemisphere, and one
in the southern, with strong north-south shifts in the location of the upward and downward branches with
season. Variability in the Hadley circulation and its interactions with the higher latitude circulation to its south are
especially important for Victoria, which is located between ~34-38° S. They determine:
i. The location and intensity of the subsiding branch of the Hadley circulation which suppresses rainfall,
including Victoria’s rainfall
ii. The southward extent of the wet-tropics, which normally sits northward of Victoria
iii. The intensity and frequency of rain-bearing mid-latitude storms that normally skirt the southern parts of
Victoria.
Although the mean meridional circulation can be drawn conceptually as cross-sectional diagrams (Figure 2.2),
the actual circulation is highly variable in space and time. Figure 2.3 highlights that there are three localised
upward and downward branches of the Hadley circulation associated with regions of strong tropical convection
over the tropical Americas, over tropical Africa, and over the Asia-Pacific region which includes Australia19, 20.
The behaviour of the hemispheric mean Hadley circulation as depicted in Figure 2.2 is largely governed by the
behaviour of the Hadley circulation in the Asia-Pacific sector as a result of this sector containing the strongest
and most widespread tropical convection.
122. Understanding climate variability and change
Figure 2.3: Three sectors of the Hadley circulation, delineated by bold black lines. Red generally denotes rising air,
while blue generally indicates descending air. The ‘plus’ shows the region of stronger than expected rising air in the
Asia-Pacific sector in recent years, which has resulted in greater poleward expansion of the circulation in the Asia-
Pacific (Australian) sector compared to the other two sectors.
Figure 2.4: Trend from 1979-2014 in the extent of the Southern Hemisphere Hadley circulation, estimated from three
different approaches, for three monthly averages (ERA-Interim reanalyses). The scale is degrees latitude southward
expansion per decade.
For the Southern Hemisphere, the southward extent of the Hadley circulation has been expanding in recent
decades, at around 0.5 degrees (about 50 kilometres) per decade (Figure 2.4)21. This expansion is well-defined
and significant in summer–autumn, thereby promoting wetter tropical conditions further south into the subtropics.
In winter and spring, the expansion is less clear. The expansion is also consistently larger in the Australian sector
than for the entire hemisphere; and this amplification is most noticeable in late winter and spring.
13A Synthesis of findings from the Victorian Climate Initiative (VicCI)
Previous work suggests that a part of the overall hemispheric expansion of the Hadley circulation is in response
to global warming22. Emerging evidence from VicCI demonstrates that this hemispheric and Australian-sector
expansion has been modulated by the swing in IPO phase from warm to cold over the past 30 years2,19.
Previous work combining observations and model results shows that since 1979 about 30% of the Hadley
circulation expansion in the southern hemisphere is from natural factors, which includes external natural forcing
such as volcanoes and naturally occurring modes of variability such as ENSO and the swing in the IPO2. A
further 40% of the expansion is forced by Antarctic stratospheric ozone depletion, and greenhouse gas forcing
accounts for the remaining 30% of the expansion. Over the longer term (since the 1960s), stratospheric ozone
depletion and enhanced greenhouse gases are the dominant factors driving tropical expansion.
The seasonal cycle of the expansion of the Hadley circulation, which peaks in summer–autumn, appears to be
partly accounted for by the seasonal cycle of the upward trend in the SAM, which is significant only in summer
and autumn. Earlier work in VicCI showed that the SAM and poleward extent of the Hadley circulation are
unrelated during winter because of the presence of the winter time subtropical jet, which limits the
penetration of mid-latitude storms into the tropics2.
It is reasonable to expect that the Hadley circulation will continue to expand with global warming due to
increasing greenhouse gases22, even if the Antarctic ozone hole recovers as expected. In the meantime, the
modulation of the Hadley circulation due to the sea surface temperature patterns of warming over the past 30
years (i.e. the swing from a warm to cold phase of the IPO) should be expected to reverse sometime in the
future with sea-surface temperature patterns becoming more El Niño-like in response to continued
greenhouse gas forcing23. Hence the expansion in the Australian sector may not be larger than the other sectors
(Africa and South America) in the future.
Finally, changes in the annual cycle of Hadley circulation expansion (with stronger expansion in summer and
autumn) due to the trend in SAM are likely to disappear. This is because of the two factors that explain past
SAM trends: ozone depletion and greenhouse gas emissions. Only ozone depletion has a strong annual cycle
and, in the future, due to ozone recovery, this driver of seasonal variation will not apply. There is an important
caveat, however: the strength of the interaction between the Hadley circulation (and tropical modes in
general) and the SAM currently peaks in late spring and early summer24,25, 26, possibly providing a continued
seasonality (peaking in summer) of the future expansion of the Hadley circulation.
Although positive trends in SAM and Hadley circulation expansion are likely to continue to enhance summer
rainfall over Victoria, the current rate of Hadley Cell expansion (and therefore the rate of incursion of tropical
influences on rainfall) may decrease when the phase of the IPO changes from cold to warm. It is therefore not
yet clear to what extent warm season rainfall increases driven by Hadley circulation expansion might be
expected to offset the impact on streamflows of ongoing cool season rainfall declines. Research to date has
been unable to link Hadley circulation expansion during winter with the ongoing drying trend in wintertime
Victorian rainfall. However, preliminary research has indicated that the Hadley circulation has also
been intensifying, which is counter to expectations for the response to climate change but which could help
account for the strengthening of the subtropical ridge in the Australian sector, hence contributing to the
wintertime rainfall decline.
1415
A Synthesis of findings from the Victorian Climate Initiative (VicCI)

16
3. The climate models underpinning climate
   science for Victoria
Key findings
• Most climate models accurately simulate Victoria’s annual temperature and rainfall; however, some models
   incorrectly simulate a summer peak in Victorian rainfall, rather than a winter peak.

• Downscaled rainfall projections at 2 km resolution are better able to capture high intensity rainfall (in the
   top 90% of rainfall amount) across Victoria than projections at 10 km resolution. Fine scale modelling also
   improves representation of temporal variability and rainfall dependencies on temperature.

• Some climate models do not accurately simulate the behaviour of key climate drivers for Victoria or their
   teleconnections to Victoria’s rainfall.

• Under a high emissions scenario, projections for Victoria’s cool season rainfall at the end of the century show
   a decline of around 8% (relative to 1986-2005). Across the south western part of the state this decline is
   about 15%, and the modelled range of possible change is -34% to +4%.

• Selecting only models that better simulate the seasonal cycle of Victoria’s rainfall leads to a drier future than
   the full ensemble. If models that do not simulate the seasonal cycle of Victorian rainfall well are removed from
   consideration, a drier future by the end of the century is indicated (a rainfall reduction of –14% compared to
   –8%). If the poorer performing models in terms of climate drivers are also excluded the corresponding figure
   is –17% compared with –8%.

• The current trend in SAM toward its high phase is projected to continue, leading to drier winters and perhaps
   wetter summers. The models also project that the Hadley circulation will continue to expand in the future and
   the subtropical ridge will continue to intensify and move poleward over the century.

Implications
• Projected changes to major climate drivers suggest that the downward trend in cool season rainfall is
   likely to continue.

• Even with careful selection of models, climate change projections continue to show a wide range of possible
   and plausible regional rainfall and runoff futures. This range should be considered to provide reasonable
   bounds for planning purposes, noting also that the generally drier projections from the better-performing
   models for Victoria suggest that projections in the drier end of the full range may be more likely.

• While fine-scale simulations capture climate features and variability not evident on larger spatial scales, they
   require a large amount of computer resources and are not currently feasible to run across a large number of
   climate models. This limits their current practicality for hydrological projections of future water availability.

Left: Stream in Melbourne catchment area. Paul Feikema

                                                                                                                       17
Text Box 2
Projecting runoff for a warmer future under climate change
Attempting to understand what the climate and runoff may look like in a future with higher atmospheric
concentrations of greenhouse gases presents a challenge for the research community, due to:
• Uncertainties around future emissions
• Uncertainties in the simulation of the climate by global climate models
• Uncertainties in the process of downscaling the coarse-grid climate model outputs
• Uncertainties in the method used to produce catchment-scale streamflow/runoff changes.
It is important to keep these uncertainties in mind when considering guidance on how rainfall and runoff may
change in the future.
Climate models
Climate is influenced by many physical, chemical and dynamical processes in the atmosphere, ocean and
cryosphere, and by interactions with land surface characteristics. Some of these have a large influence on
regional climate (e.g. the impact of the Great Dividing Range on Victoria’s climate) while others have wide
reaching global influences (such as ENSO). To project future climate, scientists represent knowledge of these
processes (movement of heat, moisture and mass) and landscape characteristics (orography and land-use) in
global climate models (GCMs). Over the past five decades these models have become increasingly complex
and sophisticated, but are still simplifications of reality, both in terms of space and time scales and in their
representation of dynamical, chemical, physical and biophysical processes.
Future emissions
The investigation of future climate change requires more than climate models. It is also necessary to predict
what greenhouse gas emissions may look like in decades to come. This prediction depends on how global
and regional economies develop, changes to vegetation and land use, population growth and other drivers.
With such a wide range of possibilities, scientists opt for representing possible futures along several different
representative concentration pathways (RCPs)27. These RCPs describe different levels of greenhouse gases and
pollutants in the atmosphere that could result from a range of different physical and economic scenarios:
• The high emissions scenario (RCP8.5) represents a future with little curbing of emissions. Carbon dioxide
concentrations continue to rise rapidly and reach a concentration of 940 ppm by 2100 (Red line in left panel
of Figure).
• In the medium emissions scenario (RCP4.5) emissions peak around 2040, then stabilise at around 2100,
with a carbon dioxide concentration of 540 ppm by 2100 (Blue line in left panel of Figure).
• The low emissions scenario (RCP2.6) is an ambitious, strong mitigation scenario, with emissions peaking
by 2020 then rapidly declining due to emissions reduction and active removal of carbon dioxide from the
atmosphere (Green line in left panel of Figure).
Climate models use greenhouse gas concentrations defined by the RCPs as inputs, thus giving the climate
response following each emission pathway into the future. Together, the RCPs span a range of plausible futures.
Opting to use a single RCP implies that certain pathways have been judged to be less relevant to the intended
183. The climate models underpinning climate science for Victoria
application. Decisions about choosing an RCP have the greatest implications for far-future time horizons as the
concentrations of long-lived greenhouse gases such as carbon dioxide increase in the atmosphere over time,
and higher emission rates have greater cumulative effect on the climate.
Downscaling
Scientists also need to consider how to translate the typically coarse resolution information from global climate
models to catchment scale, a process often referred to as downscaling28. A wide range of different techniques
are available for this process which vary in their complexity and capability to estimate climate change on a finer
resolution compared to the global climate model. Methods range from straightforward scaling of observed data
using scaling factors, to very fine resolution dynamical modelling using a regional climate model.
Hydrological modelling
To estimate future runoff, scientists typically use conceptual rainfall-runoff models. These are often models
used in an operational setting and are calibrated to observations of the current climate and streamflow. When
applied to a future climate, calibrations are assumed to remain constant. If the catchment experiences significant
changes to its biophysical characteristics, this assumption may not hold true. Hence, in addition to uncertainty
in the climate data, uncertainties also exist in the hydrological modelling.
Summary
The output of climate models is the largest source of uncertainty in the runoff simulations from hydrological
models6. Confidence in runoff projections is thus strongly linked to the credibility of the downscaled climate
change signal and the sampling of global climate models.
19A Synthesis of findings from the Victorian Climate Initiative (VicCI)
Improving climate models
Climate models of varying degrees of complexity are the basis of routine weather forecasting and seasonal
climate prediction, as well as being used for long-term climate change projections. Models are evaluated by
comparing their outputs with past observations of climate variables (e.g. temperature and rainfall) and by
assessing their capability to simulate large-scale factors that affect local climate (e.g. ENSO, IOD and SAM).
Evaluation shows that these models capture large-scale circulation features well, however there are some
systematic uncertainties in projecting climate. The uncertainties arise from the chaotic nature of the climate
system and systematic model errors due to misrepresentation or lack of representation of key processes
occuring on scales smaller than the grid scale of the computer simulation.
Advances in model development and enhancements in supercomputers aim to reduce all these uncertainties.
To account for the uncertainties in individual models arising from both model errors and unpredictable climate
variability, researchers generally consider the results of several models i.e. an ensemble. The most recent
ensemble for climate projections was provided by the Coupled Model Intercomparison Project 5 (CMIP5)29.
These CMIP5 models have been run for a standard set of experiments so their capabilities to simulate current
and future climates following prescribed greenhouse and air pollution concentrations can be assessed.
Modelling groups are currently planning for CMIP6.
Improvements in the Australian Community Climate and Earth System Simulator (ACCESS) seasonal and
climate models are ongoing. A substantial upgrade of the available supercomputing capability for operational
activities will deliver increased speed and the capacity for increased spatial resolution, resulting in an improved
representation of Victoria’s climate and its seasonal prediction. A plan is being developed for further
improvement to the ACCESS model used for long-term climate projections. While climate modelling has its
limitations, investment in national and international development ensures that model skill and model
capability improve over time.
Evaluation of climate models
VicCI scientists evaluated climate models in terms of their skill in simulating the climate of Victoria, the large-
scale factors that influence variability of Victoria’s climate, and the relationship of these large-scale factors to
Victoria’s climate. These evaluations are important in assessing the uncertainties in the CMIP5 models which
were used to develop a set of future projections of Victoria’s climate.
Most climate models provide a reasonably accurate simulation of the observed annual cycle of temperature
and rainfall in Victoria (see Figure 3.2 for rainfall). However, some yield a summer maximum (rather than winter
maximum) in rainfall that may lead to unreliable estimates in future projections. Moreover, climate models with
summer maximum rainfall do not capture the observed year-to-year variability of rainfall. The cause for this
deficiency appears to be a poor representation of the atmospheric circulation in the tropics to the north and east
of Australia.
The ability to simulate both the annual cycle and trends of key climate factors and the linkage (or teleconnection)
between these key factors and the climate of Victoria (Figure 3.3) was also assessed. There is a strong
relationship between Victoria’s rainfall and the pattern of tropical sea surface temperatures to the north of
Australia and in the Pacific (due to ENSO) and Indian (due to the IOD) Oceans. Further, the IOD tends to be
correlated with ENSO, with positive IOD events occurring with El Niño events. The Intergovernmental Panel
203. The climate models underpinning climate science for Victoria
on Climate Change (IPCC) reports that there is some improvement in the representation of ENSO in CMIP5
models compared with the earlier CMIP3 models30. However, significant uncertainties remain, especially in the
representation of the feedback processes that underpin ENSO. The IOD is also simulated reasonably well in
CMIP5 models although some models tend to overestimate the amplitude of IOD events and underestimate its
linkage with ENSO.
The seasonality in these tropical modes is well captured by most models (Figure 3.3a), as is the relationship with
Victorian rainfall, being strongest in spring (Figure 3.3b). However, although most models capture some of these
connections, the relationship varies from model to model.
Variation of the subtropical ridge of relevance to Victoria can be represented by the surface pressure maximum
in a north-south slice around 150°E. Many CMIP5 models yield accurate simulations of the seasonal cycle of
the subtropical ridge intensity and peak location (Figure 3.3c). However, the observed relationship between the
subtropical ridge and Victoria’s cool-season rainfall is less well simulated, especially between April and August.
In VicCI, an assessment of the value of very fine resolution simulations that allow convection to be explicitly
resolved was made using the US Advanced Weather and Research Forecasting (WRF)31 model. Simulations
were run across Victoria on grid resolutions of 2 km and 10 km over the period 2010–2014. The purpose was
to investigate whether the finer resolution (which allows convection to be explicitly simulated within the
model) provides a better simulation of regional rainfall relative to a coarser resolution regional model where
convection is parameterised. Compared to a 10 km resolution, the 2 km simulations are better able to capture
high intensity rainfall (raindays in the top 90% of rainfall amount) across Victoria (Figure 3.1), as well as
improved representation of its temporal variability. Currently, the large supercomputing resources required
for very fine resolution dynamical downscaling limit its practicality for hydrological projections of future water
availability. However, these experiments can provide useful process understanding.
Figure 3.1: Representation of mean and high intensity rainfall in observations (AWAP) and by a regional climate
model (WRF) at 2 km or 10 km resolution.
21A Synthesis of findings from the Victorian Climate Initiative (VicCI)
Figure 3.2: The annual cycle of Victorian rainfall. Observations for south-east Australia (solid black line) and Victoria
only (dashed black line); ensemble means from all models (red line); models with the best representation of the
seasonal cycle (blue line), and models with the worst representation of the seasonal cycle (green line).
Moreover, models tend to underestimate the observed intensification and poleward shift in the subtropical ridge
over the last century.
Current climate models can simulate the seasonal influences of SAM on Victoria’s rainfall, with a positive SAM
causing dry conditions in winter but wetter conditions in the warm season (Figure 3.3d). Climate models are also
able to capture the observed positive trend in SAM in recent decades. However, there is a substantial bias in the
depiction of the impact of the trend of the SAM on rainfall, with too large an increase in rainfall in summer and
too small a reduction in winter when SAM is increased. An additional limitation is that the climate models tend
to underestimate the seasonal relationship between ENSO and SAM32, especially the observed tight coupling of
SAM to strong ENSO events in spring/summer. A study of the heavy spring rainfall in Victoria during the major
La Niña event of 2010 demonstrated the importance of the alignment of La Niña and positive SAM for causing
the high rainfall16. An opposite alignment can occur in El Niño events, such as during the spring of 2002, when a
strong negative SAM played an important part in a major drought affecting Victoria.
Climate models capture decadal variability, including the IPO, but the amplitude is weaker than observed.
The timing of simulated decadal variations is not expected to match the observed variations because much
of the observed decadal variability is thought to be generated by interactions within the climate system rather
than being externally forced, so the climate model’s day-to-day weather, and resulting decadal variability, will
differ from that in the observed world. Averaging across a number of models, this source of decadal-scale
variability will be smoothed out. As the change in the IPO phase over the past 30 years has promoted the recent
expansion of the Hadley circulation, it is likely that the lack of such an IPO signature among the climate models
contributed to the underestimation of the recent expansion.
223. The climate models underpinning climate science for Victoria
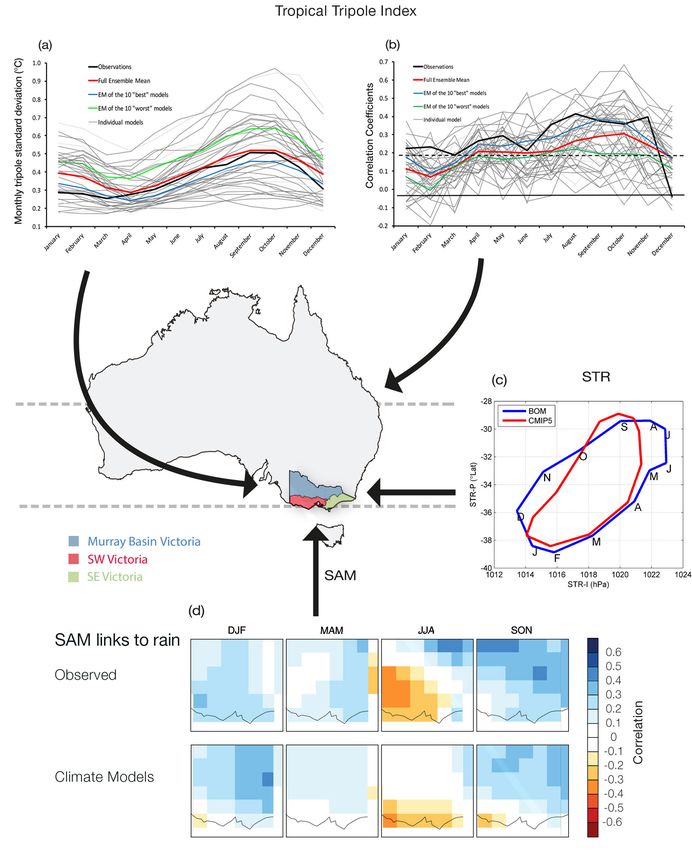
Figure 3.3: Evaluation of the ability of climate models to reproduce the key large-scale drivers of relevance to Victoria
and their links to Victorian rainfall. Panels show observed and modelled characteristics for (a) the annual cycle of
tropical variability as depicted by the tropical tripole, an index that captures differences in sea surface temperatures
north of Australia relative to temperatures in the nearby Indian and Pacific Oceans; (b) the correlation between
the tropical tripole and Victorian rainfall; (c) the annual cycle of the subtropical ridge intensity (STR-I) and position
(STR-P; starting in January bottom-left, moving counter-clockwise); (d) the correlation between SAM and rainfall
across south-east Australia for the four calendar seasons in observations (top panels) and models (lower panel).
23You can also read


