User Guide ESCI Climate Risk Assessment Framework - MAY 2021
←
→
Page content transcription
If your browser does not render page correctly, please read the page content below

ELECTRICITY
                       S E C TO R
                       C L I M AT E
                       I N F R M AT I N
                       PR JECT

ESCI Climate Risk
Assessment Framework

User Guide
MAY 2021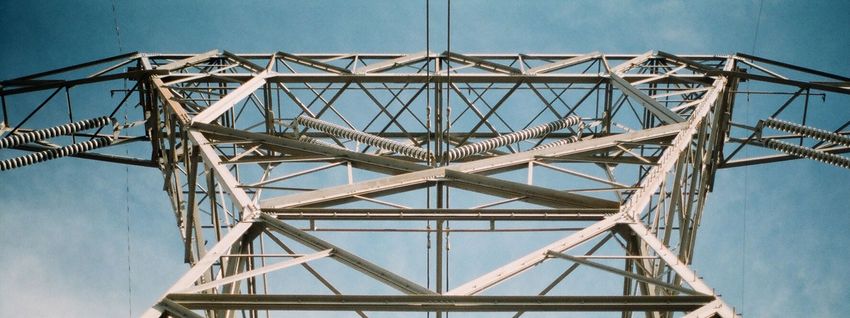
ELECTRICITY
                                                                                                        S E C TO R
    USER GUIDE                                                                                          C L I M AT E
                                                                                                        I N F R M AT I N
                                                                                                        PR JECT

      Introduction
      Overview
      The impacts of weather on a future energy system in a future climate will become
      increasingly significant. Using a standard framework for a climate risk assessment
      provides a consistent, structured and pragmatic approach for minimising harm
      and capturing opportunities.

      The ESCI climate risk assessment framework follows the International Standard
      ISO 31000 for Risk Management, starting with understanding the context, then
      identifying and analysing the climate risk, prioritising risks, and then determining
      how to mitigate the key risks. The suite of tools developed by the Electricity Sector
      Climate Information Project (ESCI) can be used to integrate climate risk consistently
      into sector planning and risk modelling using a standard process.

      Introduction
      The guidance is structured around the 5-step ESCI Climate
      Risk Assessment Framework. The framework has been                         The Electricity Sector Climate
      designed and tested by key electricity sector stakeholders                Information (ESCI) project
      and climate experts in CSIRO and the Bureau of
                                                                                provides guidance for
      Meteorology, with support from the Department of Industry,
      Science, Energy and Resources. The guidance includes
                                                                                electricity sector stakeholders
      recommending climate data, case studies showing how the                   on using climate information
      climate risk assessment framework and associated data have                in risk assessments.
      been used, and other supporting documentation.

      While the framework is aimed at the electricity sector, it can be used by other
      sectors to incorporate climate risk into decision-making.

      Why is climate risk assessment needed?
      The International Standard ISO 31000 for Risk Management defines risk as the
      ‘effect of uncertainty on objectives’.1 For the electricity sector, the National
      Electricity Objective (AEMC 2019) is:

      to promote efficient investment in, and efficient operation and use of, electricity
      services for the long-term interests of consumers of electricity with respect to:

          • price, quality, safety and reliability and security of supply of electricity

          • the reliability, safety and security of the national electricity system

      1    ISO 31000 (2018) Risk Management https://www.iso.org/iso-31000-risk-management.html

1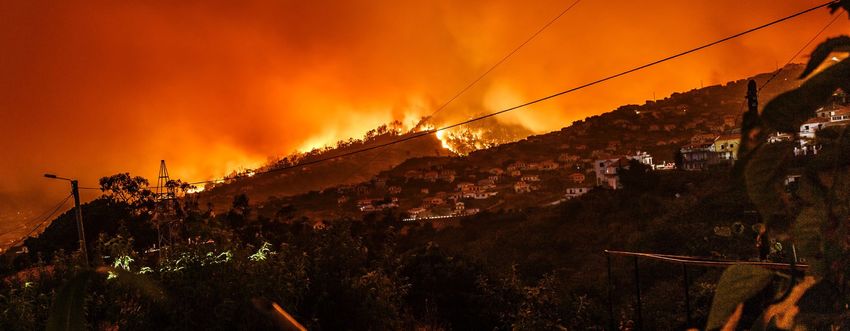
ELECTRICITY
USER GUIDE Introduction S E C TO R
C L I M AT E
I N F R M AT I N
PR JECT
Context for using the climate risk
assessment framework The development of the
ESCI climate risk assessment
There is clear evidence that the climate has been changing framework
(BoM and CSIRO, 2020). Australia has warmed by 1.4 °C
The framework provides detailed
since 1910 (Figure 1), with less rainfall in the south and east
and context-specific guidance
and more rainfall in the north. Impacts on the electricity
on conducting a climate risk
system have been felt through extreme weather events such
assessment. The method uses
as heatwaves, floods, wind-storms, droughts and fires.
the approach taken for most
1.5 risk assessments in the sector,
Annual mean temperature anomaly
Australia (1990–2020) so allows climate risk to be
seamlessly incorporated into
Mean temperature anomaly (°C)
1.0 decision-making. It integrates
relevant information from:
0.5
• International Standard ISO
31000 Risk Management,
0.0 which provides a general
framework that is widely used
internationally
–0.5
• International Standard ISO
–1.0 14090 Adaptation to Climate
Australian Bureau of Meteorology Change, which is consistent
Based on a 30-year climatology (1961–1990) with ISO 31000 and well
–1.5
aligned with climate risk
10
20
30
40
50
60
70
80
90
0
10
20
assessment for the electricity
0
20
19
19
19
20
19
19
19
19
19
19
20
Year sector
Figure 1: All parts of the electricity sector, from generation • the Australian Climate
to transmission and supply to demand, are sensitive to heat. Compass, which is also
Increasing average and extreme temperatures due to climate consistent with ISO 31000,
change present an operating environment different from the
with a focus on climate risk
past. (Source: Bureau of Meteorology Climate change and
variability: Tracker: Australian timeseries graphs) assessment for policy and
programs
Climate change is creating new risks for businesses (Table • Australia’s National Disaster
1). For example, high temperatures increase electricity Risk Reduction Framework
demand and affect all electricity supply infrastructure; as
temperatures rise with climate change, the risks to the • Australian Standard AS 5334
sector will also rise. Climate change adaptation for
settlements and infrastructure
• Climate Risk and Resilience
Guidance Manual (Energy
Networks Australia 2015),
a detailed guide to risk
assessment for energy
networks that provides advice
that can be used by other
parts of the sector
2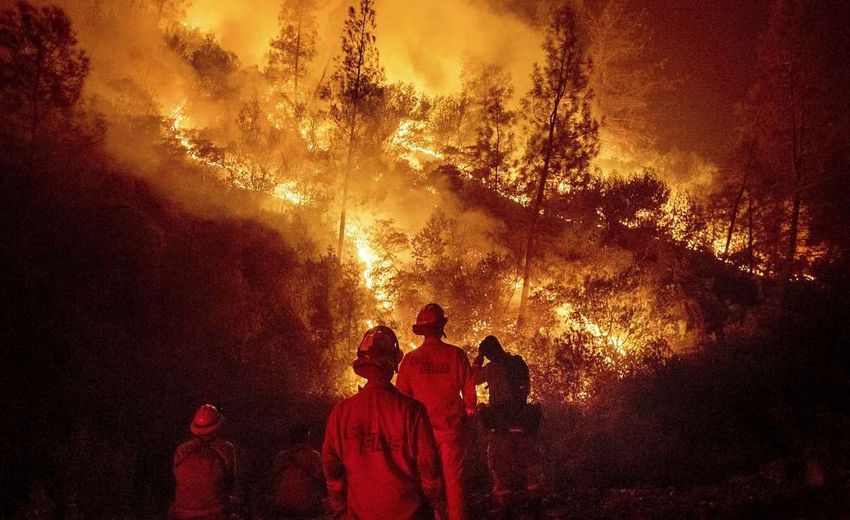
ELECTRICITY
USER GUIDE    Introduction                                                                                       S E C TO R
                                                                                                                 C L I M AT E
                                                                                                                 I N F R M AT I N
                                                                                                                 PR JECT

      Table 1: The risks that climate change poses to the electricity sector

       Physical risks
        • Electrical assets are likely to be affected by weather that differs from the historical expectation.

        • Physical risks include:

           - changing wind, irradiance, precipitation and temperature, affecting the instantaneous supply
             and demand balance

           - increases in extreme weather and compound weather events that affect the operability and
             failure rates of assets

       This category is the focus of the ESCI project

       Supply-side transition risks         Demand-side transition risks         Institutional risks
       As part of global greenhouse         Climate change and                   Failure of sector institutions
       gas emission reductions and          decarbonisation will affect          and organisations to consider
       changing technology prices,          electricity users and their          climate change will produce
       electricity generation is            needs. Impacts to residential        financial, legal, governance
       transitioning from fossil fuels      consumption may include              and reputational impacts.
       to renewable sources such as         additional rooftop PV and
       wind and solar. The intermittent     electric vehicles. Impacts to
       nature of these sources affects      business consumption may
       the operability of systems, as       include additional desalination,
       well as transmission needs,          further restructuring of the
       reliability, system stability,       economy and changing
       strength, fault levels and           agricultural and industrial needs.
       synchronous support.

      Potential applications of a climate risk assessment include:

       • prioritising climate risks that require mitigation

       • managing asset safety and reliability risks

       • managing the potential for asset or value destruction

       • managing the potential for changes in cash flow or profitability

       • managing consumer outcomes from the integrated power system

       • designing new asset specifications for future operating conditions

       • calculating market benefits attributable to regulated investments, considering
         changes to operating conditions of the integrated power system

      Climate change is superimposed on natural weather and climate variability, and
      while historical records provide a good indication of emerging risks, future risks
      are likely to be underestimated or may appear in new locations. Climate risks to
      the electricity sector are likely to be most relevant in strategic or planning time
      frames (5–50 years). However, some impacts are already evident and are relevant
      to operational time frames (1–5 years).

3
ELECTRICITY
USER GUIDE         Introduction                                                                                                S E C TO R
                                                                                                                               C L I M AT E
                                                                                                                               I N F R M AT I N
                                                                                                                               PR JECT

      What does the framework cover?
      The framework covers the analysis of physical climate risks, defined by the
      Intergovernmental Panel on Climate Change (IPCC) as the combination of
      hazards, exposure and vulnerability (Cardona 2012). Exposure is the presence
      of people; livelihoods; species or ecosystems; environmental functions, services,
      and resources; infrastructure; or economic, social, or cultural assets in places and
      settings that could be adversely affected by a hazard. Vulnerability refers to the
      propensity of assets, systems and consumers to experience adverse effects. This
      may be the result of design or engineering, or the inability to adapt, such as a
      community not being able to move out of the way of a hazard such as a fire or
      flood.

      The ESCI project provides information on the intensity and frequency of weather
      and climate hazards.2 For a complete risk assessment, exposure and vulnerability
      need to be considered. For example, the National Energy Market (NEM) has long
      interconnectors between population, industrial and other demand centres. Thus,
      the NEM is widely exposed to extreme weather events, climate variability and
      climate change.

      The ESCI Climate Risk Assessment Framework has 5 steps (Figure 2).

      2   Note, a hazard could be a change in a climate variable—for example, temperature is a
          variable, but an extreme temperature is a hazard.

                                                                                                                 Figure 2: The
                   Understand                         Identify historical               Analyse future           ESCI Climate
           1       context                       2    climate risk                 3    climate risk             Risk Assessment
                                                                                                                 Framework
               What is your climate-related       How is weather information       How might weather related
               question?                          included in decisions now?       system impacts change
                                                                                   under future climate
                                                  Has an historical relationship   scenarios?
               What climate hazards are           between weather and
               important?                         system impacts been
                                                  identified?
               Who is interested or affected?                                      How might you assess
                                                  Are there known thresholds       system exposure under
                                                  or other parameters that         alternative future climate
               What would you like to             could inform the risk            scenarios?
               achieve?                           analysis?

                                                                                   Do you need to consider
          Treat climate                         Evaluate all
          risks                           5     risks                         4    exposure to climate hazards
                                                                                   that are hard to quantify?

               What are your risk treatment       What is the risk likelihood?
               options?                                                            How do you communicate
                                                                                   confidence and uncertainty
                                                  What are the potential           in the results?
               Do the benefits of mitigating      consequences?
               the risk outweigh the costs?

                                                  What is the priority of the
               Prepare and implement a risk       climate risk relative to other
               mitigation plan                    risks?

4
ELECTRICITY
USER GUIDE    Introduction                                                                  S E C TO R
                                                                                            C L I M AT E
                                                                                            I N F R M AT I N
                                                                                            PR JECT

      The 5 steps for climate risk assessment are:

                           This takes a decision-centred approach involving broad
       1                   stakeholder engagement which focuses on understanding
                           the vulnerabilities of key assets, systems and consumers,
      Understand
                           and the purpose of the risk assessment. The ESCI project
      context              provides guidance on climate information that can be used
                           to scan quickly for exposure and vulnerability to climate
                           hazards.

                           Risk identification builds upon the initial scan in step 1
       2                   by developing a deeper understanding of the historical
      Identify             relationships between weather, climate and electricity
                           system performance. This step produces a statistical model
      historical           describing the relationship between weather, climate and
      climate risk         performance and will define the temporal and spatial scale
                           of interest. Relevant engineering standards and performance
                           standards should be considered and can help identify the
                           metrics for use in the analysis.

                           This step uses the model developed in Step 2 and the
       3                   purpose of the risk assessment to identify climate scenarios
      Analyse              of interest. The most appropriate climate projections
                           can then be used to determine how the asset or system
      climate risk         performance is likely to be affected in the future. Because of
                           the complexity of projecting future climate, the ESCI project
                           provides recommendations on suitable climate information
                           and associated confidence and uncertainty.

                           Climate change is only one risk to be considered in
       4                   electricity sector planning. This step involves comparing all
      Evaluate             material risks by assessing consequences and likelihoods
                           and producing a risk rating matrix. This helps to rank or
      all risks            prioritise risks that require treatment. Risk evaluation may
                           lead to further risk analysis or a decision not to undertake
                           risk treatment. Organisations should define criteria to
                           evaluate the significance of current and future climate risks,
                           consistent with criteria used for other types of risk.

                           Risk treatment involves developing and selecting one or
       5                   more options for modifying the risk, which may then need
      Treat climate        an investment case or a change in process. Selecting a risk
                           treatment requires consideration of the costs and benefits
      risk                 of reducing the risks and the tolerance for residual risks.
                           Factors that contribute to the cost-benefit analysis include
                           effectiveness, robustness, practicality, economic efficiency,
                           co-benefits, equity and greenhouse gas emissions. Large-
                           scale investment cases will need to follow regulatory
                           frameworks to be approved by the Australian Energy
                           Regulator.

5
ELECTRICITY
USER GUIDE    Introduction                                                                  S E C TO R
                                                                                            C L I M AT E
                                                                                            I N F R M AT I N
                                                                                            PR JECT

      How should the assessment framework be used?
      Risk assessment is an iterative process. Depending on the work your organisation
      has undertaken on climate risks, the risk management processes involved and
      the objectives and resources available, the climate risk assessment may range
      from simple to complex. You should start with a simple, rapid and qualitative
      assessment to prioritise where detailed effort may be needed in a subsequent
      assessment, also referred to as a ‘scan cycle’ (CSIRO 2018). If this has already
      been completed, you may wish to undertake a more comprehensive assessment.
      It is unlikely that you will work sequentially through each step in the method. You
      will probably repeat some steps as you develop your understanding of climate
      risks and fine-tune your objectives.

      The ESCI project user guide includes detailed information on the assessment
      framework steps and how to integrate historical and projected climate
      information. ESCI case studies provide worked examples of using the climate risk
      assessment framework to assess exposure to future risk.

      The steps of the ESCI project user guide include detailed information for each of
      the framework steps.

      The ESCI website provides access to high resolution climate projection data:
      5–12 km across the NEM, at sub-daily intervals, to 2100. It includes insights which
      enable users to choose appropriate data and to plan for this future with greater
      confidence

      ESCI case studies show how the tools available on the website have been used
      in a climate risk assessment—accompanying documents step through the case
      study process in detail. Note: every business, location and asset combination
      is different, so the case studies do not provide a comprehensive overview of
      electricity system vulnerabilities and should not be used be used to inform
      operational decision-making.

      Key concepts provide as-needed insights into climatology concepts used in
      analysing climate risk, as well as information on how the climate data were
      evaluated and the recommended data sets chosen.

      The ESCI Website: www.climatechangeinaustralia.gov.au/esci

6
ELECTRICITY
USER GUIDE   Introduction                                                                               S E C TO R
                                                                                                        C L I M AT E
                                                                                                        I N F R M AT I N
                                                                                                        PR JECT

      References
      AEMC (2019) Applying the energy market objectives. Australian Energy Markey
      Commission. https://www.aemc.gov.au/sites/default/files/2019-07/Applying%20
      the%20energy%20market%20objectives_4.pdf

      BoM and CSIRO (2020) State of the Climate Report. https://www.csiro.au/-/
      media/OnA/Files/State-of-the-Climate-2020.pdf

      Cardona, O.D., van Aalst, O.D., Birkmann, J. et al. Determinants of risk: exposure
      and vulnerability. In: Managing the Risks of Extreme Events and Disasters to
      Advance Climate Change Adaptation. A Special Report of Working Groups I
      and II of the Intergovernmental Panel on Climate Change (IPCC). (: Cambridge
      University Press, 2012) 65–108. https://www.ipcc.ch/site/assets/uploads/2018/03/
      SREX-Chap2_FINAL-1.pdf

      CSIRO (2018) Climate Compass—A climate risk management framework for
      Commonwealth agencies. https://www.environment.gov.au/system/files/
      resources/1f56cd3f-dd0f-4f4e-9f14-66ceca36125b/files/climate-compass-
      climate-risk-management-framework-commonwealth-agencies.pdf

      Energy Networks Australia (2015) Climate Risk and Resilience - Industry
      Guidance Manual. https://infostore.saiglobal.com/en-au/Standards/ENA-
      Doc-036-2015-1126977_SAIG_ENA_AUS_ENA_AUS_2613924/

                                                                   www.climatechangeinaustralia.gov.au/esci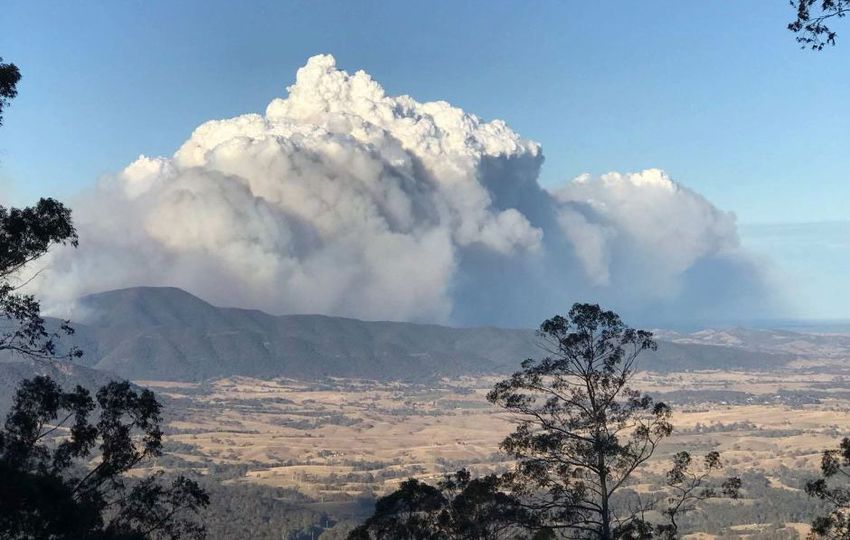
ELECTRICITY
                                                                                                        S E C TO R
    USER GUIDE                                                                                          C L I M AT E
                                                                                                        I N F R M AT I N
                                                                                                        PR JECT

        1
                  Understand
                  context
      Overview
      Climate variability and change present a risk to the                         Understand
      electricity sector now and in the future. Risk from climate           1      context
      change is defined as the combination of hazard (e.g.
      changes in the weather), exposure (e.g. asset location)
      and vulnerability (e.g. the likelihood that the asset will be
      damaged or not function). The ESCI project recommends a
                                                                                   Identify
      5-step approach to climate risk assessment that starts with          2       historical
      establishing the context. This involves:                                     climate risk
       • identifying climate-related decisions or questions
                                                                                   Analyse future
       • conducting a quick scan to confirm which climate
         hazards are most important
                                                                           3       climate risk
       • identifying internal and external stakeholders who can
         contribute and/or should be involved in decision-making,
                                                                                   Evaluate all
       • defining the purpose of the risk assessment—this will             4       risks
         help define the scope and key metrics for evaluating risk
         and will guide the selection of the appropriate future
         climate scenario

                                                                                   Treat climate
      What is at risk?                                                     5       risks
      The ESCI Climate Risk Assessment Framework (Figure 1)
      supports high-level decisions such as corporate strategic
      direction, or system-wide assessments on investing for          Figure 1: The ESCI Climate Risk
                                                                      Assessment Framework
      resilience to extreme weather events. The Framework can
      also be applied to activities such as developing maintenance
      plans for a particular asset class.

      The first step is to identify if the activities under
      consideration are at risk from a changing climate.

      Weather is the state of the atmosphere on short timescales,
      from seconds to days. Climate is the average weather,
      usually considered over 20–30 years to allow for year-to-
      year variability (see Figure 2). Climate change is having a
      significant influence on weather, especially extreme weather
      events.

8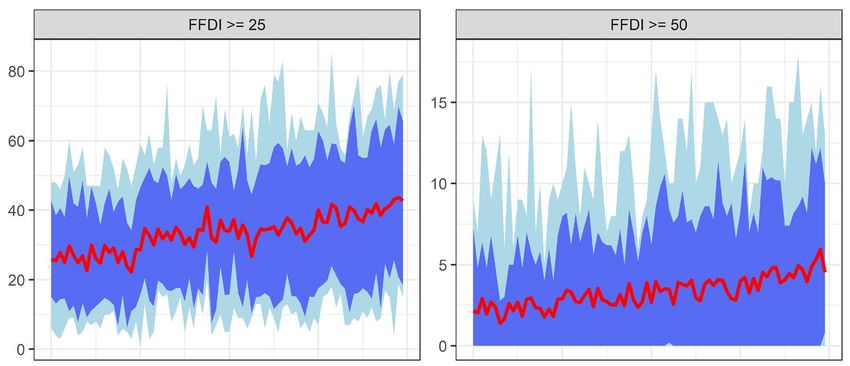
ELECTRICITY
USER GUIDE Step 1: Understand context S E C TO R
C L I M AT E
I N F R M AT I N
PR JECT
24.5
annual temperature (°C) 24.0 Australian equivalent of 2°C global
warming above preindustrial
Australian average
23.5 2019
Australian equivalent of 1.5°C global
23.0 warming above preindustrial
22.5 Average annual temperatures (2000–2019)
22.0
Simulated past climate
21.5 Simulated future climate
21.0 Previous generation models
The recent warming can
Observed temperatures
20.5 only be explained by
human-caused emissions. Observed 20-year running average
Source: CSIRO
20.0 Climate without warming trend
40
30
10
20
30
40
50
60
70
80
90
0
10
20
0
20
19
19
19
20
20
20
19
19
19
19
19
19
20
Year
Figure 2: Australian average temperature observed and simulated from climate
models. Past and future bands show the range of 20-year running average of climate
model outputs. Source: BoM and CSIRO 2020
Weather and electricity are interconnected. Weather is the ‘fuel’ for solar, wind
and hydro-electricity generation and electricity demand is strongly dependent
on temperature. Electricity infrastructure performance is affected by extreme
events such as high temperatures, droughts and severe winds. Climate risk should
therefore be considered as part of:
• System reliability. The behaviour of systems and networks changes when
weather is outside normal operating conditions. For example, decreasing soil
moisture could have an impact on the ability of underground power lines to
carry specified current.
• Investment cases if projected asset performance changes significantly. For
example, projected rainfall decreases may affect the business case for new
hydro-generation assets.
• System resilience. Compound and extreme weather events are increasing
in frequency and magnitude, threatening assets and whole-of-system
performance. For example, the increasing frequency of extreme bushfires may
require a reassessment of maintenance or operating practices.
Figure 3 provides an ESCI project 50
wind (m/s) and temperature (°C)
0.7
Temperature
normalised wind farm output
example of the risk extreme heat poses
to variable renewable energy. The 0.6
40
figure shows the relationship between
0.5
wind farm output (black line), wind
30
speed (blue line) and temperature (red 0.4
line) during a very hot day. The wind Wind farm output
0.3 20
farm shuts down during peak demand
(and peak pricing) hours from 12 pm. 0.2
This behaviour could change the 10
0.1
investment case for the wind farm. Wind speed
0.0 0
Mon Tue Tue Tue Wed
16:00 02:00 12:00 22:00 08:00
Figure 3: Impact of high temperatures on wind farm output for
an Australian wind farm. As temperatures increase, electricity
demand tends to rise, but with extreme high temperatures wind
farm output may decrease. (Source: ESCI case study—extreme
heat and variable renewable energy)
9ELECTRICITY
USER GUIDE Step 1: Understand context S E C TO R
C L I M AT E
I N F R M AT I N
PR JECT
What climate hazards are important?
Climate change is likely to significantly increase some risks as both weather hazards and exposure
may change. A scan should be undertaken for areas, processes and assets that could be affected by
a changing climate (see Table 1); this provides a rapid, first pass appraisal of the main climate risks,
identifies priorities for further work and indicates whom to involve.
Climate data and analyses need not be considered at this point, just high-level summaries such as
regional tables or maps of climate change (NESP 2020) (see sidebar on climate information products
useful for identifying climate hazards). Past climate-related impacts will also provide guidance on
important hazards.
Table 1: Examples of climate hazards for different components of the electricity sector, and relevant case
studies
Component Hazard ESCI case study
Assets for distribution and Bushfire, extreme temperature and Bushfire risk
transmission severe convective wind
Severe convective wind risk
Reduced soil moisture (increases
impedance and reduces thermal Soil moisture variability
conductivity) Extreme heat risk
Solar or wind power Extreme heat, changes in solar Extreme heat risk
generation irradiation and wind
Hydro power generation Reduced streamflow into dams Streamflow variability
Thermal coal power Extreme heat, causing over-heating of
generation cooling water and reduced supply
AEMO system reliability Extreme temperatures, affecting all Extreme heat risk
modelling aspects of supply
Bushfire risk
Streamflow variability
Compound extreme events
Impacts on communities Bushfires Bushfire risk (distributed
energy resources)
Hailstorms and floods
Compound extreme events
Extreme and compound climate events
Consider creating a simple table that lists
The risk identification process
• historical climate hazards and impacts
is best run as a brainstorming
• projected changes in hazards, exposure and vulnerability session among a group
over the next 30–80 years of diverse stakeholders
• future risks who understand the
interdependencies within and
• potential risk mitigation options between operations, assets,
weather and climate.
10ELECTRICITY
USER GUIDE Step 1: Understand context S E C TO R
C L I M AT E
I N F R M AT I N
PR JECT
ESCI case studies (available on the ESCI website) provide
examples of climate risk assessments for electricity system Asset versus system risk
assets, processes or system decisions. Asset and operation Climate change will present new
locations are unique and can only be assessed on a case- and varied operating conditions
by-case basis. However, the case studies can help identify that may require innovative
climate sensitive decisions. adaptation. The systemic nature
of most risk reduction strategies
Who is interested or affected? (such as strategic redundancy)
means that an asset-by-asset
Climate change will affect both internal and external
approach to risk management
stakeholders, therefore both should be engaged early in the
is generally inappropriate and
process to ensure that the risk assessment meets all needs
inefficient. For example:
and considers all aspects of risk and opportunity.
• a climate risk metric that
Internal stakeholders
measures the potential impact
You should gather information from different functional of climate risk on a single
areas of the organisation, based on the aim of the risk electricity pole or line will not
assessment. Consider: capture mitigation strategies
that reduce load on that line
• technical experts to provide information on engineering
specifications or maintenance schedules • mitigating bushfire risk on 2
lines built side by side may
• quantitative expertise if the team expects to do a ‘deep
measure the benefits of load
dive’ into detailed climate information
reduction to minimise the
• investment or policy questions will require relevant joint probability of outage but
internal experts will not capture the potential
benefits of building the lines in
• technical and strategic expertise to explore future different corridors
network mitigation options
• customer outages sometimes
Senior managers or executives may already be considering occur in hot conditions
climate change, for example, as part of a net zero emissions when demand increases and
or risk mitigation plan, so decision-makers should be multiple assets fail, reducing
engaged to ensure that their needs and expectations supply, so a risk assessment
are met. If climate risk is still in the early stages of that considers only supply
discussion, you may need to provide additional background adaptation may not consider
information.1 changes in demand or
transmission
External stakeholders
There are a range of external stakeholders who should be • an assessment on a single
considered at the beginning of your climate risk assessment. generator may identify the
risk to facility profitability but
If the decision includes a large network investment, the will not capture the changed
Australian Energy Regulator will be a key stakeholder. When probability of outages from
using climate change information, consider engaging with the impact on all generators,
the regulator to ensure that they agree with the approach, or the potential benefits
including the way in which confidence and uncertainty in the of installing storage (for
climate projections are expressed. example) elsewhere in the
system
Investment analysis decisions may be triggered by
proposed rules and advice from the Australian Energy
Market Commission (particularly regarding their objective
of maintaining system security and wholesale electricity
reliability).
1 The ESCI project has created communications material that can be
used with senior executives and board members (available on the
ESCI website: www.climatechangeinaustralia.gov.au/esci).
11ELECTRICITY
USER GUIDE Step 1: Understand context S E C TO R
C L I M AT E
I N F R M AT I N
PR JECT
State pricing and regulatory authorities (e.g. IPART and ESC) may need to be
involved given their focus on retail network pricing and regulation.
Climate risk is a system risk and so AEMO and other market participants may
respond to changing conditions in a way that has an impact on ranking the
adaptation options.
There may be other organisations such as Energy Networks Australia that have
conducted similar risk assessments and could be an excellent source of advice.
Financial institutions are encouraged, and increasingly expected, to disclose
climate-related risk in projects they support so they should be considered as
stakeholders.2,3,4
Insurers are particularly concerned about the increasing severity and frequency
of extreme weather events. An organisation demonstrating that they have
considered and mitigated climate risk in their asset and system management
practices or investments may obtain reduced premiums to protect against climate
hazards.
Retailers and consumers are important stakeholders, so you should consider how
to engage them early in the risk assessment.
What would you like the risk assessment to achieve?
Consider the drivers for the risk assessment. While future system performance
may be the primary focus of a climate risk assessment, there may be other
motivating factors. For example, are you complying with a directive from
management to consider climate risk? Are you responding to interest and
pressure from external stakeholders? The World Economic Forum (World
Economic Forum, 2021) ranks weather and climate risk among the highest
likelihood and impact global risks (see Figure 4), which is resulting in increased
scrutiny from inside and outside companies.
A meeting with key stakeholders may reveal additional objectives. Is there an
immediate sense of urgency to address climate risks because impacts are already
apparent? If so, list some examples of climate hazards and impacts. Are there
potential opportunities in a changing climate?
2 Climate-Related and Other Emerging Risks Disclosures: Assessing Financial Statement
Materiality Using AASB Practice Statement 2 (AASB, AUASB, 2018).
3 The Task Force on Climate-related Financial Disclosure (TCFD) provides a framework and
recommendations on disclosing financial risk TCFD (2017). Recommendations of the Task
Force on Climate-related Financial Disclosures. Task Force on Climate-related Financial
Disclosures, https://www.fsb-tcfd.org/wp-content/uploads/2017/06/FINAL-2017-TCFD-
Report-11052018.pdf
4 Proposals to Enhance Climate-Related Disclosures by Listed Issuers and Clarification of
Existing Disclosure Obligations (Financial Conduct Authority, 2020).
12ELECTRICITY
USER GUIDE Step 1: Understand context S E C TO R
C L I M AT E
I N F R M AT I N
PR JECT
Top 10 risks in terms of Top 10 risks in terms of
Likelihood Impact
Categories
1 Extreme weather 1 Climate action failure
2 Climate action failure 2 Weapons of mass destruction
Economic
3 Natural disasters 3 Biodiversity loss
4 Biodiversity loss 4 Extreme weather
Environmental
5 Human-made environmental disasters 5 Water crisis
6 Data fraud or theft 6 Information infrastructure breakdown Geopolitical
7 Cyberattacks 7 Natural disasters
8 Water crisis 8 Cyberattacks Societal
9 Global governance failure 9 Human-made environmental disasters
Technological
10 Asset bubbles 10 Infectious diseases
Figure 4: In 2020, the World Economic Forum Global Risks Report put extreme
weather and climate change risk at the top of its most likely, and highest, world
economic impacts (World Economic Forum, 2021)
Being clear about goals and objectives will help to determine the metrics that will
be used to assess the risk (Step 2), the climate scenario(s) to explore (Step 3),
and potential risk treatment options (Step 5).
Document the process
It is important to document the discussion and key decisions. Climate risk
assessments will need to be revisited as the science improves and as the
economic, technological, demographic and political landscape changes. Careful
documentation is also important to support the legitimacy of stakeholder
consultation.
Iterative nature of climate risk assessments
Climate projections are based on global climate models
that are regularly updated. These coordinated efforts are A climate risk assessment
part of the Coupled Model Intercomparison Project (CMIP),
conducted on a decision
supported by the World Climate Research Program. The
today will need to be
ESCI project climate information products are based on
CMIP Phase 5 climate models, with new climate models repeated from the beginning
being assessed in CMIP Phase 6. As these new models the next time that decision is
become available, the climate information provided by ESCI assessed.
will still be relevant but new information should be assessed.
Finally, the National Electricity Market is dynamic; although AEMO’s Integrated
System Plan (ISP) takes a 20-year view of the NEM, the ISP is reissued every
2 years as the grid evolves in response to policy, economic, population
and technology changes. These changes should be included in climate risk
assessments.
13ELECTRICITY
USER GUIDE Step 1: Understand context S E C TO R
C L I M AT E
I N F R M AT I N
PR JECT
References
Climate information products
BoM and CSIRO (2020) State of the Climate Report.
useful for identifying climate
https://www.csiro.au/-/media/OnA/Files/State-of-the-
Climate-2020.pdf hazards
The ESCI project produced
NESP (2020) Scenario analysis of climate-related physical climate information products
risks for buildings and infrastructure: climate science guide. that provide an overview of
https://climate-kic.org.au/our-projects/cmsi/ climate change and more detailed
information. These are available
World Economic Forum (2021). The Global Risks Report
from the ESCI website and can
2021 (16th edition) A report by the World Economic Forum
be used to scan for future climate
in partnership with Marsh McLennan, SK Group and Zurich
hazards. These include:
Insurance Group. https://www.qbusiness.pl/uploads/
Raporty/globalrisk2021.pdf maps showing how the return
period for extreme hazards (such
as high temperature, extreme
rainfall, high fire weather days)
may change over the coming
decades under different climate
scenarios
summary tables showing how
key climate variables are likely to
change in different regions
case studies of climate risk
assessments for electricity sector
assets and decisions
www.climatechangeinaustralia.gov.au/esciELECTRICITY
S E C TO R
USER GUIDE C L I M AT E
I N F R M AT I N
PR JECT
2
Identify historical
climate risk
Overview
Climate risk analysis and evaluation for investment and Understand
planning decisions require an understanding of the historical 1 context
relationship between weather and climate and asset/system
performance. Climate projections can then be used to help
estimate future performance.
Identify
An assessment of the risk that climate change presents to 2 historical
an organisational process begins with an examination of the climate risk
historical impacts of weather and climate. This is Step 2 of
the ESCI Climate Risk Assessment Framework (Figure 1).
Analyse future
How is weather included in system 3 climate risk
decisions now?
The objective of Step 2 is to identify, or develop models for,
the relationship between performance and weather that
Evaluate all
can be used with climate projections to estimate future 4 risks
performance risks.
There may already be industry models that can be applied,
such as design specifications or statistical models that
Treat climate
describe the relationship between energy supply and
temperature (Figure 2).
5 risks
1.0 GHI=1400 W m-2 Figure 1: The ESCI Climate Risk
GHI=1000 W m-2 Assessment Framework
GHI=800 W m-2 GHI=1200 W m -2
0.8
Normalised AC power
GHI=600 W m-2
Figure 2: Power
0.6
conversion models developed for the
GHI=400 W m-2 ESCIcase study on extreme heat risk
0.4 (variable renewable energy). The solar
farm model1 describes output as a
GHI=200 W m-2 function of global horizontal irradiance
0.2 (GHI) and temperature. GHI is the
shortwave radiation received from above
by a horizontal surface. Direct normal
0.0 irradiance (DNI) and wind speed are
0 10 50 30 40 50 60 included in the model but not shown on
the graph.
Ambient temperature (°C)
20.0°C
1.0
1 Developed35.0°C
using the tool PVLIB (Holmgren et al. 2018 ) and PVWatts calculator for solar
outputs (Dobos 2014). The model assumes a single axis tracking installation using the
37.5°C
following
0.8 configuration: SMA Sunny Central 850CP XT inverter and a DC-to-AC ratio of 1:2.
d AC power
40.0°C
42.5°C
0.6
45.0°C
15ELECTRICITY
USER GUIDE Step 2: Identify historical climate risk S E C TO R
C L I M AT E
I N F R M AT I N
PR JECT
Has an historical relationship between weather and
performance been identified?
If industry models do not already exist, building a model that captures the
relationship between weather and performance is usually quite straightforward.
The impact of weather is already built into many processes and asset
specifications. Examples include line ratings based on ambient temperature, and
vegetation clearing scheduled during an historically low-bushfire-risk season.
There are likely to be organisational records that relate system impacts to
weather. For example, structural failures (Figure 3) can be related to severe
convective winds (Figure 4).
10
9
Number of structures
8
7
6
5
4
3
2
1
0
50
65
60
75
70
85
80
95
90
95
0
5
10
10
20
0
0
20
20
19
19
19
19
19
19
20
19
20
19
19
19
20
Year
Figure 3: Transmission tower structure functional failure history. (Source: AusNet, AMS
10-77 Transmission Line Structures. 2023-27 Transmission Revenue Reset, Section 3)
The Bureau of Meteorology supplies quality-assured historical weather and
climate data2. For each climate variable of interest, try to establish a statistical
relationship with historical asset/system performance. This could be a simple
linear regression with the fit providing an estimate of uncertainty. Another
common statistical method is Monte Carlo analysis which deals with uncertainty
through assigning a probability curve of likely outcomes. This can be used
wherever there is a range of input data, such as the frequency and timing of a
weather event. For example, a transformer’s performance relative to temperature
can be calculated using Monte Carlo simulations informed by probability curves
based on historical climate information.
2 The ESCI project has used the years 1986–2005 as a baseline for climate projections
(consistent with the IPCC), but data are available back to 1980 (earlier for hydrology) on the
ESCI website.
16ELECTRICITY
USER GUIDE Step 2: Identify historical climate risk S E C TO R
C L I M AT E
I N F R M AT I N
PR JECT
Figure 4: Mean historical frequency of conditions favourable for severe convective
winds compared with outage events (11 events, 1959–2020). Source: BoM analysis
(Brown, 2021) and AusNet Services data used as part of the ESCI Case Study on the
risk severe convective winds present to transmission lines.
Identify important parameters for the risk analysis
When identifying historical weather and climate hazards, be specific about hazard
thresholds associated with impacts, such as temperatures over 45 °C or wind-
gusts above 30 m/s. Consider also whether averages or extreme values are most
relevant. Identify the temporal resolution that is needed for the historical analysis,
as the same resolution (if possible) will be used for future climate analysis. Half-
hourly temperature data may be needed for demand modelling and sub-hourly
wind data for wind-stress or power modelling. Daily/monthly fire weather data
may be most useful, and seasonal streamflow data may be appropriate for hydro-
generation modelling.
Spatial scale is also important. Historical weather and climate information may
be available only at specific locations, such as Bureau of Meteorology real-time
monitoring sites, which provide daily maximum and minimum temperatures.
These locations may not be close to your areas of interest, limiting the value of
the data. Future climate information is available on a 5-km grid, and as time-series
for 168 locations across the national electricity market—check how well these
correspond to the locations for historical asset/system performance data sets.3
Once you have developed a model of the relationship between historical climate
and asset/system performance, and identified important parameters for the
analysis of future risk, then you are ready to move on to Step 3: Analyse Future
Climate Risk.
3 The ESCI project also provides historical and projected summary data for regions with similar
climates across Australia.
17ELECTRICITY
USER GUIDE Step 2: Identify historical climate risk S E C TO R
C L I M AT E
I N F R M AT I N
PR JECT
References
Brown A and Dowdy A. ‘Severe convection-related winds in Australia and their
associated environments’ (2021) 71(1). Journal of Southern Hemisphere Earth
Systems Science 30–52.
Dobos AP (2014) PVWatts version 5 manual (No. NREL/TP-6A20-62641).
National Renewable Energy Lab (NREL), Golden, CO.
Hersbach H, Bell B, Berrisford P, et al. ‘The ERA5 global reanalysis’ (2020)
146(730) Quarterly Journal of the Royal Meteorological Society 1999–2049.
doi:10.1002/qj.3803.
Holmgren WF, Hansen CW and Mikofski MA. ‘pvlib python: A python package for
modeling solar energy systems’ (2018) 3(29) Journal of Open Source Software
884.
For more information
CSIRO: www.csiro.au/en/Contact
BOM: energy@bom.gov.au www.climatechangeinaustralia.gov.au/esciELECTRICITY
S E C TO R
USER GUIDE C L I M AT E
I N F R M AT I N
PR JECT
3 Analyse future
climate risk –
quantified hazards
Overview
Our future climate will be different from that of the past and
Understand
the impact of weather on a future energy system in a future 1 context
climate will become increasingly significant. For example,
Figure 1 shows that a small shift in mean temperatures will
result in a large shift in the frequency of higher than usual
temperatures, which is an important hazard for electricity Identify
infrastructure. 2 historical
climate risk
Analyse future
3 climate risk
Evaluate all
4 risks
Treat climate
5 risks
Figure 1: Small mean temperature changes can dramatically
Figure 2: The ESCI Climate Risk
change the incidence of very high temperatures. In this
Assessment Framework
example, an increase of less than 1 °C in mean temperature
leads to a six-fold increase in monthly days 2 °C higher than
average.
Step 3 of the ESCI Climate Risk Assessment framework
(Figure 2) provides a standard process and guidance which
allows risk related to future climate to be consistently
integrated into sector planning and risk modelling. This step
uses the relationship between performance and historical
weather conditions established in Step 2 to analyse
performance in a future climate.
Determining future climate risk requires careful selection
and comparison of climate scenarios. The ESCI project has
delivered high-resolution climate projection data, 5–12 km
across the NEM, at sub-daily intervals, to 2100. The project
recommends a minimum standard climate data set, tailored
19ELECTRICITY
USER GUIDE Step 3.1: Analyse future climate risk – quantified hazards S E C TO R
C L I M AT E
I N F R M AT I N
PR JECT
for the electricity sector, that can be used for most risk assessments. The use
of standard data allows comparison of risk assessments across the sector for
investment decisions and system-wide risk assessments and captures uncertainty
in the future climate. The recommendation is not intended to be restrictive but
facilitates efficient production of reliable information.
Where the climate risk assessment suggests a significant risk, or where a high
value investment is involved, the advice of climate experts should be sought.
Defining the scope
Choosing appropriate climate information for the risk analysis depends on a
number of parameters—some of which were considered in Step 2:
• What is the key hazard? Is the historical performance dominated by a
single hazard (e.g. high temperature) or multiple hazards (e.g. power line
transmission ratings are affected by both wind and temperature)?
• Are thresholds more important or is the range of variance important?
Thresholds could include, for example, performance above 45 °C, or
engineering built to withstand 1 in 100-year events. Variance can be explored
with time series, available as daily, monthly, annual or sub-daily data.
• What time frame is important? This is likely to be guided by the lifetime of the
asset (e.g. next 20 years or next 50 years).
• What greenhouse gas emissions pathway is most relevant? This will depend
to some extent on the purpose of the risk analysis. The project recommends
scenario analysis using at least 2 pathways.
These questions can be used to select appropriate climate data through the the
ESCI website (Figure 3).1
Figure 3: The ESCI Climate Data portal
allows users to select a range of climate
information. The most appropriate
climate information depends on the
scope of the analysis and outcomes
of Step 2 in the ESCI Climate Risk
Assessment Framework.
1 In some cases the most appropriate information can be found in the broader Climate Change
in Australia (CCiA) website. Data on the ESCI portal have been tailored so that they are more
likely to address electricity sector questions: see Key concepts—ESCI recommended data sets.
20ELECTRICITY
USER GUIDE Step 3.1: Analyse future climate risk – quantified hazards S E C TO R
C L I M AT E
I N F R M AT I N
PR JECT
Conducting a climate risk analysis
Future climate risk can be assessed using the model developed in Step 2 which
captures the historical relationship between weather/climate and asset/system
performance. This model can use projected climate data as an input to estimate
future asset/system performance.
Climate projections are, by definition, uncertain therefore the ESCI project
recommends 2 ways of expressing uncertainty: a) using different climate
scenarios; b) using a collection (‘ensemble’) of climate models. These 2 methods
can be combined (Figure 4 shows an analysis using 3 climate scenarios and 4
climate models).
Using climate scenario analysis
The Intergovernmental Panel on Climate Change (IPCC) describes changes in
the future climate using ‘representation concentration pathways’ (RCPs) for
greenhouse gas emissions.2 Climate scenarios are derived from climate model
simulations driven by representative concentration pathways and provide
information about projected changes in variables such as temperature, rainfall
and windspeed. Figure 4 shows a climate risk analysis of the impact of future
temperature trends on transmission line ratings3 using RCP2.6, RCP4.5 and
RCP8.5.
0% 330kV 840 500kV 3340
85°C line 120°C line
Theoretical future derating (%)
–1% 830 3300
Static line rating (MVA)
Static line rating (MVA)
–2%
820 3260
–3%
810 3220
–4%
800 3180
–5%
RCP 2.6 790 RCP 2.6 3140
–6% RCP 4.5 RCP 4.5
RCP 8.5 RCP 8.5
–7% 780 3100
2003 2038 2058 2078 2003 2038 2058 2078
Figure 4: Projected de-ratings for a 330kV, 85 °C line (left), and a 500kV, 120 °C line
(right) in New South Wales under 3 climate scenarios (RCP 2.6, 4.5 and 8.6) using 4
climate models for each scenario. (Source: ESCI case study—the impact of extreme
temperatures on transmission lines.)
Using an ensemble of climate models
The plausible range of a future climate variable can also be estimated by using
data derived from an ensemble of climate models. If the analysis uses a single
climate variable (e.g. temperature), then the data from an ensemble of climate
models can provide a probability distribution for the future range of that variable
(see Figure 5) and therefore the range of future system performance. For
example, a transformer’s performance in a future climate can be estimated using
the historical relationship derived in Step 2 and a Monte Carlo simulation informed
by the range of potential future temperatures taken from several different climate
models.
2 Covered in detail in the ESCI key concept—Choosing representative emissions pathways. The
pathway number represents the ‘radiative forcing’ or warming potential of the greenhouse
gas concentration in watts per square metre.
3 See ESCI case study—The impact of extreme heat on transmission lines.
21ELECTRICITY
USER GUIDE Step 3.1: Analyse future climate risk – quantified hazards S E C TO R
C L I M AT E
I N F R M AT I N
PR JECT
It is very important to note that if the risk assessment requires multiple climate
variables (e.g. if both wind and temperature are important), then the analysis
of the system or asset performance in a future climate should be done for each
climate model and the uncertainty assessed by comparing the output of these
analyses to give the range of future performance. It is not appropriate to combine
data from different climate models (e.g. wind data from one climate model and
temperature data from a different model) as individual climate models have
internally consistent climatology. Combining variables from different climate
models can produce implausible results (e.g. snow on a hot day).
Days over threshold
Figure 5: Time series of days per year when the forest fire danger index is over 25
(‘very high fire danger’) and 50 (‘severe fire danger’) near Adelaide, projected from
2020 to 2100. (Source: ESCI case study—bushfire risk and transmission). These plots
combine the time series from 8 different climate models, using RCP8.5, with the light
blue showing the range for all models, the dark blue showing the range for 80% of the
models and the red line showing the median value.
Climate data tailored to electricity sector needs are available on the ESCI website.
Additional or alternative climate information can be accessed from a number
of sources, the most credible and comprehensive being the Climate Change
in Australia web portal.4,5 Other relevant information sources include the CMSI
climate science guidance6 and the NESP Earth Systems and Climate Change Hub.7
More information on choosing future climate scenarios and climate data sets for
the analysis is presented below.
Choosing RCPs
Representative concentration pathways are plausible future scenarios but are
not predictions; they depend on a range of assumptions about contributions
to climate change. For example, will we continue to burn fossil fuels at an ever-
increasing rate, or will we continue shifting towards renewable energy?
The 4 most commonly used RCPs range from very high (RCP8.5) through to very
low (RCP2.6) future greenhouse gas concentrations.8
4 www.climatechangeinaustralia.gov.au/
5 See ESCI Key Concepts—Using Climate Change in Australia.
6 https://climate-kic.org.au/our-projects/cmsi/
7 http://nespclimate.com.au/publications/
8 The ESCI project provides data sets for RCP4.5 and RCP8.5. However, a simple scaling
approach can be used to adjust these data sets to provide data for an RCP2.6 scenario. See
ESCI key concepts—scaling data sets for RCP 2.6.
22ELECTRICITY
USER GUIDE Step 3.1: Analyse future climate risk – quantified hazards S E C TO R
C L I M AT E
I N F R M AT I N
PR JECT
Table 1 provides guidance for how to match the selection of the RCP to the
purpose of the risk assessment. The ESCI project recommends that a climate risk
analysis should use 2 pathways: RCP4.5, a moderate pathway, and RCP 8.5, a very
high pathway.
Table 1: Time frames and recommended RCPs for different purposes
Purpose of risk assessment Timeframe and RCP
Physical risk assessment as TCFD9 recommends using scenarios that give
part of a financial reporting a global warming of 2 °C and 4 °C by the
requirement year 2100. The CMSI guidance10 recommends
using RCP2.6 for a 2 °C warming scenario and
RCP8.5 for a 4 °C warming scenario.* However,
RCP4.5 has a 40% chance of keeping global
warming below 2 °C by 2100 so it is also worth
considering.
Stress-testing the Consider the greatest plausible changes for the
performance of an asset or key hazards, which are likely to be provided by
system or process in a future using RCP 8.5.
climate
(The ESCI case study on extreme compound
events can also provide stress-testing
scenarios.)
Assessing the likely range A range of RCPs and climate models should be
of performance of a future used to assess asset or system performance.
investment** ESCI provides recommendations on ‘worst/
best case’ scenarios to use in these risk
assessments.11
An exploration of the system The AEMO ISP provides scenarios for the next
performance under different 20 years,12 each of which is associated with
AEMO ISP scenarios (see a different RCP*. For example, the 2021 IASR
sidebar) ‘Central’ scenario is associated with RCP4.5, the
‘diversified technology’ scenario is associated
with RCP2.6 and the ‘slow growth’ scenario is
associated with RCP7.0.
Notes
* The differences in RCPs and global warming are small up to 2040, with the differences becoming more
important from 2050.
**Climate variability over the next 1–10 years is strongly influenced by natural variability;13 climate models have
limited predictive skill over this period so historical risk can be a good guide.
9 TCFD (2017) The use of scenario analysis in disclosure of climate-related risks and
opportunities. https://assets.bbhub.io/company/sites/60/2020/10/FINAL-TCFD-Technical-
Supplement-062917.pdf
10 https://www.cmsi.org.au
11 See ESCI Key Concepts—ESCI Recommended data sets—testing and validation.
12 AEMO Draft 2021 Inputs, Assumptions and Scenarios Report https://aemo.com.au/-/media/
files/electricity/nem/planning_and_forecasting/inputs-assumptions-methodologies/2021/
draft-2021-inputs-assumptions-and-scenarios-report.pdf?la=en
13 See ESCI key concepts—Climate projection confidence and uncertainty.
23ELECTRICITY
USER GUIDE Step 3.1: Analyse future climate risk – quantified hazards S E C TO R
C L I M AT E
I N F R M AT I N
PR JECT
Climate models and downscaling
Global climate models (GCMs) are rigorous, complex and well-tested representations
of physical processes in the climate system. The models run on supercomputers
that provide solutions for multiple variables, time scales and regions. The models are
constantly being updated as the science of climate change advances. There are 40
CMIP514 climate models accepted by the IPCC as authoritative. The ESCI project uses
6 of these15 that perform well in the Australian region.
GCMs have coarse spatial resolution (about 100–150 km between data points),
which limits their ability to simulate small-scale processes including extreme
weather events. The GCMs can be downscaled16 using high-resolution regional
climate models that may provide additional insights and the potential for better
information about extreme weather events.
The ESCI project generated 16 data sets from the GCMs using regional climate
models (RCMs): the cubic conformal atmospheric model (CCAM, developed by
CSIRO); the Bureau of Meteorology Atmospheric high-Resolution Projections for
Australia (BARPA); and NARCliM (NSW and ACT Regional Climate Modelling)
developed by a NSW Government partnership. The data sets are augmented
by a tailored post-processing technique called quantile matching for extremes
(Dowdy, 2020), which produces data sets that are ‘application-ready’ (free of bias
compared to observations and available on a 5 km grid) and appropriate for the
analysis of changes to averages as well as climate extremes at the daily timescale.
The ESCI project recommends using a minimum of 4 data sets which can be
considered representative of 4 climate futures, described by general terms like hot,
wet, dry, warm (Table 2). Depending on the region of interest, stakeholders can
choose data sets that represent the range of possible future climate scenarios.
Table 2: The global climate model and downscaling model used to generate the 4
recommended data sets, and the general categorisation of the ‘climate future’ that
each model produces. The regions are shown in the map in Figure 6a
Global climate Downscaling Northern Southern Eastern Inland
model model Australia Australia Australia (Rangelands)
1 GFDL-ESM2M CCAM Warm, Dry Warm, Dry Warm, Dry Warm, Dry
2 CanESM2 NARCliM-j Hot Warm Hot Hot
3 ACCESS-1.0 BARPA Mid case Mid case Mid case Mid case
4 NorESM1-M CCAM Warm, wet Mid case Warm, wet Warm, wet
The 4 recommended projections can be seen in relation to the wider range of
40 GCMs in scatterplots of temperature and rainfall change (Figure 6b). The 4
models don’t span the entire range in every case; a subset of just 4 models can’t
achieve this. These recommended data sets provide a minimum standard that can
be used in most risk assessments, enabling consistency and comparability.17 They
are relevant to the electricity sector and are scientifically credible.18
14 See ESCI Key Concept - CMIP6 models
15 Downscaling is also provided for Access1.3 using NARCliM. Access1.3 was not identified in the
CCiA Technical Report as performing well in the Australia region.
16 Downscaling may not always add value and has important limitations—for more information,
refer to ESCI key concepts factsheet: climate models and downscaling (also Virgilio 2020 and
Fiedler 2021).
17 Suggested additional cases for Southern Australia are ACCESS-1.0-NARCLIMk-QME (dry
future) and CanESM2-CCAM-QME (hot future), also available through the ESCI portal.
18 See Key concepts—ESCI Recommended data sets—testing and validation.
24You can also read