The UK weather during 2012: a review - January 2013 Met Office - Data provided by Met Office National Climate Information Centre
←
→
Page content transcription
If your browser does not render page correctly, please read the page content below
The UK weather
during 2012:
a review
January 2013

Met Office

     MetOffice_WeatherReview_2012_Julia                                  -1–
     © Crown copyright 2008                                             Data provided by
                                          Met Office National Climate Information Centre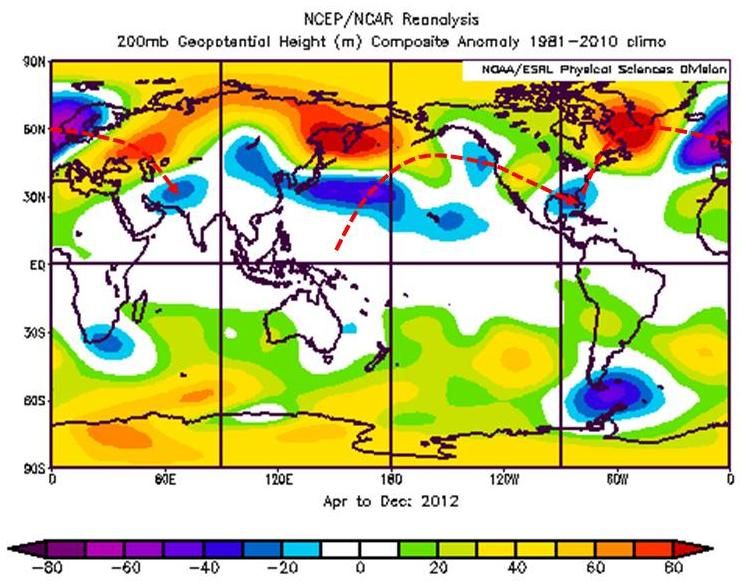
.

Contents

Introduction ......................................................................................................................... 2

UK climate overview ........................................................................................................... 3

Overview of the global climate in 2012 .............................................................................. 4
   Global warming in 2012 ..................................................................................................... 7

The ‘dry’ season .................................................................................................................. 8
   The January windstorm and the Hazard Impact Model .....................................................10
   European cold weather and sudden stratospheric warming ..............................................11
   ‘Spot on’ snow forecast supported by latest Met Office science ........................................12

The ‘wet’ season.................................................................................................................13
   Localised summer flooding and the UK ensemble ............................................................15
   Olympics 2012 and the science showcase........................................................................16
   The UK’s wet summer, the jet stream and climate change ................................................21
   Record low for Arctic sea ice extent ..................................................................................22
   Hurricane Sandy and the value of ensemble forecasting ..................................................23
   2012 hurricane season comes to an end ..........................................................................24
   Extreme rainfall in the UK .................................................................................................25

Concluding remarks ...........................................................................................................26

ANNEX – UK Monthly Summary ........................................................................................27

ANNEX - The year’s major events in brief ........................................................................28

ANNEX – the 2012 UK climate summary...........................................................................31

                                                                1
© Crown copyright 2012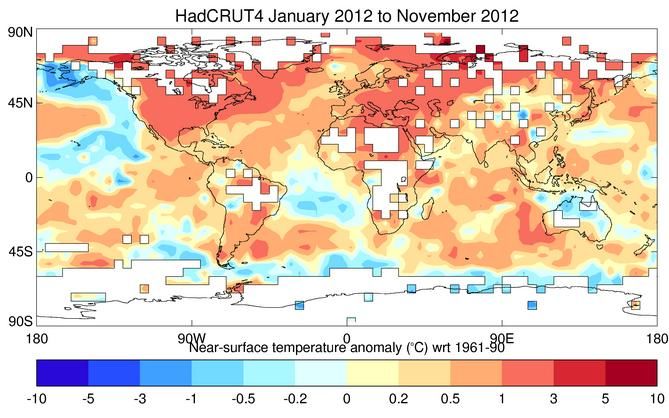
Introduction
The UK’s weather in 2012 could be characterised as a year of two seasons – the dry,
followed by the wet. Once again, the great variability in the UK’s weather has emphasised
the importance of skilful, comprehensive predictions of our weather and climate for effective
decision making, mitigation of risks and realisation of opportunities. And again, events during
2012 highlighted the considerable direct and indirect impacts that our weather has on us –
our livelihoods, property, well-being and prosperity.

This paper provides an overview commentary on our weather during the past year. It is not
intended to be a comprehensive assessment (though many analyses of this year’s conditions
and the ongoing science developments are routinely published in peer-reviewed literature
and elsewhere). Rather, it aims to give a few representative snapshots of the Met Office’s
successes and challenges in providing the best possible advice and guidance to users
across all sectors. A number of case studies illustrate applications of the ongoing long-term
research and development, and its implications for improved accuracy and confidence in our
predictions.

                                            2
© Crown copyright 2012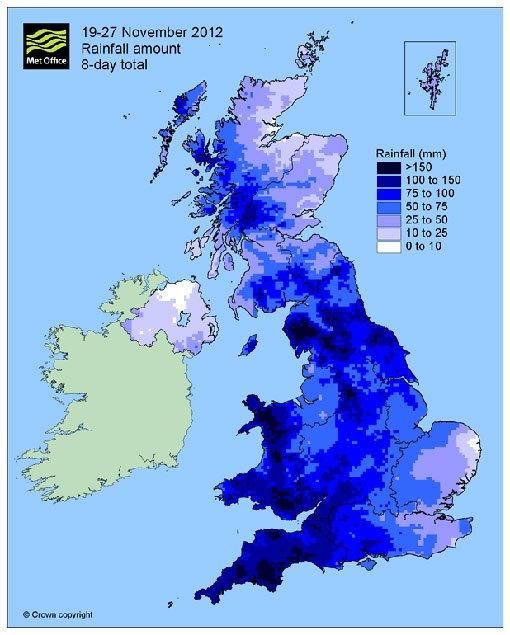
UK climate overview
Provisional figures for the UK’s climate during 2012 (Figure 1) show a particularly
unremarkable year in terms of average temperatures, in contrast to a particularly remarkable
year of rainfall patterns. Overall, 2012 was the second wettest year in the UK national record
dating back to 1910, and just a few millimetres short of the record set in 2000. Exceptionally
wet conditions occurred across many parts of England, and especially in north east England.
2012 was the wettest year on record for England and third wettest for Wales. Only in north
and western areas of Scotland and west Northern Ireland were annual rainfall totals below
average (the 17th wettest annual total for Scotland and 40th wettest for Northern Ireland).

The annual climate averages mask the great variety and diversity of weather conditions that
we experience over the course of a year however. Further details of this variability and the
most notable weather are provided in the Annexes. Overall, 2012 might be characterised as
a ‘year of two seasons’. The first three months (January to March inclusive) were notably dry
(and generally warmer than average), continuing the recent run of dry winters and leading to
drought concern in England. In stark contrast, the remainder of the year has been
remarkably wet (and generally cooler than average). There have been numerous incidences
of flooding and storm damage, with the some regions being affected by a number of severe
events through the year. April and June were exceptionally wet.

       Figure 1: Provisional annual mean temperature and rainfall maps for 2012, shown relative to
       the long-term 1981-2010 mean climate.

In what has been an exceptionally wet year Met Office forecasts have risen to the
challenge with rainfall forecasts correct 72% of the time, well above the target of 60%
(note it is difficult to forecast rainfall at a pinpoint location, therefore the target for this
element is not as high as for others as currently defined. For example, one location may
have rain and a location a mile away may remain dry). The importance of accurate
forecasting has also been very apparent. Surveys have shown that 76% of the public think
our forecasts are accurate and 90% find them useful in helping them plan, prepare and
protect themselves from the weather.

                                              3
© Crown copyright 2012
Overview of the global climate in 2012
2012 was characterised by extreme weather around the world, from the US drought to UK
floods. All are related to continued major perturbations in the global climate system driven by
a range of possible factors. The focus of this analysis will be April to December 2012 when
the UK experienced two record-breaking wet months (April and June) and one of the worst
summers on record.
The major La Nina that generated large and damaging variations in weather and climate
around the world during 2010 and 2011 terminated during 2012 to be replaced by a weak El
Nino. However this has been short-lived and the tropical Pacific Ocean is once more entering
a period of near-normal (neutral) conditions. On the other hand major anomalies in ocean
surface temperatures, particularly in the North Pacific and North Atlantic, have persisted
through 2012 (Figure 2, left panel) and are likely to have contributed to the major
displacements in the jet stream that have characterised the climate of 2012. Likewise Arctic
sea ice cover declined to a record low level in September 2012 and there is increasing
scientific evidence that this may affect the position of the jet stream over the North Atlantic.

       Figure 2: Left: Global sea surface temperature anomalies (°C) for April to December 2012.
       Right: Global anomalies of satellite-observed Outgoing Longwave Radiation (OLR). OLR acts
       as a good proxy for rainfall with lower than normal values (blue to purple) indicating increased
       rainfall and vice versa.

Despite El Nino/La Nina being in near neutral conditions, La Nina-like patterns in tropical
rainfall have continued to persist, with above normal rainfall across the Philippines and the
tropical West Pacific (Figure 2, right panel). Figure 2 also highlights the intense and
damaging drought over the US and the above normal rainfall over West Africa, accompanied
by serious flooding events, and over the Caribbean. The perturbations to the tropical heating
pattern seen in Figure 2 (right panel) have likely contributed to the large amplitude wave
patterns that have characterised the northern hemisphere circulation during 2012 (Figure 3).

The prolonged spell of wet weather over the UK lasting from April to December was
associated with a persistent trough over the UK with high pressure to the northwest, evident
in Figure 3. At the same time, the North Atlantic jet stream, which generates and guides the
weather systems that bring rainfall to the UK, has extended eastwards and been displaced
southwards compared to its climatological position (Figure 4). This has driven enhanced
cyclonic development to the south west of the UK and continued to reinforce the trough over
the UK.

                                                4
© Crown copyright 2012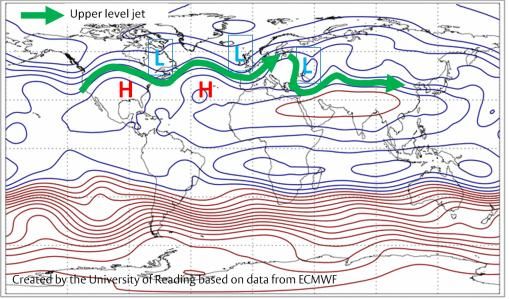
Figure 3: Mean
                             circulation anomalies
                             for April – December
                             2012 based on upper
                             troposphere heights;
                             blue/purple shading
                             indicates upper
                             troughs and
                             yellow/red, upper level
                             ridges. Red dashed
                             arrows indicate
                             propagation of
                             planetary scale waves
                             potentially triggered by
                             anomalies in tropical
                             rainfall (i.e. heating).

Figure 4: Mean
upper tropospheric
winds for April –
December 2012
(upper panel) and
30-year average
climatology (lower
panel). Wind
direction is shown by
the arrows and wind
strength by the
colour shading.

                         5
© Crown copyright 2012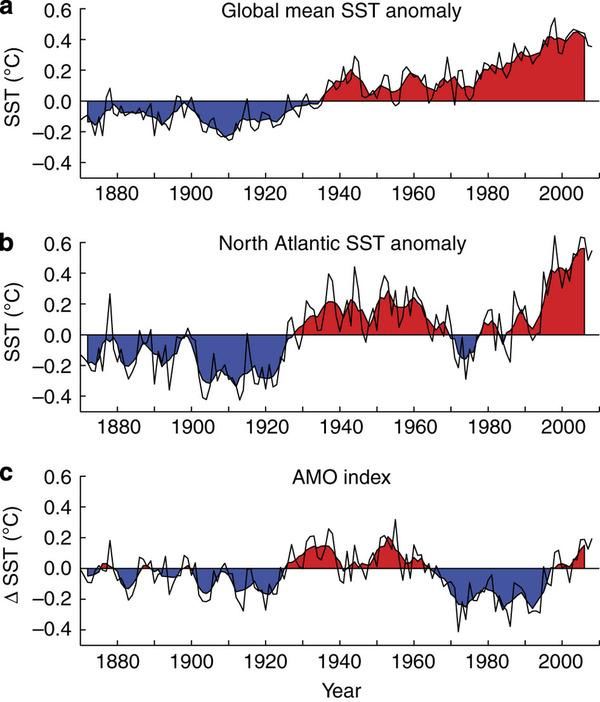
The global context of this year’s extreme rainfall demonstrates the complexity of
understanding the influence of a range of possible drivers. As is often the case the Tropics
have likely played a role, but it is also probable that the extreme warmth of the north-west
Atlantic and the record loss of Arctic sea ice have also been instrumental in driving the jet
stream south of its normal position.

In addition to these factors, both the Atlantic Multi-decadal Oscillation (AMO: a pattern of low
frequency variability in North Atlantic Ocean temperatures) and the gradual warming of the
oceans due to climate change, may also have been instrumental in the heavy rainfall that the
UK has experienced this year. Figure 5 shows the evolution of global and North Atlantic sea
surface temperatures over the last 140 years, with the bottom panel showing the multi-
decadal variability once the global warming signal is removed.

                                                                        Figure 5: Time series of the
                                                                        global and North Atlantic sea
                                                                        surface temperature
                                                                        anomalies. The AMO index is
                                                                        defined as the North Atlantic
                                                                        sea surface temperature
                                                                        anomalies with the global
                                                                        warming trend removed.

Since 2000 the phase of the AMO has been such as to amplify the global warming trend so
that the North Atlantic is now significantly warmer than at any time in the 20 th century (Figure
5). Recent research by Sutton and Dong (Nature, 20121) has shown that the warm phase of
the AMO favours wetter summers and autumns over the UK with potential increases in
rainfall of over 10%. Coupled with the additional warming from climate change the
atmosphere over the North Atlantic is predisposed to carry more moisture potentially
resulting in heavier rainfall when it rains.

1
 Sutton and Dong, (2012), Atlantic Ocean influence on a shift in European climate in the 1990s,
Nature Geoscience, 5, 788–792

                                                6
© Crown copyright 2012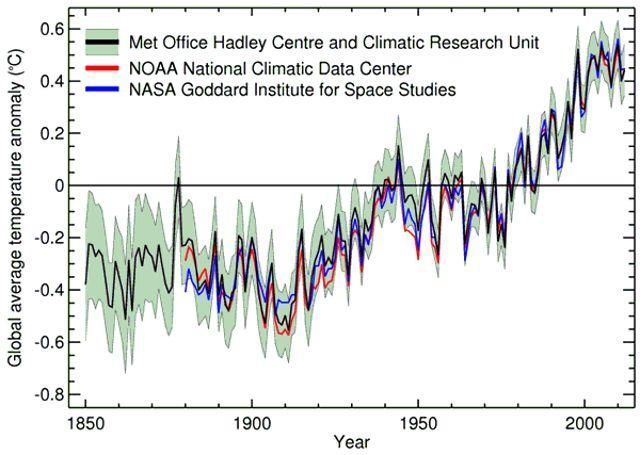
Global warming in 2012
Preliminary analysis suggests that 2012 is on course to be the 9th warmest on record in
global mean temperature, according to the World Meteorological Organization (WMO). Using
information to October from three leading global temperature datasets, including HadCRUT4
                                                                   compiled by the Met Office
                                                                   and the University of East
                                                                   Anglia, the WMO say the 2012
                                                                   global average temperature is
                                                                   14.45 °C. This is 0.45 ±0.10°C
                                                                   above the 1961-1990 average.
                                                                   Taking into account the range
                                                                   of uncertainty in observing
                                                                   global surface temperature,
                                                                   scientists from the Met Office
                                                                   suggest that 2012 is very likely
                                                                   to be between the 4th and 14th
                                                                   warmest year in a record
                                                                   dating back to 1850. Final
                                                                   figures for the whole of 2012
  Global near-surface temperature in 2012 (Jan to Nov inclusive)   will be available in March
  compared to the 1961-1990 average                                2013.
                                                                   The natural variability of our
climate is driven in large part by the El Niño Southern Oscillation (ENSO) in the tropical
Pacific Ocean. In the El Niño phase, global temperature tends to rise, whereas in the La Niña
phase it tends to fall. Due to a La Niña through the first part of the year, and its lingering
effects on global ocean temperatures, 2012 is shaping up to be cooler than the average for
the past decade.
The HadCRUT4 database,
published this year, includes up-
to-date data available from land
stations, new data from higher-
latitude stations giving better
coverage of Arctic climate, and
improved and more extensive
sea surface temperature data.
It is important to understand how
short-term temperature trends -
such as those associated with La
Niña and El Niño - can
temporarily run counter to, or
augment, changes happening
over the longer term. The Met
Office Hadley Centre and                 Global near-surface temperatures from 1850 to 2012 from Met
University of East Anglia                Office Hadley Centre/Climatic Research Unit HadCRUT4, NASA
temperature series provides that         GISS and NOAA NCDC
longer view, identifying the trend
that overlies short term variability. Although the first decade of the 21st century was the
warmest on record, warming has not been as rapid since 2000 as over the longer period
since the 1970s. These variations in global temperature trends are not unusual, with several
periods lasting a decade or more with little or no warming since the instrumental record
began. We are investigating why the temperature rise at the surface has slowed in recent
years, including how ocean heat content changes and how the effects of aerosols from
atmospheric pollution may have influenced global climate.

                                               7
© Crown copyright 2012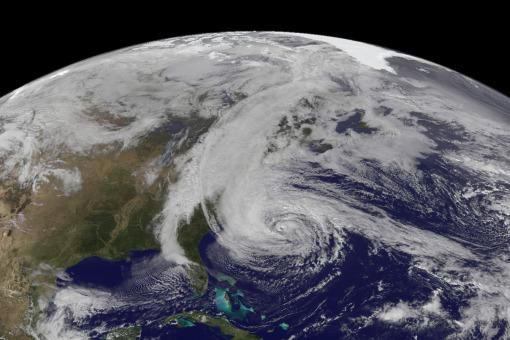
The ‘dry’ season
The dry start to the year continued a generally dry south/wet north pattern that occurred
during 2011. Figure 6 illustrates that average rainfall in 2011 saw record or near record low
amounts of rainfall in parts of the Midlands and East Anglia, while parts of Scotland had near
record amounts of rainfall.

Persistent rainfall deficits had accumulated over southern England over the preceding 3
years. The accumulated rainfall deficit for the period March 2010 to March 2012 was 384mm,
against the annual average rainfall for southern England of 782mm. Over this 2-year period
southern England therefore received only 75% of the long term average, making this the
driest such 2-year period, April to March, in the series from 1910. Parts of central England
have seen 6 consecutive seasons – from autumn 2010 through to winter 2011/12 – with
below average rainfall. This long term situation led to concern over water supplies,
particularly in central and eastern England, and the Environment Agency declared drought
conditions across several counties in spring 2012.

March 2012 was particularly dry - the 5th driest March across the UK in the series from 1910,
and the driest since 1953. Most of the UK received less than 50% of average and a broad
swathe from south-west England through to north-east Scotland, and Northern Ireland, less
than 33%. March was also a notably warm month – the third warmest on average for the UK.

       Figure 6: a) Annual mean rainfall anomaly maps for 2011, shown relative to the long-term
       1981-2010 mean climate. b) Rainfall anomalies during the 2011/12 ‘winter recharge’ season
       between October 2011 and March 2012.

Briefing provided to Government in March 2012 assessed the climatological context of the
drought, and how it related to previous major UK droughts. Multi-decadal variability in the
sign of the North Atlantic Oscillation, which is linked to AMO – a strong determinant of winter
temperature and rainfall; La Nina forcing from the Pacific; solar variability associated with the
11-year solar cycle; and stratospheric influences, may all have potentially played a role in the
2010-2012 UK drought.

                                              8
© Crown copyright 2012
We also noted however that neither the development nor the severity of the current drought
is exceptional compared with historical events, and its climatological drivers had several
similarities with past droughts.
A number of these drivers continue to be investigated. The impact of declining Arctic sea ice
on our winter weather patterns for example, favour colder drier winters and this is an area for
urgent investigation. Similarly, the impact of higher temperatures across the UK, as a result
of global warming, on UK water availability, through its influence on evaporation and soil
moisture particularly in summer, needs further investigation. The Met Office is also confident
that implemented and planned increases in the horizontal and vertical resolution of the Met
Office Hadley Centre climate model should deliver more reliable monthly to seasonal
forecasts and more robust scenarios of future risks of prolonged dry spells under climate
change.
9
© Crown copyright 2012The January windstorm and the Hazard Impact Model
A major winter storm brought very strong winds across much of the UK on 3 January 2012.
The strongest winds were across Scotland’s central belt, gusting at well over 70 knots
(81 mph) – strong enough to cause some structural damage. Several stations in this area
recorded their highest gust speeds for 13 years. Transport services across Scotland were
disrupted. More than 100,000 homes and businesses were left without electricity and some
buildings were damaged. The Met Office issued a red alert for strong winds well in advance.
The Hazard Impact Model is currently under development to support the work of the Met
Office Hazard Centre and the Natural Hazards Partnership. The January windstorm has
been used as a test case. Wind gust and wind direction information from the Met Office’s
high resolution weather forecast model is combined with information from Birmingham
University overturning thresholds for particular vehicles. The weighted gust field is then
extracted to the road network. Road segment specific wind direction range thresholds are
also generated, and compared with the forecast wind direction. Additionally, segment specific
‘exposure’ information based on the number of vehicles using each road is considered.
UK wind gust speed forecast Weighted wind gust, based on Risk of disruption from
for 1100 on 3 Jan 2011. White vehicle overturning vehicles being overturned on
indicates greatest gust thresholds, for 1100. White the major road networks in
speeds, with black indicating indicates greatest vehicle the UK for 1100 on 3 Jan. Red
low gustiness. overturning hazard, with indicates greatest risk of
black indicating lowest disruption from a vehicle
vehicle overturning hazard. being overturned with yellow
through to green indicating
lower risks of disruption from
a vehicle being overturned.
All coloured dots show
potential impact.
Had the Hazard Impact Model been used operationally, additional guidance on the likely
impact of the weather warnings provided could have been provided. Although the Central
Belt of Scotland is identified at major risk, the dominance of the M1 and M25 on the national
scaling over-shadows the impacts that were felt in Scotland. One area for further study would
be whether independent scaling for Scotland and Wales would produce a more realistic
output. The M25, M6, A66 have also all been identified as high risk mirroring news reports of
high impacts, including vehicle overturns and bridge closures. The M1 and parts of the A1
have also been identified and this is likely associated with their orientation. A review of the
importance of direction needs to be completed to fully understand how this parameter relates
to the wind gust parameter in terms of its influence on vehicle overturning.
10
© Crown copyright 2012European cold weather and sudden stratospheric warming
The only significant cold weather during early 2012 occurred across central Europe in early
February, with several hundred cold weather related fatalities in Ukraine and Russia and
widespread low temperatures and snowfall. The cause of the cold conditions was the
development of a large ‘blocking’ anticyclone over Scandinavia and north-western Russia.
Easterly winds on the southern edge
of this system transported cold
continental air westwards, displacing
the more usual mild westerly
influence from the Atlantic Ocean all
the way to the British Isles. A
‘blocking anticyclone’ can be thought
of being like a very large boulder
stopping the flow of a stream. In this
instance a block stops the more
normal westerly flow that brings
milder conditions, allowing colder
conditions to win out from the east. Global land and sea surface temperature anomalies for 1-5
February 2012
The origin and persistence of blocks
has been a subject of much research, but their inception is often likely to rely on the
intrinsically unsteady patterns of flow of the lower atmosphere spontaneously achieving a
blocked state. What we do know though is that the origins of the large blocked pattern across
Europe in February 2012 could be traced back to the appearance of two individual regions of
mid-latitude blocking over central Russia and the Bering Sea in mid January. Over the next
two weeks, these two regions merged together.
Despite the general unpredictability of blocking patterns, there were potential signs of an
increased risk of a significant cold weather as early as mid January when the high altitude
winds in the stratosphere began to weaken in longer-range forecasts, related to a ‘Sudden
Stratospheric Warming’ event. We understand that there is a clear link between the
weakening of these high altitude winds and the surface weather which operates on monthly
timescales. In situations like this it can provide a ‘window of opportunity’ for monthly
forecasts to warn of increased risk. Based on this understanding, the Met Office 16 to 30 day
forecast correctly reflected the increasing risk of cold conditions since mid January.
Met Office Hadley Centre
scientists have investigated
and demonstrated a clear
stratospheric influence on
surface climate during these
events, with easterly winds
burrowing down through the
atmosphere to affect the jet
stream and surface climate.
The result is a switch from
mild westerly Atlantic flow
Weakening of the jet stream in the stratosphere can allow easterly over Europe to easterly
winds to move down through the atmosphere to give cold easterly winds with an increased risk
winds at the surface. This can result in cold and snowy weather of cold extremes.
across the UK.
A similar ‘Sudden
Stratospheric Warming’ situation occurred in February 2009 when there was significant
snowfall across the UK and other parts of Europe, following a strong breakdown of the high
altitude jet. Although only some cold winter spells can be predicted in this way, other recent
winters such as 2006 and 2010 have also shown clear examples of the effect.
11
© Crown copyright 2012‘Spot on’ snow forecast supported by latest Met Office science
In early February 2012, the Met Office’s highly accurate forecasts of heavy snow and
widespread ice enabled the country to prepare for the hazardous conditions helping to keep
the country moving. At Heathrow Airport, for
example, snow arrived within ten minutes of when
Met Office forecasters had predicted – giving vital
guidance for those managing the situation.
This level of forecasting accuracy is far from easy
to achieve, however. Snow is an example of a
small-scale weather feature, affected by a number
of variables and notoriously difficult to forecast, not
least because the difference between rain and
snow requires only a small change in temperature.
The Met Office is using cutting-edge developments to improve the accuracy of forecasts in
these challenging situations which deal with so-called ‘small scale’ weather. These include
intense rain showers or thunderstorms – which can be just a few hundred metres across - or
weather which depends on fine details of the land surface, such as snow or valley fog.
These types of weather can be very difficult to represent in forecasting models.
At the current global weather forecast resolution (using a grid-scale of 25km), large
scale weather patterns will be generally well reproduced but the model will be unable to
capture the detail of small scale weather. To tackle this, the Met Office has developed the
UKV model. This involves running a version of the model which focuses on the UK, allowing
a much smaller 1.5km scale to be used. Information is fed in to the edges of UKV from the
25km global model. The 1.5km grid-boxes enable UKV to capture things like snow much
better, leading to improved forecasts in many situations.
In most situations, even with a 1.5km grid, current science and technology does not enable
the prediction of the exact location and timing of each shower that passes over the UK.
However, the increased detail gives a better indication of the character of the weather and
could be useful for giving probabilistic forecasts – which give the chances of, for example,
rainfall in a given place at a given time.
The 1.5km weather model also helped with the accuracy of snow forecasts in the very cold
and snowy weather at the end of 2010. In November of that year, numerous heavy snow-
showers were carried inland from the sea in a NE wind causing significant disruption in the
north east of England. The figure shows that for the coarser 12 km model (NAE) showers
stall over the coast
causing a major
underestimate of snow
inland. This is a well
known problem with
models of this grid length.
In contrast, the UKV is
able to represent the
showers more realistically
and brings the showers
inland, producing a much
better forecast. The UKV
better represents what
actually happened as
shown by the radar image 24 hour accumulations for 25 Nov 2010 from UKV and 12 km (NAE)
models compared to that actually observed by radar. This shows an
to the left.
example of the advantages of a high resolution models
12
© Crown copyright 2012The ‘wet’ season
The driest spring for over a century ended rather abruptly. April was the wettest April in the
UK series since 1910, and also the coolest April in over 20 years; more than double the long-
term average fell across most of England and eastern Scotland. The cool, wet theme
continued until the last 10 days of May. The weather in June was also dominated by low
pressure, with an unrelenting succession of frontal low-pressure systems tending to stall over
or close the UK, associated with a southerly shift in the jet stream. Most of England, Wales,
southern Scotland and Northern Ireland received double the average amount of rain, making
it the wettest June since records began in 1910. The 3-month period April to June was the
wettest on record. According to the Environment Agency, this led to some river levels tripling
and reservoirs going from the lowest ever levels to full or exceptionally high. Flooding hit
almost every region of England and Wales.
Figure 7: UK monthly mean rainfall anomaly maps for a) April 2012 and b) June 2012, shown
relative to the long-term 1971-2000 mean climate.
This theme continued into July, with the track of the jet stream finally moving further north
around 21st July, with high pressure influencing the southern half of the UK, bringing several
days of warm and sunny weather toward the start of the Olympics. Overall, August was a
rather unremarkable month of weather – the best month of summer 2012!
Summer 2012 was the second wettest summer in the series from 1910 for the UK overall
with 371mm, significantly wetter than summer 2007 (358mm) with only the ‘calamitous’
summer of 1912 wetter (384mm). Four of the last 6 summers have been among the wettest
10 in this series - these being 2007, 2008, 2009 and 2012 - with the intervening summers of
2010 and 2011 'indifferent' at best. The drier exception in summer 2012 was the far north-
west of Scotland which received below average rainfall. The Met Office records also show
summer 2012 was overall cool and cloudy - it was the fourth dullest summer in the series
from 1929 and the dullest since 1987. Amounts were below average in June (70%), July
(81%) and August (95%). It was the second dullest June across the UK.
13
© Crown copyright 2012After some fine, settled weather in early September, there was a fairly typical mix of
autumnal weather through the season. Showers and rain were interspersed with shorter
settled periods - toward the end of the season these were typically cold with some frosts. The
north-east experienced some significant snow accumulations toward the end of October and
there were further snowfalls in the north toward the end of November. However, of most note
were several further periods of flooding. A vigorous area of low pressure affected a swathe
from south-west England, the west Midlands, north Wales and Northern England from 23rd
to 26th September. There was further flooding on 11th to 12th October - particularly across
eastern Scotland. 20th to 27th November was one of the wettest weeks of the last 50 years
as a succession of frontal systems brought heavy rain across England and Wales - more
than the monthly average fell widely within the week bringing flooding to over 1000
properties, several fatalities and widespread transport disruption.
This pattern continued into December, with further periods of exceptionally wet conditions
occurring during the second half of the month in particular. From 19th December through to
Christmas, a sequence of active depressions brought heavy rainfall and flooding to many
areas of the UK, with parts of south-west England again particularly badly affected.
14
© Crown copyright 2012Localised summer flooding and the UK ensemble
June’s rain led to a succession of flooding events across
the UK, including the south coast of England on 7-8 June,
Aberystywth on 8-9 June, West Sussex and Hampshire
on 10-11 June, Lancashire and West Yorkshire on 22
June. Torrential downpours from thunderstorms across
parts of central and northern England, with almost 30mm
of rain falling in 30 minutes in some places, resulted in
widespread flash-flooding on 28 June.
The flash
flooding in West
Wales led to a
major rescue.
The large-scale
detail of the rain
was well
represented in a
12km resolution
model (left), but
only the 1.5km
UKV model Observed RADAR
(middle) 12km resolution 1.5km resolution
captured the weather forecast weather forecast
local severity.
Even the 1.5km resolution forecast is limited in that it produces a single representation of
what we know to be a very chaotic situation. As we understand from experience of larger-
scale weather forecasting and climate prediction, we need to run an ensemble of forecasts to
properly reflect the inherent uncertainty in the forecast – which may reflect on the exact
location, timing and intensity of a particular event. The Met Office achieved a landmark step
forward this year by trialling the first UK ensemble - a selection of 12 different forecast
realisations run at a 2.2km grid resolution.
Results from the Aberystwyth flood case (below) show
remarkable confidence in the prediction of significant
(>100mm) rainfall accumulations in the affected
Aberystwyth region. This capability has only just become
computationally affordable, following the installation of the
mid-life supercomputer upgrade this year, and is still a
research-mode system. When this capability is further
developed and tested to be implemented operationally,
forecasters will be better able to reflect the risk of severe
weather to users, enabling better mitigation of its impacts.
Probability of exceeding 32mm, 64mm and 100mm accumulations in a 24 hour period based on outputs
from the trial UK ensemble system. The observed radar accumulation above shows in excess of 128mm
15
© Crown copyright 2012Olympics 2012 and the science showcase
Our science and technology developments for the Olympic and Paralympic Games helped to
deliver increasing accuracy and detail in our weather forecasts during the Games, as well as
providing a basis from which future capability will be delivered. As part of the services
provided for London 2012, the Met Office installed additional weather observation
equipment and developed enhanced forecasting capability to support our staff. The science
developments include daily air quality forecasts, high resolution wind and wave modelling for
Weymouth and Portland, high resolution ensemble forecasting at 2 km for the whole of the
UK and additional weather observing technology at Olympic sites.
Daily air quality forecasts
Weather plays a significant role in determining air
quality and air quality forecasts were made available
for all 5000 UK forecast locations on the Met Office
website. During the Olympics, air quality forecasts
were also available in animated map format. These
forecasts are produced from a 12km resolution grid
configuration of the Met Office Unified Model with the
UKCA chemistry and aerosol scheme. In the event,
there were only two short periods of elevated air
quality index values during the Games. Research is
continuing, particularly to improve representation of
emissions in the model. Our long term plans are for
the next generation of coupled UK high resolution
forecast models to include sufficient chemistry and
aerosol to provide air quality forecasts and their
feedbacks on the weather.
Wind and wave modelling for Weymouth and
Portland
Currently, our models can generate atmospheric weather data for every 1.5 km over the
whole of the UK. However, due to the complexity of the winds around Weymouth
and Portland a showcase capability was used which gave nearly 20 times more detail than is
usually available. A 333m grid model in the atmosphere provided guidance on small-scale
wind structures and was coupled to a 250m grid configuration wave model to capture the
influence of Portland and inshore bathymetry on the wave field. This ensured the highest
detail possible for forecasts for wind and waves in the area during the Games. Feedback
from the Weymouth
teams was extremely
positive, noting
especially the useful
guidance that the model
provided on low wind
days. This ground-
breaking showcase
capability illustrates the
future potential that
exists, given sufficient
computing capacity to
run similar
configurations in a more
operational setup for
specific coastal
applications and
sectors.
16
© Crown copyright 2012High resolution ensemble forecasts
The introduction of the 1.5km high resolution UK
weather forecast configuration in 2009 has
provided cutting edge capability to help improve
the accuracy of forecasting for ‘small-scale’
weather features like thundery showers. For the
Olympics, the Met Office took high-resolution
forecasting a step further by implementing the
first UK high-resolution ensemble - running
multiple forecasts at the same time. The high-
resolution ensembles were tested throughout the
Olympics, before being subject to further research
with a view that the facility could be introduced
operationally in the future, potentially leaving a
legacy that will benefit the UK well after the
Olympic and Paralympic Games are over.
The UK ensemble was initially implemented on a
2.2km grid, solely because of inadequate
supercomputing power to support an ensemble
with the 1.5km UK forecast model grid size. In
order to achieve a reasonable update frequency,
the ensemble size is also restricted to only 12 Example high resolution ensemble forecast
members, although post-processing is able to showing chance that temperature will reach
20 °C
provide products with 24 members.
Map products
showing the
probability of
exceeding certain
thresholds for
rain, high
temperatures and
wind were
developed, while
site-specific
forecasts for
Games venues
were also
provided. A
specialist product
showing
probabilities of
tailwinds and
crosswinds was
provided to advise
organisers of the
Example of probabilistic wind forecast for Eton Dorney rowing venue rowing events at
Eton Dorney.
Forecaster feedback from the ensemble output and products was very positive. The UK
ensemble showcase is seen as a pre-operational trial of capability that is expected to
become operational in 2013 – enabled by the planned mid-life upgrade to the current
supercomputer.
17
© Crown copyright 2012Nowcasting Demonstration Project (NDP)
The NDP demonstrated a first implementation of convective-scale numerical weather
prediction to nowcasting – forecasting over time periods of just a few hours ahead to produce
accurate and timely forecasts of hazardous weather such as thunderstorms. To date,
nowcasting systems have been based on extrapolation of radar-based rainfall observations,
blended with model output. However, it has been evident for many years, that these
nowcasting systems all have severe limitations in capturing storm development. As a result,
and following the extension of the UK model to convective scale, attention is shifting to its
application in nowcasting. This is a very demanding objective, requiring major advances in
data assimilation to achieve a close match between the numerical model and the observed
radar precipitation.
The NDP combines the 1.5km resolution
version of the Met Office Unified Model with
a 3km resolution system for assimilation of
high frequency UK observations (including
Doppler radar wind and rainfall
observations). Improved representation of
the evolution and development of new
weather and storm systems is achieved by
combining an accurate depiction of the
current weather with improved
representation of its evolution using the fluid
dynamical, microphysical and
thermodynamical equations used in forecast
models.
The forecast model needs information on
temperature, humidity, cloud, wind,
pressure and aerosols (for fog and
precipitation formation) but no one
observing system provides this information
over all time and space. Up to
now, operational forecast systems have
typically used hourly observations which
may take 1-2 hours to reach the Met Office.
The NDP requires sub-hourly data that
need to reach the Met Office within 5-15
minutes of the observation time so very fast
processing and communication links are
required.
Snapshot example of radar rainfall hourly
accumulation in June 2012 (top) and the
corresponding nowcast prediction (given 1 hour
ahead) from the demonstration NDP capability
Again, the NDP has been enabled by the installation of the mid-life supercomputer upgrade,
allowing faster production of more technically advanced forecasts and data assimilation.
Computational cost means that the forecast domain had to be restricted to southern UK only.
A comprehensive assessment of the summer trial is underway, with a view to develop the
capability in anticipation of operational implementation given sufficient supercomputing
resource at the next machine upgrade.
18
© Crown copyright 2012Why was 2012 so wet?
There are many factors which can impact the notoriously changeable weather in the UK, so
no single one on its own can be said to be fully responsible. However, it is possible to isolate
contributing factors and, in the case of the wet summer of 2012, one of those is the northern
hemisphere jet stream as already discussed. This is a narrow band of fast flowing westerly
winds (i.e. blowing from west to east) in the high atmosphere. This band moves around and
also changes its track, from a fairly straight line to something more closely resembling a
meandering river. Its position can, and does impact weather in the UK and other parts of the
northern hemisphere.
In both March and April we saw a ‘blocking pattern’ in the jet stream, where it meanders
north and south instead of making its more usual eastward progress. Despite this, March
was warm and dry while April was cool and wet. So what is caused the difference? It comes
down to the position of the blocking feature. In March, the meandering of the jet stream
caused it to pass to the north of the UK – anchoring high surface pressure over the UK. This
suppressed cloud, increased sunshine and temperatures, and prevented the usual rain-
bearing Atlantic weather systems from the west reaching us. Soon after the start of April,
however, the whole pattern moved westwards, so the peak of the northerly meander moved
over the North Atlantic Ocean. The UK, in contrast, found itself under the adjacent southerly
meander, with the jet stream passing to the south of the UK over France and Spain. This
atmospheric set-up remained established for much of the late spring and early summer,
bringing low surface pressure, cloud and rain to the UK. Because the flow is still blocked,
without a west-to-east jet stream to blow the weather system through, the low gets stuck over
the UK, resulting in high rainfall totals overall.
Briefing provided to Government in July assessed whether the extraordinary transition from
dry to wet was predictable at lead times beyond that of short-term weather forecasts (i.e.
several weeks to months ahead). Extended range forecasting for the UK, out to 3 months
ahead, will always be particularly challenging because of our position within the global
climate system. Longer range forecasts rely on the fact that certain processes, particularly in
the oceans, act on long timescales that can influence the state of the atmosphere in a
predictable way over a long period (in contrast to the strong influence of short-lived
atmospheric variability on determining the weather at a particular time a few days in the
future). Whereas weather patterns in the tropics are particularly dependent on these slow
variations, such as El Nino/La Nina, which are generally predictable months ahead, weather
in the UK is dominated by the atmospheric circulation over the North Atlantic which is highly
variable, and thus less predictable weeks and months ahead. For the UK, we do feel the
effects of changes in the Tropics, but we are far away from them. This means that subtle,
and sometimes small, shifts in atmospheric circulation patterns can make all the difference
between fine, dry conditions and unsettled, wet weather over the UK several weeks or
months into the future.
19
© Crown copyright 2012Figure 8: Timeseries showing South of England monthly rainfall records over past two
years compared to 1971-2000 average. The succession of dry months, particularly
through the important winter recharge period suddenly give way to the wettest April on
record (for both South of England and UK as a whole) with June, July and August also
wetter than average – giving wettest summer in 100 years (again, for South of England
and UK).
During March 2012 the La Nina event that had persisted from 2009 was finally waning in the
Pacific (as predicted by the seasonal forecast system), although many parts of the global
oceans and tropical weather patterns still retained characteristics associated with La Nina. In
the northern hemisphere the jet stream was very disturbed, resulting in a wave pattern of
high and low pressure regions. As already noted, the UK was positioned under a strong high
pressure region resulting in very dry and warm conditions. In April, the wave pattern
underwent a significant shift to bring the UK under the influence of strong low pressure, with
prevailing south-westerly flow and heavy rainfall. It is possible that the cause of this shift in
the northern hemisphere circulation may have been associated with a shift in tropical
weather patterns. In particular, a strong Madden Julian Oscillation (MJO) occurred in March
– a large-scale tropical phenomenon which leads to disturbed weather patterns over a
timescales of typically 30-60 days. The changes originating over the Indian Ocean may have
influenced our northern hemisphere weather regimes.
The initiation of an MJO event is, however, largely unpredictable, and remains one of the
great unsolved challenges of tropical meteorology. It is therefore very unlikely that this event,
and its influence on northern hemisphere weather patterns, could have been anticipated in
forecasts produced in early and mid-March. In contrast, nearer-term weather forecasts were
able to capture the change to wet conditions in the UK with increasing confidence as we
moved into April (once the shift in tropical conditions was observed).
Better understanding and representing the drivers of predictability in the global climate
system that influence our weather patterns continues to be a priority for Met Office research
in order to deliver improved advice and services on all timescales. This is a key component
of the new Met Office Hadley Centre Climate Programme funded by DECC and Defra.
20
© Crown copyright 2012The UK’s wet summer, the jet stream and climate change
2012 again illustrated how our weather in the UK is complex and determined by many
different factors, including the position of the jet stream - the narrow band of fast moving
winds which runs from west to east across the Atlantic high up in the atmosphere.
Why was the jet stream stuck so far south this summer?
The jet stream, like our weather, is subject to natural variability – that is the random nature of
our weather which means it is different from week, month or year to the next. We expect it to
move around and it has moved to the south of the UK in summertime many times before in
the past. It has, however, been particularly persistent in holding that position this year –
hence the prolonged unsettled weather. This could be due to natural variability – a bad run of
coincidence, if you will – but climate scientists at the Met Office and elsewhere are
conducting ongoing research to see if there are other factors at play. Changes in sea surface
temperatures due to natural cycles may be playing a part, but there is more research to be
done before anyone can establish how big a role they play. Research has also suggested
that reducing amounts of Arctic sea-ice could be affecting weather patterns, but more
research needs to be done to confirm this link.
What about elsewhere in the world?
Looking at the bigger picture, the
jet stream may have been having
an impact elsewhere in the
northern hemisphere. It became
stuck in a persistent pattern of
waves, with one of these ‘waves’
taking it to the south of the UK.
Meanders of the jet north and
south can be seen across the US,
the Atlantic and into Europe.
While the wet weather in the UK Upper level wind patterns in early July 2012, with the northern
occurred under a southward hemisphere jet stream marked with arrows. The wavy nature of
the jet stream was persistent throughout June. Figure created
meander of the jet stream, floods by the University of Reading based on data from ECMWF.
in Russia near the Black Sea
appear to have been beneath the next trough to the east. The US heat waves persisted
beneath a northward meander and a ridge of high pressure.
Is climate change playing a role?
In the long term, most climate models project drier UK summers with only a small chance of
wetter summers – but it is possible there could be other influences of a changing climate
which could override that signal on shorter timescales. If low levels of Arctic sea ice were
found to be affecting the track of the jet stream, for example, this could be seen as linked to
the warming of our climate – but this is currently an unknown. The Met Office Hadley Centre,
working with climate research centres around the world, is making strides in determining how
the odds of extreme climate events have been influenced by climate change. However, it is
very difficult to do this type of analysis with such highly variable rainfall events, so it may take
some years before we could confirm how the odds of this summer’s wet weather happening
have been altered by greenhouse gases. We do know that warmer air can hold more
moisture. We have seen a global temperature increase of more than 0.7 deg C (since pre-
industrial times) and this has led to an increase of about 4-5% in atmospheric moisture. This
means that when we do get unusual weather patterns such as we’re seeing now, it’s likely
there will be more rainfall than the same patterns might have produced in the past. In short, it
seems when it does rain, it is heavier. Taking into account this effect, perhaps it’s not
surprising new records like those for this April and June are being set. In fact, we have
observed four record wettest months in the past four years. If wet months occurred randomly,
we would expect only one record to have been broken since 2006. For temperature, April
(2011), May (2008), July (2006), September (2006) are all recent warmest records. Again,
this is much more frequent than would be expected if temperatures were not rising.
21
© Crown copyright 2012Record low for Arctic sea ice extent
On 16th September, Arctic sea ice extent reached a new record low value since satellite data
records began in 1979. According to the National Snow and Ice Data Centre (NSIDC),
observations show there were 3.41 million square kilometres of sea ice on 16 September.
This record low is some 0.76 million square kilometres lower than the previous daily record
set in 2007.
Satellite records have
shown a long-term decline
in sea ice extent, at an
annual rate of over 4% per
decade. The seasonal
minimum (September) ice
extent has declined at the
faster rate of 11% per
decade, and this rate of
decline has accelerated in
the past 15 years. The last
six years now make up the
lowest six daily minimum
extents in the 32-year
record. This record
minimum is 3.29 square
kilometres below the 1979-
Daily sea ice extent averages for the decades 1980, 1990 and 2000 2000 average and 50%
along with the 4 lowest years, including 2012 (data from NSIDC) lower than the average in
the 1980s.
Understanding, monitoring and modelling sea ice cover is of interest to Met Office scientists
as it plays a key role in our weather and climate. Sea ice decline is also iconic of climate
change in the Arctic, while the presence of sea ice determines the accessibility of the Arctic
ocean and can also affect European and global climate. Sea ice cover seasonally insulates
the atmosphere from the ocean, preventing the exchange of heat and gases. Sea ice decline
has a feedback on the climate system - less sunlight is reflected back into space and so the
planet warms, causing more sea ice decline. Observing, understanding and ultimately
simulating these processes in weather and climate models is critical to developing more
accurate weather forecasts and longer term climate projections.
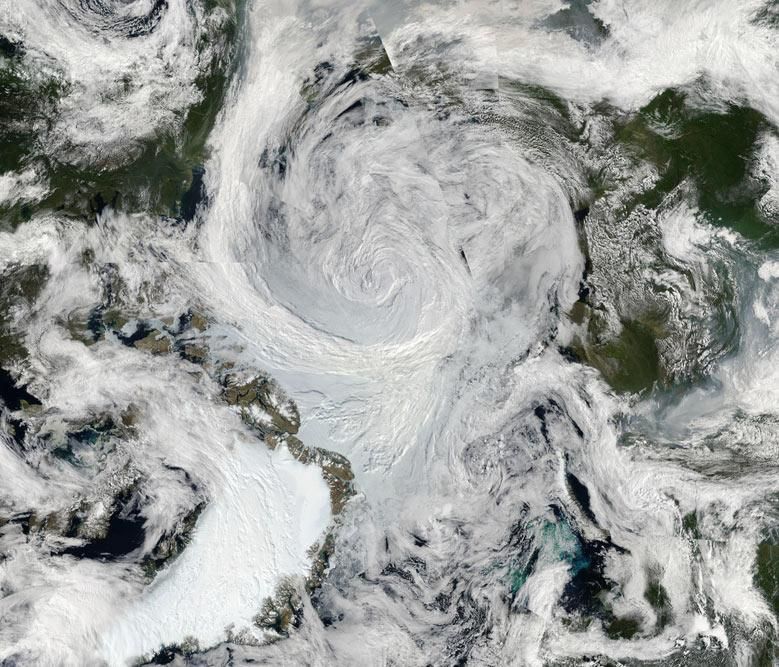
2012 melt season
Detailed analysis and experiments will be
required to determine the exact causes of the
record low extent this year. However, it is likely
that there are two underlying causes; the
ongoing thinning of the ice, which preconditions
the ice to the possibility of large summer losses,
and the strong storm over the central Arctic in
August. This is different to the record low of
2007 where one of the main causes of the
record low ice extent was a high pressure
dipole which persisted throughout the summer -
a synoptic situation which we saw in early June
this year and also during parts of the melt
season in 2010 and 2011.
MODIS image of summer storm across Arctic, 6
August 2012
22
© Crown copyright 2012Hurricane Sandy and the value of ensemble forecasting
As many as 60 million people across 12 US states were thought to be in the path of
Hurricane Sandy – the largest Atlantic hurricane on record. It has been estimated to be the
second costliest hurricane after Katrina, causing damage of around $65billion. Lloyds of
London alone expect to face insurance claims up to $2.5bn. There were an estimated 253
associated deaths (of which at least 122 were in the Caribbean).
Robust information on the storm track, in particular on the location at which it would strike
land, were critical in advising on the potential severity and impact of the storm. Sandy was
particularly devastating in its storm surge in New York because she took an unusual track –
with an abrupt turn to the north west (where most storms continue to recurve out to sea). The
storm surge, which occurred at high tide, pushed water to 4.23m at Battery Park, New York,
beating the previous record.
Ensemble predictions – consistent predictions of
risk based on running a number of forecast
simulations - provided very good guidance in
advance of Sandy, up to 9 days ahead of landfall.
The Met Office global ensemble forecast
products are used worldwide as a component of
tropical cyclone warning and advice, together
with information from other centres. While the
Met Office deterministic (single run) forecast
solution steered Sandy to the east, the ensemble
solutions gave a much better result, closer to the
observed track and indicating significant risk of
landfall around the highly populated urban areas
including New York. Consistent results were also
seen from other forecasting centres, adding
further confidence to the advice provided at the
time to emergency responders. Louis Uccellini, Director of the US National Center for
Environmental Prediction stated that "the major model guidance they (on the forecast desks)
used were the ensembles for their consistency and overall agreement, especially the
ensemble means from ALL the centers (NCEP, ECMWF, CMC, UKMET). Watching the
forecasters work with the ensembles is what gave me the confidence to deal with the media
and FEMA coordination about the nature of the development, the turn of the system, the
lateral extent of the circulation pattern, and the intensity 5,4,3 2, days ahead of the system. I
believe the consistency of the message was key
to making the impact that it did as I consistently
emphasized the unique and dangerous attributes
of the impending storm. I have to say, it was the
ensembles (specifically the ensemble means) that
got the forecasters on the right track and provided
the consistency needed to convince the
emergency management community and others
to pay attention and take action."
In addition, the Met Office ran a high resolution
(4km) local area configuration of the forecast
model (in research mode) to provide further
guidance. This relocatable capability was used
during a number of significant weather events
around the globe this year to support international
colleagues and humanitarian emergency
preparations, including Typhoon Bopha in the
Philippines.
23
© Crown copyright 20122012 hurricane season comes to an end
This year saw another active season in the North Atlantic with 19 named storms, of which 10
became hurricanes. Both the number of named storms and hurricanes were well above the
1980–2010 averages of 12 and six respectively. However, only one of these (Michael)
became a major hurricane (classed as Category 3 or higher – note Sandy reached Category
2 at its peak), which is below the average of three. This is the third year in a row with 19
named storms, which is unprecedented in the historical records. Only one other season –
2005, which saw the devastating Hurricane Katrina – has experienced more named storms
(28) since reliable records began in 1944.
An unusual season
The season has also been notable for the
high number of relatively short-lived
storms, with seven of the nine tropical
storms lasting just two days or less. These
storms contribute towards a high storm
count, but relatively little towards the
Accumulated Cyclone Energy (ACE) index
- a measure of the combined strength and
duration of all named storms in the season.
This is unusual in the long term record, but
has been an increasing trend over recent
years. This can almost certainly be
attributed to improvements in monitoring however, with satellite developments enabling us to
observe developments over the North Atlantic in ever greater detail. This means that we are
now identifying storms that could previously have gone undetected.
Many storms - but not much power
Because such a high proportion of this season's storms were short-lived and weak, the ACE
index was only moderately above average at 127. The average is 104. Many seasons in the
historical record have had a much lower total tropical storm count, but much higher ACE
index, for example the 2004 season recorded only 14 named storms but an ACE index of
225 – nearly twice that seen in 2012.
The Met Office public forecast for the North Atlantic hurricane season, which was issued in
May, continued its run of providing good guidance on the ACE index - with this year's actual
total well within the predicted range. On the number of storms, the total of 19 this year was
outside of the forecast range. Chris Landsea, Science and Operations Officer at the National
Hurricane Center in Miami, said: "Because we are now better able identify weak, short-lived
tropical storms than we were just 15 to 20 years ago, a simple count of how many storms
occur in a season is perhaps not the most representative measure of how active a season
has been. Using ACE index or number of hurricanes would be a more stable measure, less
prone to changes in technology during the last 40-50 years."
Experimental forecasts run by the Met Office during the 2012 season show that there is skill
for forecasting the number of hurricanes. In May 2012 the Met Office predicted that the most
likely number of hurricanes to occur during June to November 2012 would be six, with a 70%
chance that the number would be in the range two to ten. In the event ten hurricanes
occurred.
Longer-term trends
Overall the relatively high level of Atlantic hurricane activity continues a trend which started in
1995, with most years since then being above-average. To assess long-term cycles in North
Atlantic hurricane activity the Met Office is trialling experimental forecasts for up to five years
ahead. While this research continues, the Met Office will continue to monitor the drivers of
tropical storm activity over the next few months as we prepare the first forecast for next
year's season, which will be issued in March 2013. The main public forecast will be released
in May 2013.
24
© Crown copyright 2012You can also read