Response of tidal flow regime and sediment transport in North Malé Atoll, Maldives, to coastal modification and sea level rise
←
→
Page content transcription
If your browser does not render page correctly, please read the page content below
Ocean Sci., 17, 319–334, 2021
https://doi.org/10.5194/os-17-319-2021
© Author(s) 2021. This work is distributed under
the Creative Commons Attribution 4.0 License.

Response of tidal flow regime and sediment transport in North Malé
Atoll, Maldives, to coastal modification and sea level rise
Shuaib Rasheed1 , Simon C. Warder1 , Yves Plancherel1,2 , and Matthew D. Piggott1
1 Department   of Earth Science and Engineering, Imperial College London, London, UK
2 Grantham   Institute – Climate Change and the Environment, Imperial College London, London, UK

Correspondence: Shuaib Rasheed (s.rasheed18@imperial.ic.ac.uk)

Received: 12 August 2020 – Discussion started: 7 September 2020
Revised: 17 December 2020 – Accepted: 4 January 2021 – Published: 17 February 2021

Abstract. Changes to coastlines and bathymetry alter tidal        the world, ranging from marginal seas such as the Bohai
dynamics and associated sediment transport processes, im-         Sea (e.g. Pelling et al., 2013), shelf seas such as the north-
pacting upon a number of threats facing coastal regions,          western European continental shelf (e.g. Ward et al., 2012),
including flood risk and erosion. Especially vulnerable are       and estuaries and bays such as the Eastern Scheldt estuary
coral atolls such as those that make up the Maldives              (e.g. Jiang et al., 2020). However, the response of sediment
archipelago, which has undergone significant land reclama-        distribution in large coral atolls to anthropogenic pressures
tion in recent years and decades and is also particularly ex-     such as land reclamation and coastal modification remains
posed to sea level rise. Here we develop a tidal model of         poorly studied and is generally restricted to very small patch
Malé Atoll, Maldives, the first atoll-scale and multi-atoll-      reefs for a variety of reasons including remoteness and lack
scale high-resolution numerical model of the atolls of the        of data. Recent availability of a high-resolution bathymetry
Maldives and use it to assess potential changes to sediment       dataset for the Maldives archipelago (Rasheed et al., 2021)
grain size distributions in the deeper atoll basin, under sea     now allows for the application of numerical models capable
level rise and coastline alteration scenarios. The results in-    of studying the hydrodynamics within the large coral atolls
dicate that the impact of coastline modification over the last    of the archipelago at high fidelity for the first time.
two decades at the island scale is not limited to the immedi-        The relationship between tidal currents and sediment dis-
ate vicinity of the modified island but can also significantly    tribution patterns has been considered as early as Kenyon
impact the sediment grain size distribution across the wider      (1970) through field observations. Pingree and Griffiths
atoll basin. Additionally, the degree of change in sediment       (1979) used a numerical model to derive a correlation be-
distribution which can be associated with sea level rise that     tween sand transportation pathways and bed shear stress de-
is projected to occur over relatively long time periods is pre-   rived from the combined M2 and M4 tidal constituents in
dicted to occur over far shorter time periods with coastline      the shelf seas around the UK. Warwick and Uncles (1980)
changes, highlighting the need to better understand, predict      used tidal bed shear stress derived from a numerical model to
and mitigate the impact of land reclamation and other coastal     infer benthic sediment in the Bristol Channel and identified
modifications before conducting such activities.                  the issue of overlapping bed shear stress values derived from
                                                                  numerical models and multiple bed sediment types. Ward
                                                                  et al. (2015) further developed a classification scheme for bed
                                                                  shear stress derived from a numerical model and correlated it
1   Introduction                                                  with the observed dominant seabed sediment type, resolving
                                                                  the issue of overlapping bed sediment types and modelled
Driven by their importance to the coastal zone, the response      bed shear stress values.
of tidal dynamics and sediment to future sea level rise (SLR)        Studies (e.g. Haigh et al., 2020; Holleman and Stacey,
scenarios as well as to coastal modification has been consid-     2014; Jiang et al., 2020) have shown that the response of the
ered in various studies targeting different locations around

Published by Copernicus Publications on behalf of the European Geosciences Union.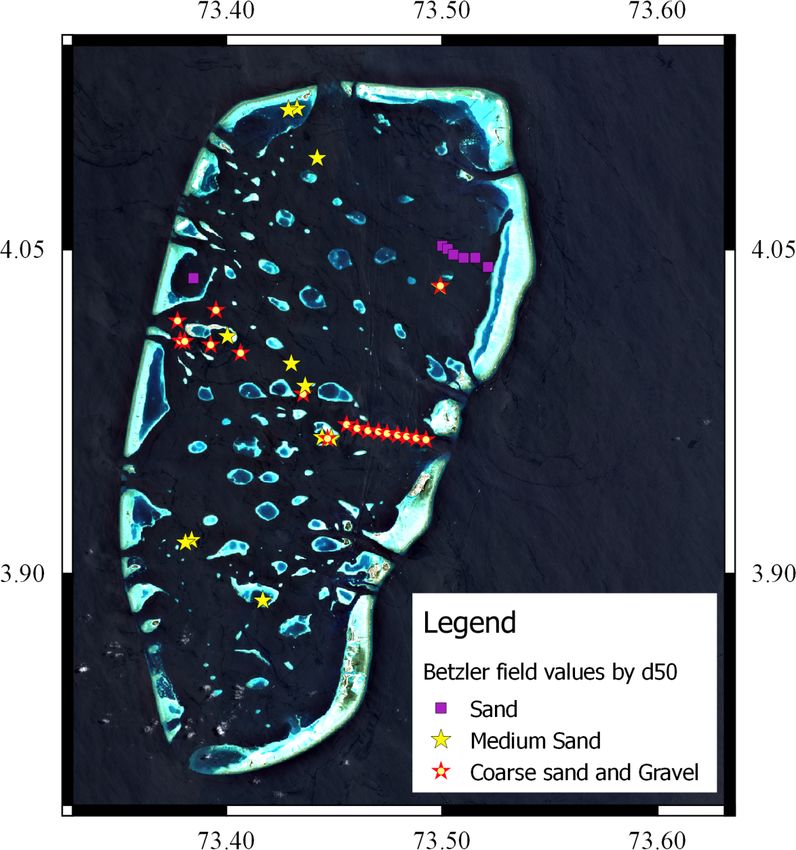
320                           S. Rasheed et al.: Response of tidal flow regime and sediment transport in North Malé Atoll

tides to changing physical characteristics such as bathymetry
and coastline modification can vary significantly in different
areas depending on the local geological setting. According
to these studies the response in some environments is more
complex than others due to the effects of processes such
as shoaling, damping and resonance. Holleman and Stacey
(2014) reported significant tidal amplification increases re-
sulting from sea level rise in San Pablo bay, California, due to
the complex bathymetry of the region. Similarly, coral atolls,
described as being analogous to large “leaky buckets” (Gis-
chler, 2006) composed of drowned carbonate platforms with
extremely complex topographic features such as steep verti-
cally rising lagoons, channels and oceanic faros (a Maldivian
term for ring-shaped reefs found in the centre or on the rim
of larger composite atolls; Agassiz, 1902), will be subject to
similarly complex responses. This is supported by field data
from different sources including Betzler et al. (2015), Gis-
chler (2006) and Morgan and Kench (2014), who studied the
bed sediment in different areas of the Maldives archipelago        Figure 1. (a) Bathymetry of the Maldives archipelago as per
at different scales ranging from regional (e.g. atoll) scales to   Rasheed et al. (2021). (b) The study region which includes the
localised (e.g. individual island or lagoon) scales.               atolls of Gaafaru atoll, North Malé atoll and South Malé atoll
   The aim of this study is to construct a classified bed sed-     with the shallow water lagoons (grey) and islands (green) marked.
iment map of North Malé atoll, Maldives, using tidal sim-          Inhabited islands, excluding industrial islands, are labelled as
                                                                   (1) Malé, (2) Villingilli, (3) Hulhulé, (4) Hulhumalé, (5) Him-
ulations validated against available tidal and sediment field
                                                                   mafushi, (6) Huraa, (7) Thulusdhoo, (8) Dhiffushi, (9) Gaafaru,
measurements, and to use this tool to quantify the response        (10) Gulhi, (11) Maafushi, (12) Guraidhoo; boundaries of lagoons
to sea level rise and large-scale land reclamation scenar-         based upon Spalding et al. (2001).
ios. The strong correlation reported between velocity pat-
terns and dominant bed sediment grain size in coral atolls
provides grounds and data to derive an estimated grain size
distribution from the outputs of tidal simulations, which can      sands of individual reefs and more than 1200 low-lying is-
be further used to classify the bed shear stress at the atoll      lands (Naseer and Hatcher, 2004). None of the islands exceed
level and also to understand the potential response of atoll       more than a few metres in height above current sea level. The
systems to anthropogenic pressures. Identification of poten-       most prominent feature of the Maldives archipelago is the ar-
tial bed sediment type is important for a variety of reasons       rangement of the double chain of atolls in the central zone
ranging from the identification of potential dredging sites,       of the archipelago separated by the Maldives inner sea with
the determination of water turbidity, and the identification of    depths typically in the range 300–500 m (Purdy and Bertram,
potential habitats for benthic flora and fauna. The methods        1993). Even though there have been a limited number of
described in this study can be applied to other coral atolls of    studies, the geological features of Maldives coral atolls and
the Maldives and other regions elsewhere with similar geo-         their formation have been discussed since observations ob-
logical settings and where there are limitations in accessing      tained from field expeditions in the late 19th and early 20th
field data.                                                        centuries (e.g. Gardiner, 1902, 1903; Glennie, 1936; Hass,
                                                                   1965) as well as more recent studies in the past few decades
                                                                   (e.g. Aubert and Droxler, 1992, 1996; Purdy and Bertram,
2     Study site                                                   1993; Belopolsky and Droxler, 2003, 2004).
                                                                      Located in the doldrums, the Maldives does not gener-
2.1    General setting                                             ally experience major storms, and the climate is primarily
                                                                   influenced by the seasonal fluctuations of the South Asian
The Maldives archipelago, shown in Fig. 1a, is located to          monsoonal wind patterns, with the wind speed averaging
the south-west of the Indian subcontinent. Bounded by the          5 m s−1 for both the north-eastern and south-western mon-
2000 m bathymetric contour of the Chagos–Laccadive ridge,          soons. The archipelago experiences a semidiurnal microti-
the archipelago ranges over approximately 1000 km from             dal regime with a tidal range of approximately 1 m (Caldwell
north to south and 150 km from east to west. The 22 atolls         et al., 2015). The combined tidal- and wind-driven currents
that form the Maldives archipelago each have their own             can exceed speeds of 2 m s−1 , particularly in the channels
unique characteristics and range in size from a few kilome-        separating the atolls, along the ocean-facing flanks of atoll
tres to tens of kilometres (Wells, 1988), encompassing thou-       rims and through gaps in atoll rims (Ciarapica and Passeri,

Ocean Sci., 17, 319–334, 2021                                                           https://doi.org/10.5194/os-17-319-2021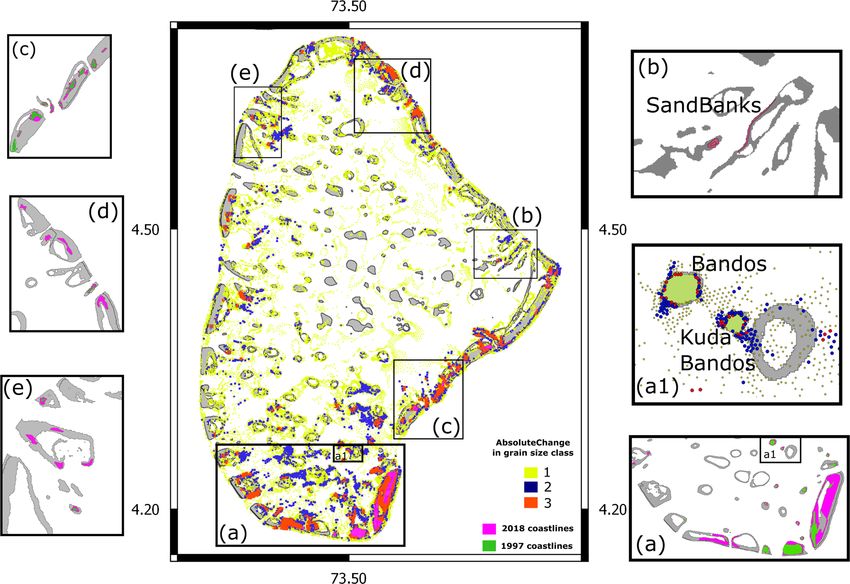
S. Rasheed et al.: Response of tidal flow regime and sediment transport in North Malé Atoll                                    321

1993). The absence of major storms and relatively low wind         atolls of the archipelago have different characteristics com-
speeds across the archipelago suggest that the currents across     pared to the larger more complex atolls in terms of their re-
the archipelago, particularly in areas of deeper water, are        sponse to changes in tides and wind patterns.
mainly driven by tides.                                               North Malé atoll and South Malé atoll, seen in Fig. 1b, are
   The impact of wind-driven sediment transport has been           both large complex atolls making up the bulk of the area of
discussed in several studies, as presented in Sect. 2.3.1, par-    the administrative unit of Malé atoll. The larger North Malé
ticularly with respect to attempts to understand the forma-        atoll measures 60 km in length and 40 km in width with a
tion of the Maldives, and the presence of faros in the atolls of   surface area of ∼ 1623.92 km2 . The atoll contains more than
the Maldives being attributed to the influence of changes in       189 individual reefs for a total reef area of 349 km2 (Naseer
monsoonal wind patterns(Purdy and Bertram, 1993; Naseer            and Hatcher, 2004). The atoll has numerous faros, particu-
and Hatcher, 2000). However, studies such as that of Gis-          larly concentrated in the southern and the northern regions
chler (2006), which attempted to statistically correlate the       of the atoll, with the faros found in the southern zone be-
presence of geomorphological features in the atolls of the         ing more shallow and prominent. The atoll also consists of
Maldives with various different geological parameters, found       numerous islands, both natural and reclaimed. The southern
that wind speeds do not have a significant statistical correla-    islands of the atoll, which include the major islands of Malé
tion with the abundance of faros and lagoon reefs within the       (the capital island of the country), Hulhulé, Hulhumalé and
larger atoll basin. Further, the correlation between both the      Vilingilli, are home to more than 150 000 people, which rep-
number of lagoonal faros and marginal faro areas with the          resents more than a third of the population of the entire coun-
wind stress were found to be statistically insignificant. Addi-    try. To accommodate the socio-economic changes that have
tionally, studies also show that the island shape influences the   occurred over the past few decades, fuelled largely by the
morphological change of the islands more than wave expo-           tourism industry, almost all islands in the atoll have expe-
sure (Kench et al., 2009). This provides more support to the       rienced coastal modifications in terms of both harbour con-
argument that while winds dominate sediment transport pro-         struction and land reclamation activities, with nearly half of
cesses in shallow areas of the atoll (which overall constitute     all the currently existing land being reclaimed (Duvat and
a small area of the wider, deeper atoll basin, as illustrated in   Magnan, 2019). This makes the location an ideal setting
grey in Fig. 1b) the influence of wind decreases in deeper ar-     within which to consider the impact of such anthropogenic
eas, with the tides being the major driver for sediment trans-     modifications.
port processes at these depths.                                       South Malé atoll is separated from North Malé atoll by
                                                                   a 5 km wide channel Vaadhoo Kandu, with depths of close
2.2   Malé Atoll                                                   to 400 m in its central regions (Luthfee, 1995). South Malé
                                                                   atoll has a surface area of ∼ 558.31 km2 . The atoll also has
Malé atoll is an administrative unit in the Maldives               numerous reefs with 112 individual reefs identified (Naseer
archipelago located on the north-eastern side of the double        and Hatcher, 2004), with a combined area of ∼ 175.60 km2 .
chain of atolls of the Maldives archipelago and is comprised       However, unlike North Malé atoll where the outer rim is cut
of the geographic atolls of Kaashidhoo, Gaafaru, and North         with numerous channels, the outer rim of South Malé atoll
and South Malé atolls. Kaashidhoo atoll, classified as an          is more continuous with fewer channels separating the outer
oceanic platform reef, is separated from the other parts of the    rim. While South Malé atoll has also seen extensive land
administrative unit by deep channels exceeding 500 m sepa-         reclamation, these activities at large scale have occurred only
rating the atoll on all sides. Due to the distance from the main   in the last few years, and the changes are thus not included
geographical areas of the administrative atoll and its distinct    in this study. However, sediment grain size data available for
nature, Kaashidhoo atoll was not included in this study.           the atoll (Betzler et al., 2016) were used as the main source
   Gaafaru atoll, seen in Fig. 1b, also classified as an oceanic   of observational data to derive the grain size tidal proxy.
faro (Naseer and Hatcher, 2004), is a small atoll 15 km in
width and 8 km in length with a surface area of 88.50 km2 .        2.3   Sediment data
The atoll, similar to other atolls classified as oceanic faros
across the country, is significantly smaller than the larger       The bed sediment of the coral atolls of the Maldives
more complex atolls. The outer rim of Gaafaru atoll has no         archipelago has been examined by several studies at the lo-
major openings besides two channels in the north of the atoll.     cal scale across individual reefs, as well as at a regional scale
The only island in the atoll is Gaafaru island to the south-       spanning one or more atolls, mainly for the purposes of bet-
east, and no other lagoon or faro exists in the atoll. The atoll   ter understanding the formation of the archipelago (Ciarapica
is separated from North Malé atoll by the narrow, deep chan-       and Passeri, 1993). However, the correlation between bed
nel Hani Kandu which is 3 km wide with depths of up to             sediment type and flow patterns in the Maldives archipelago
160 m in the central region of the channel (Luthfee, 1995).        has been known since Darwin (1842). With the sediment en-
We include Gaafaru atoll in the simulations conducted here         tirely devoid of terrigenous input due to the distance from
because field studies (Gischler, 2006) suggest that smaller        major landmasses over the past 55 Myr (Belopolsky and

https://doi.org/10.5194/os-17-319-2021                                                            Ocean Sci., 17, 319–334, 2021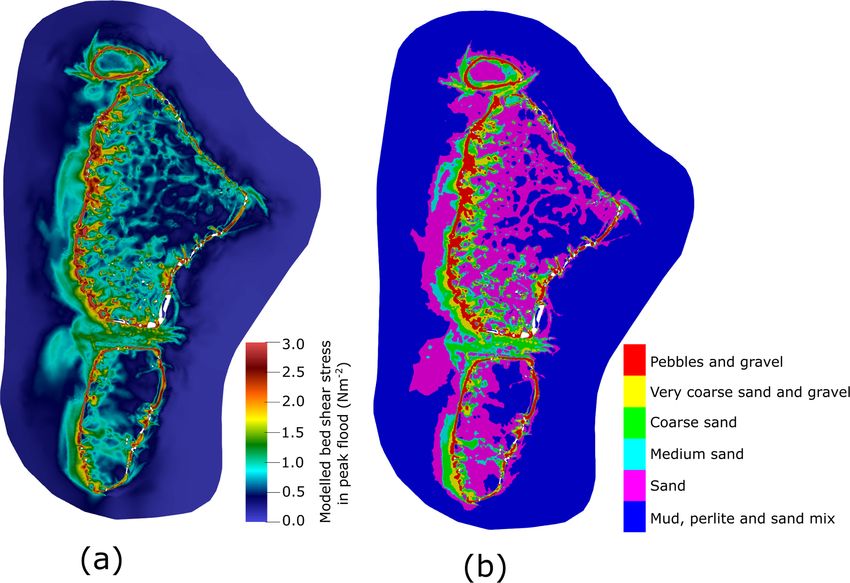
322                           S. Rasheed et al.: Response of tidal flow regime and sediment transport in North Malé Atoll

Droxler, 2003; Aubert and Droxler, 1992), most bed sedi-            in the outer rim as well as the flanks of the outer atoll were
ment studies in the archipelago have focused on identifying         found to be of hard-bottom types, and areas with least expo-
the biological composition of the benthic surface, with a min-      sure to strong currents were found to have the highest con-
imal number of studies focusing on sedimentary dynamics,            centrations of mud and silt. The association of coral types
especially at regional (atoll) scales (e.g. Betzler et al., 2015;   and growth patterns with varying currents across the atoll in-
Naseer, 2003).                                                      dicate a tidally dominated transport pattern across the deep
                                                                    atoll basin (CDE Consulting, 2020a).
2.3.1   Localised (island/lagoon scale data)
                                                                    South Malé Atoll
The sediment patterns around Funadhoo island in North Malé
atoll, described by Kohn (1964), indicate a sediment pattern        The most extensive bed sediment study of an atoll within the
dominated heavily by wind waves. Located on the channel             Maldives archipelago was carried out by Betzler et al. (2015),
between Malé and Hulhulé, the island is exposed to contin-          who collected bed sediment data (Betzler et al., 2016) at dif-
uous heavy swells, with thin layers of finer particles such         ferent locations of South Malé atoll, Ari atoll and the Mal-
as sand confined to areas of the lagoon that are less ex-           dives inner sea. Importantly, the benthic foraminifera com-
posed. This observation of wind-driven sediment patterns in         position at these locations were further classified under five
the shallow lagoons of the Maldives archipelago was fur-            major grain size classes. Figure 2a, which illustrates the field
ther studied by Kench et al. (2009) and Kench and Brander           data from Betzler et al. (2015), shows that the bed sediment
(2006), who reported large movements of sand horizontally           of the major channels in both the east and west of South Malé
around islands due to changes in monsoonal wind patterns.           atoll is dominated by hard-bottom types with a gradual in-
Further, quantitative studies of sediment transport patterns in     crease in fine particles propagating towards the centre of the
Vabbinfaru reef in North Malé atoll by Morgan and Kench             atoll. Locations sheltered from major ocean currents, such
(2014) between two monsoonal periods showed that signifi-           as the sheltered area in the north-east of South Malé atoll,
cant quantities of sediment are transported from the lagoon to      are dominated by a mixture of mud, pelite (fine fragments of
the atoll basin, with the main mode of transportation identi-       sedimentary rocks) and sand with a small presence of coarse
fied as wind-driven waves associated with the south-western         granules. Other areas show a gradual mixture of particles in-
monsoon. These studies suggest a wind-dominated sediment            fluenced by the velocity patterns arising due to variations in
transport pattern for shallow lagoon areas of the Maldives          bathymetry. Regions of the atoll basin in the periphery of
archipelago. However, as discussed in the next section, ob-         high-flow regions such as around the drowned lagoons found
servational data from the atoll basin which makes up more           in the central parts are dominated by medium sand deposited
than 80 % of the total area of the atolls, including marine         during peak flow and ebb.
benthic fauna and sediment data, indicate that beyond the
shallow water areas tides dominate the sediment transport           3     Methods
regime, which will be the focus of this study. More recently,
East et al. (2020) used a hydrodynamic model to study the           3.1    Tidal model
impact of waves and SLR across a small section of a reef in
Huvadhoo atoll and suggested that morphological changes in          In this study we use the Thetis coastal ocean model, a 2D
sediment as well as island migration might occur under SLR          (Angeloudis et al., 2018) and 3D (Kärnä et al., 2018; Pan
scenarios.                                                          et al., 2019) flow solver constructed using the Firedrake
                                                                    finite-element solver framework (Rathgeber et al., 2016).
2.3.2   Regional (atoll-scale data)                                 Here we use the 2D implementation of Thetis which solves
                                                                    the depth-averaged nonlinear shallow water equations in
North Malé Atoll and Felidhé Atoll                                  non-conservative form, given by
                                                                    ∂η
The coral growth patterns in North Malé atoll and Felidhé              + ∇ · (Hd u) = 0,                                        (1)
                                                                    ∂t
atoll studied by Ciarapica and Passeri (1993) were observed
                                                                    ∂u                                     τb
to have hard bottoms in areas exposed to high currents,                + u · ∇u − ν∇ 2 u + f u⊥ + g∇η = −     ,                 (2)
such as the oceanward rim of the atolls and channels, where         ∂t                                    ρHd
the combined tidal and wind currents can be in excess of            where η is the free surface displacement (m), Hd is the to-
2 m s−1 (Owen et al., 2011). Detailed studies of the micro          tal water depth (m), u is the depth-averaged velocity vector
atoll of Rasdhoo (e.g. Klostermann et al., 2014; Klostermann        (m s−1 ) comprising u and v in the x and y directions respec-
and Gischler, 2015; Gischler, 2006; Parker and Gischler,            tively, and ν is the kinematic viscosity of the fluid (m2 s−1 ).
2011) identified major bed sediment types with regards to           The term f u⊥ accounts for the Coriolis force, where f =
foraminifera and facies that correlate well with current pat-       2 sin(ζ ), with  the angular rotation of the Earth, ζ the lat-
terns. Areas exposed to major currents such as in channels          itude and u⊥ the velocity vector rotated 90◦ .

Ocean Sci., 17, 319–334, 2021                                                            https://doi.org/10.5194/os-17-319-2021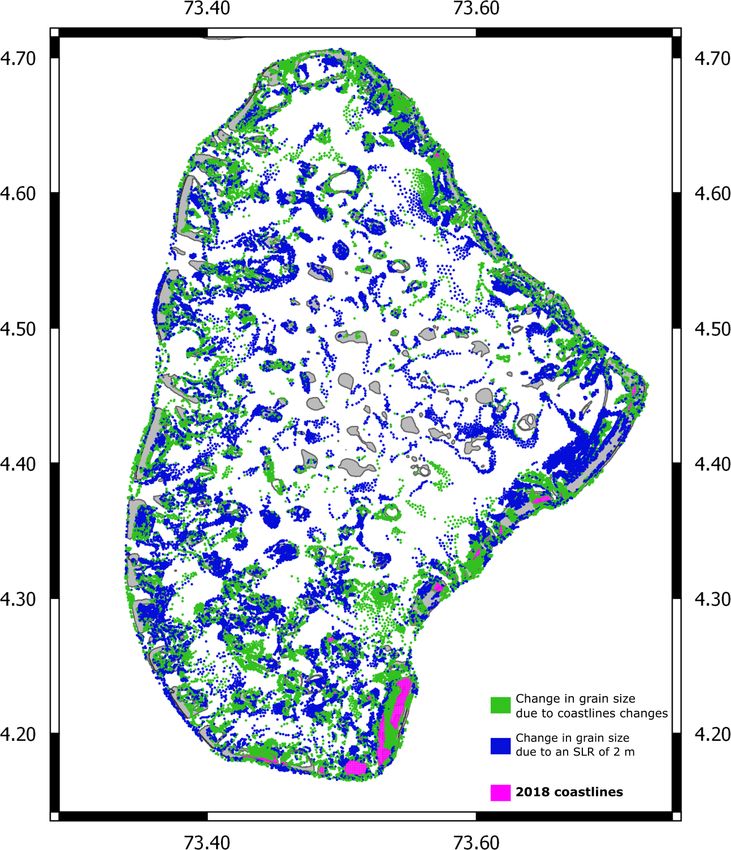
S. Rasheed et al.: Response of tidal flow regime and sediment transport in North Malé Atoll                                        323

                                                                        aries interpolated from the TPXO database (Egbert and Ero-
                                                                        feeva, 2002). Harmonic analysis of long-term tide gauge data
                                                                        of the region have identified these constituents as having sig-
                                                                        nificant contributions to the combined tidal amplitude in the
                                                                        region (Rasheed et al., 2021).

                                                                        3.2     Model set-up

                                                                        3.2.1    Bathymetry

                                                                        The complex bathymetry of the Maldives archipelago is not
                                                                        captured by any existing (global) bathymetry datasets; un-
                                                                        til recently, this has precluded regional-scale (atoll-scale)
                                                                        high-resolution modelling. However, recent developments
                                                                        (Rasheed et al., 2021) using satellite data, navigational
                                                                        charts and other sources have produced accurate bathymetry
                                                                        datasets at very high resolution for the first time, facilitat-
                                                                        ing such studies as that presented here. Given the scale of
                                                                        the simulations carried out in this study, we use the highest
                                                                        available spatial resolution bathymetry dataset of 0.35 arcsec
                                                                        (≈ 10 m). Figure 3 shows the bathymetry of North Malé atoll
                                                                        and Gaafaru atoll interpolated onto a mesh used for the sim-
Figure 2. d50 values for field data obtained by Betzler et al. (2016)   ulations conducted here. The complex features of the atoll,
laid over Sentinel-2 satellite imagery of South Malé atoll, binned      including the narrow channels of the outer rim and the nu-
according to grain size classification.                                 merous lagoons within the atoll, are well captured.

                                                                        3.2.2    Coastline data
   The model uses a discontinuous Galerkin-based finite-
element discretisation (DG-FEM), specifically the P1DG –                Coastline data for two model set-ups, corresponding to the
P1DG finite-element pair where piecewise-linear discontinu-             present-day and 1997 coastlines, were extracted from a vari-
ous function spaces are used to represent both the velocity             ety of sources, since widely used global coastline datasets do
and the free surface prognostic fields. For time-stepping, a            not accurately capture all islands within the domain, and no
Crank–Nicolson approach is applied with a constant time                 coastline datasets exist for previous years. Coastline data for
step of 1t = 45 s. The model treats wetting and drying ac-              2018 were chosen as the present-day coastline, and 1997 data
cording to the formulation of Kärnä et al. (2011), which in-            were chosen as an “unmodified” coastline. Coastline data for
troduces a modified bathymetry h̃ = h+f (Hd ) to always en-             1997 were selected in this context because major reclama-
sure a positive total water depth, with f (Hd ) defined as              tion works in the atoll in addition to Malé island, such as the
             q                                                        reclamation of the lagoon of Hulhulé to create the artificial
          1
f (Hd ) =        Hd2 + α 2 − Hd ,                          (3)          island of Hulhumalé, began soon after.
          2                                                                Coastline data for the 2018 simulation were obtained from
where H is the water height, and α is a tunable constant.               the GADM database (Areas, 2018). However, where this data
Bed shear stress τb is implemented through the Manning’s n              did not represent the latest changes to the coastlines, Band8A
formulation                                                             (Narrow infrared) Sentinel-2 satellite images were used to
                                                                        extract the coastlines, particularly at Hulhumalé, Malé and
τb      |u|u                                                            several newly reclaimed islands at the north-west and north-
   = gn2 1/3 .                                                   (4)
ρ       H                                                               east of the atoll, to provide a better representation of the
             d
                                                                        coastline of North Malé atoll as of March 2018.
   All simulations were carried out for the period of 00:00                For    simulations      conducted      based     upon    the
1 January 2018 to 24:00 5 January 2018, which corresponded              1997 coastline data, the coastlines were extracted
to a spring tide in the region. A further 2.5 d of simulation           from Landsat 5 satellite imagery. The single tile
was included at the start to allow for the model dynamics to            LT05_L1GS_145057_19970203_20170102_01_T2                   was
spin up from a state of rest. The wetting and drying constant           used, which provides a nearly cloudless image of the domain
α parameter (Kärnä et al., 2011) was set to 0.5 m, and the              area, captured on 3 February 1997. While other sources
tidal model was forced with 11 tidal constituents (M2, S2,              provide coastline data across the Maldives archipelago
N2, K2, O1, P1, Q1, M4, MS4 and MN4) at the open bound-                 to varying degrees of accuracy, we found extraction of

https://doi.org/10.5194/os-17-319-2021                                                                Ocean Sci., 17, 319–334, 2021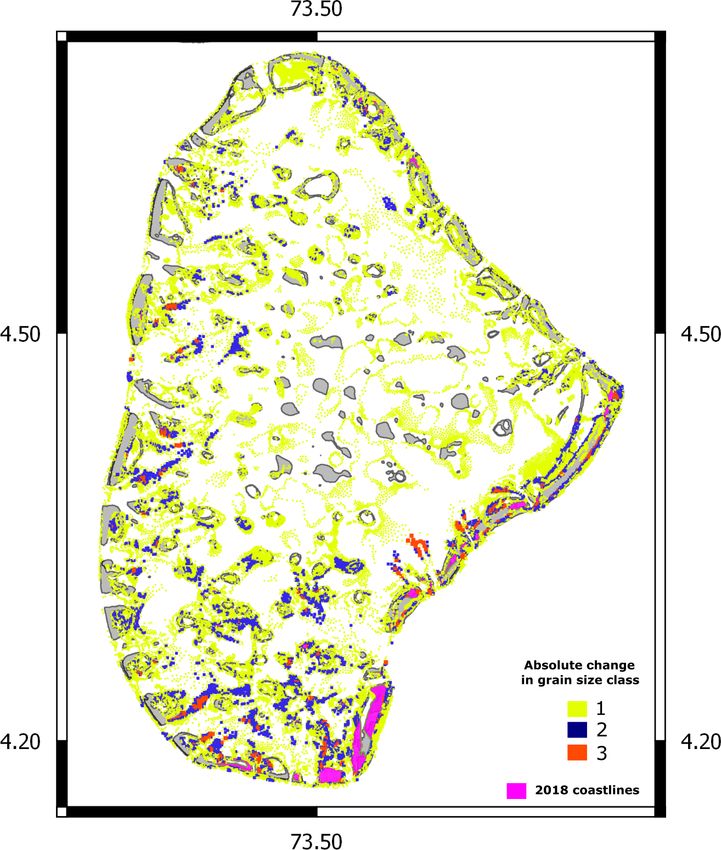
324                             S. Rasheed et al.: Response of tidal flow regime and sediment transport in North Malé Atoll

Figure 3. (a) Bathymetry of North Malé and Gaafaru atoll interpolated onto a simulation mesh. Bathymetry is exaggerated in the vertical
for better visualisation and shows that the individual complex features of the atoll are well captured. (b) Part of the unstructured mesh used
for the simulations conducted in this work, focused on northern North Malé atoll. Mesh resolution is increased significantly at lagoons and
coastlines.

coastline contours from satellite imagery to be the best way             Table 1. Summary of the different meshes and scenarios simulated
to handle extremely complex and fragmented coastlines such               in the study.
as those in the Maldives. The tidal effect was not considered,
mainly because the region experiences a micro tidal regime                 Simulation     No. of      No. of     Coastline    Sea level
(Caldwell et al., 2015).                                                                  nodes      elements
                                                                                1         190 200    380 574        2018      MSL
3.2.3   Bed friction                                                            2         184 669    369 486        1997      MSL
                                                                                3         190 200    380 574        2018      MSL + 2.0 m
A uniform Manning drag coefficient was applied across
the domain. According to various studies (e.g. Rosman and
Hench, 2011), drag parameters across coral reefs are poorly
                                                                         ometry (Piggott et al., 2008). The meshes that were used for
understood and depend on many factors, requiring further
                                                                         this work were selected based on a sensitivity study which
study. Given sufficient observation data, it may be possible
                                                                         is described in Sect. 3.3 and Table 2. For all meshes, the el-
to perform a model calibration exercise for the uncertain co-
                                                                         ement size at the coastlines was fixed at 50 m, with slightly
efficient (Warder et al., 2020), but this is not conducted here.
                                                                         coarser refinement at reef and lagoon boundaries, and with
Instead, the commonly applied value of 0.025 s m−1/3 was
                                                                         elements allowed to gradually increase in size to the open
used. This results in a quadratic drag coefficient (CD ) vary-
                                                                         boundary. Given the varying distances to this boundary, the
ing from ∼ 0.0005 in open-ocean regions up to ∼ 0.026 for
                                                                         element sizes there ranged from 500 m to more than 2000 m.
the shallow reefs and lagoons across the domain and is con-
                                                                         All meshes used for the simulations were generated in the
sistent with studies reporting the drag coefficient (CD ) within
                                                                         UTM43N coordinate reference system.
reef environments, composed of coral reefs and shallow la-
                                                                            Table 1 provides a summary of the meshes and simulation
goons (Kraines et al., 1998).
                                                                         scenarios performed in the study, following the initial sensi-
                                                                         tivity study. The triangular element size ranged from 50 m at
3.2.4   Unstructured mesh generation
                                                                         the island boundaries to up to 2300 m at the open boundary,
The mesh for the model was set up using “qmesh”, a Python                with refinement to 100 m at the lagoon (reef) boundaries for
package for constructing flexible unstructured meshes for                all three scenarios.
geophysical models (Avdis et al., 2016, 2018) which utilises
the “Gmsh” mesh generator (Geuzaine and Remacle, 2009).
The use of unstructured meshes offers significant advantages
in representing small spatial features across large geograph-
ical extents due to their flexibility over resolution and ge-

Ocean Sci., 17, 319–334, 2021                                                                   https://doi.org/10.5194/os-17-319-2021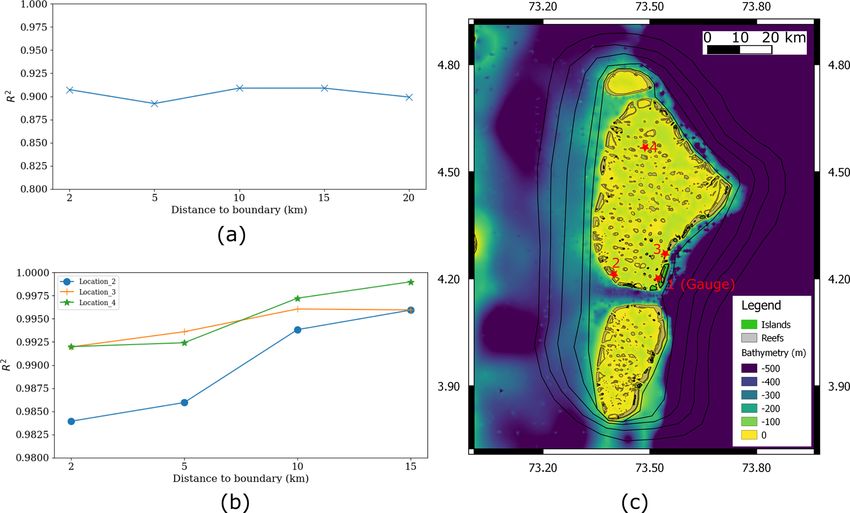
S. Rasheed et al.: Response of tidal flow regime and sediment transport in North Malé Atoll 325
Table 2. Summary of the different meshes used for the study. The
mesh resolution at the coastlines was set at 50 m and permitted to
gradually increase in size up to 15 km towards the open boundaries.
No. of No. of Resolution at Distance to
nodes elements lagoon (m) boundary (km)
Sensitivity to resolution at lagoon
190 200 380 574 100 20
82 243 164 660 300 20
74 138 148 450 500 20
72 356 144 886 700 20
71 788 143 750 900 20
Sensitivity to distance to boundary
82 243 164 660 300 20
81 772 163 718 300 15
80 983 162 140 300 10
79 618 159 410 300 5
76 074 152 322 300 2
3.3 Model sensitivity
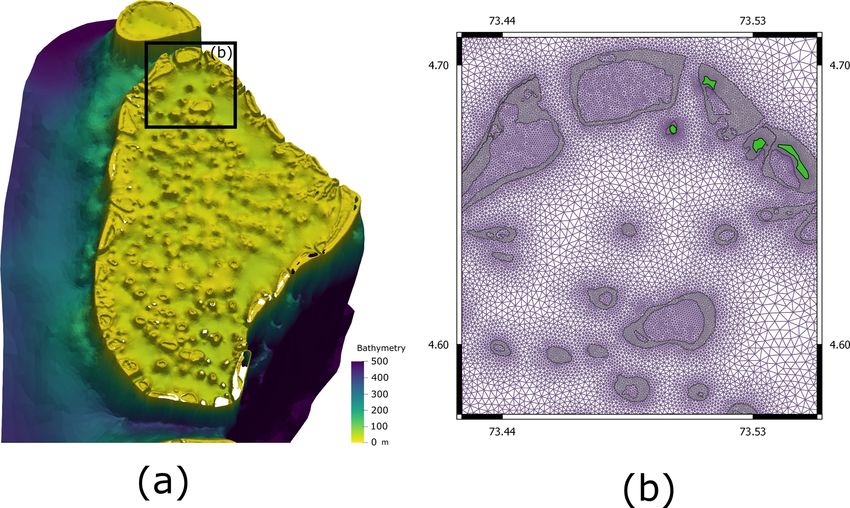
In order to select the most appropriate domain extent (i.e. Figure 4. (a) Correlation between bathymetry interpolated onto
distance to the open forcing boundary) and mesh resolution mesh and the original high-resolution bathymetry dataset for dif-
pattern in space, a sensitivity study for these choices was con- ferent element sizes at lagoons. (b) Correlation between simulated
ducted through a series of numerical experiments, using the tidal amplitudes and corresponding tide gauge data for the meshes
meshes in the configurations summarised in Table 2. The cor- identified in (a) that achieved R 2 > 0.9.
relation of the simulation data to observations and between
simulations was studied through the use of the correlation
coefficient R defined as 2021), assessment of each mesh’s ability to faithfully rep-
PN resent the bathymetry is a crucial first step. To select the
(On − O)(Mn − M) most appropriate mesh resolution, we use linear interpola-
R = qP n=1 , (5)
N
(O − O) 2 N (M − M)2
P tion to evaluate the bathymetry on each unstructured mesh
n=1 n n=1 n
at all data points in the high-resolution bathymetry dataset
where N is the number of data points, On and Mn are the ob- as summarised in Table 2. As highlighted earlier, the reso-
served and modelled values, and O and M are the means of lution at the lagoons was varied; the mesh resolution at the
the observed and modelled values respectively. As described coastline was maintained at 50 m, and the mesh element size
below, we used the correlation coefficient to identify the ap- was allowed to increase up to a maximum of 15 km in open
propriate resolution for the mesh in order to represent the regions. The correlation (calculated via Eq. 5) between the
bathymetry within the domain and also to investigate the sen- interpolated bathymetry and the high-resolution bathymetry
sitivity of the simulated tidal amplitude to mesh resolution surface values for all data points is given in Fig. 4a, for vary-
and distance to the open (i.e. forcing) boundary. ing resolutions at the lagoon. Discounting meshes which did
The correlation coefficient is indicative of the linear least not achieve a correlation of 90 %, the meshes which corre-
squares fit between the modelled and observed values and spond to resolutions of 500, 300 and 100 m at the lagoon
has been used widely for sensitivity studies of ocean models boundaries were then used to study the sensitivity of the re-
(O’Neill et al., 2012). The square of the coefficient, R 2 , pro- sulting model outputs to mesh resolution (Fig. 4b).
vides a measure of the variation between the observed and The results of the sensitivity testing of model outputs, pre-
modelled values ranging from 0 for no correlation up to 1 for sented in Fig. 4b, show the correlation between the modelled
perfect correlation. and observed data at the tide gauge located in the harbour
of Hulhulé Island. The data show that for meshes with ele-
3.3.1 Mesh resolution ment sizes at lagoons of 300 and 500 m the correlation coeffi-
cient between the tide gauge data and model results is below
Since the bathymetry of the domain is highly complex and a threshold R 2 value of 0.9. However, with a lagoon mesh
dominates the flow patterns in the region (Rasheed et al., resolution of 100 m, a correlation coefficient of R 2 ≈ 0.9 is
https://doi.org/10.5194/os-17-319-2021 Ocean Sci., 17, 319–334, 2021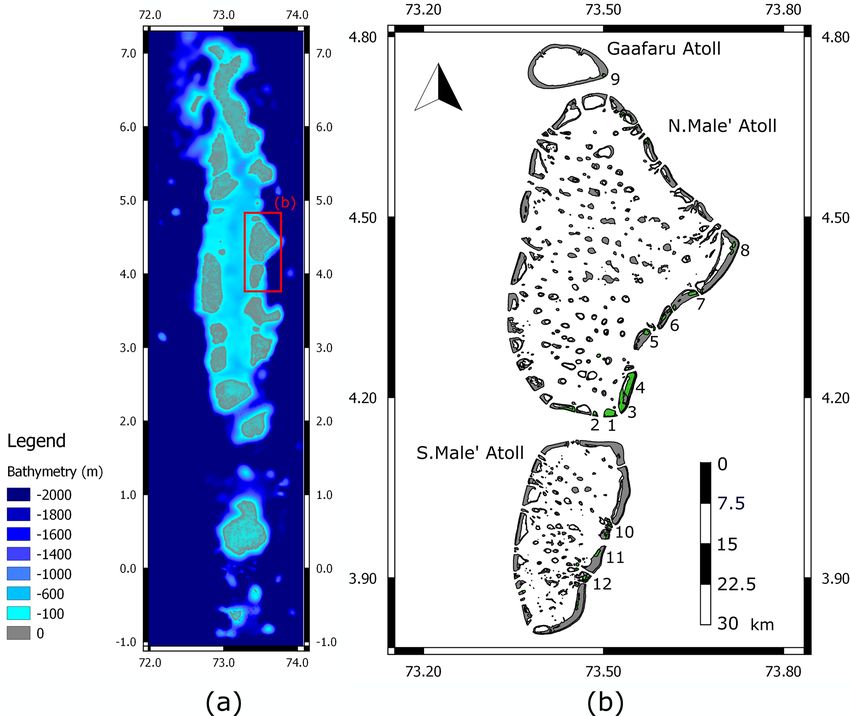
326                           S. Rasheed et al.: Response of tidal flow regime and sediment transport in North Malé Atoll

obtained. Based on this result the resolution of the triangular     R 2 > 0.99 at all locations, providing confidence that 20 km
elements making up the multi-scale unstructured mesh was            is adequate as a boundary distance.
selected to be 100 m at the lagoon boundaries, since the re-           Based on the sensitivity study the mesh resolution at the
sulting mesh is considered to be an adequate representation         lagoons (reef) boundaries were selected to be 100 m, and
of the bathymetry and produces model results with adequate          the distance to the boundary was set at 20 km. The simula-
agreement with tide gauge observations.                             tions with the 2018 and SLR configurations were both carried
                                                                    out using 2018 coastlines with a mesh comprised of 190 200
                                                                    nodes and 380 557 triangular elements, while the mesh used
3.3.2   Distance to boundary
                                                                    for the 1997 coastline had 184 669 nodes and 369 486 trian-
                                                                    gular elements.
Next, to study the model sensitivity to boundary distance,
the model was run using the mesh parameters identified in           3.4   Grain size tidal model proxy
Sect. 3.3.1 but with varying minimum distances to the bound-
ary ranging from 2 to 20 km as shown in Fig. 5c. The impor-         Field data (Betzler et al., 2016), illustrated in Fig. 2 and
tance of the distance to the boundary has been highlighted          described in Sect. 2.3.2, were further analysed using the
in several studies including Jiang et al. (2020), who demon-        GRADISTAT software (Blott and Pye, 2001) to calculate the
strated the necessity to include adjacent regions when study-       d50 values, following the procedure adopted by Ward et al.
ing regional-scale tidal response to factors such as SLR. Sim-      (2015). The d50 value, which represents the particle diameter
ilar issues have been discussed in the context of altering the      representing the 50 % cumulative percentile value, is often
tidal dynamics within a boundary forced tidal domain due to         used as a representative particle diameter for larger particle
the installation of tidal energy devices within a model set-up      groups. Due to the limited number of field points (38 in to-
(Adcock et al., 2011), the recommendation being to locate           tal), all field points were used.
open boundaries beyond the continental shelf in relatively             To develop the grain size tidal proxy, the modelled peak
deep water to minimise inconsistencies between the altered          bed shear stress in floods was calculated using Eq. (4) and
dynamics within the domain which are not accounted for in           is shown in Fig. 7a. Due to the absence of a large inland
the boundary data.                                                  mass to obstruct the flow, it is difficult to define the flood and
   Initially we compare the correlation between model ele-          ebb simply in terms of the reversal of tidal current patterns
vations and tide gauge data, seen in Fig. 5a, which shows           in coral atolls of the Maldives archipelago; rather we find the
that for all except the simulation with the 5 km minimum            rise and fall of water elevations to be more appropriate. While
boundary distance the correlation coefficient R 2 > 0.9. The        previous studies have used different Manning coefficients
correlation at 2 km can be attributed to the close proximity to     for the numerical model and for calibrating bed shear stress
the forcing boundaries. Beyond 5 km there is no significant         for sediment (e.g. Martin-Short et al., 2015), here we find
difference observed in the correlation of tidal amplitudes at       that the same Manning coefficient of 0.025 s m−1/3 , which
the location of the tide gauge with increasing minimum dis-         provides drag coefficients described in Sect. 3.2.3, gives re-
tance to the boundary, with all values corresponding to 10, 15      sults which are comparable to field observations. Next, shear
and 20 km choices showing similarly high correlation values.        stress values from the model, interpolated at the locations
Since different locations are prone to variability in tidal ele-    of field data points, were plotted against the calculated d50
vations due to differences in topographic features and other        values from field data; this is shown in Fig. 6. Due to the
factors (Pugh and Woodworth, 2014), next we compare the             limited number of field observations, a line was fit through
tidal elevations at different locations around the atoll, to un-    the maximum of the bed shear stress values obtained for the
derstand the sensitivity of tidal elevations at different loca-     simulation. The corresponding peak stress value for the max-
tions.                                                              imum grain size for each sediment class was then obtained
   Figure 5b shows the correlation of tidal amplitudes at three     as summarised in Table 3, following the grain size classifica-
different locations in the domain. The locations, shown in          tion scheme used in earlier field studies (Betzler et al., 2015).
Fig. 5c, were selected to coincide with channels on the east        However, given the large values obtained at larger grain sizes
and west of the atoll which experience the maximum tidal            in two different clusters, larger grain sizes in the range ex-
currents, as well as a location in the centre of the atoll. Since   ceeding 2 mm were further split into two classes.
there are no observational data available at these locations,
we compare the elevations with the results of the simulation        3.5   Selection of SLR
carried out using the maximum outer boundary distance of
20 km. For all locations, a very good correlation coefficient       While it is clear that global mean sea level is rising (e.g.
is obtained with R 2 > 0.98, much higher than the thresh-           Church and White, 2006; IPCC, 2007; Church et al., 2013),
old value of R 2 > 0.9. However, successive increases in the        the extent and rate of sea level rise is the subject of signifi-
boundary distance show a successive increase in correlation         cant ongoing research. Analysis of long-term tide gauge data
with the 10 and the 15 km boundary results producing results        (Caldwell et al., 2015) at Hulhulé Island harbour indicates a

Ocean Sci., 17, 319–334, 2021                                                            https://doi.org/10.5194/os-17-319-2021
S. Rasheed et al.: Response of tidal flow regime and sediment transport in North Malé Atoll 327 Figure 5. (a) Correlation between the simulation amplitudes and tide gauge data (at location 1 shown in c) for domains with different minimum distances to the open boundary. (b) Correlation between tidal amplitudes at different locations (labelled 2–4 in c) with varying distances to the boundary with tidal elevations obtained using the maximum boundary distance at 20 km. (c) Visualisation of the different open-boundary locations used for the sensitivity study; the maximum westward boundary follows the 500 m depth contour at the Maldives inner sea where possible. Locations where the elevations are compared are marked in red. Figure 6. Median d50 grain size values from Betzler et al. (2016) and associated peak shear stress values from the simulation. A line is fit through the maximum peak shear stress values derived from the simulation, with corresponding peak shear stress values for the grain size classes obtained (provided in Table 3). current local mean sea level rise of ∼ 4.46 mm yr−1 , with an likely before 2100 (Church et al., 2013). Additionally, studies accelerating trend, which is in line with recent studies which of glaciological conditions leading to sea level rise indicate quote a SLR rate of 3.93 mm yr−1 over the period 1993– that a rise of more than 2 m is unlikely (Pfeffer et al., 2008). 2018 for the Indian Ocean and the South Pacific obtained Reflecting this, studies incorporating sea level rise scenarios from observations of sea level (Frederikse et al., 2020). Some have used varying rates of increase when studying impacts sources predict a global rise of 0.75 to 1.9 m by 2100 (Bind- using numerical models. Ward et al. (2012) used a 5 m rise in off et al., 2007), while others predict much larger increases sea level to study the response of shelf seas to SLR, Pelling in sea level (Vermeer and Rahmstorf, 2009). The Fifth As- et al. (2013) used a SLR of 2 m to study the response of tides sessment Report (AR5) of the Intergovernmental Panel on in the Bohai Sea, and Jiang et al. (2020) used successive rates Climate Change (IPCC) proposes that a SLR of 1.0 m is un- of SLR up to 2 m to study the response of tides to SLR in a https://doi.org/10.5194/os-17-319-2021 Ocean Sci., 17, 319–334, 2021
328                               S. Rasheed et al.: Response of tidal flow regime and sediment transport in North Malé Atoll

Table 3. Summary of sediment classes, corresponding grain sizes
and modelled bed shear stress values for the developed grain size
tidal proxy. The sediment classification is as used by Betzler et al.
(2015),the largest grain size class was further split into two (Very
Coarse Sand and Gravel and Pebbles and Grave).

    Sediment class                 Grain size     Modelled shear
                                       range        stress range
                                        (µm)             (N m2 )
    Mud, pelite and sand mix           < 63                < 0.5
    Sand                             63–250         0.5–0.943606
    Medium sand                     250–500     0.943606–1.10092
    Coarse sand                    500–2000      1.10092–1.46362
    Very coarse sand and gravel   2000–3000      1.46362–1.91552
    Pebbles and gravel               > 3000            > 1.91552

                                                                        Figure 7. (a) Model bed shear stress values at peak flood. (b) Model
                                                                        bed shear stress values binned according to the grain size tidal
tidal bay. In line with these studies as well as Bamber et al.          proxy. The islands are shown in white with their details presented in
(2019), which suggests the use of a global total SLR of 2 m             Fig. 1. As the model does not include the impact of wind-driven sed-
for planning purposes in the 21st century, in this work we              iment processes, differences in grain size in shallow areas (shown
also consider a SLR of 2 m. This is an important figure as the          in grey in Fig. 1b) might arise.
islands of the Maldives generally have maximum heights of
just over 2 m above sea level. Here we make the simplifying
assumption that coastlines remain unchanged during the SLR
process. This assumption holds true for many of the current                At this resolution, the model also distinguishes sediment
coastlines of North Malé atoll, which are completely or par-            particle sizes within individual lagoons, with shallow ex-
tially protected by artificial barriers. While at other locations       posed areas of the lagoons consisting of coarse particles,
this assumption is admittedly hard to justify, we feel this is a        while the deeper, less exposed areas of individual lagoons
reasonable and reproducible choice that avoids the addition             are predicted to be comprised of fine particles, in line with
of further uncertainties over how the coastlines will respond           observations of Felidhé atoll (Gischler et al., 2014). Addi-
naturally and anthropologically to SLR.                                 tionally, the presence of sand on the eastern side of Gaafaru
                                                                        atoll (Gischler et al., 2014) is captured by the model as a re-
                                                                        gion of medium and fine sand pits surrounded by particles of
4     Results                                                           coarser grain size. The absence of such sand pits on the west-
                                                                        ern side of the island, where the bed sediment is predicted
In this section we apply the grain size tidal proxy devel-              by the model to be dominated by particles of a larger size,
oped in Sect. 3.4 to estimate the current dominant grain size           correlates well with satellite data. However, as the sediment
classes across North Malé, South Malé and Gaafaru atolls.               processes at these relatively shallow depths are influenced by
Further, the changes to the dominant grain sizes across the             a variety of other factors (Gischler et al., 2014), further work
atoll under different scenarios are derived and discussed.              is required to determine the origin of the discrepancy.
                                                                           In addition, a qualitative comparison with bed sediment
4.1    Grain size classification and validation                         data gathered from environmental impact assessment sur-
                                                                        veys (CDE Consulting, 2020a, b), which provide a limited
The bed shear stress values obtained in the tidal model, and            bed sediment assessment of the region, indicates that the pre-
their classification into the dominant sediment classes us-             dicted grain sizes compare well with field data. Comparison
ing the bed shear tidal proxy developed above, are shown                of bed sediment type with field data at 56 locations around
in Fig. 7.                                                              North Malé atoll shows that the model predictions match ob-
   Qualitatively, the model results compare well with the               servations across all locations except for fine sand pits lo-
previous studies described in Sect. 2.3. Model results show             cated around the vicinity of islands. This can be attributed to
that the atoll basin is primarily composed of sand. In con-             the fact that the model does not incorporate wave-driven sed-
trast, regions experiencing high-flow velocities, particularly          iment patterns which dominate sediment transport in these
the outer flanks of the atoll rim, the inter atoll channels,            shallow areas (Kench et al., 2009).
openings along the atoll rim (channels), and the flanks of                 Next, we classified the bottom bed sediment for the simu-
the steep oceanic lagoons inside the atoll, are comprised               lations carried out using the 1997 coastline scenario, as well
of coarser sediment; this is consistent with observations by            as under SLR of 2 m. The same procedure described earlier
Kohn (1964), Betzler et al. (2015) and others.                          was adopted and the changes in grain size were compared for

Ocean Sci., 17, 319–334, 2021                                                                 https://doi.org/10.5194/os-17-319-2021
S. Rasheed et al.: Response of tidal flow regime and sediment transport in North Malé Atoll 329
each of the scenarios. Due to the vast majority of the coastal
modifications occurring in North Malé atoll (Duvat and Mag-
nan, 2019) we focus on results for this region.
4.2 Predicted bed sediment classification change due to
coastline modification
Satellite imagery indicates that the landmass of North Malé
atoll has more than doubled from 10.85 km2 composed of 75
individual islands in 1997, to 26.51 km2 and 88 islands in
2018. Model results, shown in Fig. 8, predict that significant
changes in grain sizes across the domain will have occurred
as a result of coastline modification over the two decades. In
general, the absolute difference in grain size class increase
significantly in the immediate vicinity of areas where signif-
icant reclamation has taken place, including the lagoons of Figure 8. Absolute difference in bed sediment grain class predicted
reclaimed islands. Significant differences in grain size class to have occurred between 1997–2018 due to changes in coastline.
can also be seen around channels adjacent to major coastline Spots coloured “yellow”, “blue” and “red” are used to mark loca-
modifications, arising from increased flow rates. Further, at tions where an absolute grain size change of 1, 2 or 3 classes has
this scale the model predicts large changes in bed sediment occurred. Panels (a)–(f) show some of the examples of changes to
type at the island scale. For example, increased erosion pat- coastlines which have occurred from 1997 to 2018. Panel (a1) is
terns around the island of Kudabandos, observed since the a close-up of a region shown in (a) showing increased erosion in
Kudabandos. Panel (b) shows the natural formation of sand banks
large-scale reclamation of Hulhumalé island (CDE Consult-
in lagoons which is also predicted to contribute to grain size changes
ing, 2020a), is predicted well in the simulation (Fig. 8a1). in the atoll basin. The boundaries of reef lagoons (Spalding et al.,
The model simulation shows that increased flow rate in the 2001) are shown in grey for better visualisation. Generally large
channel between the artificial island of Hulhumalé and the is- changes are predicted in the areas where coastline changes have oc-
land of Kanifinolhu is the major contributor to the increased curred, but change in grain size is also observed across the wider
erosion, arising from further reclamation of Hulhumalé Is- atoll basin.
land in 2016 completely blocking the flow across the lagoon
and forcing the flow through the channel only. This provides
confidence in the model results which predicts similar pat- 4.3 Predicted bed sediment classification change due to
terns of change in bed sediment arising from coastline mod- SLR of 2 m
ification. The results also highlight that the location of the
reclamation area is important in influencing the erosion and Similar to the difference in grain size associated with coast-
accretion patterns, and the impact of reclamation locations line modification, a significant change in bed shear stress is
needs to be further studied in major reclamation projects to observed with a SLR of 2 m, as seen in Fig. 9. No change
minimise future damage. is predicted by the model at the channel entrances because
In addition to sediment change driven by artificial recla- the bed sediment at the entrances is already at the coarsest
mation, the results also indicate that tidal sediment in the level, but the dominant bed sediment class in the proximity
atoll can be driven by natural changes in the lagoons which of the major channels does change, as fine particles are swept
are influenced by seasonal wind patterns. Figure 8 shows that away leaving more coarse sediment. The model also predicts
the formation of sand banks (Fig. 8b) in the Maabadhi lagoon widespread changes to sediment class at the rims of the la-
of the Dhiffushi channel, which are present in the 2018 satel- goons and faros of the inner atoll basin. It is also interesting
lite images but absent in the satellite image captured in 1997, to note that areas of significant reclamation such as the south-
causes changes in bed sediment in the vicinity of the lagoon. ern regions of North Malé atoll are predicted by the model to
These results predict that natural changes arising from the show an increased response with SLR. However, this requires
monsoon wind patterns in the region can influence tidal sed- further study to be verified and could arise from the change
iment of the atoll basin in the vicinity of the locations. in flow across the region which has a higher concentration of
faros.
4.4 Discussion of results, limitations of the study and
recommendations for improvement
A comparison of the spatial extent of the predicted change in
grain size from the two scenarios, shown in Fig. 10, indicates
that artificial coastline change over a period of decades pro-
https://doi.org/10.5194/os-17-319-2021 Ocean Sci., 17, 319–334, 2021330 S. Rasheed et al.: Response of tidal flow regime and sediment transport in North Malé Atoll
ther, through the use of a high-resolution hydrodynamic
model the results of this study predict that the effects of an-
thropogenic modifications to island coastlines are not only
felt in the vicinity of the lagoons and island coastlines but
are felt across the atoll with potentially far-reaching con-
sequences. This provides further support to existing studies
(Duvat and Magnan, 2019) which show that coastal modi-
fication can severely weaken the ability of islands in coral
archipelagos to naturally adjust to pressures, increasing their
vulnerability to future changes in ocean and climate.
The main limitation of this study is the sparsity of avail-
able field data. While field data describing grain size for the
domain were accessible, the data are relatively scarce. Avail-
ability of more field data would enhance the results. Further-
more, tide gauge data were only available for one location
within the considered domain and this was located within a
Figure 9. Absolute difference in bed sediment grain class arising sheltered harbour. Additional tide gauge data would help to
from a sea level rise of 2 m, with boundaries of lagoons from Spald- further validate the model results and increase confidence in
ing et al. (2001) in grey. Major changes in grain size class is pre- the model set-up and corresponding simulation results.
dicted to occur near the channels and the lagoonal faros. Additionally, the model results as well as the bed shear
stress are highly sensitive to the bathymetry. While this study
was made possible by the newly available high-resolution
bathymetry dataset (Rasheed et al., 2021), which contains
data from a variety of sources collected over decades, it
is likely that the bathymetry data will contain some errors
which impact the final grain size approximation. Further, the
inclusion of the changes to coastlines with SLR also needs to
be included in the model to fully understand the impacts of
SLR. This need is further demonstrated in this study, in that
coastline modification at the island scale is shown to have a
large impact across the atoll. To facilitate accurate studies,
additional detailed bathymetry and coastline data for the re-
gion would be beneficial.
Finally, this study focuses on tidally driven large-scale
bottom sediment classification within the larger atoll, with
model performance comparable to observational data. To ac-
count for the shallow lagoon areas, wind-driven sediment can
be incorporated into the model in future works; however, this
Figure 10. Comparison of changes to grain size class with differ-
ent simulation scenarios, overlaid on boundaries of lagoons from
requires field data currently not available for model set-up
Spalding et al. (2001) shown in grey. Even though there is generally and calibration.
more grain size class change across the atoll associated with SLR of
2 m, considerable change is predicted with coastline modifications
occurring over a far shorter timescale. 5 Conclusions
A classified bed sediment map of North Malé atoll, South
duces changes in bed sediment type which are comparable in Malé atoll and Gaafaru atoll has been developed from tidal
magnitude to those due to long-term sea level rise. However, model simulations. To provide confidence in model results, a
while changes associated with coastline change are more re- sensitivity study was undertaken and the model results were
stricted to the vicinity of the modification itself, the predicted compared to observational data. The grain sizes predicted
changes associated with SLR are more widespread. by the model compare well with qualitative and quantitative
These results agree with studies of other coral atolls data reported at the coral atolls of the Maldives archipelago,
around the world (e.g. Webb and Kench, 2010; Duvat and demonstrating that correctly configured tidal models can be
Pillet, 2017; Aslam and Kench, 2017; Duvat and Magnan, effectively used to determine dominant grain size in coral
2019), which highlights that the main changes driving mor- atolls at the atoll scale. Identification of dominant bed sed-
phological changes to islands are purely anthropogenic. Fur- iment types in coral atolls can have a wide range of uses
Ocean Sci., 17, 319–334, 2021 https://doi.org/10.5194/os-17-319-2021S. Rasheed et al.: Response of tidal flow regime and sediment transport in North Malé Atoll 331
ranging from industrial seabed mining to the identification Code availability. The source code of THETIS coastal ocean
of potential marine flora and fauna habitats. model used in this study is available from https://thetisproject.
The response of the estimated bed sediment with coast- org/ (last access: 15 January 2019) as well as https://github.com/
line changes shows that a significant change in bed grain size thetisproject/thetis (Kärnä et al., 2018).
distribution occurs at a localised island scale in line with es-
tablished studies. Using a high-resolution bathymetry dataset
coupled with high-resolution hydrodynamic modelling, we Data availability. The satellite imagery used for coastline extrac-
tion is available from Landsat-5 (courtesy of the US Geological Sur-
have shown here that this change is not limited to the di-
vey/NOAA) and Sentinel 2 (image courtesy of the European Space
rect vicinity of the island but can be seen across the wider
Agency). Tide gauge data for the three tide gauges across the Mal-
atoll basin, consistent with reported observations across the dives are available from the University of Hawaii Sea Level Center
atolls of the Maldives archipelago where significant erosion (https://doi.org/10.7289/V5V40S7W, Caldwell et al., 2015). Please
patterns have been observed in the past few decades with- refer to Rasheed et al. (2021) for the bathymetry used in this study.
out any other major change being reported other than signif-
icant island-scale modification. While tipping-point thresh-
olds for island destabilisation are not sufficiently well un- Author contributions. SR ran the simulations, carried out the anal-
derstood (Duvat and Pillet, 2017) to allow predictions for ysis of results and initiated the writing of the paper. SCW provided
whether these changes are overall detrimental or beneficial support for model set-up and analysis of the results. MDP and YP
in the long term, statistics (DNP, 2019) show that more than provided supervision, guidance and insights at every stage of the
114 of the 198 locally inhabited islands of the Maldives project. All authors participated in the writing and editing of the
archipelago (excluding uninhabited and industrial islands) paper.
reported severe erosion during the period 2012–2018, en-
dangering long-established island communities and existing
Competing interests. The authors declare that they have no conflict
socio-economic activities.
of interest.
Importantly, model predictions show that the change in
bed shear grain size associated with a sea level rise of 2 m,
which is predicted to occur over timescales ranging from
Acknowledgements. The authors would like to acknowledge fund-
decades to centuries, is comparable to the change in dom- ing from a Research England GCRF award made to Imperial Col-
inant grain size associated with island-scale coastline mod- lege London. Shuaib Rasheed would like to acknowledge PhD fund-
ification which has occurred in the relatively short period ing from the Islamic Development Bank and Imperial College Lon-
of two decades. The results of this study, derived from de- don.
tailed numerical modelling, provide support for recent stud-
ies which found evidence that artificial coastline modifica-
tion can be a major factor in increasing the vulnerability Review statement. This paper was edited by Joanne Williams and
of islands (Duvat and Magnan, 2019). With major reclama- reviewed by two anonymous referees.
tion work being continuously undertaken in the Maldives
archipelago at an industrial scale, and with rates accelerat-
ing over the past few years to accommodate major socio-
economic activities, the results of this study point to the ur- References
gent need for further work to understand the large-scale im-
Adcock, T. A. A., Borthwick, A. G. L., and Houlsby, G. T.: The
pacts of coastal modifications. open boundary problem in tidal basin modelling with energy
Further, the results of this study have shown that with extraction, 9th European Wave and Tidal Energy Conference
recent developments in the availability of high-resolution (EWTEC), September 2011, Southampton, UK, 2011.
bathymetry datasets, it is now possible to use hydrodynamic Agassiz, A.: ART. XXIV. – An Expedition to the Maldives, (1880–
modelling in the Maldives archipelago to study the impact of 1910), Am. J. Sci., 13, 297, 1902.
existing and future coastal modification scenarios at a range Angeloudis, A., Kramer, S. C., Avdis, A., and Piggott, M. D.: Op-
of spatial and temporal scales, ranging from open atoll basins timising tidal range power plant operation, Appl. Energ., 212,
to the island scale; these are activities which are generally 680–690, 2018.
not currently undertaken in the country (CDE Consulting, Areas, G. A.: GADM Database of Global Administrative Areas,
version 2.8. 2015, available at: http://www.gadm.org (last access:
2020a). The methods developed in this study can be easily
15 December 2019), 2018.
adapted for application to other similar geographic locations,
Aslam, M. and Kench, P. S.: Reef island dynamics and mecha-
where in general field data are sparse, and data collection nisms of change in Huvadhoo Atoll, Republic of Maldives, In-
may be hindered for a variety of reasons. dian Ocean, Anthropocene, 18, 57–68, 2017.
Aubert, O. and Droxler, A.: General Cenozoic evolution of the Mal-
dives carbonate system (equatorial Indian Ocean), Bull. Cent.
Rech. Elf. E., 16, 113–136, 1992.
https://doi.org/10.5194/os-17-319-2021 Ocean Sci., 17, 319–334, 2021You can also read