Remote sensing of Trichodesmium spp. mats in the western tropical South Pacific - Biogeosciences
←
→
Page content transcription
If your browser does not render page correctly, please read the page content below
Biogeosciences, 15, 5203–5219, 2018
https://doi.org/10.5194/bg-15-5203-2018
© Author(s) 2018. This work is distributed under
the Creative Commons Attribution 4.0 License.

Remote sensing of Trichodesmium spp. mats in the
western tropical South Pacific
Guillaume Rousset1 , Florian De Boissieu2 , Christophe E. Menkes3 , Jérôme Lefèvre4 , Robert Frouin5 ,
Martine Rodier6 , Vincent Ridoux7,8 , Sophie Laran7 , Sophie Bonnet9 , and Cécile Dupouy9
1 IRD  (Institut de Recherche pour le Développement), UMR ESPACE DEV, Nouméa, New Caledonia
2 Institutnational de recherche en sciences et technologies pour l’environnement et l’agriculture (IRSTEA),
UMR TETIS, Montpellier, France
3 IRD-Sorbonne Universités (UPMC, Université Paris 06)-CNRS-MNHN, Laboratoire d’Océanographie et du Climat:

Expérimentations et Approches Numériques (LOCEAN), IRD Nouméa BP A5, 98848 Nouméa CEDEX, New Caledonia
4 IRD Nouméa, Laboratoire d’Etudes en Géophysique et Océanographie Spatiales (LEGOS), Nouméa, New Caledonia
5 Scripps Institution of Oceanography, University of California San Diego, La Jolla, CA 92093-0224, USA
6 EIO (Ecosystèmes Insulaires Océaniens), Institut de Recherche pour le Développement-Université de la Polynésie

Française-Institut Malarmé-Ifremer, Papeete, French Polynesia
7 Observatoire Pelagis, UMS3462, Université de la Rochelle/CNRS, La Rochelle, France
8 Centre d’Etude de Chizé, UMR7273 – CNRS- Université de La Rochelle, 2 Rue Olympe de Gouges,

17000 La Rochelle, France
9 Aix Marseille Université-CNRS-INSU, IRD, Mediterranean Institute of Oceanography (MIO), UM110,

IRD Nouméa, BP A5, 98848 Nouméa CEDEX, New Caledonia

Correspondence: Guillaume Rousset (guillaume.rousset@ird.fr)

Received: 31 December 2017 – Discussion started: 9 January 2018
Revised: 24 July 2018 – Accepted: 26 July 2018 – Published: 29 August 2018

Abstract. Trichodesmium is the major nitrogen-fixing               tures in the atmospherically corrected reflectance at 531, 645,
species in the western tropical South Pacific (WTSP) re-           678, 748, and 869 nm. This algorithm outperforms former
gion, a hot spot of diazotrophy. Due to the paucity of in          ones near clouds, limiting false positive detection and allow-
situ observations, remote-sensing methods for detecting Tri-       ing regional-scale automation. Compared with observations,
chodesmium presence on a large scale have been investigated        80 % of the detected mats are within a 2 km range, demon-
to assess the regional-to-global impact of this organism on        strating the good statistical skill of the new algorithm. Ap-
primary production and carbon cycling. A number of algo-           plication to MODIS imagery acquired during the February-
rithms have been developed to identify Trichodesmium sur-          March 2015 OUTPACE campaign reveals the presence of
face blooms from space, but determining with confidence            surface blooms northwest and east of New Caledonia and
their accuracy has been difficult, chiefly because of the          near 20◦ S–172◦ W in qualitative agreement with measured
scarcity of sea-truth information at the time of satellite over-   nitrogen fixation rates. Improving Trichodesmium detection
pass. Here, we use a series of new cruises as well as airborne     requires measuring ocean color at higher spectral and spatial
surveys over the WTSP to evaluate their ability to detect          (< 250 m) resolution than MODIS, taking into account envi-
Trichodesmium surface blooms in the satellite imagery. The         ronment properties (e.g., wind, sea surface temperature), flu-
evaluation, performed on MODIS data at 250 m and 1 km              orescence, and spatial structure of filaments, and a better un-
resolution acquired over the region, shows limitations due         derstanding of Trichodesmium dynamics, including aggrega-
to spatial resolution, clouds, and atmospheric correction. A       tion processes to generate surface mats. Such sub-mesoscale
new satellite-based algorithm is designed to alleviate some        aggregation processes for Trichodesmium are yet to be un-
of these limitations, by exploiting optimally spectral fea-        derstood.

Published by Copernicus Publications on behalf of the European Geosciences Union.
5204                                                           G. Rousset et al.: Remote sensing of Trichodesmium spp. mats

1   Introduction                                                   satellite sensors. They are extensively documented in
                                                                   Blondeau-Patissier et al. (2014) and Mckinna (2015). For-
The western tropical South Pacific (WTSP) is a low nutri-          mer algorithms are classification schemes using thresholds
ent, low chlorophyll (LNLC) region, harboring surface ni-          applied to reflectances in the blue–green (440–550) range,
trate concentrations close to detection limits of standard an-     like those proposed by Subramaniam et al. (2002) and
alytical methods and limiting for the growth of the major-         Dupouy et al. (2011). They were designed using Sea-viewing
ity of phytoplankton species (Le Borgne et al., 2011). This        Wide Field-of-view Sensor (SeaWiFS) observations. Using
lack of inorganic nitrogen favors the growth of dinitro-           spectral features in Moderate Resolution Imaging Spectrora-
gen (N2 )-fixing organisms (or diazotrophs), which have            diometer (MODIS) Aqua observations at 250 m in the red–
the ability to use the inexhaustible pool of N2 dissolved          NIR, McKinna et al. (2011) elaborated a simple reflectance
in seawater and convert it into bioavailable ammonia.              classification algorithm to detect dense Trichodesmium sur-
Several studies have reported high N2 fixation rates in            face aggregation. By providing an operational floating algae
the WTSP (Berthelot et al., 2017; Bonnet et al., 2009,             index (FAI), Hu et al. (2010) also demonstrated the poten-
2015; Garcia et al., 2007), which has recently been iden-          tial for using the red-edge effect, that is, the increasing ab-
tified as a hot spot of N2 fixation (Bonnet et al., 2017).         sorption in the red (620–700) and scattering in the NIR (be-
During austral summer conditions, N2 fixation supports             yond 700) region of the spectrum due to floating algae. Using
nearly all new primary production and organic matter ex-           Medium Resolution Imaging Spectrometer (MERIS) obser-
port (Caffin et al., 2018; Knapp et al., 2018) as nitrate dif-     vations in the red–NIR band, Gower et al. (2014) provided a
fusion across the thermocline and atmospheric sources of           similar index of Trichodesmium surface slicks. In their Tri-
N are < 10 % of new N inputs. The cyanobacterium Tri-              chodesmium bio-optical model, Westberry et al. (2005) used
chodesmium is one of the most abundant diazotrophs in our          specific inherent optical properties (Trichodesmium-specific
oceans (Capone, 1997; Luo et al., 2012) and in the WTSP in         absorption and backscattering parameters) to estimate Tri-
particular (Tenório et al., 2018; Stenegren et al., 2018). Cell-   chodesmium biomass from SeaWiFS reflectances.
specific N2 fixation measurements recently conducted in               The application of these algorithms to MODIS imagery
the WTSP have revealed Trichodesmium as the major N2 -             revealed several issues, some of which were raised and dis-
fixing organism, accounting for > 60 % of total N2 fixa-           cussed in the aforementioned articles. For example, the red
tion (Bonnet et al., 2018). One of the characteristics of Tri-     edge over Trichodesmium mats can lead to controversial re-
chodesmium is the presence of gas vesicles, which pro-             sults since atmospheric correction for aerosols is based on in-
vide buoyancy (van Baalen and Brown, 1969; Villareal and           formation at similar wavelengths (Hu et al., 2010). Sampling
Carpenter, 2003) and help maintain this cyanobacterium in          effects are also exacerbated due to the occurrence of clouds
the upper ocean surface. Trichodesmium cells are aggre-            in the WTSP since the blooming period of Trichodesmium
gated and form long chains called trichomes. Trichomes             (mainly November to March; Dupouy et al., 2011) coin-
then can gather into colonies called “puffs” or “tuffs”, and       cides with the cloudiest period of the South Pacific Conver-
these colonies can aggregate at the surface of the water and       gence Zone, making it difficult to identify coincident in situ
form large mats that can extend for miles. They had al-            mats in satellite imagery. Moreover, because Trichodesmium
ready been observed during James Cook’s and Charles Dar-           mats are narrow (v50 m typically), the suitability of MODIS
win’s expeditions. During the southern austral summer, Tri-        visible–NIR spatial resolution to detect such surface aggre-
chodesmium blooms have long been detected by satellites            gations is questionable.
in the region, mostly around New Caledonia and Vanuatu                The aim of this study is to provide a systematic detec-
(Dupouy et al., 2000, 2011), and later confirmed by micro-         tion of Trichodesmium blooms in the vast WTSP ocean be-
scopic enumerations (Shiozaki et al., 2014).                       tween latitudes 26 and 10◦ S and longitudes 155 and 190◦ E,
    Identifying the occurrence and the spatial distribution of     building on previously published algorithms and using ma-
Trichodesmium blooms and mats is of primary importance to          rine reflectances measured by MODIS onboard Aqua. To
assess their regional contribution to primary production and       evaluate the detection performance, a large database of his-
biogeochemical cycles. However, because of their paucity,          torical mat observations in this region was created and up-
scientific cruises alone are not sufficient to achieve such        dated with recent datasets and particularly the Oligotro-
a goal, and remote sensing completed by sea observations           phy to UlTra-oligotrophy PACific Experiment (OUTPACE)
of mats appears as the unique alternative for assessing its        cruise of March–April 2015 (Moutin et al., 2017). As a con-
global impact. By using Trichodesmium spectral characteris-        sequence of improvements in MODIS Collection 6 calibra-
tics, among which are pigment absorption due to phycoery-          tions and algorithm updates for aerosol and cloud screening
thrin (PE) between 490 and 570 nm, absorption/scattering in-       (Casey et al., 2017), Trichodesmium detection algorithms de-
crease in the red–near infrared (NIR), and particle backscat-      veloped with previous collections had to be adapted when-
tering (Subramaniam et al., 1999a, b; Hu et al., 2010), sev-       ever possible. From this experience, a new algorithm less
eral empirical bio-optical algorithms have been devel-             prone to contamination by clouds emerged, combining meth-
oped to detect Trichodesmium blooms from various                   ods to detect Trichodesmium blooms from algorithms by

Biogeosciences, 15, 5203–5219, 2018                                                    www.biogeosciences.net/15/5203/2018/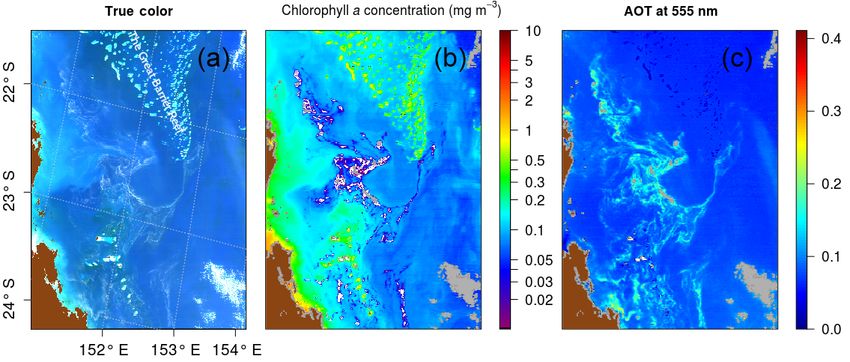
G. Rousset et al.: Remote sensing of Trichodesmium spp. mats                                                               5205

McKinna et al. (2011) and Hu et al. (2010) and was evalu-
ated using high-resolution MODIS imagery. The paper is or-
ganized as follows. In Sect. 2 in situ and satellite data used
in this study are presented. In Sect. 3 methods to extract Tri-
chodesmium spectral signature and their limitations are de-
scribed, and details are provided about the former detection
algorithms of Hu et al. (2010) and McKinna et al. (2011),
adapted for this study, as well as the newly developed al-
gorithm. In Sect. 4 these algorithms are compared, and the
proposed algorithm is evaluated along the OUTPACE cruise
transect. In Sect. 5 the new algorithm performance is dis-
cussed. In Sect. 6 the conclusions of the study are drawn and
perspectives are provided for future work.

2     Material

2.1    In situ observations

The in situ data used to train and test the Trichodesmium
                                                                  Figure 1. Map of in situ (visual) observations of Trichodesmium
detection algorithm are a combination of three datasets,
                                                                  mats gathered in the studied region.
providing data in the acquisition period of MODIS Aqua
or Terra missions (March 2000–present). The first dataset
includes Trichodesmium mat observations published in              algorithms and on visual counts of surface samples at every
Dupouy et al. (2011). These observations were made be-            station, allowed one to describe the Trichodesmium distribu-
tween 1998 and 2010, from aircraft, French Navy ships,            tion along the transect (Dupouy et al., 2018).
research vessels (e.g., R/V Alis), and ships of opportunity.
Some of these visual observations were confirmed by wa-           2.2   Satellite data
ter samples analyzed with photomicrographs confirming the
abundant presence of Trichodesmium (Dupouy et al., 2011).         Marine reflectances from MODIS Aqua and Terra Collec-
The second dataset includes airborne visual observations also     tion 6 coinciding in time and space with the OBT database
gathered in December 2014 in the vicinity of New Caledonia        and the OUTPACE campaign are used in this study. Level 1A
during the “REcensement des Mammifères marins et autre            observations were downloaded from NASA’s Goddard Space
Mégafaune pélagique par Observation Aérienne” (REM-               Flight Center (https://oceandata.sci.gsfc.nasa.gov/, last ac-
MOA) program (Laran et al., 2016). This second dataset pro-       cess: 13 August 2018) and processed with SeaDAS v7.0.2
vides a large number of Trichodesmium mat observations            to produce Level 2 reflectances at 250 m and 1 km resolu-
along numerous and repetitive transects, which is most fa-        tion. SeaDAS v7.0.2 default values were applied during this
vorable for satellite data validation. In total, the database     processing for atmospheric correction failure, land, sun glint,
created from the compilation of these two datasets contains       very high or saturated radiance, sensor viewing zenith angle
507 open-ocean observations in the region 15–25◦ S, 155–          exceedance threshold, stray light contamination, and cloud
180◦ E (Fig. 1). It is referred to as the observation base of     contamination. Satellite observations with a proportion of
Trichodesmium (OBT) in the following and used mainly for          valid pixels lower than 40 % within the 0.5◦ searching radius
algorithm training.                                               around each in situ observation were screened out.
   A third dataset was obtained along a latitudinal transect         MODIS atmospherically corrected (aerosol + Rayleigh)
around 20◦ S carried out during the OUTPACE scientific            remote-sensing reflectances (Rrs ) in the visible, NIR, and
cruise (Moutin et al., 2017) in the region 160◦ E–160◦ W          short-wavelength infrared (SWIR) ranges were used at differ-
from 23 February to 1 April 2015. Seawater samples were           ent resolutions: 250 m for bands 1 (645 nm) and 2 (859 nm),
collected for Trichodesmium identification and estimation by      500 m (bands 3–7, visible and SWIR land- and cloud-
quantitative polymerase chain reaction (PCR), a molecular         dedicated bands), and 1 km (bands 8–16). Bands 8 to 16 are
method described in Stenegren et al. (2018), microscopic          dedicated to ocean color (Table 1), but the information in
counts at selected stations (Mathieu Caffin, personal com-        high-resolution bands located in the visible–NIR region is
munication, 2017), and N2 fixation rates as described in Bon-     also used to track floating blooms. To evaluate the influence
net et al. (2018). Moreover, Trichodesmium abundance from         of resolution on detection performances, Level 2 remote-
the Underwater Vision Profiler 5 (UVP5; Picheral et al.,          sensing data were produced at both 250 m and 1 km reso-
2010), calibrated on trichome concentration from pigment          lutions, with interpolation of 500 m and 1 km data and aggre-

www.biogeosciences.net/15/5203/2018/                                                     Biogeosciences, 15, 5203–5219, 2018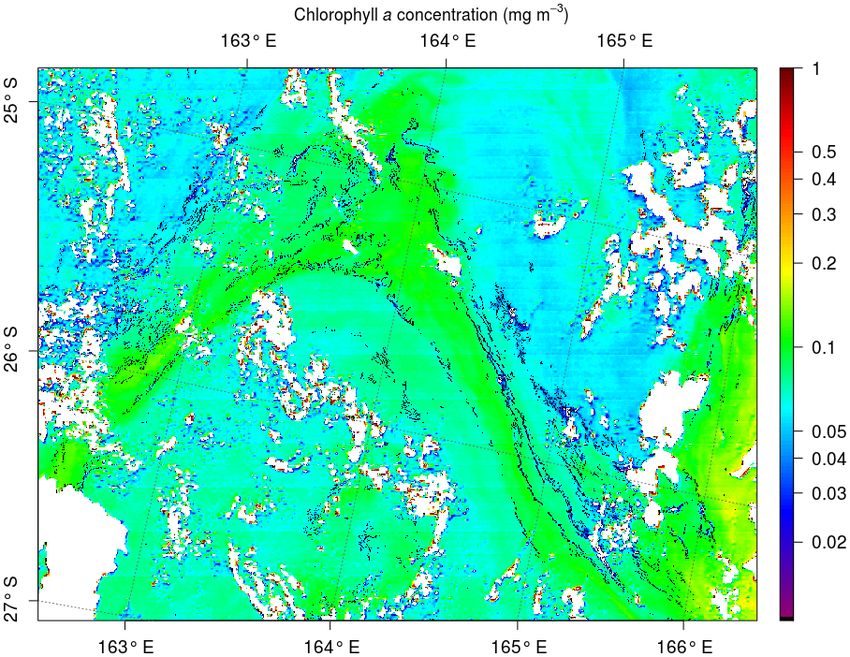
5206                                                              G. Rousset et al.: Remote sensing of Trichodesmium spp. mats

Table 1. Specification of the first 13 MODIS channels, including primary use, central wavelength, bandwidth, and spatial resolution; http:
//eoweb.dlr.de:8080/short_guide/D-MODIS.html (last access: 13 August 2018).

                            Central   MODIS band        Spectral coverage       Spatial   Key use
                    wavelength (nm)      number       and bandwidth (nm)     resolution   in SeaDAS
    Visible                    412               8           405–420 (15)         1000    Ocean color, phytoplankton
                               443               9           438–448 (10)         1000    Ocean color, phytoplankton
                               469               3           459–479 (20)          500    Land/vegetation
                               488              10           483–493 (10)         1000    Ocean color, phytoplankton
                               531              11           526–536 (10)         1000    Ocean color, phytoplankton
                               547              12           542–552 (10)         1000    Ocean color, phytoplankton
                               555               4           620–670 (20)          500    Land/vegetation
                               645               1           662–670 (50)          250    Land, cloud, aerosol
                               667              13           662–672 (10)         1000    Ocean color, phytoplankton
                               678              14           673–683 (10)         1000    Chlorophyll fluorescence
    Near infrared              748              15           743–753 (10)         1000    Ocean color, red edge, atmospheric correction
                               859               2           841–876 (35)          250    Land, cloud, aerosol
                               869              16           862–877 (15)         1000    Ocean color, red edge, atmospheric correction

gation of 250 and 500 m resolution data, respectively. The             image of the Australian coast acquired just after a period
consequences of this processing are discussed in Section 5.            of heavy rain that led to a massive Trichodesmium bloom.
   The aerosol correction was carried out with the standard            Fortunately, this bloom was also documented through field
Gordon and Wang (1994) method since the study was con-                 studies (McKinna et al., 2011). Figure 2a shows the “true
ducted in the open ocean (Case 1 waters). For reasons de-              color” image obtained using a combination of Rrc at 469,
tailed in next section, this type of correction is not appropri-       555, and 645 nm. On this image, large visible Trichodesmium
ate in the presence of strong floating algae concentrations.           mats distributed over a vast area can be seen. Figure 2b dis-
Therefore, Rayleigh-corrected-only reflectances (Rrc ) were            plays the SeaDAS-derived aerosol optical thickness (AOT)
computed in addition to Rrs in Level 2 outputs.                        at 555 nm, an indicator of the aerosol load in the atmosphere.
                                                                       The high AOT values match the filamentous spatial structure
                                                                       noticed in the true color image. However, this structure is
3     Methods                                                          more likely to be floating material as the patterns are very
                                                                       thin and do not seem to be driven by wind. Moreover, several
3.1    Motivation in using Rayleigh-corrected reflectance
                                                                       patches within this structure are flagged as cloud in the center
       (Rrc ) in bio-optic algorithms for floating blooms
                                                                       (grey patches in Fig. 2b), although the true color image does
The atmospheric correction scheme of Gordon and Wang                   not indicate the presence of clouds in this particular area. The
(1994) utilizes a pair of NIR bands at 748 and 869 nm.                 misclassification of marine to cloudy pixel is a failure of the
Spectral differences in the two NIR bands are used to                  cloud detection algorithm, resulting from high water-leaving
select the most probable aerosol model, allowing an es-                signal in the NIR bands exceeding the albedo threshold of
timation of the aerosol effects in the visible range. The              2.7 % (Wang and Shi, 2005). Figure 2c shows the chloro-
aerosol contamination is then removed from the top-of-                 phyll concentration (Chl a) estimated according to the OC3
atmosphere (TOA) signal after Rayleigh scattering correc-              algorithm when Chl a retrievals are above 0.2 mg m−3 and to
tion to yield water-leaving radiance, therefore Rrs , in the           the ocean color index (OCI) algorithm when they are below
visible. But to retrieve the aerosol model over Case 1 wa-             (Hu et al., 2012). Chl a decreases systematically, even falling
ters, the Gordon and Wang (1994) method relies on the as-              to zero, in the vicinity of the Trichodesmium patches, al-
sumption that optical constituents have negligible contribu-           though the real concentrations are certainly larger at the core
tion to water-leaving radiances in the NIR region. Over float-         of the mats than at their periphery. In addition to biomass
ing mats, this assumption does not hold due to red-edge ef-            underestimation, the spectral miscorrection may reduce the
fects, and the atmospheric correction may give erroneous               performance of reflectance classification schemes, like those
(i.e., too low and even negative) values of Rrs as detailed in         based on simple reflectance thresholds or using reflectance
Hu et al. (2010). For this reason, Rrc was preferred in float-         ratios in the blue–green range. Prior to using such classifica-
ing algal bloom concentration detection algorithms, as per-            tion schemes, the spectral signature of Trichodesmium mats
formed with the FAI in Hu et al. (2010) or with the Maxi-              using MODIS Rrs and Rrc need to be further investigated (see
mum Chlorophyll Index (MCI) in Gower et al. (2008). This               below).
issue is illustrated in Fig. 2, which presents a MODIS Aqua

Biogeosciences, 15, 5203–5219, 2018                                                          www.biogeosciences.net/15/5203/2018/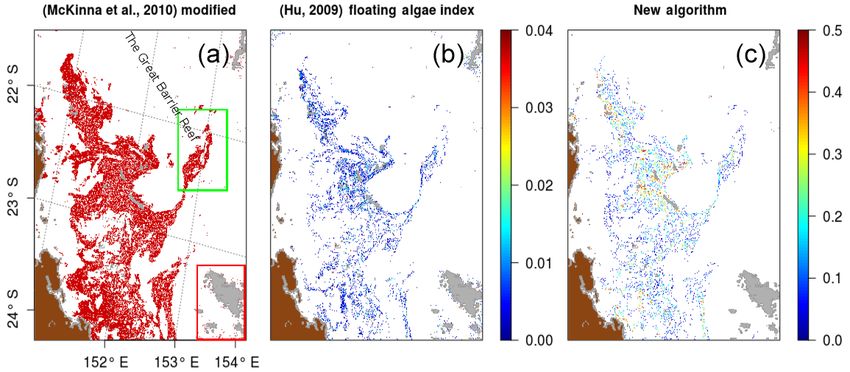
G. Rousset et al.: Remote sensing of Trichodesmium spp. mats 5207
Figure 2. MODIS Aqua tile A2007290.0355 used in McKinna et al. (2011): (a) RGB (red, green, blue) image from Rrc generated with
R = 645, G = 555, and B = 469 nm computed using the formulae 0.29319407 + 0.45585 × atan(50 × (Rrc ) − 0.015); (b) aerosol optical
thickness at 555 nm derived using the NIR atmospheric correction algorithm by Gordon and Wang (1994); (c) chlorophyll concentration
product computed from Rrs using OC3 and OCI (Hu et al., 2012). Cloud pixels are in grey and land pixels are in brown.
Table 2. Satellite image with in situ observations used to analyze 19 MODIS Aqua spectra out of the 50 pixels exhibited Tri-
Trichodesmium mat and adjacent spectra. chodesmium features similar to those documented in Hu et al.
(2010) and McKinna et al. (2011). In order to increase the
Tiles Date Location number of useful observations, the searching window was
A2002341.0255 7 December 2002 East of New Caledonia extended both in time (up to ±4 days), with the hypothesis
A2004047.0230 16 February 2004 Loyalty Islands that a bloom can last for v 1 week (e.g., Hegde et al., 2008),
A2004059.0255 28 February 2004 East of New Caledonia and spatially over ±50 km, i.e., v200 pixels at 250 m reso-
A2014344.0245 10 December 2014 Loyalty Islands
(east of Ouvéa) lution. This spatial relaxation up to ±50 km is motivated by
A2014351.0255 17 December 2014 Northeast of New Caledonia considering a maximum drifting speed of v10 cm s−1 for al-
A2014353.0240 19 December 2014 Between Vanuatu gae mats compatible with the observed surface drifts in that
and New Caledonia region (Rousselet et al., 2018; Cravatte et al., 2015). Also,
some in situ observations close spatially and temporarily (in
the same tile and at intervals of ±4 days) and increased our
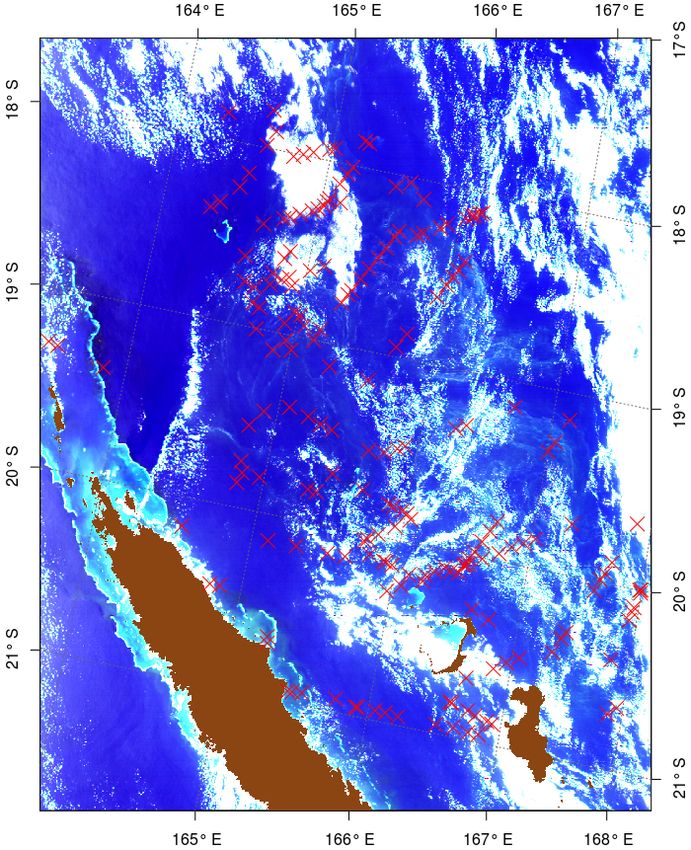
3.2 Extraction of the spectral signature of mats degree of confidence in identifying the filamentous patterns
due to Trichodesmium.
With the persistent cloud cover in the region, the number After extending the searching window, a total of
of strict coincidences of in situ observations and cloud-free 1200 spectra were extracted. Spectra were labeled, based on
MODIS pixels with visible Trichodesmium mats is small. To information provided by the FAI (Hu, 2009) and the presence
extract the Trichodesmium spectral signature corresponding or absence of visible mats in the true color image. When the
to the OBT, six tiles have been specifically selected (Table 2) pixel coincides with a visible mat on the true color image
and are used later on to test the different bio-optical algo- and is characterized with high FAI but low Chl a, it is la-
rithms designed to detect the Trichodesmium presence. These beled Type i: it is the signature of high algae concentration.
images have been chosen because they are relatively free Pixels in close proximity to Trichodesmium mats with low
of clouds, Trichodesmium mats are visible in the true color FAI and undetected mats in the true color image are labeled
images, and they contain many “ground-truth” observations Type ii. This second type of pixels is expected to have a high
(Fig. 3). number of Trichodesmium colonies although not aggregated,
The NASA Ocean Biology Processing Group method offering an opportunity to detect spectral features due to the
(Bailey and Werdell, 2006) to select matchups, i.e., average presence of Trichodesmium pigments other than Chl a.
or nearest pixel, was used to find coincidences between in
situ observations and clear MODIS satellite pixels. A total of 3.3 Robust spectral features over and near
468 coincident MODIS Aqua pixels and OBT observations Trichodesmium mats
were found. After data screening, only 50 pairs remained, in-
dicating that approximately 90 % of in situ observations were Figure 4b shows Type i average Rrc spectrum for 1 km res-
not usable, primarily because of cloud cover. Once inspected, olution images. Compared to the blue water spectrum (see
www.biogeosciences.net/15/5203/2018/ Biogeosciences, 15, 5203–5219, 2018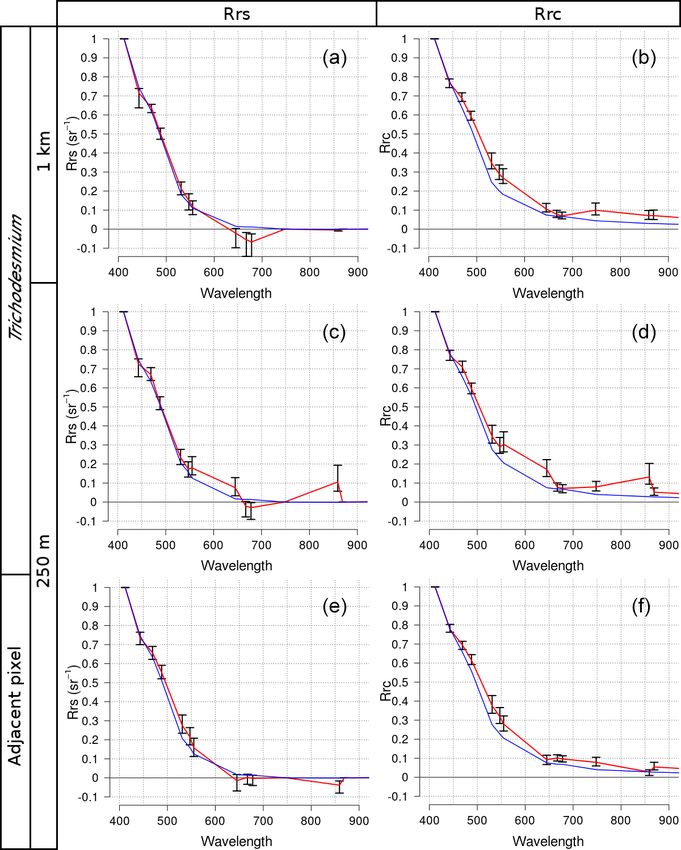
5208                                                                 G. Rousset et al.: Remote sensing of Trichodesmium spp. mats

                                                                         869 nm appears above Rrc (and Rrs ) at 859 nm. Hu (2009)
                                                                         had already noticed this issue for pixels with strong spatial
                                                                         gradients in the NIR part of the spectrum. It is interpreted as
                                                                         a result of the bilinear interpolation of 758 and 869 nm bands
                                                                         from 1 km to 250 m, using information from adjacent 1 km
                                                                         pixels.
                                                                            Unfortunately, in the visible region, there is little useful in-
                                                                         formation to capture Trichodesmium with Rrc (or Rrs ) spectra
                                                                         interpolated to 250 m, in both Type i and Type ii situations. In
                                                                         Trichodesmium blooms, a release of dissolved colored sub-
                                                                         stance was observed, as suggested by Hu et al. (2010) for
                                                                         coastal waters. For oligotrophic waters studied here, there
                                                                         was no such absorption in the blue region (412 nm) due to
                                                                         possible dissolved colored substances. Other characteristic
                                                                         features due to absorption maxima around 495 and 550 nm
                                                                         caused by the presence of phycourobilin and phycoerythro-
                                                                         bilin, respectively (see Fig. 5 in Hu et al., 2010), are not seen
                                                                         using the 600 spectra-composite spectrum. Finally, the only
                                                                         robust spectral feature in the visible range is a minimum
                                                                         in Rrc (and Rrs ) occurring at 678 nm, due to increasing re-
                                                                         flectance beyond 700 nm.
                                                                            Interestingly, comparison between Rrc and Rrs shows that
                                                                         standard deviation error bars are much smaller for Rrc re-
Figure 3. True color image of 17 December “2014A2014351.0255”            flectances while the range of magnitudes in between wave-
for which in situ observations (red crosses) exist in the OBT            lengths is larger. This is a significant argument for using Rrc
database, and it was used for the test and adjustment of the different   instead of Rrs , as it would lead to a better discrimination of
bio-optical algorithms.
                                                                         Trichodesmium mat spectra against other spectra.

                                                                         3.4   Two published algorithms
blue curve) no Trichodesmium spectral feature could be
detected in the visible and NIR spectral domain. The in-                 Among the existing Trichodesmium mat detection algo-
crease in Rrc beyond 700 nm indicates that, at low resolu-               rithms, only the McKinna et al. (2011) and Hu et al. (2010)
tion, the red edge effect is weakly discernible over floating            ones were designed for the MODIS sensor and were tested
algae, contrasting with robust signals detected by McKinna               in this study. The other algorithms were ignored as they were
et al. (2011) and Hu et al. (2010) using both hyperspectral              not adaptable to the MODIS sensor or would give erroneous
and MODIS 250 × 250 m observations over Trichodesmium                    results due to Chl a misestimation over Trichodesmium mats.
mats. As suggested by these authors, spectral sensors with                  The Trichodesmium mat detection algorithm of McKinna
1 km resolution are inappropriate to capture floating Tri-               et al. (2011) is based on four criteria relative to the shape of
chodesmium due to negligible signal from discrete mats once              Rrs (given in the Appendix A). When applied to the same
mixed with adjacent water in 1 × 1 km cells. The middle and              MODIS image (new collection) as the one used by McK-
bottom rows of Fig. 4 present Rrc and Rrs spectra interpo-               inna et al. (2011), more pixels were discarded due to the
lated to 250 m and partitioned in Type i and Type ii (middle             fourth criterion, which eliminated pixels with negative nor-
row and bottom row, respectively). For Type i, it is notewor-            malized water-leaving radiance (nLw) at 555, 645, 678, or
thy that the red edge signal is well captured in the NIR region          859 nm. Indeed, the test of a negative Rrs value at 678 nm due
at 859 nm, a MODIS land band with true 250 m resolution,                 to aerosol overcorrection excludes many pixels. Other atmo-
while in the 758 and 896 nm bands the derived signals using              spheric corrections, including that of Wang and Shi (2007)
bilinear interpolation are still low. One can notice that, af-           used by McKinna et al. (2011), have been applied with the
ter application of the NIR atmospheric correction, the shape             same results. Skipping the fourth criterion of the algorithm
of the mean Rrs spectra remains similar to that of Rrc , mi-             allowed us to match the results of McKinna et al. (2011).
nus an offset in the visible region, corresponding to subtrac-           Therefore, this modification was adopted for the present
tion of the flawed aerosol contribution (compare Fig. 4c with            study and the algorithm is called McKinna modified in the
Fig. 4d). Derived Rrs values at 748 and 869 nm are set to                following.
zero, as a result of the black pixel approximation.                         The Trichodesmium detection algorithm presented in Hu
   For Type ii, the red-edge effect totally disappears from the          et al. (2010) is based on a two-step analysis of Rrc spectra.
true 250 m band at 859 nm and the derived baseline 758–                  The first step captures floating algae with FAI. The second

Biogeosciences, 15, 5203–5219, 2018                                                            www.biogeosciences.net/15/5203/2018/
G. Rousset et al.: Remote sensing of Trichodesmium spp. mats 5209
Figure 4. MODIS spectra of Trichodesmium mats (a, b, c, d) and adjacent areas (e, f) normalized by the maximum spectral value of all
wavelengths, with pixel resolution at 1 km (a, b) and 250 m (c, d, e, f). Panels (a), (c), and (e) are Rrs reflectances. Panels (b), (d), and (f) are
Rrc reflectances. The average is the red line and error bars are the standard deviation. The average of the water signal is the blue line.
step resolves the ambiguities between Trichodesmium and 3.5 New algorithm criteria
Sargassum by analyzing spectral features in the blue–green
region. To overcome possible spectral influence due to inap- Our criteria for detecting Trichodesmium mats were defined
propriate atmospheric correction, Hu et al. (2010) proposed based on spectral characteristics of Rrs and Rrc (Fig. 4). Sim-
a simple correction method based on the difference in Rrc ilar to the algorithms of Hu et al. (2010) and McKinna et al.
spectra between a bloom and nearby algae-free region. Af- (2011) (see Appendix), three criteria given in Eqs. (1)–(3)
ter several tries on the data presented above, the second step were defined to extract the typical spectrum shape of Tri-
was found to be sensitive to the choice of the algae-free re- chodesmium. The first criterium (Eq. 1) takes advantage of
gion (not shown). Thus, the detection was made only by ap- the systematic negative Rrs values at 678 nm over strong Tri-
plying thresholds to FAI. After tuning, the best results were chodesmium mat concentrations. All pixels with a negative
obtained when FAI was between 0 and 0.04. Rrs value at this wavelength have a high probability of being
floating algae and thus Trichodesmium in this region. More-
over, this criterium can also be used to detect some artifacts,
e.g., sun glint.
www.biogeosciences.net/15/5203/2018/ Biogeosciences, 15, 5203–5219, 20185210 G. Rousset et al.: Remote sensing of Trichodesmium spp. mats
Figure 5. Trichodesmium mat detection results on MODIS tile “A2007290.0355”. (a) Detected pixels with the McKinna modified algorithm
in red; (b) FAI value of detected pixels with the FAI algorithm; (c) pixels detected with the new algorithm, and color represents the Rrs (678)
absolute value of the detected pixels. Cloud pixels are in grey.
The second criterium (Eq. 2) is based on Rrc (748) and algorithms both detect Trichodesmium pixels. These pixels
Rrc (859) to detect the spectral shape in the NIR associated were identified as false positives as their spatial distribution
with the surface Trichodesmium mats. The third criterium is sparse and only in the vicinity of clouds. This conclu-
(Eq. 3) uses Rrc (645) and Rrc (531) to resolve ambiguities sion is also supported by the true color composition (Fig. 2)
between Trichodesmium mats and incorrectly selected pixels for which the only Trichodesmium mats appear located at
after processing with the previous criteria, the misdetections the bottom of the image. In that area the new algorithm
occurring mostly near clouds (Eq. 3). does not make any false positive detection while keeping
the Trichodesmium mats at the bottom of the image. The ro-
Rrs (678) < 0 (1) bustness of the new detection algorithm to exclude cloud-
Rrc (748) < Rrc (859) (2) contaminated pixels while keeping accurate Trichodesmium
mat detection is an important improvement for regions with
Rrc (645) < Rrc (531) (3)
high cloudiness, such as the WTSP.
4.2 Algorithm performance against in situ mat
observations
4 Results
The exact coincidence in time and space between in situ
4.1 Comparison with previous algorithms Trichodesmium mat observations and satellite mat detection
is quite difficult to reach in general. One of the main rea-
The detection results of the three Trichodesmium detec- sons is the cloud cover, which eliminates a large quantity
tion algorithms are illustrated in Fig. 5 on the MODIS tile of the possible comparisons (90 %). A second reason is the
A2007290.0355, used in McKinna et al. (2011). The McK- elapsed time between in situ observations and the corre-
inna modified algorithm shows the same detection patterns sponding satellite pass during which the floating algae could
as the ones found in McKinna et al. (2011). It is a vast have drifted at sea surface and/or migrated vertically depend-
Trichodesmium area within which the filamentous structures ing on sea conditions (temperature, wind, etc.). For example,
cannot be distinguished. The new algorithm and the thresh- the abundance of Trichodesmium at the sea surface may vary
old FAI detect thin filamentous structures more similar to with the time of day, as a daily cycle of rising and sinking
Trichodesmium mat structures observed in airborne pho- colonies in the water column is often observed as a result of
tographs. When negative, the absolute value of Rrs (678) can cell ballasting (Villareal and Carpenter, 2003). Moreover, as
also be used as an index of mat concentrations as values in- Trichodesmium is a buoyant constituent, it can be advected
crease when getting to the core of patches. by surface currents.
Compared with both former algorithms, the new algorithm To circumvent that problem and perform a more statisti-
performs much better near clouds. Figure 6 is a zoom of cally robust comparison of the detection results of our algo-
the area delineated by the red rectangle in Fig. 5. This area rithm with in situ data, we used the following strategy. An
presents a cloud patch in which McKinna modified and FAI analysis of the spatiotemporal distance between the in situ
Biogeosciences, 15, 5203–5219, 2018 www.biogeosciences.net/15/5203/2018/G. Rousset et al.: Remote sensing of Trichodesmium spp. mats 5211
Figure 6. MODIS tile “A2007290.0355” zoom of the red square area (24◦ S, Fig. 5). Pixels resulting from a false positive detection of (a) the
McKinna modified algorithm, (b) FAI, and (c) the new algorithm for the area in red in Fig. 5. Cloud pixels are in grey.
observations and the nearest detected mats was conducted. show that Trichodesmium contribution was maximum in the
As explained previously, for each day in a range of ±4 days Melanesian Archipelago, i.e., the western part of the tran-
around the date of observation, the spatial distance between sect, where slicks are numerous, and then fairly well related
the position of the observation and the nearest detected mat to Trichodesmium concentrations in the upper layer (Dupouy
was computed. Overall, 80 % of the observed mats have a et al., 2018). The other high spot of mats detected in the satel-
corresponding mat detection within a less than 5 km range lite imagery is at LDB (station name in OUTPACE), where
independent of the detection algorithm used. These results no slick was observed but where Trichodesmium was in high
demonstrate the statistical capability of the new algorithm to concentration, although mixed with a high abundance of pi-
retrieve a mat near a point of observation. coplanktonic cyanobacteria (Dupouy et al., 2018).
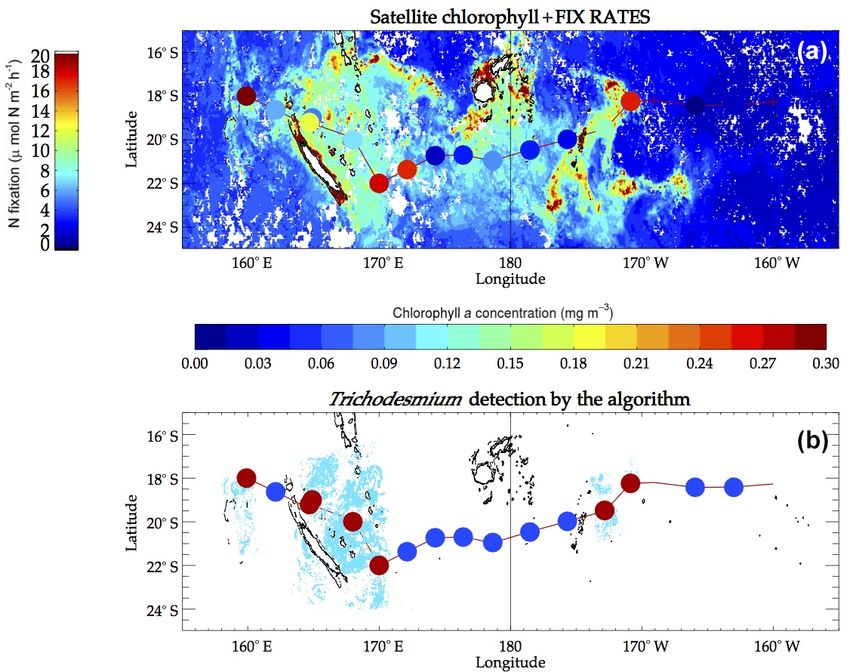
Bonnet et al. (2018) reported a significant (p < 0.05) cor-
4.3 Algorithm application for the OUTPACE cruise relation between N2 fixation rates and Trichodesmium abun-
dances during OUTPACE. Based on bulk and cell-specific
The new algorithm was applied to MODIS data acquired dur- N2 -based isotopic measurements, Trichodesmium accounted
ing the OUTPACE cruise time. A total of 140 tiles at 250 m for 50 to > 80 % of N2 fixation rates in this region at the
resolution covered the time period 15 February–7 April 2015 time of the cruise. Such a high correlation between Tri-
and the spatial area of the cruise. Due to high cloud cover chodesmium biomass (here phycoerythrin) was also mea-
during the cruise, only a few tiles were exploitable. Tri- sured in New Caledonia waters (Tenório et al., 2018). Hence,
chodesmium mats were detected from 12 MODIS Aqua and the in situ N2 fixation rate measured during the cruise
three MODIS Terra tiles. Figure 7b shows the detected mats (Fig. 7a) was used as a robust proxy of the Trichodesmium
over these tiles (in blue). Note that the OUTPACE cruise concentration to further evaluate accuracy of satellite detec-
actually crossed a number of Trichodesmium satellite detec- tions. A qualitative comparison between Fig. 7a and b indi-
tions. In order to further illustrate the results, a crude qual- cates that when significant fixation rates were observed, Tri-
itative presence–absence scheme was applied to better visu- chodesmium presence was detected by the satellite algorithm
alize which OUTPACE stations were coincident with the al- and when N2 fixation rates were low, Trichodesmium absence
gorithm positive detection. We selected areas within 50 km was stated. Although qualitative, this successful validation
of each OUTPACE station and labeled the station presence gives confidence in using our algorithm for Trichodesmium
when there was at least 1 pixel detected as positive in the detection.
satellite algorithm. In Fig. 7b, the red points indicate pres-
ence and blue points absence.
Trichodesmium mats were mostly observed visually north- 5 Discussion
east of New Caledonia 1 week before the cruise and during
the first days of the cruise (onboard observation) by video 5.1 Algorithm limitations
and photographs. No other mats were observed during the
rest of the cruise, but there was not any dedicated observer The proposed algorithm was designed to detect strong con-
who would actually permit such visual observation, unlike centrations of floating Trichodesmium mats and limit wrong
during the (REMMOA) campaigns. Nevertheless, Underwa- detections. However, floating Trichodesmium mats occur
ter Vision Profiler 5 (UVP5) counts of colonies and phy- when the sea surface is not very agitated since they tend to
coerythrin and trichome concentrations along the transect sink and disperse in rough conditions. In such a case our al-
www.biogeosciences.net/15/5203/2018/ Biogeosciences, 15, 5203–5219, 20185212 G. Rousset et al.: Remote sensing of Trichodesmium spp. mats Figure 7. (a) Background is the monthly composite of satellite chlorophyll for March 2015, with the corresponding chlorophyll a concentra- tions given by the color bar underneath the map. Superimposed colored dots are in situ fixation rates measured on the OUTPACE track with values given by the left color bar. (b) In the background, cyan pixels are pixels detected as Trichodesmium by our algorithm. The colored dots superimposed show the absence (blue) or presence (red) of detected pixels within a radius of 50 km around OUTPACE stations. gorithm does not allow the detection of Trichodesmium even Therefore, the robustness of this algorithm in the presence of at strong concentrations because of the low penetration depth other floating algae (e.g., Sargassum), as well as in other re- of NIR irradiance (below 1 m). This situation occurred during gions of the world, would have to be tested to make it more the OUTPACE cruise, for which measurements reveal high general. Trichodesmium abundances near the Fiji island (Stenegren This study was limited to the processing of MODIS im- et al., 2018), while our algorithm was unable to detect Tri- ages, mainly because of the availability of images corre- chodesmium mats (Fig. 7, stations adjacent 180◦ E). sponding to field measurements (2014 and before). However, Another limitation concerns the validity of the new algo- it would be worth extending the detection algorithm to other rithm for future MODIS collections and other regions. The sensors such as MERIS, e.g., for comparison with the Gower first criterion is taking advantage of the aerosol overcorrec- et al. (2014) algorithm, and the recently launched Ocean and tion as an index of floating algae. The aerosol correction al- Land Colour Instrument (OLCI). This would require further gorithm will certainly be adapted in the future. Thus, the first investigations to adapt the algorithm to the specific bands of criterion would have to be replaced by another floating al- these sensors and evaluate the results. However, since these gae index; the FAI could be a good solution. However, it sensors cover the same spectral range, one can expect a quite will always be possible to use the current (imperfect) aerosol similar behavior. correction. Moreover, the zero threshold on Rrs (678), under Aware of these limitations, one may consider using Rrc which the pixel is labeled as a Trichodesmium mat, would only since Rrs is sensitive to the accuracy of the atmo- have to be tested and tuned in other situations, e.g., in the spheric correction. To emulate an index of mat concentra- presence of aerosols and other floating material. This study tions, Eq. (4) is proposed in place of Eq. (1). The magnitude was carried out in the WTSP area, where the observed spec- of the trough at 678 nm is an indication of the mat concen- tra seem slightly different from the ones reported in McKinna trations, which can be retrieved using the difference between et al. (2011) and Hu et al. (2010). More specifically, the spec- the observed Rrc (678) and the result of the linear Rrc interpo- tral oscillations of reflectance observed by Hu et al. (2010) in lation between 645 and 748 nm. In the following, To confirm the range [412, 678] nm were not noticed in the present study. the trough at 678 nm, check the spectral form typical to Tri- Biogeosciences, 15, 5203–5219, 2018 www.biogeosciences.net/15/5203/2018/
G. Rousset et al.: Remote sensing of Trichodesmium spp. mats                                                                       5213

chodesmium (Fig. 4) and assess the red edge of the signal,
Eqs. (5)–(7), similar to the form criteria of McKinna et al.
(2011), could be used.
[Rrc (645) + (Rrc (748) − Rrc (645))

      678 − 645
   ×               − Rrc (678) > 0                          (4)
      748 − 645
Rrc (678) < Rrc (859)                                       (5)
Rrc (678) < Rrc (748)                                       (6)
Rrc (678) < Rrc (667)                                       (7)
   This alternative algorithm has the advantage of being eas-
ily adaptable to other sensors with similar spectral bands
(e.g., MODIS). Moreover, the procedure is free of atmo-
                                                                   Figure 8. FAI application to the MODIS tile “A2007290.0355”:
spheric overcorrection while still exploiting the red-edge ef-
                                                                   zoom of the area in the green square (22.5◦ S, Fig. 5). (a) Results at
fect. However, in its application, a large number of pixels        250 m resolution; (b) the same scene at 1 km resolution. Only a few
detected as Trichodesmium by the former algorithm (i.e., de-       pixels remain, corresponding to the densest part of the surface mat,
scribed in Sect. 3.5) are discarded. The different criteria can-   showing the loss of detected mats.
not be relaxed without a false positive detection increase.
Therefore, this alternative algorithm is more restrictive, and
its suitability and performance require further examination.       to characterize the presence of the filaments could be
                                                                   found in the finite-size Lyapunov exponent (FSLE) methods
5.2   Spatial resolution impact                                    (Rousselet et al., 2018). A relationship between FSLE only
                                                                   and in situ chlorophyll edge “fronts” was found during OUT-
As indicated previously, only a few spectral bands (land
                                                                   PACE with a 25 % correlation score. The same kind of rela-
channels) have a high resolution (250 or 500 m), while the
                                                                   tionship was expected for floating algae filaments. However,
rest have a nominal resolution at 1 km. To investigate the
                                                                   the relationship between FSLE and the organization of the
influence of resolution on the spectral signature of Tri-
                                                                   filaments could not be proven within this study. We believe
chodesmium mats, the spectral analysis was also conducted
                                                                   that it is also a question of scale here. The present calcula-
at a 1 km resolution. Dense groups of extended mats are still
                                                                   tion of FSLE is uses 12.5 km satellite data at best (Rousselet
well detected at 1 km resolution. However, thinner mats with
                                                                   et al., 2018); thus it is difficult to think that such a resolu-
a weaker signal visible at 250 m resolution are lost at 1 km
                                                                   tion could catch dynamics Trichodesmium filaments wide of
resolution. Figure 8 illustrates this behavior for MODIS data.
                                                                   a few hundred meters. A dedicated in situ experiment would
   The spatial structure of Trichodesmium aggregates is com-
                                                                   have to be specifically undertaken to resolve the question of
plex. When mats are present, Trichodesmium have a ten-
                                                                   filament organization.
dency to form a filamentous pattern much narrower than
250 m (50 m at most, according to visual detections), and
thus the satellite sensor at 250 m resolution can only de-         6   Conclusions and perspectives
tect the largest ones (Figs. 8 and 9). Hence, there is a scale
mismatch between the exact form of the thin filaments and          At present, previously published algorithms detecting Tri-
the actual detection by the current satellite data, which must     chodesmium using the current MODIS data archive (Hu
in a way average the thin and strongest filaments into sig-        et al., 2010; McKinna et al., 2011) cannot be directly used
nals detectable at 250 m. Understanding the shape of the fil-      in the South Pacific as they either miss the mats due to al-
aments and their physical characteristics (e.g., width) will       gorithm failures (Sect. 3.4) and/or do not eliminate numer-
require much higher-resolution satellite data (at least 50 m),     ous false positives in the presence of clouds. In our study,
which are available at present but without repetitive cover-       we have devised a new algorithm building on the previous
age. Figure 9 additionally illustrates that the Trichodesmium      ones, which allows a cleaner and more robust detection of
filaments are but a tiny part of the chlorophyll tongues and       those mats. Validation was accomplished using a new, up-
are inserted into the much wider chlorophyll patterns. There       dated database of mats in the South Pacific. This algorithm
can be, within a chlorophyll tongue such as that in Fig. 9,        can however only detect the densest slick but achieves the
several thin elongated filaments.                                  goal of limiting the detection of false positive due to clouds.
   One would also intuitively believe that the filaments il-       During the OUTPACE cruise, satellite detections confirmed
lustrate the presence of dynamical fronts where conver-            the presence of Trichodesmium slicks at a much wider spatial
gent dynamics can maintain and participate in the mat              range than what was possible to observe from the ship. This
aggregations. A natural dynamical criteria allowing one            illustrates the important contribution and complementary na-

www.biogeosciences.net/15/5203/2018/                                                        Biogeosciences, 15, 5203–5219, 2018
5214 G. Rousset et al.: Remote sensing of Trichodesmium spp. mats Figure 9. MODIS Aqua image at 250 m taken on 6 March 2015 to the south of the OUTPACE cruise, illustrating the structure of the chlorophyll (colors) together with the filaments of Trichodesmium detected by our algorithm (in black). Cloud pixels are in white. ture of satellite observations to in situ measurements. Yet, and to a new and better algorithm. This may be possible, the new detection algorithm was developed and evaluated for at least regarding spatial resolution, with the Multispectral the WTSP region. Hence, future prospects will be to extend Instrument (MSI) onboard the Sentinel-2 series (10 to 60 m the evaluation to other regions, especially in the presence of resolution). other floating algae such as Sargassum. It has previously been documented that near dense Tri- During the same campaign Dupouy et al. (2018) found that chodesmium mats some satellite products like the satellite ocean color measured with a Satlantic UV–VIS radiometer chlorophyll concentration are inaccurate. In order to bet- at greenish blue and yellowish green wavelengths was not ter constrain the contribution of Trichodesmium to nitrogen totally linked to Chl a and that an extra factor independent and carbon biogeochemical cycles, this algorithm must be of Chl a, maybe related to colony backscattering or fluo- corrected. Using Rrc instead of Rrs is possible (Sect. 5.1), rescence, governs part of the variability. This extra factor is but some adjustments and comparisons with in situ mea- not observed during BIOSOPE (Biogeochemistry and Optics surements must first be carried out. Globally such an al- South Pacific Experiment), a cruise in the tropical South- gorithm would allow one to estimate the Trichodesmium ern Pacific gyre (Claustre et al., 2008), where the radiance amount aggregated in sea surface mats. The next step is to is correlated to Chl a only. Further investigations have to be understand the quantitative aspect linking the Trichodesmium conducted to confirm that such a signal is produced by Tri- abundances to N2 fixation rates, including their vertical dis- chodesmium and can be detected from space. tribution even when Trichodesmium filaments/colonies are MODIS Terra and MODIS Aqua satellite sensors have spread out in the water column. Another important field of been acquiring data since 2000 and 2002, respectively. How- interest is to be able to understand phytoplankton functional ever, the data quality of these sensors is becoming more types using satellites including Trichodesmium (de Boissieu and more uncertain with time, as their lifetime was not ex- et al., 2014). At present, we do not know any such study that pected to last more than 6 years. The new algorithm could included Trichodesmium but we have hopes that with our new be adapted to other satellite instruments with similar spectral in situ database and our understanding of the mat shapes de- bands, for example the Visible Infrared Imaging Radiome- tected in the present study, and the development of perform- ter Suite (VIIRS) onboard NPP and JPSS-1/NOAA-20 (1 km ing statistical methods such as machine learning, advances resolution) and OLCI onboard Sentinel-3 (300 m spatial sam- can be made in that regard, a prospect for future work. pling), but the spatial resolution remains a problem as we ob- Finally, Dutheil et al. (2018) explore the regional and sea- served that 250 m was already too coarse a resolution to un- sonal budget of the N2 fixation due to Trichodesmium in a nu- derstand the thinner mat dynamics. A study with better spec- merical model based on physical and biogeochemical prop- tral and spatial resolution may lead to better performances erties that does not take into consideration the spatial charac- Biogeosciences, 15, 5203–5219, 2018 www.biogeosciences.net/15/5203/2018/
G. Rousset et al.: Remote sensing of Trichodesmium spp. mats                                        5215

teristic of Trichodesmium colonies to aggregate in mats. One
interesting aspect will be to find a way to integrate our re-
sults into such a model to better estimate the regional effects
of that species.

Data availability. Satellite data are publicly accessible at https:
//oceandata.sci.gsfc.nasa.gov/ (NASA Goddard Space Flight Cen-
ter, 2014). Data from the OUTPACE cruise under the PI respon-
sibilities (described at http://www.obs-vlfr.fr/proof/php/outpace/
outpace.php, INSU/CNRS LEFE CYBER, 2017). Access to
the data is available with PI permission. REMMOA database
available only with private access; a request should be ac-
quired from Sophie Laran or Vincent Ridoux (slaran@univ-lr.fr,
vincent.ridoux@univ-lr.fr). French Navy and other Trichodesmium
observations accessible at https://doi.org/10.5194/bg-8-3631-2011
(Dupouy et al., 2011).

www.biogeosciences.net/15/5203/2018/                                  Biogeosciences, 15, 5203–5219, 2018
5216                                                              G. Rousset et al.: Remote sensing of Trichodesmium spp. mats

Appendix A: McKinna et al. (2011) algorithm

The McKinna et al. (2011) algorithm is based on the analysis                                          λNIR − λRED
                                                                      Rrc,NIR + (Rrc,SWIR − Rrc,RED ) ×           ,           (B1)
of the above-water reflectance spectrum of a moderate Tri-                                           λSWIR − λRED
chodesmium mat, similar to the one measured on colonies               λRED = 645 nm, λNIR = 859 nm, λSWIR = 1240 nm,          (B2)
in a small dish with an Ocean Optics spectroradiometer
(Dupouy et al., 2008). It uses typical spectral characteris-          where RED = 645 nm, NIR = 859 nm, and SWIR =
tics of the normalized water-leaving radiance (nLw) after at-         1240 nm. According to Hu et al. (2010), the difference
mospheric correction to define four Trichodesmium detection           between Rrc and Rrc,0 (the second term of Eq. B1) allows
criteria. The first three criteria relate to the shape of the spec-   one to deal with the majority of the atmospheric effect,
trum and the last criterion discards any pixel with negative          which has a quasi-linear spectral shape between 667 and
nLw. When these four criteria are respected the pixel is iden-        1240 nm. The second step of the algorithm consists in
tified as revealing the presence of Trichodesmium.                    identifying the mats emphasized by the FAI thanks to the
                                                                      shape of the spectrum in the visible domain. So as to correct
                                                                      the bias inferred in the visible part of the spectrum by the
nLw(859) > c1.nLw(678)                                       (A1)     possible presence of mats, Hu et al. (2010) suggest applying
nLw(645) > nLw(678)                                          (A2)     the correction of an area situated immediately next to this
                                                                      pixel and without bloom to the pixels presenting a strong
nLw(555) > nLw(678)                                          (A3)
                                                                      FAI value. This approach being very computer expensive,
nLw(555), nLw(645), nLw(678), nLw(859) < 0                   (A4)     it is substituted by a simple difference between the Rrc
                                                                      spectrum of the pixels considered (i.e., eventually with
                                                                      Trichodesmium) and that of a nearby zone without mat. The
Appendix B: Hu et al. (2010) algorithm
                                                                      spectrum of this Rrc difference presents a pattern (spectral
The detection algorithm, originally developed by (Hu, 2009)           signature) that seems to be specific to Trichodesmium
for floating algae, can be applied to Trichodesmium mats, as          presence, i.e., a succession of high-type low–top–low–top
demonstrated by Hu et al. (2010) on MODIS Aqua images                 for the wavelengths 469–488–531–551–555 nm.
of the west coast of Florida and the Gulf of Mexico, even
though the Trichodesmium mats occurred in Case 2 waters.
This algorithm can be decomposed into two steps: (1) detec-
tion of floating algae (FAI, floating algae index), and (2) test-
of-form criteria of the radiance spectrum.
   The FAI aims to detect the strong reflectance in the in-
frared (red edge) of the algal agglomerate. To avoid the at-
mospheric overcorrection linked to the red-edge effect of the
floating algae organized in a heap (Hu, 2009), the calculation
of this index is applied to reflectance corrected only for the
effects of Rayleigh scattering (Rrc ). This correction accounts
for the major part of the color of the atmosphere if aerosols
are not too abundant (i.e., small optical thickness). The FAI
is then defined as the difference between Rrc in the infrared
(859 nm for MODIS) and a reference reflectance (Rrc,0 ) cal-
culated using linear interpolation between the red and short-
wave infrared, i.e., 667 and 1240 nm for MODIS:

Biogeosciences, 15, 5203–5219, 2018                                                       www.biogeosciences.net/15/5203/2018/
G. Rousset et al.: Remote sensing of Trichodesmium spp. mats 5217
Author contributions. GR conceived the study. FDB, CEM, JL, and denitrification, P. Natl. Acad. Sci. USA, 114, E2800–E2801,
RF provided technical support. VR and SL provided the REMMOA https://doi.org/10.1073/pnas.1619514114, 2017.
data. MR, SB, and CD participated in the collection and analysis Bonnet, S., Caffin, M., Berthelot, H., Grosso, O., Benavides,
of samples. GR and FDB wrote the manuscript with contributions M., Helias-Nunige, S., Guieu, C., Stenegren, M., and Fos-
from CEM, JL, RF, SB, and CD. ter, R. A.: In-depth characterization of diazotroph activity
across the western tropical South Pacific hotspot of N2 fix-
ation (OUTPACE cruise), Biogeosciences, 15, 4215–4232,
Competing interests. The authors declare that they have no conflict https://doi.org/10.5194/bg-15-4215-2018, 2018.
of interest. Caffin, M., Moutin, T., Foster, R. A., Bouruet-Aubertot, P., Dogli-
oli, A. M., Berthelot, H., Guieu, C., Grosso, O., Helias-Nunige,
S., Leblond, N., Gimenez, A., Petrenko, A. A., de Verneil, A.,
Special issue statement. This article is part of the special issue “In- and Bonnet, S.: N2 fixation as a dominant new N source in
teractions between planktonic organisms and biogeochemical cy- the western tropical South Pacific Ocean (OUTPACE cruise),
cles across trophic and N2 fixation gradients in the western tropical Biogeosciences, 15, 2565–2585, https://doi.org/10.5194/bg-15-
South Pacific Ocean: a multidisciplinary approach (OUTPACE ex- 2565-2018, 2018.
periment)”. It is not associated with a conference. Capone, D. G.: Trichodesmium, a Globally Significant Marine
Cyanobacterium, American Association for the Advancement of
Science, 1997.
Casey, K. A., Polashenski, C. M., Chen, J., and Tedesco, M.: Impact
Acknowledgements. Robert Frouin is supported by the National
of MODIS sensor calibration updates on Greenland Ice Sheet
Aeronautics and Space Administration under various grants. We
surface reflectance and albedo trends, The Cryosphere, 11, 1781–
thank NASA for the MODIS products.
1795, https://doi.org/10.5194/tc-11-1781-2017, 2017.
Claustre, H., Sciandra, A., and Vaulot, D.: Introduction to the
Edited by: Thierry Moutin
special section bio-optical and biogeochemical conditions in
Reviewed by: two anonymous referees
the South East Pacific in late 2004: the BIOSOPE program,
Biogeosciences, 5, 679–691, https://doi.org/10.5194/bg-5-679-
2008, 2008.
Cravatte, S., Kestenare, E., Eldin, G., Ganachaud, A.,
References Lefèvre, J., Marin, F., Menkes, C., and Aucan, J.: Re-
gional circulation around New Caledonia from two
Bailey, S. W. and Werdell, P. J.: A multi-sensor ap- decades of observations, J. Marine Syst., 148, 249–271,
proach for the on-orbit validation of ocean color satel- https://doi.org/10.1016/j.jmarsys.2015.03.004, 2015.
lite data products, Remote Sens. Environ., 102, 12–23, de Boissieu, F., Menkes, C., Dupouy, C., Rodier, M., Bon-
https://doi.org/10.1016/j.rse.2006.01.015, 2006. net, S., Mangeas, M., and Frouin, R. J.: Phytoplankton
Berthelot, H., Benavides, M., Moisander P, H., Grosso, O., and global mapping from space with a support vector machine
Bonnet, S.: High-nitrogen fixation rates in the particulate and algorithm, in: Ocean Remote Sensing and Monitoring from
dissolved pools in the Western Tropical Pacific (Solomon Space, edited by: Frouin, R. J., Pan, D., and Murakami, H.,
and Bismarck Seas), Geophys. Res. Lett., 44, 8414–8423, https://doi.org/10.1117/12.2083730, 2014.
https://doi.org/10.1002/2017GL073856, 2017. Dupouy, C., Jacques, N., Subramaniam, A., R. Mulholland,
Blondeau-Patissier, D., Gower, J. F. R., Dekker, A. G., Phinn, S. R., M., Montoya, J., Campbell, L., and Capone, D. G.: Satel-
and Brando, V. E.: A review of ocean color remote sensing meth- lite captures Trichodesmium blooms in the Soutwestern
ods and statistical techniques for the detection, mapping and Tropical Pacific, EOS T. Am. Geophys. Un., 81, 13–20,
analysis of phytoplankton blooms in coastal and open oceans, El- https://doi.org/10.1029/00EO00008, 2000.
sevier Ltd, https://doi.org/10.1016/j.pocean.2013.12.008, 2014. Dupouy, C., Neveux, J., Dirberg, G., Röttgers, R., Barboza Tenório,
Bonnet, S., Biegala, I. C., Dutrieux, P., Slemons, L. O., and M. M., and Ouillon, S.: Bio-optical properties of the marine
Capone, D. G.: Nitrogen fixation in the western equatorial Pa- cyanobacteria Trichodesmium spp., J. Appl. Remote Sens., 2,
cific: Rates, diazotrophic cyanobacterial size class distribution, 023503, https://doi.org/10.1117/1.2839036, 2008.
and biogeochemical significance, Global Biogeochem. Cy., 23, Dupouy, C., Benielli-Gary, D., Neveux, J., Dandonneau, Y., and
1–13, https://doi.org/10.1029/2008GB003439, 2009. Westberry, T. K.: An algorithm for detecting Trichodesmium
Bonnet, S., Rodier, M., Turk-Kubo, K., Germineaud, C., Menkes, surface blooms in the South Western Tropical Pacific, Bio-
C., Ganachaud, A., Cravatte, S., Raimbault, P., Campbell, E., geosciences, 8, 3631–3647, https://doi.org/10.5194/bg-8-3631-
Quéroué, F., Sarthou, G., Desnues, A., Maes, C., and Eldin, G.: 2011, 2011.
Contrasted geographical distribution of N2 fixation rates and Dupouy, C., Frouin, R., Tedetti, M., Maillard, M., Rodier, M., Lom-
nifH phylotypes in the Coral and Solomon Seas (southwestern bard, F., Guidi, L., Picheral, M., Duhamel, S., Charrière, B., and
Pacific) during austral winter conditions, Global Biogeochem. Sempéré, R.: Diazotrophic Trichodesmium influence on ocean
Cy., 29, 1874–1892, https://doi.org/10.1002/2015GB005117, color and pigment composition in the South West tropical Pa-
2015. cific, Biogeosciences Discuss., https://doi.org/10.5194/bg-2017-
Bonnet, S., Caffin, M., Berthelot, H., and Moutin, T.: Hot 570, in review, 2018.
spot of N2 fixation in the western tropical South Pacific
pleads for a spatial decoupling between N2 fixation and
www.biogeosciences.net/15/5203/2018/ Biogeosciences, 15, 5203–5219, 2018You can also read