Aerosol measurement methods to quantify spore emissions from fungi and cryptogamic covers in the Amazon
←
→
Page content transcription
If your browser does not render page correctly, please read the page content below
Atmos. Meas. Tech., 13, 153–164, 2020
https://doi.org/10.5194/amt-13-153-2020
© Author(s) 2020. This work is distributed under
the Creative Commons Attribution 4.0 License.

Aerosol measurement methods to quantify spore emissions from
fungi and cryptogamic covers in the Amazon
Nina Löbs1 , Cybelli G. G. Barbosa1 , Sebastian Brill1 , David Walter1,2 , Florian Ditas1 , Marta de Oliveira Sá3 ,
Alessandro C. de Araújo4 , Leonardo R. de Oliveira3 , Ricardo H. M. Godoi5 , Stefan Wolff1 , Meike Piepenbring6 ,
Jürgen Kesselmeier1 , Paulo Artaxo7 , Meinrat O. Andreae1,8 , Ulrich Pöschl1 , Christopher Pöhlker1 , and
Bettina Weber1,9
1 Multiphase   Chemistry and Biogeochemistry Departments, Max Planck Institute for Chemistry, Mainz, 55128, Germany
2 Department    of Biogeochemical Processes, Max Planck Institute for Biogeochemistry, Jena, 07701, Germany
3 Large-Scale Biosphere–Atmosphere Experiment in Amazonia (LBA), Instituto Nacional de Pesquisas

da Amazonia (INPA), Manaus-AM, CEP 69067-375, Brazil
4 Empresa Brasileira de Pesquisa Agropecuária (EMBRAPA), Belém-PA, CEP 66095-100, Brazil
5 Department of Environmental Engineering, Federal University of Paraná UFPR, Curitiba, PR, Brazil
6 Department of Mycology, Goethe University Frankfurt/Main, Frankfurt, 60438, Germany
7 Institute of Physics, University of São Paulo 05508-900, Brazil
8 Scripps Institution of Oceanography, University of California San Diego, La Jolla, CA 92037, USA
9 Institute of Plant Sciences, University of Graz, Holteigasse 6, 8010 Graz, Austria

Correspondence: Nina Löbs (n.loebs@mpic.de), Christopher Pöhlker (c.pohlker@mpic.de),
and Bettina Weber (b.weber@mpic.de)

Received: 11 June 2019 – Discussion started: 13 August 2019
Revised: 20 November 2019 – Accepted: 25 November 2019 – Published: 15 January 2020

Abstract. Bioaerosols are considered to play a relevant role    ber of newly released fungal spores under controlled condi-
in atmospheric processes, but their sources, properties, and    tions, simultaneously measuring temperature and relative hu-
spatiotemporal distribution in the atmosphere are not yet       midity inside the cuvette. Both approaches were combined
well characterized. In the Amazon Basin, primary biologi-       with bioaerosol sampling techniques to characterize the re-
cal aerosol particles (PBAPs) account for a large fraction of   leased particles using microscopic methods. For fruiting bod-
coarse particulate matter, and fungal spores are among the      ies of the basidiomycetous species, Rigidoporus microporus,
most abundant PBAPs in this area as well as in other vege-      the model species for which these techniques were tested,
tated continental regions. Furthermore, PBAPs could also be     the highest frequency of spore release occurred in the range
important ice nuclei in Amazonia. Measurement data on the       from 62 % to 96 % relative humidity. The results obtained for
release of fungal spores under natural conditions, however,     this model species reveal characteristic spore release patterns
are sparse. Here we present an experimental approach to an-     linked to environmental or experimental conditions, indicat-
alyze and quantify the spore release from fungi and other       ing that the moisture status of the sample may be a regu-
spore-producing organisms under natural and laboratory con-     lating factor, whereas temperature and light seem to play a
ditions. For measurements under natural conditions, the sam-    minor role for this species. The presented approach enables
ples were kept in their natural environment and a setup was     systematic studies aimed at the quantification and validation
developed to estimate the spore release numbers and sizes as    of spore emission rates and inventories, which can be applied
well as the microclimatic factors temperature and air humid-    to a regional mapping of cryptogamic organisms under given
ity in parallel to the mesoclimatic parameters net radiation,   environmental conditions.
rain, and fog occurrence. For experiments in the laboratory,
we developed a cuvette to assess the particle size and num-

Published by Copernicus Publications on behalf of the European Geosciences Union.
154                                                N. Löbs et al.: Aerosol measurement methods to quantify spore emission

1   Introduction                                                     Cryptogams, including lichenized and non-lichenized
                                                                  fungi, bryophytes, and ferns cover the surfaces of up to 100 %
                                                                  of plants in tropical rain forests. They can be expected to play
Particles released from the biosphere into the atmosphere are     a major role in bioaerosol emissions, as they release repro-
called primary biological aerosol particles (PBAPs). They         ductive units as a result of sexual or asexual reproduction (El-
comprise biogenic matter such as pollen, bacteria, viruses,       bert et al., 2007; Fröhlich-Nowoisky et al., 2016; Fürnkranz
spores of fungi, bryophytes and ferns, and cells and cell         et al., 2008; Richards, 1954). Cryptogamic organisms are
compounds (e.g., proteins) of plants and animals (Andreae         mostly of poikilohydric nature, meaning that they are un-
and Crutzen, 1997; Després et al., 2012; Fröhlich-Nowoisky        able to actively regulate their water content, which causes
et al., 2016; Simoneit, 1977, 1989). They can influence the       their moisture content to strongly depend on the environmen-
water cycle by acting as cloud condensation or ice nuclei,        tal humidity conditions. Accordingly, under dry conditions
thereby triggering precipitation (Möhler et al., 2007; Pöschl     the organisms are metabolically inactive until they are reac-
et al., 2010), and they can affect the radiative budget of the    tivated by moisture uptake.
atmosphere, via the absorption and scattering of radiation, on       Fungi represent a separate kingdom, with taxa being
a local and global scale (Cox, 1995).                             present in all types of natural environments. Within the
   Although the general knowledge on PBAPs is still sparse,       kingdom, Ascomycota and Basidiomycota are the largest
there are several studies on the sampling and sizing of PBAPs     (Mueller et al., 2004; Neves et al., 2013) in addition to several
in the Amazon (Elbert et al., 2007; Gilbert and Reynolds,         smaller phyla. Microfungi, such as molds, develop spores di-
2005; Graham et al., 2003; Huffman et al., 2012; Moran-           rectly from hyphae, whereas other fungi colonize their sub-
Zuloaga et al., 2018; Pöschl et al., 2010; Whitehead et           strate (e.g., dead wood or soil) using vegetative hyphae and
al., 2016; Womack et al., 2015). However, a large variety         form fruiting bodies of varying sizes for spore production and
of techniques have been utilized in these aerosol sampling        liberation. A single large fruiting body may release millions
studies, which handicaps their direct comparability. For on-      of spores in order to succeed in dispersal, multiplication, and
line counting and/or sizing of aerosols at different heights      reproduction (Webster and Weber, 2007). The reproduction
within and above of the canopy, the sensitive analyzers are       units of fungi comprise spores resulting from sexual (e.g., ba-
mostly situated in weather-protected containers at the for-       sidiospores and ascospores) and asexual modes of reproduc-
est floor. The required long inlet lines from a tower or          tion, such as teliospores, conidia, budding (yeast) cells, and
mast cause a preferential loss of larger particles (Huffman et    fragments of hyphae (Cannon et al., 2018). Fungal spores in
al., 2012; Moran-Zuloaga et al., 2018; Pöschl et al., 2010).      the atmosphere have been reported to reach number concen-
Other aerosol collection devices (e.g., impinger samplers)        trations of 104 to 105 m−3 in the Amazon (Elbert et al., 2007;
can be located at the desired sampling height without ex-         Graham et al., 2003; Hoose et al., 2010). On a global scale,
tended inlet lines (Elbert et al., 2007; Gilbert and Reynolds,    fungal spores may account for 8 to 186 Tg yr−1 of bioaerosol
2005; Graham et al., 2003; Womack et al., 2015). The major-       emissions, which is roughly 23 % of the total primary organic
ity of these studies focuses on the aerosol or spore concentra-   aerosol emission (Fröhlich-Nowoisky et al., 2016; Graham et
tion in the atmosphere. However, the emission patterns of the     al., 2003; Heald and Spracklen, 2009; Jacobson and Streets,
source organisms, i.e., the spore release characteristics de-     2009; Sesartic et al., 2013).
pending on climatic conditions and the physiological activ-          Species of Polyporales (Basidiomycota), the order of the
ity status, might also be relevant to explain the atmospheric     model species of the present study, mostly colonize dead
concentrations (Šantl-Temkiv et al., 2019). To fill that gap,     wood, where they form vegetative hyphae that degrade the
a setup focused on the aerosol release patterns and mecha-        wood. On the surface of dead wood they form fruiting bodies
nisms of the organisms could generate new insights into the       with pores located on their lower side. The surface of these
relevance of local bioaerosol emissions.                          pores is covered by a hymenium, where basidiospores are
   The Amazon Basin represents the world’s largest rain for-      produced on basidia. Each basidium externally forms mostly
est, with a dimension of about 6 000 000 km2 (Melack and          four asymmetrical basidiospores on little curved, tapering
Hess, 2010). As tropical rain forests host an extensive spec-     stalks, called sterigmata. The spores are fixed to the sterig-
trum of species and have an extremely high biomass turnover,      mata at the hilum, which therefore forms a characteristic fea-
bioaerosol transport from the biosphere into the atmosphere       ture of basidiospores.
is high (Artaxo et al., 2013; Artaxo and Hansson, 1995;              In most terrestrial basidiomycetes the basidiospores are
Crutzen et al., 1985; Simoneit et al., 1990). PBAPs have          actively projected, thus the use of the term “ballistospores”,
been said to account for a major fraction of coarse-mode          and several ejection mechanisms have been suggested (Web-
aerosols in the Amazon (Elbert et al., 2012; Moran-Zuloaga        ster and Weber, 2007). A widely accepted mechanism is that
et al., 2018; Pöschl et al., 2010; Whitehead et al., 2016), and   of surface tension catapult, originally described by Buller
fungal spores have been suggested to be a key component           (1922) and Ingold (1939). For activation, a drop of water, the
in the coarse-particle fraction (Elbert et al., 2007; Graham et   Buller’s drop, forms at the hilar appendix and a second shal-
al., 2003; Huffman et al., 2012; Sesartic et al., 2013).          lower liquid deposit forms on the surface of the spore above

Atmos. Meas. Tech., 13, 153–164, 2020                                                 www.atmos-meas-tech.net/13/153/2020/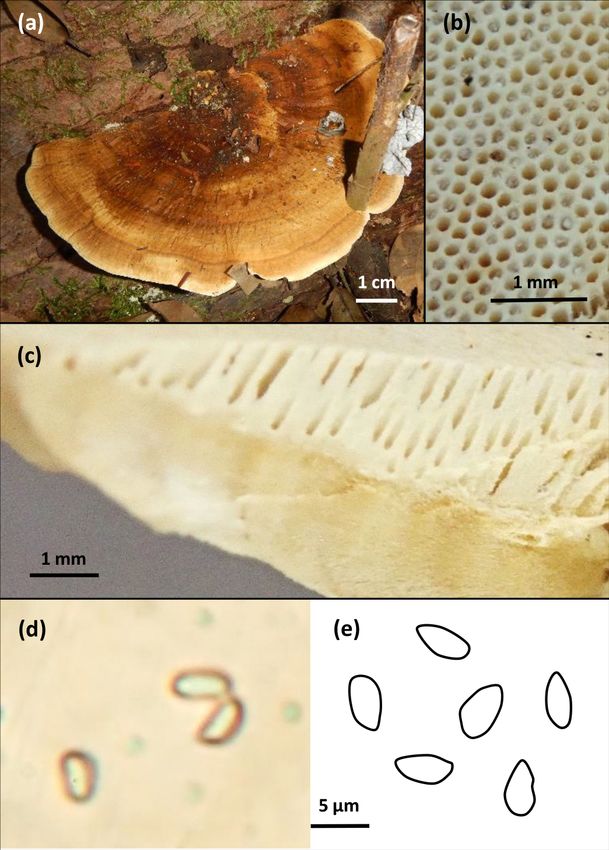
N. Löbs et al.: Aerosol measurement methods to quantify spore emission                                                              155

                                                                         2     Materials and methods

                                                                         2.1    Study site

                                                                         The experiments were conducted at the Amazon Tall Tower
                                                                         Observatory (ATTO) site in the central Amazon Basin,
                                                                         about 150 km northeast of the city of Manaus (Andreae et
                                                                         al., 2015). The trees of this plateau forest have an average
                                                                         height of 21 m and grow at a density of up to 600 trees ha−1 .
                                                                         With approximately 16 000 estimated tree species, the Ama-
                                                                         zon has a high species diversity compared with other for-
Figure 1. Schematic drawing of the spore-building parts of a basid-      est types (McWilliam et al., 1993; ter Steege et al., 2013).
iomycetous fungus. Active release mechanism based on a change            Precipitation has a seasonal minimum of around 47 mm per
of the gravity center due to the “Buller’s drop” effect. Not to scale.
                                                                         month in the dry season (August–November) and a maxi-
Based on Piepenbring (2015).
                                                                         mum of 335 mm per month in the wet season (February–
                                                                         May), according to measurements conducted from 1961 to
                                                                         1990 (Andreae et al., 2015). Further relevant details on the
the hilar appendix (Fig. 1). Both drops grow until they co-              research site can be found in previous publications (Andreae
alesce and then the basidiospore is immediately discharged               et al., 2015; Pöhlker et al., 2019).
(Pringle et al., 2005). This coalescence causes a sudden re-
                                                                         2.2    Study organisms
distribution of mass and carries the spore and drop away from
the sterigma. Experiments with the fungus Itersonilia sp.                The investigated model species was collected in the plateau
suggest that the liquid in both drops originates from water              forest area of the ATTO site during the dry season in August
condensation upon the extrusion of a hygroscopic substance,              2018. For the measurements under field and laboratory con-
e.g., mannitol and in some cases glucose. The spores mea-                ditions, two specimens of the same species, growing in close
sured were released from the sterigma at velocities above                vicinity to each other, were used for parallel measurements.
1 m s−1 , but at low wind velocities there was a quick de-               According to the macro-morphological characteristics of the
celeration and loss of velocity (Webster and Weber, 2007).               sampled specimen, the basidioma was classified as a poly-
Basidiospore sizes range between 3 and 20 µm (Webster and                poroid fungus (Fig. 2). Combined with micro-morphological
Weber, 2007). In accordance with Buller (1922) the num-                  details of the hymenium and basidiospores, the species was
ber of basidiospores produced by a single fruiting body can              identified as Rigidoporus microporus (Polyporales, Basid-
be extremely large, as, for example, one cap of the mush-                iomycota), which has already been reported for the Ama-
room Agaricus campestris has been calculated to produce                  zon area (Gomes-Silva et al., 2014). In the results section,
∼ 2.6 × 10⁹ spores over the course of 1 d.                               the exemplary measurements made with the model species
   Water availability is a triggering factor for the formation           are presented. Due to the exemplary nature of the data, repli-
of macroscopic fruiting bodies, where the spores are formed.             cate measurements have not been conducted here, but will be
Other parameters such as light, humidity, and temperature                needed during an analysis of the emission patterns of differ-
can influence spore liberation, and the simultaneous mea-                ent organisms.
surement of these parameters under natural and controlled
conditions is needed to elucidate the relevant interrelations            2.3    Measurements under natural conditions
(Neves et al., 2013).
   The aim of this study was to establish measurement tech-              In a first approach, bioaerosol emission patterns were inves-
niques that allow a qualitative and quantitative assessment              tigated with a mobile measurement setup directly at selected
of spore emission patterns of non-lichenized fungi, lichens,             organisms in the field. The setup is illustrated in Fig. 3. For
bryophytes, and ferns under natural field conditions and un-             particle counting and sizing, an optical particle sizer (OPS
der controlled environmental conditions in the lab. Measure-             model 3330, size range: 0.3 to 10 µm; TSI Inc., Shoreview,
ments under field conditions allow spore release patterns to             Minnesota, USA), was operated at a sampling interval of 30 s
be followed over longer time spans, during diel cycles, and              with an air flow of 1 L min−1 . This instrument classifies the
under changing environmental conditions, whereas lab mea-                detected particles based on aerosol light scattering into 16
surements facilitate a controlled analysis of the effect of par-         size bins ranging from 0.3 to 10 µm. The OPS was charac-
ticular environmental parameters and a detailed quantifica-              terized in more detail in Moran-Zuloaga et al. (2018). At the
tion of spore emissions. Direct observations of PBAP emis-               OPS inlet, an antistatic tube (inner diameter of 4 mm, length
sion patterns will help to better understand spatiotemporal              of ∼ 1 m; conductive tubing, TSI Inc., Minnesota, USA)
patterns in the abundance of the Amazonian coarse-mode                   extended by a plastic funnel (diameter of 8 cm, Carl Roth
aerosol population.                                                      GmbH Co, Karlsruhe, Germany) was installed. The funnel

www.atmos-meas-tech.net/13/153/2020/                                                         Atmos. Meas. Tech., 13, 153–164, 2020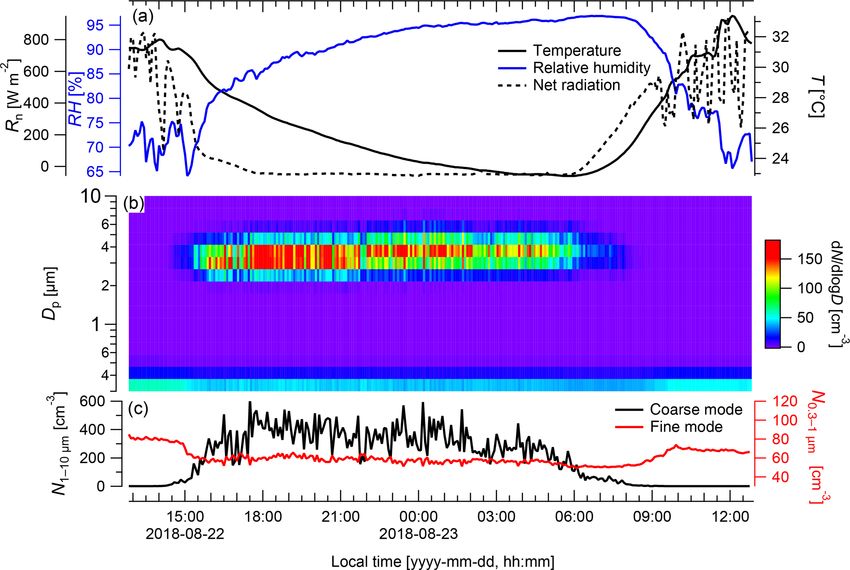
156 N. Löbs et al.: Aerosol measurement methods to quantify spore emission
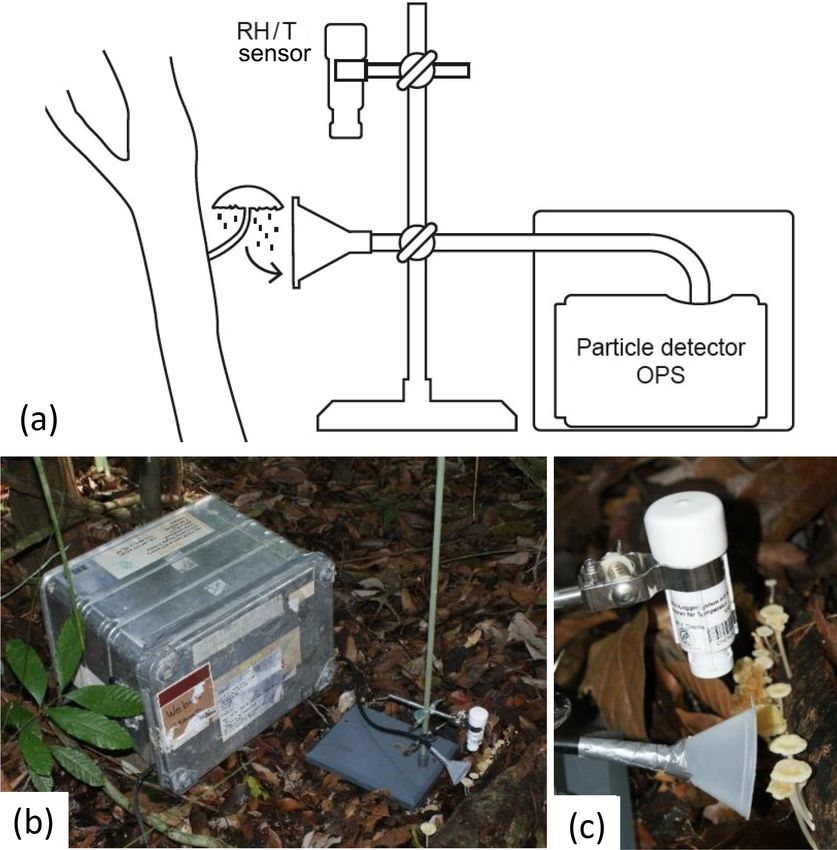
Figure 3. Setup used for field measurements. The optical particle
sensor (OPS) is located in a box for weather protection. From this,
an inlet ending with a funnel leads to the organism of interest. The
setup is accompanied by a temperature and humidity (RH/T ) sensor
located in the direct vicinity of the sample. (a) Schematic drawing,
(b) overview photograph, and (c) close-up photograph of the de-
scribed setup.
Figure 2. Photographic documentation of the measured basid-
iomycete Rigidoporus microporus. (a) Sessile basidioma growing only the inlet and the sensor tip were placed outside the box,
on a dead hardwood, (b) polyporoid hymenium with white sur- next to the investigated organism. The measurements were
face, (c) vertical cross-section of hymenium with homogeneous performed over 24 h.
content, (d) microscopic image of the one-celled colorless spores As accessory data on the mesoclimate, net radiation (in
at 1000× magnification, and (e) schematic drawing of some of the watts per square meter, W m−2 ) was measured at a height
observed spores, average size 3 µm × 5 µm. Scales indicated. of 75 m (net radiometer, NR-LITE2, Kipp & Zonen, Nether-
lands), precipitation (in millimeters per minute, mm min−1 )
at a height of 81 m (rain gauge TB4, Hydrological Services
was placed 2 to 5 cm from the investigated emission source Pty. Ltd., Australia), and the occurrence of fog was de-
(Fig. 3c). The measured particle concentrations were aver- tected with visibility measurements using an optical fog sen-
aged over 5 min. For the fine and coarse mode, the particles in sor installed at a height of 43 m (OFS, Eigenbrodt GmbH,
the size range from 0.3 to 1 µm and 1 to 10 µm, respectively, Königsmoor, Germany). Fog events were defined as occur-
were summed and averaged over 5 min intervals. The OPS ring at visibility values below 2000 m. Data loggers recorded
instrument has a filter, where the sampled particles are col- the data at 1 min intervals (CR3000 and CR1000, Campbell
lected. These filters cannot be directly used for microscopy, Scientific, Logan, Utah, USA; Andreae et al., 2015). Based
but the particles can be transferred to microscopy slides and on the field data, 5 min averages have been generated.
subsequently analyzed by light microscopy and compared to The time is presented in local time (LT), which is UTC-4
imagery obtained from sections of the fungal hymenium, as (UTC represents coordinated universal time).
shown in Fig. 2d.
Air temperature and relative humidity (RH) were mea- 2.4 Cuvette system for laboratory experiments
sured at 30 s intervals at a distance of approximately 5 to
10 cm from the emission source (temperature/relative hu- Measurements in the lab are used to verify the field data
midity data logger, HOBO U23 v2, Onset, Bourne, Mas- and to characterize the spore release patterns over a wider
sachusetts, USA; Fig. 3c). For weather protection, the instru- range of environmental conditions. For experiments under
ments were installed in a metal housing (55 cm × 48 cm × controlled laboratory conditions, we developed a cuvette sys-
48 cm, Zarges GmbH, Weilheim, Germany; Fig. 3b). Thus, tem where the sample is placed in the air stream. With respect
Atmos. Meas. Tech., 13, 153–164, 2020 www.atmos-meas-tech.net/13/153/2020/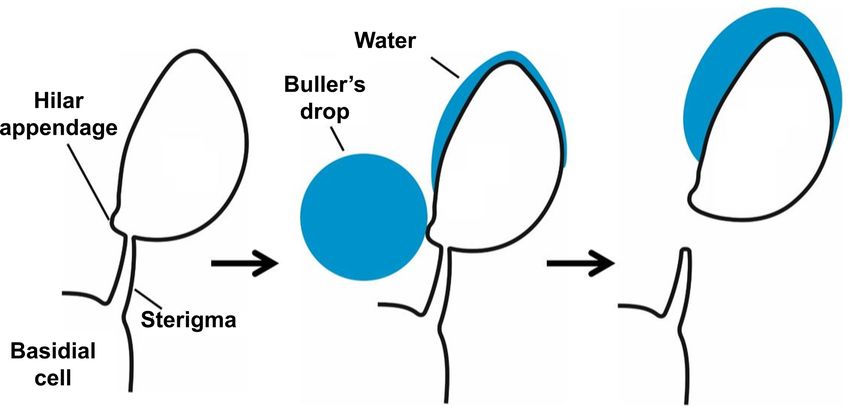
N. Löbs et al.: Aerosol measurement methods to quantify spore emission 157
and 4 lasted for approximately 1 to 5 h each, step 2 was run
for roughly 4 h and step 3 was run for about 17 h. As the
opening of the cuvette caused a short but strong increase in
particles across all detected bins, these peaks were removed
prior to further analysis of the data. In the example presented
only the initial blank is shown, as the final blank showed
identical low values, thus demonstrating reproducibility.
The water content (WC) of the samples was determined
gravimetrically as a percentage value based on the dry weight
(% DW), determined after the measurements upon drying in
an oven at 60 ◦ C until weight constancy was reached. More-
over, during lab measurements, the filter of the OPS could be
used for microscopic analyses as described in Sect. 2.3.
2.5 Particle collection and microscopic analysis
A custom-made impactor was used to collect samples of the
released particles for later microscopic or chemical analy-
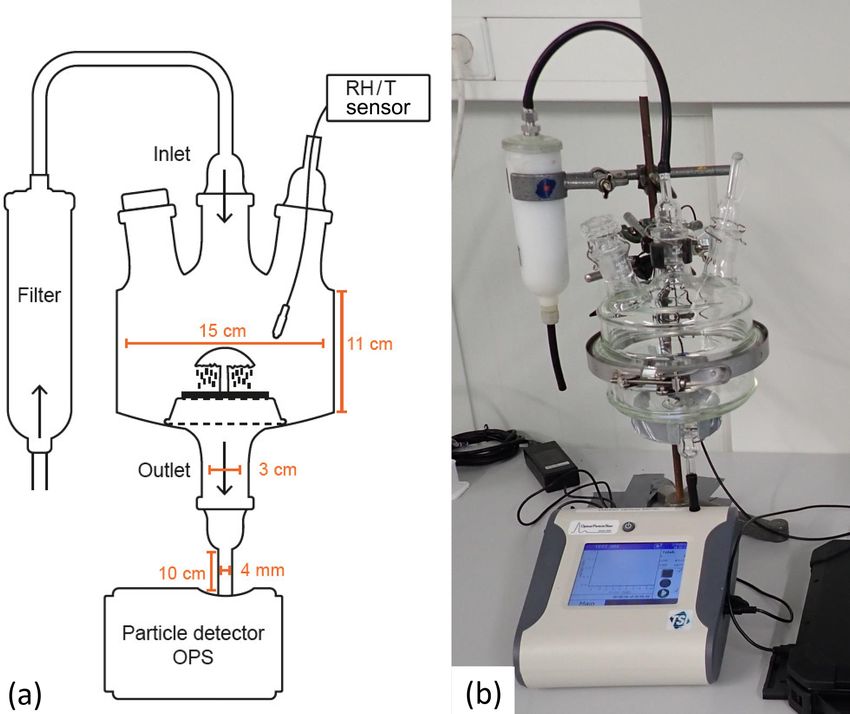
Figure 4. Setup used for laboratory experiments. The samples are
sis. With respect to the impactor, a customized metallic cap-
placed in a glass cuvette in a vertical air stream. Air is supplied
via an inlet with a filter connected to it; the outlet is connected sule with plastic support for the sampling substrate was used,
to an OPS for particle measurements. A temperature and humid- where round microscopy cover slides with a diameter of
ity (RH/T ) sensor is placed inside the cuvette via an opening in the 12 mm were inserted as collection substrate. The impactor
upper lid, which is sealed to avoid contamination. (a) Schematic was connected to the laboratory experiment chamber via the
drawing, and (b) close-up photograph. tubing at the inlet of the lower lid, with a pump (M42x30/I,
KAG, Hannover, Germany; flow rate of 8 L min−1 ) following
the impactor. Particle collection with the impactor was con-
to the cuvette, a glass chamber was built from two horizon- ducted for different periods (ranging between 5 s and 1 min)
tally arranged flat flange clear glass units (inner diameter of depending on the sample and its spore release behavior. For
15 cm, total inner height of 11 cm; Fig. 4), the upper unit had Rigidoporus microporus, the particle collection was carried
three openings and the lower unit had one opening. The open- out for 30 s. From each investigated organism three slides
ings of the upper lid were connected to an inlet tube that pro- were collected one after the other. The sample slides were
vided outside air via a filter (pore diameter of 0.3 µm, HEPA stored in flat containers (Analyslide Petri dishes, Polysty-
filter capsule, Pall, Dreieich, Germany) and to a sensor mea- rol, 47 mm, Pall Life, Ann Arbor, Michigan, USA) under dry
suring RH and temperature inside the chamber (MSR 145 conditions at room temperature (∼ 25 ◦ C) until further inves-
data logger, Seuzach, Switzerland). A third opening for fur- tigations were carried out.
ther manipulations or measurements was closed with a glass For microscopic observation of the collected spores, each
stopper, as it was not in use. The opening of the lower lid was round cover slide was mounted onto a clear glass microscopy
connected to an OPS (OPS 3330, TSI Inc. Shoreview, Min- slide (26 mm × 76 mm, pre-cleaned, ready to use, Gerhard
nesota, USA) via a conductive tube with a length of approx- Menzel, Braunschweig, Germany). The optical analysis was
imately 10 cm (inner diameter of 4 mm, conductive tubing, carried out with a light microscope using magnifications of
TSI Inc., Minnesota, USA). Inside the cuvette, the sample 400× and 1000× (Primo Star, Carl-Zeiss Microscopy, Jena,
was placed on an aluminum grid, which allowed the emitted Germany). The images were captured with a coupled camera
particles to drop into the outlet tube to be measured. (Axiocam 105 color, Carl-Zeiss Microscopy, Jena, Germany)
Measurements were performed over the course of 24 h at and processed using the manufacturer’s software (ZEN soft-
a sampling interval of 10 s and an air flow of 1 L min−1 . ware, 2.3 edition, Carl-Zeiss Microscopy, Jena, Germany).
Records obtained with an empty cuvette, which showed
low particle numbers indicating an air-tight measurement 2.6 Data and statistical analysis
setup and an undisturbed measurement signal, were used as
blank/background signal. In a next step, a sample was placed IGOR Pro software (Igor Pro 6.3.7, WaveMetrics. Inc, Lake
inside the cuvette and investigated under natural moisture Oswego, Oregon, USA) was used to calculate the 5 min av-
conditions, i.e., with the water content it had directly after erages and help with the graphical analysis.
field collection. In a third step, the sample was removed from Statistica software (13.3, StatSoft.Inc., Tulsa, Oklahoma,
the cuvette, sprayed with water until the outside of the sam- USA) was applied to test the normal distribution and the
ple was glossy wet and inserted into the cuvette again. In a fi- variability of the particle concentrations during the differ-
nal step the blank cuvette was measured again. While steps 1 ent steps of the laboratory experiment. A chi-square test was
www.atmos-meas-tech.net/13/153/2020/ Atmos. Meas. Tech., 13, 153–164, 2020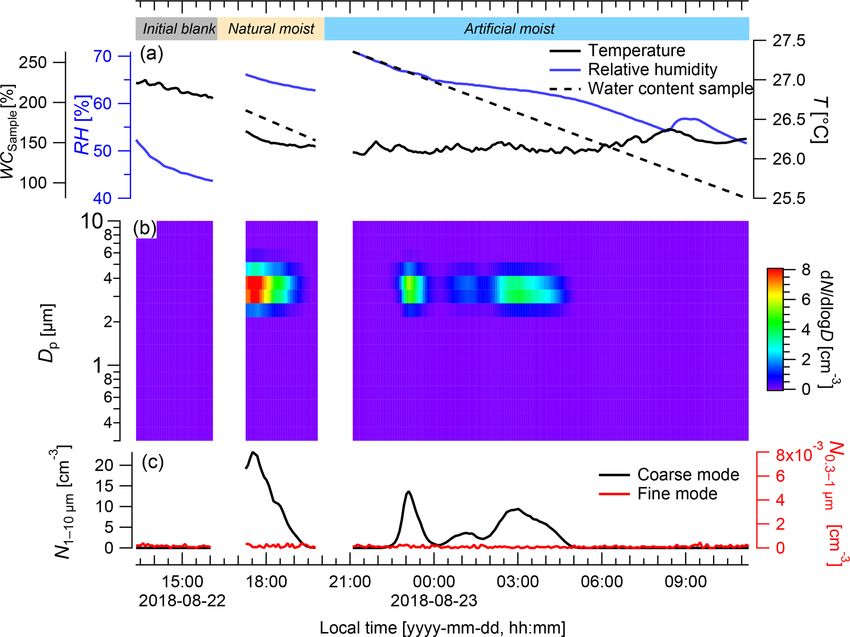
158                                                N. Löbs et al.: Aerosol measurement methods to quantify spore emission

applied to test the normal distribution of the data, and a        Overall, the fine-mode and the coarse-mode particles show
Kruskal–Wallis test was used to test the difference between       opposite diurnal trends, which indicates that both might be
the blank cuvette, the naturally moist, and the artificially      driven by different mechanisms. The fine-mode particle con-
moistened sample. We applied a two-sided significance level       centration N0.3−1 probably originated from biomass burning
of p = 0.05.                                                      events, as simultaneous online measurements with a multian-
                                                                  gle absorption photometer (MAAP; Thermo Scientific, MA,
                                                                  USA) revealed elevated values of black carbon ranging be-
3     Initial results and discussion                              tween 0.9 and 1.3 µg m−3 (Saturno et al., 2018). Biomass
                                                                  burning events generally occur at a higher frequency during
3.1    Measurements under natural conditions                      the dry season compared with the wet season. The nighttime
                                                                  minimum in N0.3−1 can be explained by dry deposition of the
The following paragraph presents the first results obtained       fine-mode aerosol to the forest canopy in the shallow noctur-
from measurements of spore release patterns of one exem-          nal boundary layer.
plary organism in the field, which illustrates the potential of      The presented experimental approach of simultaneous ob-
this approach to explore the link between bioaerosol release      servations of the particle size distribution, RH, temperature,
and micrometeorological parameters in a systematic way.           and net radiation close to the organism allows for the rela-
   During measurements of the model species under ambient         tion of the organism’s spore emission patterns to meteoro-
conditions, neither fog nor rain occurred (Fig. 5). The coarse-   logical parameters. Based on a larger number of measure-
mode particles (Fig. 5b) exhibited the highest concentrations     ments from multiple organisms, which is the subject of on-
during nighttime, when the RH ranged from 73 % to 96 %,           going work, this is intended to provide a dataset of predictive
with peak concentrations of N1−10 = 600 cm−3 , whereas the        values with regard to bioaerosol release and abundance. For
lowest numbers were measured during the day with only             further measurements, a combination of emission monitor-
∼ 0.8 cm−3 at RH values between 66 % and 85 %. On av-             ing with a wider range of meteorological data should provide
erage, coarse-mode particle concentrations were N1−10 =           valuable insights into the detailed spore emission patterns.
330 ± 105 cm−3 during nighttime (from 18:00 to 06:00 LT)          As the geometric size of the spores of Rigidoporus microp-
and N1−10 = 90 ± 102 cm−3 during the day. Pronounced di-          orus ranges between 3 and 5 µm (Gomes-Silva et al., 2014),
urnal cycles of coarse-mode particle abundance in the Ama-        they are expected to be measured in the coarse-mode frac-
zon, such as the cycle found here (Fig. 5), have been de-         tion. Upon an increase in RH in connection with a decrease in
scribed in previous studies (Huffman et al., 2012; Moran-         net radiation and temperature in the evening hours, the spore
Zuloaga et al., 2018). These diurnal patterns might be driven     concentrations emitted by this sample increased immediately
by spore emission patterns, boundary layer dynamics (day-         (Fig. 5). In contrast to this, spore concentrations decreased in
time dilution vs. nighttime concentration), or a combination      the morning; this decrease was simultaneous to a decrease in
of both. During convective daytime hours, the boundary layer      the RH and an increase in the net radiation and temperature.
top is located much higher than during nighttime, which re-       Elevated basidiospore concentrations during nighttime hours
sults in a dilution of the local emissions during the day and     have previously been observed and were linked to the ballis-
elevated concentrations during the night (Neves and Fisch,        tic spore emission mechanism described above (Webster and
2015). However, in our case the most important driver for         Weber, 2007).
the diurnal pattern of the coarse-mode particles might be the        Rain and fog may also play an important role in modu-
release pattern of the fungus, as the measuring device was        lating the bioaerosol release patterns (Huffman et al., 2013;
located in close vicinity to the releasing fungus. Note in this   Schumacher et al., 2013). Due to the absence of rain and fog
context that the coarse-mode background concentration at          during the time frame shown in Fig. 5, the relevance of these
the ATTO site ranges well below N1−10 = 5 cm−3 for most           parameters on the spore release cannot be investigated in this
of the year (Moran-Zuloaga et al., 2018). Thus, the number        particular case. Nevertheless, we believe that these parame-
concentrations obtained directly at the fungus were signifi-      ters could give valuable insights into particle release patterns
cantly higher and cannot be explained by variations in the        and processes in other cases, which is also subject of on-
background concentration. Coarse-mode particle occurrence         going work. The results presented have to be considered as
in the open atmosphere is likely caused by a combination of       exemplary and do not allow for generalizations, as different
particle release patterns and boundary layer height effects.      emission patterns and relevant environmental parameters can
   In contrast to the coarse-mode diurnal patterns, the           be expected for different species, but they demonstrate the
fine-mode concentrations were much lower, with the                practicability of the measurement techniques.
highest fine-mode concentration reached during the day
(N0.3−1 = 74 cm−3 ) and the lowest concentration during           3.2   Laboratory experiments
night (N0.3−1 = 50 cm−3 ). On average, the particle concen-
tration in the fine mode reached N0.3−1 = 64±9.2 cm−3 dur-        Measurements under laboratory conditions allowed for a de-
ing the day and N0.3−1 = 58 ± 3.2 cm−3 during the night.          tailed investigation of the particle emission properties of a

Atmos. Meas. Tech., 13, 153–164, 2020                                                www.atmos-meas-tech.net/13/153/2020/
N. Löbs et al.: Aerosol measurement methods to quantify spore emission 159
Figure 5. Particle emission patterns of Rigidoporus microporus measured under field conditions over the course of 24 h. (a) Temperature (T )
and relative humidity (RH) measured next to the sample organism and net radiation (Rn ) measured at a height of 75 m, (b) concentration of
different particle size classes over time, and (c) the number of particles ranging from 0.3 to 1 µm (fine mode) and from 1 to 10 µm diameter
(coarse mode). Data are presented as 5 min averages.
specific organism under controlled conditions, due to the ex- 11:00 LT, while the WC ranged from 83 % to 148 % and the
clusion of the surrounding emission sources. In combination RH ranged from 52 % to 59 %.
with field measurements of the same specimen, the particle In the fine mode, particle concentrations throughout
release process of the study organism can be separated from the experiment were very low (i.e., N0.3−1 < 0.001 cm−3 ),
the environmental processes. which indicated the absence of leaks in the system and fur-
During the laboratory experiment, the initial blank showed ther suggested that no fine-mode particles were co-emitted
average coarse- and fine-mode particle concentrations close with the coarse-mode pulses.
to zero (both < 0.001 cm−3 , respectively; Fig. 6). In the
coarse mode, the highest average particle concentrations 3.3 Particle collection
were detected for the naturally moistened sample (N1−10 =
10 cm−3 ) and the artificially moistened sample (N1−10 = On the impactor samples, the particles were concentrated
2.2 cm−3 ), which were significantly higher than the blank in one spot surrounding the impaction center. The num-
(N1−10 < 0.001 cm−3 ; p < 0.001). The coarse-mode parti- ber of particles varied according to the sampling time and
cle concentrations showed defined pulses when the sample bioaerosol emission by the respective sample. Using the mi-
was in the cuvette. Right after installation of the naturally croscope at a magnification of at least 400x, it was possi-
moist sample in the cuvette, a defined peak spanning over ble to visualize the collected spores. For the species exam-
approximately 2 h occurred, reaching a maximum particle ined, we microscopically observed subglobose spores, about
concentration of N1−10 = 20 cm−3 . The WC of the sample 3 µm × 5 µm in size, besides other random particles from
ranged from 190 % to 170 % and the RH ranged from 66 % the organism, e.g., fragments of hyphae about 1 to 8 µm
to 64 % during this time span. After the installation of the ar- in length, and undefined particles in smaller concentrations,
tificially moistened sample there were two defined, but some- ranging from 0.5 to 10 µm in size.
what smaller, pulses, although these pulses still reached max- Impactor studies may also be useful during field measure-
imum concentrations of N1−10 = 13 and N1−10 = 9.4 cm−3 ments, as the coarse-mode particles could be collected with
in the coarse mode, respectively. They had a duration of ap- the field setup. Another option would be to use a new fil-
proximately 1.5 and 2 h, and during these times WC values ter in the OPS and to investigate the spores collected on the
ranged from 244 % to 226 % and 197 % to 169 %, and RH filter by means of microscopy after sampling. In our field
ranged from 67 % to 65 % and 63 % to 62 %, respectively. measurements, the contamination from surrounding emis-
The lowest particle concentration of N1−10 < 0.001 cm−3 , sion sources was kept as small as possible by installing the
which is very close to zero, was measured from 06:00 to inlet funnel of the detector close to the organism of interest.
www.atmos-meas-tech.net/13/153/2020/ Atmos. Meas. Tech., 13, 153–164, 2020160 N. Löbs et al.: Aerosol measurement methods to quantify spore emission
Figure 6. Particle emission patterns of Rigidoporus microporus measured under lab conditions. (a) Temperature (T ) and relative humidity
(RH) measured inside the cuvette, and the gravimetrically determined water content of the sample (WCsample ); (b) the concentration of
different particle size classes over time; and (c) the number of the particles ranging from 0.3 to 1 µm (fine mode) and from 1 to 10 µm in
diameter (coarse mode). In the beginning and at the end of the measurement, a blank measurement was conducted with an empty cuvette (see
labeling in panel (a); final blank not shown for brevity). After the initial blank, the sample was first measured with its natural water content
(natural moisture) and then after spraying with water (artificial moisture). When the cuvette was opened for the insertion and removal of the
sample, particles from outside caused a short increase in particles (measurement artifact), which was removed. Data are presented as 5 min
averages.
Collecting the released material with an impactor during the Until now, bioaerosol measurement techniques have mainly
laboratory experiment minimizes contamination from other been used to measure atmospheric concentrations of over-
sources and allows for a detailed observation of the particles all aerosols in the atmosphere. Some of them distinguished
(spores, cell fractions, etc.) released by the investigated or- between aerosols of biotic and abiotic origin, but we are
ganism. Additionally, the collected material can be used for not aware of techniques that have been used to characterize
a chemical characterization of the observed particles by an- the spore emission patterns of single organisms. Thus, the
alyzing molecular markers, like sugar alcohols (e.g., arabitol strength of our approach is that it allows for the character-
and mannitol), sterols (e.g., ergosterol), and others, as well ization of the spore release patterns of single organisms or
as an assessment of the total protein content. cryptogamic communities under defined environmental con-
ditions in the field and in the lab.
3.4 Overall discussion Measurements inside the cuvette allowed for close con-
trol of the environmental parameters, e.g., the air circula-
tion, temperature, humidity, and light. The measured parti-
The combined approach of field and the laboratory mea-
cles covered a narrow size range (2.5–4 µm in diameter) in
surements seems to be very promising for investigations of
the coarse mode, which conforms to the spore size of the in-
the spore release patterns of spore-producing organisms and
vestigated fungus, whereas fine-mode particles seemed to be
their relevance for atmospheric spore concentrations. While
of minor importance. The highest numbers of basidiospores
field measurements are used to analyze the spore emission
were emitted under naturally moist and artificially moistened
patterns of the investigated organisms under natural envi-
conditions at water contents of the fungal fruiting body rang-
ronmental conditions, lab measurements facilitate analyses
ing from 244 % to 169 %. Thus, the water content seems to
under controlled conditions over a wide range of environ-
play a relevant role in the spore emission process, which is
mental characteristics. Thus, this combined approach allows
in close agreement with other reports (Ehlert et al., 2017;
for a thorough characterization of the bioaerosol release pat-
Ingold, 1985; Sadyś et al., 2018) and with the fact that wa-
terns and mechanisms of defined organisms or communities.
Atmos. Meas. Tech., 13, 153–164, 2020 www.atmos-meas-tech.net/13/153/2020/N. Löbs et al.: Aerosol measurement methods to quantify spore emission 161
ter condensation is essential for the active discharge of ba- Data availability. The data presented in the paper are provided in
sidiospores. However, for this technique the fruiting bodies the Supplement.
are mostly separated from their vegetative mycelium in the
substrate (dead wood) that provides water, minerals, and nu-
trients for the fruiting body. This separation may affect the Sample availability. Sample material of the investigated fungus can
release of spores or other particles. For the empty cuvette, be loaned from the authors upon request.
particle concentrations of less than 0.2 cm−3 were measured,
indicating that the blanks serve as a good baseline for the
laboratory measurements. Supplement. The supplement related to this article is available on-
line at: https://doi.org/10.5194/amt-13-153-2020-supplement.
The measurements under field conditions showed a pro-
nounced diurnal pattern in the coarse mode with the highest
concentrations during nighttime, which has already been re-
Author contributions. BW, NL, CP, SB, FD, and CGGB designed
ported for other fungal species (Fernando et al., 2000; Gilbert the experiments and SB, NL, and CGGB carried them out. CGGB
and Reynolds, 2005; Stensvand et al., 1998). Aerosol and and MP identified the fungus. MdOS, ACdA, and LRdO measured,
trace gas concentrations have frequently been shown to also analyzed, and supplied the climate data. RHMG, SW, JK, PA, MOA,
display diurnal and seasonal patterns (Gadoury et al., 1998; and UP provided valuable input regarding the design and realization
Huffman et al., 2012; Moran-Zuloaga et al., 2018; Pöhlker et of on-site bioaerosol measurements. NL and DW performed the for-
al., 2012; Yáñez-Serrano et al., 2015). However, in the nat- mal analysis. NL, BW, and CP prepared the paper with contributions
ural environment there are many other emitting sources in from all co-authors. NL, CGGB, and SB contributed equally to this
the surrounding area, which might affect the measurement, paper.
and other environmental parameters, like the spectral com-
position of light (Ehlert et al., 2017; Igbalajobi et al., 2019;
Pruß et al., 2014), might serve as particle release triggers; Competing interests. The authors declare that they have no conflict
these factors have not been considered here. Other references of interest.
have already indicated that RH or dew are triggering factors
for spore release (Gosselin et al., 2016; Liang et al., 2013;
Acknowledgements. We would like to acknowledge the German
Stensvand et al., 1998; Zhang et al., 2010). Overall, the spore
Federal Ministry of Education and Research (BMBF) and the Max
release patterns can be expected to show both interspecific
Planck Society for supporting this project as well as the construc-
and intraspecific variability. The monitoring of a larger vari- tion and operation of the ATTO site. We also acknowledge sup-
ety of organisms might help to characterize the dominating port from the Brazilian Ministério da Ciência, Tecnologia e In-
release pattern of organisms in the environment and to iden- ovação (MCTI/FINEP) as well as the Amazon State University
tify the triggering factors. (UEA), FAPEAM, LBA/INPA, and SDS/CEUC/RDS-Uatumã for
In earlier studies, a vertical structure of aerosols within their support during the construction and operation of the ATTO
the canopy was shown in the tropics (Gilbert and Reynolds, site. We would like to thank Reiner Ditz, Susan Trumbore, Alberto
2005), which could be investigated by utilizing this method Quesada, Thomas Disper, and Hermes Braga Xavier for techni-
to monitor the organisms at varying canopy heights. If the cal, logistical, and scientific support within the ATTO project; and
results of spore emission experiments are coupled with an Thomas Klimach, Daniel Pickersgill, Isabella Hrabě de Angelis,
Harald Paulsen, Peter Hoor, and Eckhard Thines for their techni-
inventory of cryptogams, very promising insights might be
cal and scientific expertise. Nina Löbs would like to thank the Max
achieved. With both particle observation techniques, i.e.,
Planck Graduate Center (MPGC) for their support. Sebastian Brill,
field and laboratory measurements, particles in the same Cybelli G. G. Barbosa, David Walter, Florian Ditas, Stefan Wolff,
size range have been sampled, confirming that the laboratory Ulrich Pöschl, Christopher Pöhlker, and Bettina Weber appreciate
measurements can be considered as validation for the results the support from the Max Planck Society. Marta de Oliveira Sá and
obtained in the field. Additionally, the microscopic observa- Leonardo R. de Oliveira would like to thank the Instituto Nacional
tion of the collected spores is fundamental for validation of de Pesquisas da Amazônia (INPA) for their support. Ricardo H.
the spore size and for identification of the organism being M. Godoi would like to thank the Federal University of Paraná.
observed. Fine-mode particles were only sampled during the Paulo Artaxo would like to acknowledge funding from FAPESP
field experiment, indicating a different source for this parti- (Fundação de Amparo à Pesquisa do Estado de São Paulo) and
cle fraction. An experimental approach of screening different CNPq. Alessandro C. de Araújo would like to thank the Empresa
Brasileira de Pesquisa Agropecuária (EMBRAPA). Meike Piepen-
spore-producing organisms at different canopy height levels
bring would like to thank the Goethe University Frankfurt/Main.
and during different seasons might provide new insights into
Meinrat O. Andreae appreciates the support from the Max Planck
the relevance of spore-producing organisms for atmospheric Society and the University of San Diego. Bettina Weber would like
aerosols and their effects on regional weather and climate. to thank the Karl-Franzens-Universität Graz. This paper contains
the results of research conducted under the Technical/Scientific Co-
operation Agreement between the National Institute for Amazonian
Research, the State University of Amazonas, and the Max Planck
www.atmos-meas-tech.net/13/153/2020/ Atmos. Meas. Tech., 13, 153–164, 2020162 N. Löbs et al.: Aerosol measurement methods to quantify spore emission
Society. The opinions expressed are the entire responsibility of the world’s fungi – Definition and diversity, Kew Royal Botanic
authors and not of the participating institutions. Gardens, available at: https://stateoftheworldsfungi.org/2018/
definition-and-diversity.html (last access: 20 November 2019),
2018.
Financial support. This research has been supported by the Cox, C. S.: Physical aspects of bioaerosol particles, in: Bioaerosol
German Federal Ministry of Education and Research (Bundesmin- Handbook, chap. 3, 15–25, 1995.
isterium für Bildung und Forschung, grant nos. 01LB1001A Crutzen, P. J., Delany, A. C., Greenberg, J., Haagenson, P., Heidt,
and 01LK1602B), the Brazilian Ministério da Ciência, Tec- L., Lueb, R., Pollock, W., Seiler, W., Wartburg, A., and Zim-
nologia e Inovação (MCTI/FINEP, grant no. 01.11.01248.00), merman, P.: Tropospheric chemical composition measurements
the Max Planck Society (Max-Planck-Gesellschaft, grant in Brazil during the dry season, J. Atmos. Chem., 2, 233–256,
no. M.IF.A.CHEM8095), and Fundação de Amparo à Pesquisa do https://doi.org/10.1007/BF00051075, 1985.
Estado de São Paulo (FAPESP, grant no. 2017/17047-0) and CNPq Després, V. R., Alex Huffman, J., Burrows, S. M., Hoose, C., Safa-
(grant no. 425100/2016-2). tov, A. S., Buryak, G., Fröhlich-Nowoisky, J., Elbert, W., An-
dreae, M. O., Pöschl, U., and Jaenicke, R.: Primary biologi-
The article processing charges for this open-access cal aerosol particles in the atmosphere: A review, Tellus B, 64,
publication were covered by the Max Planck Society. 15598, https://doi.org/10.3402/tellusb.v64i0.15598, 2012.
Ehlert, K., Piepenbring, M., and Kollar, A.: Ascospore release in
apple scab underlies infrared sensation, Fungal Biol., 121, 1054–
Review statement. This paper was edited by Pierre Herckes and re- 1062, https://doi.org/10.1016/j.funbio.2017.09.001, 2017.
viewed by four anonymous referees. Elbert, W., Taylor, P. E., Andreae, M. O., and Pöschl, U.: Contribu-
tion of fungi to primary biogenic aerosols in the atmosphere: wet
and dry discharged spores, carbohydrates, and inorganic ions, At-
mos. Chem. Phys., 7, 4569–4588, https://doi.org/10.5194/acp-7-
References 4569-2007, 2007.
Elbert, W., Weber, B., Burrows, S., Steinkamp, J., Büdel, B., An-
Andreae, M. O. and Crutzen, P. J.: Atmospheric Aerosols: Biogeo- dreae, M. O., and Pöschl, U.: Contribution of cryptogamic cov-
chemical Sources and Role in Atmospheric Chemistry, Science, ers to the global cycles of carbon and nitrogen, Nat. Geosci., 5,
276, 1052–1058, 1997. 459–462, https://doi.org/10.1038/ngeo1486, 2012.
Andreae, M. O., Acevedo, O. C., Araùjo, A., Artaxo, P., Barbosa, C. Fernando, W. G. D., Miller, J. D., Seaman, W. L., Seifert, K., and
G. G., Barbosa, H. M. J., Brito, J., Carbone, S., Chi, X., Cintra, Paulitz, T. C.: Daily and seasonal dynamics of airborne spores
B. B. L., da Silva, N. F., Dias, N. L., Dias-Júnior, C. Q., Ditas, F., of Fusarium graminearum and other Fusarium species sampled
Ditz, R., Godoi, A. F. L., Godoi, R. H. M., Heimann, M., Hoff- over wheat plots, Can. J. Botany, 78, 497–505, 2000.
mann, T., Kesselmeier, J., Könemann, T., Krüger, M. L., Lavric, Fröhlich-Nowoisky, J., Kampf, C. J., Weber, B., Huffman, J. A.,
J. V., Manzi, A. O., Lopes, A. P., Martins, D. L., Mikhailov, E. Pöhlker, C., Andreae, M. O., Lang-Yona, N., Burrows, S. M.,
F., Moran-Zuloaga, D., Nelson, B. W., Nölscher, A. C., Santos Gunthe, S. S., Elbert, W., Su, H., Hoor, P., Thines, E., Hoffmann,
Nogueira, D., Piedade, M. T. F., Pöhlker, C., Pöschl, U., Que- T., Després, V. R., and Pöschl, U.: Bioaerosols in the Earth sys-
sada, C. A., Rizzo, L. V., Ro, C.-U., Ruckteschler, N., Sá, L. D. tem: Climate, health, and ecosystem interactions, Atmos. Res.,
A., de Oliveira Sá, M., Sales, C. B., dos Santos, R. M. N., Sat- 182, 346–376, https://doi.org/10.1016/j.atmosres.2016.07.018,
urno, J., Schöngart, J., Sörgel, M., de Souza, C. M., de Souza, 2016.
R. A. F., Su, H., Targhetta, N., Tóta, J., Trebs, I., Trumbore, Fürnkranz, M., Wanek, W., Richter, A., Abell, G., Rasche, F., and
S., van Eijck, A., Walter, D., Wang, Z., Weber, B., Williams, Sessitsch, A.: Nitrogen fixation by phyllosphere bacteria asso-
J., Winderlich, J., Wittmann, F., Wolff, S., and Yáñez-Serrano, ciated with higher plants and their colonizing epiphytes of a
A. M.: The Amazon Tall Tower Observatory (ATTO): overview tropical lowland rainforest of Costa Rica, ISME J., 2, 561–570,
of pilot measurements on ecosystem ecology, meteorology, trace https://doi.org/10.1038/ismej.2008.14, 2008.
gases, and aerosols, Atmos. Chem. Phys., 15, 10723–10776, Gadoury, D. M., Stensvand, A., and Seem, R. C.: Influence of Light,
https://doi.org/10.5194/acp-15-10723-2015, 2015. Relative Humidity, and Maturity of Populations on Discharge of
Artaxo, P. and Hansson, H.-C.: Size distribution of biogenic aerosol Ascospores of Venturia inaequalis, Ecol. Popul. Biol., 88, 902–
particles from the Amazon Basin, Atmos. Environ., 29, 393–402, 909, 1998.
1995. Gilbert, G. S. and Reynolds, D. R.: Nocturnal Fungi: Airborne
Artaxo, P., Rizzo, L. V., Brito, J. F., Barbosa, H. M. J., Arana, A., Spores in the Canopy and Understory of a Tropical Rain Forest,
Sena, E. T., Cirino, G. G., Bastos, W., Martin, S. T., and Andreae, Biotropica, 37, 462–464, 2005.
M. O.: Atmospheric aerosols in Amazonia and land use change: Gomes-Silva, A. C., Medeiros, P. S. de, Soares, A. M. da S., So-
From natural biogenic to biomass burning conditions, Faraday tao, H. M. P., Ryyarden, L., and Gibertoni, T. B.: Two new
Discuss., 165, 203–235, https://doi.org/10.1039/c3fd00052d, species of Rigidoporus (Agaricomycetes) from Brazil and new
2013. records from the Brazilian Amazonia, Phytotaxa, 156, 191–200,
Buller, A. H. R.: Researches on Fungi, Longmans Green & Co., https://doi.org/10.11646/phytotaxa.156.4.1, 2014.
London, 1922. Gosselin, M. I., Rathnayake, C. M., Crawford, I., Pöhlker, C.,
Cannon, P., Aguirre-Hudson, B., Aime, M. C., Ainsworth, Fröhlich-Nowoisky, J., Schmer, B., Després, V. R., Engling,
A. M., Bidartondo, M. I., Gaya, E., Hawksworth, D., G., Gallagher, M., Stone, E., Pöschl, U., and Huffman, J.
Kirk, P., Leitch, I. J., and Lücking, P.: State of the
Atmos. Meas. Tech., 13, 153–164, 2020 www.atmos-meas-tech.net/13/153/2020/N. Löbs et al.: Aerosol measurement methods to quantify spore emission 163 A.: Fluorescent bioaerosol particle, molecular tracer, and fun- rian, W., Schöngart, J., and Parolin, P., Springer, Dordrecht, 210, gal spore concentrations during dry and rainy periods in 43–60, 2010. a semi-arid forest, Atmos. Chem. Phys., 16, 15165–15184, Möhler, O., DeMott, P. J., Vali, G., and Levin, Z.: Micro- https://doi.org/10.5194/acp-16-15165-2016, 2016. biology and atmospheric processes: the role of biological Graham, B., Guyon, P., Maenhaut, W., Taylor, P. E., Ebert, particles in cloud physics, Biogeosciences, 4, 1059–1071, M., Matthias-Maser, S., Mayol-Bracero, O. L., Godoi, R. H. https://doi.org/10.5194/bg-4-1059-2007, 2007. M., Artaxo, P., Meixner, F. X., Moura, M. A. L., Rocha, C. Moran-Zuloaga, D., Ditas, F., Walter, D., Saturno, J., Brito, J., Car- H. E. D., Grieken, R. Van, Glovsky, M. M., Flagan, R. C., bone, S., Chi, X., Hrabě de Angelis, I., Baars, H., Godoi, R. H. and Andreae, M. O.: Composition and diurnal variability of M., Heese, B., Holanda, B. A., Lavrič, J. V., Martin, S. T., Ming, the natural Amazonian aerosol, J. Geophys. Res., 108, 4765, J., Pöhlker, M. L., Ruckteschler, N., Su, H., Wang, Y., Wang, https://doi.org/10.1029/2003JD004049, 2003. Q., Wang, Z., Weber, B., Wolff, S., Artaxo, P., Pöschl, U., An- Heald, C. L. and Spracklen, D. V.: Atmospheric budget of primary dreae, M. O., and Pöhlker, C.: Long-term study on coarse mode biological aerosol particles from fungal spores, Geophys. Res. aerosols in the Amazon rain forest with the frequent intrusion Lett., 36, L09806, https://doi.org/10.1029/2009GL037493, 2009. of Saharan dust plumes, Atmos. Chem. Phys., 18, 10055–10088, Hoose, C., Kristjánsson, J. E., and Burrows, S. M.: How im- https://doi.org/10.5194/acp-18-10055-2018, 2018. portant is biological ice nucleation in clouds on a global Mueller, G. M., Bills, G. F., and Foster, M. S. (Eds.): Biodiversity scale?, Environ. Res. Lett., 5, 1–7, https://doi.org/10.1088/1748- of Fungi: Inventory and monitoring methods, Elsevier Academic 9326/5/2/024009, 2010. Press, Burlington, US, 2004. Huffman, J. A., Sinha, B., Garland, R. M., Snee-Pollmann, A., Neves, M. A., Baseia, I. G., Drechsler-Santos, R., and Goes-Neto, Gunthe, S. S., Artaxo, P., Martin, S. T., Andreae, M. O., and A. (Eds.): Guide to the common Fungi of the Semiarid Region of Pöschl, U.: Size distributions and temporal variations of bio- Brazil, TECC Editora, Florianópolis, Brazil, 2013. logical aerosol particles in the Amazon rainforest characterized Neves, T. T. de A. T. and Fisch, G.: The Daily Cycle of the At- by microscopy and real-time UV-APS fluorescence techniques mospheric Boundary Layer Heights over Pasture Site in Amazo- during AMAZE-08, Atmos. Chem. Phys., 12, 11997–12019, nia, American Journal of Environmental Engineering, 5, 39–44, https://doi.org/10.5194/acp-12-11997-2012, 2012. https://doi.org/10.5923/s.ajee.201501.06, 2015. Huffman, J. A., Prenni, A. J., DeMott, P. J., Pöhlker, C., Ma- Piepenbring, M.: Introduction to Mycology in the Tropics, The son, R. H., Robinson, N. H., Fröhlich-Nowoisky, J., Tobo, Y., American Phytopathological Society, Minesota, USA, 2015. Després, V. R., Garcia, E., Gochis, D. J., Harris, E., Müller- Pöhlker, C., Wiedemann, K. T., Sinha, B., Shiraiwa, M., Gun- Germann, I., Ruzene, C., Schmer, B., Sinha, B., Day, D. A., An- the, S. S., Smith, M., Su, H., Artaxo, P., Chen, Q., Cheng, dreae, M. O., Jimenez, J. L., Gallagher, M., Kreidenweis, S. M., Y., Elbert, W., Gilles, M. K., Kilcoyne, A. L. D., Moffet, Bertram, A. K., and Pöschl, U.: High concentrations of biolog- R. C., Weigand, M., Martin, S. T., Pöschl, U., and Andreae, ical aerosol particles and ice nuclei during and after rain, At- M. O.: Biogenic potassium salt particles as seeds for sec- mos. Chem. Phys., 13, 6151–6164, https://doi.org/10.5194/acp- ondary organic aerosol in the Amazon, Science, 337, 1075–1078, 13-6151-2013, 2013. https://doi.org/10.1126/science.1223264, 2012. Igbalajobi, O., Yu, Z., and Fischer, R.: Red- and Blue-Light Pöhlker, C., Walter, D., Paulsen, H., Könemann, T., Rodríguez- Sensing in the plant pathogen alternaria alternata depends Caballero, E., Moran-Zuloaga, D., Brito, J., Carbone, S., De- on Phytochrome and the White-Collar, MBio, 10, e00371-19, grendele, C., Després, V. R., Ditas, F., Holanda, B. A., Kaiser, https://doi.org/10.1128/mBio.00371-19, 2019. J. W., Lammel, G., Lavrič, J. V., Ming, J., Pickersgill, D., Pöh- Ingold, C. T.: Spore Discharge in Land Plants, Clarendon Press, Ox- lker, M. L., Praß, M., Löbs, N., Saturno, J., Sörgel, M., Wang, ford, 1939. Q., Weber, B., Wolff, S., Artaxo, P., Pöschl, U., and Andreae, Ingold, C. T.: Water and spore discharge in ascomycetes and M. O.: Land cover and its transformation in the backward trajec- hymenomycetes, T. Brit. Mycol. Soc., 85, IN1, 575–583, tory footprint region of the Amazon Tall Tower Observatory, At- https://doi.org/10.1016/s0007-1536(85)80250-3, 1985. mos. Chem. Phys., 19, 8425–8470, https://doi.org/10.5194/acp- Jacobson, M. Z. and Streets, D. G.: Influence of fu- 19-8425-2019, 2019. ture anthropogenic emissions on climate, natural emis- Pöschl, U., Scot, T. M., Sinha, B., Chen, Q., Gunthe, S. S., Huff- sions, and air quality, J. Geophys. Res., 114, D08118, man, J. A., Borrmann, S., K., F. D., Garland, R. M., Helas, G., https://doi.org/10.1029/2008JD011476, 2009. Jimenez, J. L., King, S. M., Manzi, A. O., Mihailov, E., Paulique- Liang, L., Engling, G., He, K., Du, Z., Cheng, Y., and Duan, vis, T., Petters, M. D., Prenni, A. J., Roldin, P., Rose, D., Schnei- F.: Evaluation of fungal spore characteristics in Beijing, China, der, J., Su, H., Zorn, S. R., Artaxo, P., and Andreae, M. O.: Rain- based on molecular tracer measurements, Environ. Pollut., 8, forest aerosols as biogenic nuclei of clouds and precipitation in 014005, https://doi.org/10.1088/1748-9326/8/1/014005, 2013. the Amazon, Science, 329, 1513–1515, 2010. McWilliam, A.-L. C., Roberts, J. M., Cabral, O., Leitao, M. V. B. Pringle, A., Patek, S. N., Fischer, M., Stolze, J., and Money, N. P.: R., de Costa, A., Maitelli, G. T., and Zamparoni, C. A. G. P.: Leaf The captured launch of a ballistospore, Mycologia, 97, 866–871, Area Index and Above-Ground Biomass of terra firme Rain For- https://doi.org/10.3852/mycologia.97.4.866, 2005. est and Adjacent Clearings in Amazonia, Funct. Ecol., 7, 310– Pruß, S., Fetzner, R., Seither, K., Herr, A., Pfeiffer, E., Metzler, M., 317, 1993. Lawrence, C. B., and Fischer, R.: Role of the Alternaria alternata Melack, J. M. and Hess, L. L.: Remote Sensing of the Disribution Blue-Light Receptor LreA (White-Collar 1) in Spore Formation and Extent of Wetlands in the Amazon Basin, in: Amazonian and Secondary Metabolism, Appl. Environ. Microb., 80, 2582– floodplain forest, edited by: Junk, W. J., Piedade, M. T. F., Flo- 2591, https://doi.org/10.1128/aem.00327-14, 2014. www.atmos-meas-tech.net/13/153/2020/ Atmos. Meas. Tech., 13, 153–164, 2020
You can also read