Delimitation of flood areas based on a calibrated a DEM and geoprocessing: case study on the Uruguay River, Itaqui, southern Brazil - NHESS
←
→
Page content transcription
If your browser does not render page correctly, please read the page content below
Nat. Hazards Earth Syst. Sci., 19, 237–250, 2019
https://doi.org/10.5194/nhess-19-237-2019
© Author(s) 2019. This work is distributed under
the Creative Commons Attribution 4.0 License.

Delimitation of flood areas based on a calibrated a DEM
and geoprocessing: case study on the Uruguay River,
Itaqui, southern Brazil
Paulo Victor N. Araújo1,2,3 , Venerando E. Amaro1,3 , Robert M. Silva4 , and Alexandre B. Lopes5
1 Postgraduate  Program in Geodynamics and Geophysics (PPGG), Federal University of Rio Grande do Norte, P.O. Box 1524,
Natal-RN, 59078-970, Brazil
2 Federal Institute of Education, Science and Technology of Rio Grande do Norte, Macau-RN, 59500-000, Brazil
3 Laboratory of Geotechnologies, Coastal and Ocean Modelling (GNOMO), Department of Civil Engineering, Federal

University of Rio Grande do Norte, Natal-RN, 59078-970, Brazil
4 Federal University of Pampa, Itaqui-RS, 96650-000, Brazil
5 Center of Sea Studies, Federal University of Parana, P.O. Box 61, Curitiba-PR, 83225-976, Brazil

Correspondence: Paulo Victor N. Araújo (paulo.araujo@ifrn.edu.br)

Received: 14 July 2018 – Discussion started: 15 August 2018
Accepted: 2 January 2019 – Published: 25 January 2019

Abstract. Flooding is a natural disaster which affects thou-          erate flood hazard, low flood hazard, and non-floodable. The
sands of riverside, coastal, and urban communities causing            flood episodes, with a return time of 100 years, were mod-
severe damage. River flood mapping is the process of deter-           eled with a 57.24 m altimetric level. Altimetric levels above
mining inundation extents and depth by comparing historical           51.66 m have a high potential of causing damage, mainly af-
river water levels with ground surface elevation references.          fecting properties and public facilities in the city’s northern
This paper aims to map flood hazard areas under the influ-            and western peripheries. Assessment of the areas that can po-
ence of the Uruguay River, Itaqui (southern Brazil), using            tentially be flooded can help to reduce the negative impact of
a calibration digital elevation model (DEM), historic river           flood events by supporting the process of land use planning
level data and geoprocessing techniques. The temporal series          in areas exposed to flood hazard.
of maximum annual level records of the Uruguay River, for
the years 1942 to 2017, were linked to the Brazilian Geode-
tic System using geometric leveling and submitted for de-
                                                                      1   Introduction
scriptive statistical analysis and probability. The DEM was
calibrated with ground control points (GCPs) of high verti-           Flooding, as a major natural disaster, affects many parts of
cal accuracy based on post-processed high-precision Global            the world including developed countries, and has severe im-
Navigation Satellite System surveys. Using the temporal se-           pacts on populations and causes socioeconomic damage. Due
ries statistical analysis results, the spatialization of flood haz-   to this kind of natural disaster, billions of dollars in infras-
ard classes on the calibrated DEM was assessed and val-               tructure and property damage, as well as hundreds of human
idated. Finally, the modeling of the simulated flood level            lives, are lost each year (Demir and Kisi, 2016; Elnazer et al.,
was visually compared against the flood area on the satel-            2017). It is understood that flood risks and hazards will not
lite image, which were both registered on the same date.              subside in the future and, with the onset of climate change,
The free DEM calibration model indicated high correspon-              flood intensity and frequency will threaten many regions of
dence with GCPs (R 2 = 0.81; p < 0.001). The calibrated               the world (IPCC, 2014).
DEM showed a 68.15 % improvement in vertical accuracy
(RMSE = 1.00 m). Five classes of flood hazards were deter-
mined: extremely high flood hazard, high flood hazard, mod-

Published by Copernicus Publications on behalf of the European Geosciences Union.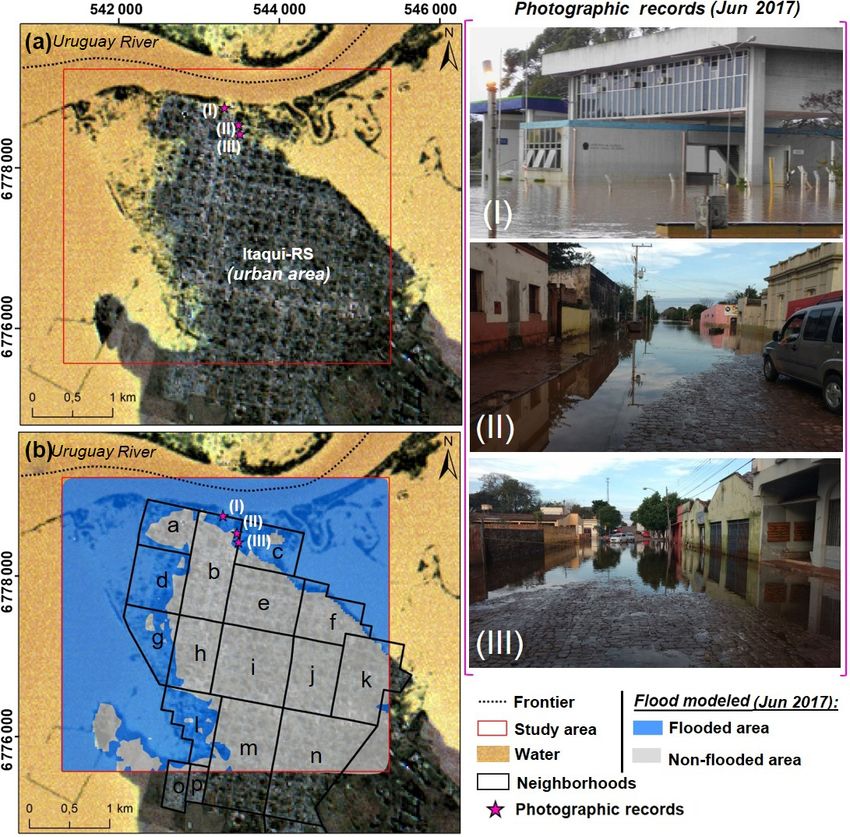
238    P. V. N. Araújo et al.: Delimitation of flood areas based on a calibrated DEM and geoprocessing: Uruguay River

   These hazards can be prevented and reduced by provid-            case study of Itaqui in the state of Rio Grande do Sul, south-
ing reliable information to the public about the flood haz-         ern Brazil, through a calibration of DEM from Shuttle Radar
ard through flood inundation maps (Alaghmand et al., 2010;          Topography Mission (SRTM) images, historical fluviometric
Demir and Kisi, 2016). This information can, for example,           level data collected at Itaqui station, and geoprocessing tech-
assist urban management or even help the rescue operations          niques.
during these events (Cook and Merwade, 2009), thus help-
ing the communities directly to avoid or mitigate such future
losses and damage (Arrighi et al., 2013; Savage et al., 2014;       2   Study area
Speckhann et al., 2017).
                                                                    The Uruguay River basin is one of the most important hy-
   Flood hazard maps therefore need to be created as they
                                                                    drographic basins of Brazil; it is located in the south of the
provide a basis for the development of flood risk manage-
                                                                    country and extends throughout the neighboring countries
ment plans. These plans need to be effectively communicated
                                                                    of Argentina and Uruguay. Therefore, this basin marks the
to various target groups, including decision makers, emer-
                                                                    division between the Brazilian states of Rio Grande do Sul
gency response units and the public, as a measure to reduce
                                                                    and Santa Catarina, and also between Brazil and Argentina.
flood risk by integrating different interests, and potential con-
                                                                    The Uruguay River basin occupies a total extension area of
flicts over space and land use in a city (Ouma and Tateishi,
                                                                    385 000 km2 , where approximately 274 300 km2 is located in
2014). However, creating flood maps is a complex process
                                                                    Brazil, corresponding to 3 % of national territory. This hy-
which is affected by the input data, flow design, and consis-
                                                                    drographic region has a prominent economic sector, mainly
tent topographic information (APFM, 2013). A major aid in
                                                                    focused on the improvement of agricultural and industrial ac-
the construction of flood maps is use of geoprocessing (Chen
                                                                    tivities. The Uruguay River hydrographic region has great
et al., 2009; Sarhadi et al., 2012; Demir and Kisi, 2016;
                                                                    hydroelectric potential with a total production capacity of
Ovando et al., 2016; Liu and Yamazaki, 2018). Geoprocess-
                                                                    40.5 kW km2 , and when considering both Brazilian and Ar-
ing is a set of techniques based on the study of spatially dis-
                                                                    gentinian sides, one of the biggest energy per square kilome-
tributed information in order to describe the characteristics
                                                                    ter relations in the world (ANA, 2015).
of the phenomenon under investigation in the whole area of
                                                                       The Uruguay River basin area has a temperate climate,
interest (Costa and Lourenço, 2011). The construction pro-
                                                                    with a regular intra-annual rainfall distribution, and some
cess of flood maps requires an understanding of flow dynam-
                                                                    highs during May to September, coinciding with the win-
ics over the floodplain, topographic relationships and sound
                                                                    ter season in the Southern Hemisphere. The natural hydric
judgments of the modeler (Noman et al., 2001; Sinnakaudan
                                                                    availability of the Uruguay hydrographic basin is largely in-
et al., 2003; Sanders, 2007; Alagmand et al., 2010; Sarhadi et
                                                                    fluenced by the significant spatial and temporal variables of
al., 2012). Frequently, applications for flood hazard mapping
                                                                    a few climatic parameters, such as the pluviometric regime,
found in the literature are based on low-resolution models,
                                                                    which reflects directly on the economic activities developed
mainly using free digital elevation models, which are not ver-
                                                                    in the region, which are largely in the agricultural sector
tically calibrated to a local geodetic reference system (Komi
                                                                    (BID, 2008). Many areas were deforested due to the growth
et al., 2017; Patel et al., 2017; Speckhann et al., 2017; Dhi-
                                                                    of agro-industrial activities in the region, which led to an en-
man et al., 2019).
                                                                    vironmental imbalance, from river siltation to water pollu-
   Thus, special attention is required for topographic data
                                                                    tion with pesticides and their residues. Therefore, this region
because a robust flood model needs high vertical accuracy
                                                                    shows the original and remaining native vegetation cover of
linked to a geodetic reference system, since in many cases,
                                                                    the Brazilian Atlantic forest biome and Araucaria moist for-
flood-prone areas are found in marginal regions of low-slope
                                                                    est biome. Geomorphology is dominated by rugged relief in
floodplain and may embrace large areas, such as this case
                                                                    the upper Uruguay River basin, followed by a flatter patch
study (Uruguay River basin, Itaqui) (Gupta, 2009; Mistry,
                                                                    in the gaucho campaign region with shallow soil, which is
2009). The modeling of a flood hazard map is linked to
                                                                    the reason why the Uruguay River flows through a rocky
the local geodetic reference system, corroborated with the
                                                                    substrate. This characteristic implies a flow regime that fol-
identification and monitoring of flood situations, and con-
                                                                    lows the rainfall trend: when periods of intense precipita-
struction of realistic predictive scenarios (operational level)
                                                                    tion occur, they cause floods in riverside areas and, in the
for risk management and adaptation (governmental agencies,
                                                                    same way, when periods of drought occur, the flow regime is
such as the local civil defense) (Joshi et al., 2012; Gallien et
                                                                    abruptly reduced, sometimes even to guarantee the hydric re-
al., 2018; Jongman, 2018). It is extremely important to do
                                                                    quirements of human and socioeconomic activities. In Brazil,
the calibration of the digital elevation model (DEM) using
                                                                    the Uruguay hydrographic region is composed of 11 hydro-
high-accuracy ground control point (GCP) data, aimed at im-
                                                                    graphic sub-basins: (1) Apuae–Inhandava, (2) Passo Fundo,
proving the vertical accuracy, and applied to regional or lo-
                                                                    (3) Turvo–Santa Rosa–Santo Cristo, (4) Piratinim, (5) Ibicui,
cal studies about floods (Araújo et al., 2018). Therefore, this
                                                                    (6) Quarai, (7) Santa Maria, (8) Negro, (9) Ijui, (10) Varzea
study aims to conduct a robust mapping of flood hazard de-
                                                                    and (11) Butui–Icamaqua (ANA, 2015).
limitation areas influenced by the Uruguay River, using the

Nat. Hazards Earth Syst. Sci., 19, 237–250, 2019                             www.nat-hazards-earth-syst-sci.net/19/237/2019/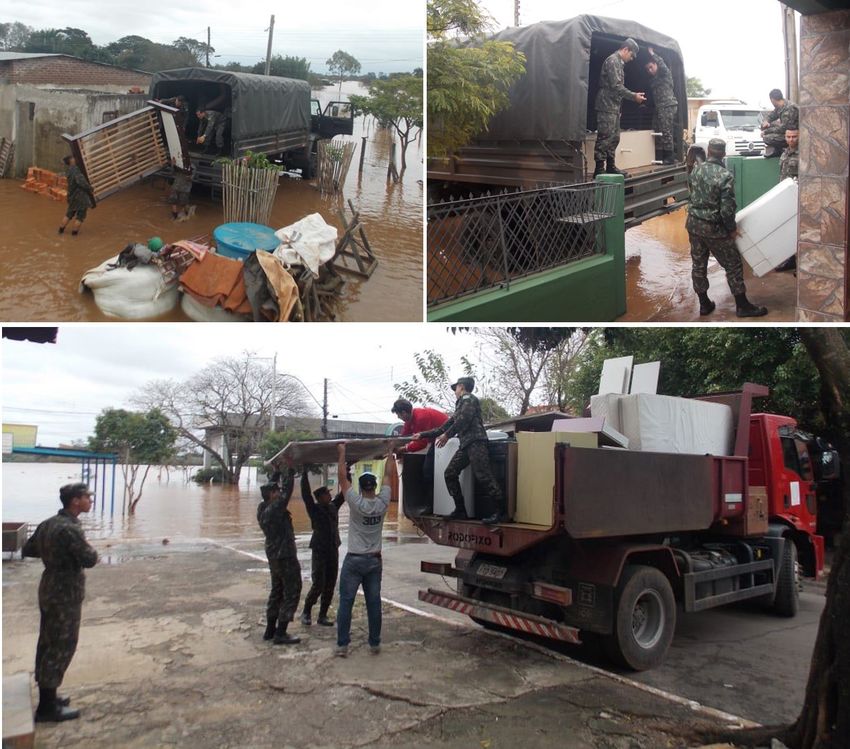
P. V. N. Araújo et al.: Delimitation of flood areas based on a calibrated DEM and geoprocessing: Uruguay River                     239

   The study area comprises the urban area of Itaqui and is lo-
cated on the banks of the Uruguay River on the western bor-
der of the state of Rio Grande do Sul, southern Brazil (Fig. 1).
It corresponds to Ibicui sub-basin, the largest sub-basin of
the Uruguay River, which has the Uruguay River and also
the Cambai and Sanga das Olarias streams as its main water
bodies. The study area has a territorial area of 34 066.06 km2
and an estimated population of 39 049 inhabitants according
to the Brazilian official 2016 Census by the National Insti-
tute of Geography and Statistics (IBGE, in Portuguese). This
area plays an important role in regional but also national eco-
nomic scope due to rice cultivation, as well as Hereford and
Braford bovine breeding, and commercial pig breeding for
slaughter. These economic activities influence the region’s
environmental quality because they are directly related to the
land use, occupation of the area, and increases in water con-        Figure 1. Location of the study area. Highlighted are the ground
sumption (Bariani and Bariani, 2013).                                control points of high vertical accuracy from the High Accuracy
   Itaqui was settled on the edge of the Uruguay River. Cur-         Altimeter Network (in Portuguese, Rede Altimétrica de Alta Pre-
rently, this riverside location is occupied by communities,          cisão – RAAP) of the Brazilian Institute of Geography and Statis-
some of very low economic class, that depend on the river            tics (IBGE) and from the Federal University of Pampa (UNI-
for their livelihoods. These dwellers are often displaced to         PAMPA).
higher regions to move away from the constant flood. Itaqui
survives under the same conditions as most Brazilian small
                                                                     ral phenomenon. Among the published papers, we emphasize
cities, with a lack of resources and of specialized profession-
                                                                     Saueressig (2012), Saueressig and Robaina (2015), Silva et
als that can act in the projection and the orderly urban de-
                                                                     al. (2017), and Silva (2017). All of these are results of Mas-
velopment. This fact is reflected in the lack of studies and
                                                                     ters dissertations in postgraduate programs in Brazil.
information that aid the aim of urban management to mini-
                                                                        Saueressig (2012) emphasized a zoning of flood risk areas
mize negative impacts on society.
                                                                     of the urban marginal area of the Municipality of Itaqui. The
   This undue occupation causes various problems that have
                                                                     author organized an inventory of floods that happened be-
a direct impact on society, including floods within the urban
                                                                     tween 1980 and 2010, and focused on a socio-environmental
area. One of the reasons is the disorderly urban sprawl with-
                                                                     discussion, developing models with a few consistent criteria
out adequate infrastructure, along with the non-observance of
                                                                     in relation to altimetry.
the natural characteristics of the occupied environment that,
                                                                        Silva (2017) concentrated on the usage of geodetic meth-
as a consequence, means that it is impossible for areas near
                                                                     ods to elaborate a DEM of integrated elevation with hy-
rivers and creeks to absorb floods (Silva et al., 2017). It is im-
                                                                     drologic data for monitoring affected areas lined by the
portant to highlight that, in addition to the lack of financial
                                                                     Uruguay River. However, Silva (2017) focused his efforts on
resources to be invested in the municipality, there the almost
                                                                     the marginal urban areas of Itaqui.
constant expense of the damages caused by the increase in
                                                                        Thus, this work intends to fill an information gap, cov-
river level. Most riverside families live in so-called “volantes
                                                                     ering the entire urban area of the city, with the hazard in
houses” (Fig. 2); these are wooden houses and can be trans-
                                                                     focus, priming a methodological application that uses high-
ported from one place to another. But in some extreme events
                                                                     accuracy altimetric data to model flood hazard maps. Further-
such as the one that occurred in 2017, some families lost all
                                                                     more, a statistical analysis using a temporal series of maxi-
of their belongings and in some cases even their homes, leav-
                                                                     mum annual level records of Uruguay River data was devel-
ing it to the local government to help with the expenses of
                                                                     oped, which will provide innovative information about the
these communities (Fig. 3).
                                                                     return period of the flood phenomenon in study region.

3   Previous studies of flooding in Itaqui                           4   Material and methods

The flooding process of the Uruguay River in Itaqui is a             The temporal series of annual maximum fluviometric records
natural phenomenon that has afflicted the riverside popu-            of the Uruguay River, from 1942 to 2017 (76 years of data),
lation for decades. It is practically intrinsic to the city’s        linked to Brazilian Geodetic System (Sistema Geodésico
history. However, even though it is a relevant problem to            Brasileiro – SGB) and using geometric leveling, was submit-
the local population, only after 2011 were papers pub-               ted for statistical analysis. Then, calibration of a digital eleva-
lished emphasizing the local hazards and risks of this natu-         tion model (DEM), obtained free of charge from the Shuttle

www.nat-hazards-earth-syst-sci.net/19/237/2019/                                Nat. Hazards Earth Syst. Sci., 19, 237–250, 2019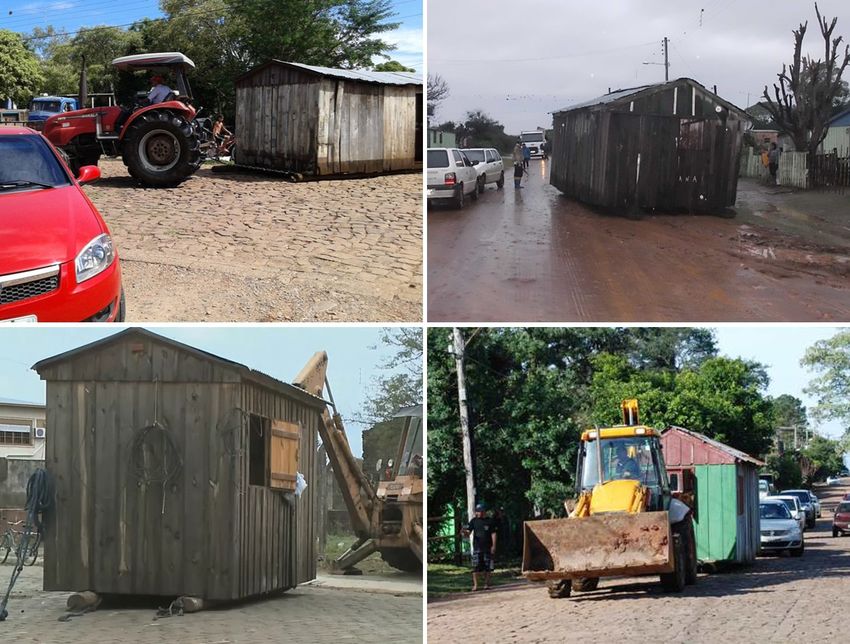
240     P. V. N. Araújo et al.: Delimitation of flood areas based on a calibrated DEM and geoprocessing: Uruguay River

Figure 2. “Volantes houses” being transferred in periods of flooding in Itaqui.

Figure 3. The Brazilian Army helping local residents during flooding events in Itaqui (adapted from: EB, 2017).

Nat. Hazards Earth Syst. Sci., 19, 237–250, 2019                                  www.nat-hazards-earth-syst-sci.net/19/237/2019/
P. V. N. Araújo et al.: Delimitation of flood areas based on a calibrated DEM and geoprocessing: Uruguay River                    241

Figure 4. Flowchart of the proposed approach for the delimitation of flood hazard mapping.

Radar Topography Mission (SRTM), was conducted using                   analysis sought to obtain information about the central ten-
ground control points (GCPs) of high vertical accuracy. The            dency, dispersion, and separatrix (quartile and percentile).
results of the temporal series statistical analysis served as the      Furthermore, the return period of maximum altimetric quo-
basis for the spatialization of floods on the calibrated DEM.          tas for 2, 4, 10, 20, and 100 years were obtained. The return
Finally, a visual comparison between a modeled flood and a             period (Tr ), also known as recurrence interval or recurrence
digitally processed image from the flood area satellite image          time, was employed as the time which a specific hydrologi-
was performed, both having been registered concomitantly               cal event can be matched or exceeded in any given year (Mc-
on the same day in study region.                                       Cuen, 1998). In the present study, the return period (Tr ), in
   In summary, the flood simulation model is based on the fill         years, was defined by the following equation, where p is the
of the DEM, calibrated at river level orthometric heights, and         probability that a hydrological event be matched or exceeded
linked to a common geodetic reference system. The work-                (Tanguy et al., 2017), Eq. (1):
flow of the proposed methodology is shown in Fig. 4.
                                                                              1
                                                                       Tr =     .                                                 (1)
4.1   Statistical analysis of Uruguay River fluviometric                      p
      level records                                                    Then, the Mann–Kendall sequential test (Mann, 1945;
                                                                       Kendall, 1975) was applied to evaluate the temporal serial
Data from all annual maximums of fluviometric levels (m)               behavior of annual maximum orthometric height data of the
of the Uruguay River were assembled in the river level mon-            Uruguay River. The Mann–Kendall test is a robust, sequen-
itoring station with the codename “ITAQUI” no. 75900000                tial, and non-parametric statistical method used to determine
(latitude: −29◦ 070 3900 ; longitude: −56◦ 330 4500 ), for 76 years    if a specific data series has a temporal tendency towards
of historical information (between 1942 and 2017). All an-             statistically significant changes. Among its advantages, it
nual maximum level records were linked to the Brazilian                does not require normal distribution of data and is only
Geodetic System (Sistema Geodésico Brasileiro – SGB) with              slightly influenced by abrupt changes or non-homogenous
their respective orthometric heights. These data were ob-              series (Zhang et al., 2009). In recent years, with growing con-
tained through the Monitoring and Alerts of Disasters System           cerns over environmental degradation and about the implica-
of Rio Grande do Sul (Sistema de Monitoramento e Alerta de             tions of greenhouse gases on the environment, researchers
Desastres – SMAD), using their website http://www.smad.rs.             and practitioners have frequently applied the non-parametric
gov.br/ (last access: 25 May 2018). The SMAD is a project              Mann–Kendall test to detect trends in recorded hydrologic
implemented by the Environment and Sustainable Develop-                time series such as water quality, streamflow, and precipita-
ment Secretariat of Rio Grande do Sul, which is used by the            tion time series (Yue and Wang, 2004). Although it has no
civil defense and other competent organizations for monitor-           influence on the flood hazard mapping, the Mann–Kendall
ing and disaster warnings. Also, it is used for environmental          test was applied to investigate if the elevation of the Uruguay
management and monitoring of natural resources.                        River is showing any upward or downward trend.
   In statistical analysis, first the variability of attributes and
the characterization of the probability distribution were ver-
ified, based on the data descriptive analysis of the annual
maximum orthometric heights of the Uruguay River. This

www.nat-hazards-earth-syst-sci.net/19/237/2019/                                     Nat. Hazards Earth Syst. Sci., 19, 237–250, 2019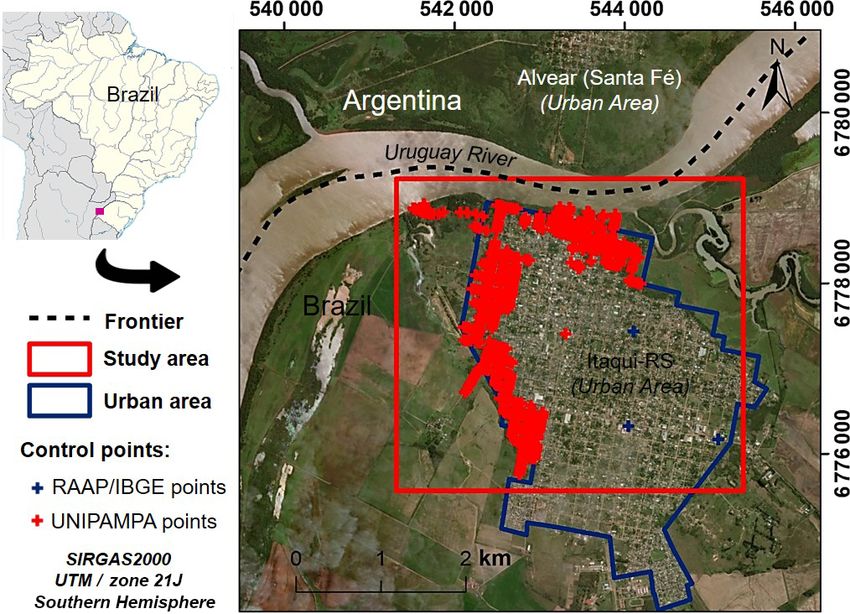
242      P. V. N. Araújo et al.: Delimitation of flood areas based on a calibrated DEM and geoprocessing: Uruguay River

4.2     Delimitation of flood hazards areas                       coordinate system (UTM, Zone: 21J/Southern Hemisphere),
                                                                  and the MAPGEO2010 geodetic model. Lastly, the orthome-
4.2.1    Digital elevation model (DEM) calibration                tric height values were exported in a shapefile format with
                                                                  the ArcMap 10.1 software (ESRI, 2011).
A digital elevation model (DEM) is a set of digital data de-         The DEM used in this study was obtained through a SRTM
scribing elevation values of Earth ground surface (or any         image with a spatial resolution of 1 arcsec (approximately
other surface) which contains additional information about        30 m at the Equator), 16 bit radiometric resolution, a geo-
the character of this surface and interpolation algorithm,        graphic coordinate system, WGS1984 horizontal datum, and
which is best for approximation (modeling) of the real to-        a EGM96 vertical datum (Earth Gravitational Model, 1996).
pography (Szypuła, 2017). A DEM is a complete represen-           These data were acquired at the Earth Data servers (NASA),
tation of a land surface, which means that heights are avail-     using the interface developed by Derek Watkins (http://
able at each point in the area of interest (Hengl and Evans,      dwtkns.com/srtm30m/, last access: 10 March 2018). The ad-
2009). In this study, the SRTM DEM was taken as the topo-         vantage of this interface is the availability of SRTM scenes
graphic model. However, it was submitted to the calibration       with excellent void correction processes, which are empty
process for adjustment to the local reference geodetic system.    spaces where no elevation value can be determined. These
The DEM calibration is a mandatory pre-processing adop-           voids cause significant problems for using the DEM from
tion that provides improvement of both DEM vertical accu-         SRTM images, especially on hydrological modeling applica-
racy and linking to the geodetic system (Araújo et al., 2018).    tions that require continuous flow surfaces. The “S30W057”
This study adopted the SRTM calibration method suggested          scene was downloaded and the orthometric height values of
by Araújo et al. (2018). These authors used control points of     pixels were extracted from the control point grid and ex-
high vertical accuracy linked to the Brazilian Geodetic Sys-      ported in table form for statistical analysis purposes.
tem (in Portuguese Sistema Geodésico Brasileiro – SGB) for           To evaluate and calibrate the DEM of the study area, a
calibrating the DEMs.                                             matrix was constructed with the orthometric height values
   The GCPs were considered as the orthometric altimetry          of control points and the SRTM image. This dataset was
points acquired from high-accuracy geodesy. A grid with           subjected to linear regression analysis, with ground control
700 GCPs was constructed using data from two databases            point values as a dependent variable and SRTM data as an
(Fig. 1): (i) 3 points from the High Accuracy Altimeter           independent variable, which is a common procedure found
Network (Rede Altimétrica de Alta Precisão – RAAP) of             in the literature for DEM calibration (e.g., Gorokhovich and
the Brazilian Institute of Geography and Statistics (IBGE);       Voustianiouk, 2006; Forkuor and Maathuis, 2012). Then, the
and (ii) 697 points with orthometric heights linked to SGB        DEM obtained from the SRTM image was calibrated using
through relative GNSS leveling, called UNIPAMPA points.           the model proposed by the linear regression. Subsequently,
   The RAAP–IBGE was created using the high-accuracy              both DEMs (the original and calibrated) were subjected to
geometric leveling technique, allowing the determination of       descriptive statistical analysis and comparison between the
geodetic stations with an altitude value that was referenced      mean of orthometric height variation (1H ) and the root
with the mean sea level (MSL) in Imbituba-SC. These sta-          mean square error (RMSE) value, as proposed by Araújo et
tions are known as level references (Referencias de Niveis –      al. (2018). In all statistical analyses, a significance value of
RRNN) and were set up throughout Brazil along highways            5 % (Zar, 2010) was adopted and they were performed on
and railways at around 3 km intervals, in the first survey, and   R software v.3.4.1 (R Development Core Team, 2017).
nowadays at around 2 km intervals. Currently, the Brazilian
network has approximately 68 000 RRNN available at the            4.2.2   Determining classes of flood hazard map
Geodetic Database (Banco de Dados Geodesicos – BDG),
which can be accessed at the Brazilian Open Data website          To determine the classes of flood hazard mapping, a de-
(Portal Brasileiro de Dados Abertos – PBDA), through the          scriptive analysis of the orthometric height temporal series
following link: http://dados.gov.br/dataset/cged_bdg_rn (last     (annual maximum fluvial levels records) of the Uruguay
access: 5 May 2018). For this study, three points from RAAP       River was performed (minimum, maximum, quartile, and
that were inside the study area and in a good conservation        percentile). The determination of the classes was closely
state were used.                                                  linked to the probability of occurrence of the annual max-
   The database with 697 control points from the Federal          imum fluvial height of the Uruguay River. At this stage,
University of Pampa (UNIPAMPA) was acquired with GNSS             five classes of flood hazard were determined, as described
receivers on the field through a high-accuracy post-processed     in Table 1.
kinematic (PPK) mode and linked to SGB (Silva et al., 2017).         Through map algebra, using the previously calibrated
These high-accuracy control points had a mean altimetric er-      DEM, all classes were mapped in a geographic informa-
ror of 0.006 ± 0.0007 m.                                          tion system (GIS) environment using ArcMap 10.1 software
   All 700 control points were standardized to the horizon-       (ESRI, 2011).
tal datum SIRGAS2000, the Universal Transverse Mercator

Nat. Hazards Earth Syst. Sci., 19, 237–250, 2019                           www.nat-hazards-earth-syst-sci.net/19/237/2019/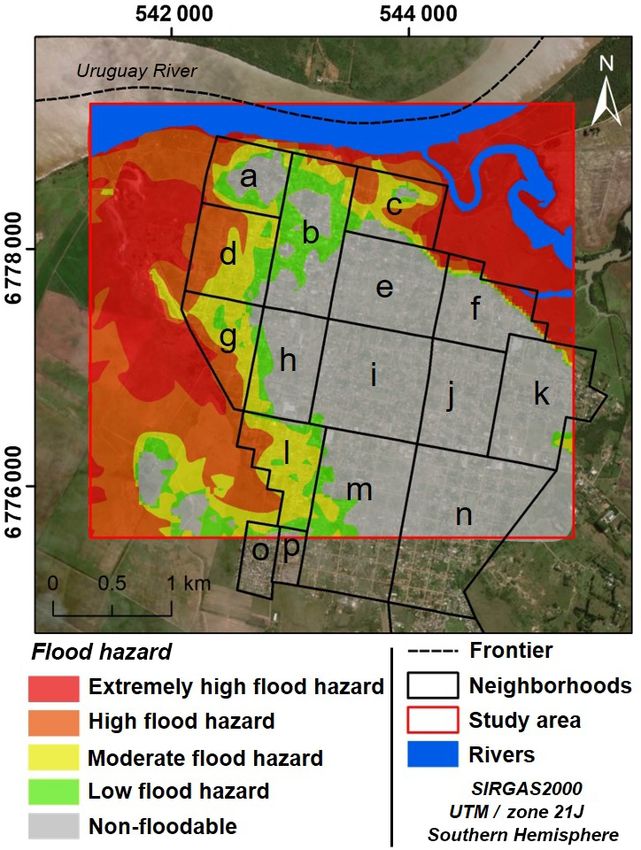
P. V. N. Araújo et al.: Delimitation of flood areas based on a calibrated DEM and geoprocessing: Uruguay River                    243

Table 1. Classes of flood hazard for mapping.                     Table 2. Results of Mann–Kendall test.

    Classes                       Altimetric river quota                                           Summary
                                  used as indicator                             Kendall’s tau statistic               0.167a
    Extremely high flood hazard   < Median                                      Two-sided p value                     0.03351b
    High flood hazard             ≥ Median and third quartile                   Kendall score (S)                     475
    Moderate flood hazard         third quartile and < 95 %                     Denominator (D)                       2848.5
    Low flood hazard              ≥ 95 % and < maximum quota                    Variance of Kendall score             49 713.67
    Non-floodable                 > Maximum quota
                                                                              a Positive trend and b significant upward trend.

   In a few areas there was topographic discontinuity. When
                                                                    – Geographic information system (GIS) was the tech-
these altimetric class discontinuities occurred, the sector in
                                                                      nique most used throughout the work. All data were
focus was considered to be in the upper elevation altimetric
                                                                      used to implement a robust GIS.
class.
                                                                    – Digital cartography was used during the elaboration of
4.2.3    Evaluation of the mapping of flood hazard areas
                                                                      the maps.
At this stage, the flood area for the 12 June 2017 was es-          – Digital image processing (DIP) was the technique ap-
timated using the flood model established in the previous             plied to improve the visualization of the historical flood-
stage. This date was picked because it was the annual maxi-           ing from the CBERS-4 MUX satellite images.
mum level day of the Uruguay River for the year 2017 in the
Itaqui city area. In addition, it coincided with the CBERS-4        – Precision geodesy was used during the calculation of
(China–Brazil Earth Resources Satellite) satellite multispec-         the points of land controls and the linkage of the river
tral imagery for the region. Among the coupled instruments            level to the Brazilian Geodetic System.
in CBERS-4, the Multispectral Regular (MUX) sensor stands
out, covering four spectral bands between 450 and 890 nm,           – Geostatistical techniques were used during the evalua-
with a scanning range of 120 km, and nominal spatial res-             tion and calibration of the digital elevation model.
olution of 20 m at nadir (Boggione et al., 2014). These data
were acquired freely from the National Institute of Space Re-     The results achieved in this study are systematically pre-
search (Instituto Nacional de Pesquisas Espaciais – INPE)         sented and discussed below.
by accessing their website (http://www.inpe.br/, last access:
                                                                  5.1   Analysis of the maximum annual fluviometric level
30 May 2018). The multispectral bands were subjected to
                                                                        of the Uruguay River
a radiometric and atmospheric correction (Jensen, 2009). A
hybrid color composite RGBI-765NDWI, based on a red–              The annual maximum level records of the Uruguay River for
green–blue intensity color system, was generated in order         the last 76 years have an amplitude of 9.78 m, with a max-
to identify the flood area, using ERMAPPER v7.1 soft-             imum of 57.23 m and a minimum of 47.76 m. Furthermore,
ware (ERDAS, 2008). The normalized difference water in-           the values of mean and median were 51.97 and 51.56 m, re-
dex (NDWI) was elaborated using the following algorithm           spectively (Fig. 5). For these data, the p value associated with
proposed by McFeeters (1996), Eq. (2):                            the Mann–Kendall test is statistically significant, suggesting
              ρgreen − ρNIR                                       the presence of a statistically significant upward trend in the
NDWI =                      ,                               (2)
              ρgreen + ρNIR                                       annual maximum level records of the Uruguay River (pos-
                                                                  itive tau statistic = 0.167; two-sided p value = 0.03351), as
where ρgreen corresponds to the reflectance of the green band
                                                                  shown in Table 2. Furthermore, it is essential to mention that,
(CBERS-4 band 6; 520–590 m); and ρNIR corresponds to
                                                                  during the last 3 years, two occurrences of a flood altimetric
the reflectance of the infrared band (CBERS-4 band 8; 770–
                                                                  quota for a return period of 20 years were observed (2014
890 m) of sensor CBERS-4 MUX.
                                                                  and 2017). The return period values for 2, 4, 10, 20, and
   Finally, a visual comparison of the modeled flood area vs.
                                                                  100 years are presented on Table 3.
identified flood area on satellite image was performed.
                                                                     According to research found in the literature, the Uruguay
                                                                  basin presented a positive trend in precipitation and stream-
5    Results and discussion                                       flow during the late twentieth century (Pasquini and De-
                                                                  petris, 2007; Barros et al., 2008; Abreu et al., 2018). Abreu et
In this work the use of geoprocessing techniques was ex-          al. (2018) concluded that anthropogenic climate change has
tremely important to reach the results. We use the following      increased the risk of the extreme rainfall in this catchment by
techniques:                                                       at least 2 times, with a median increase of about 5 times. It is

www.nat-hazards-earth-syst-sci.net/19/237/2019/                            Nat. Hazards Earth Syst. Sci., 19, 237–250, 2019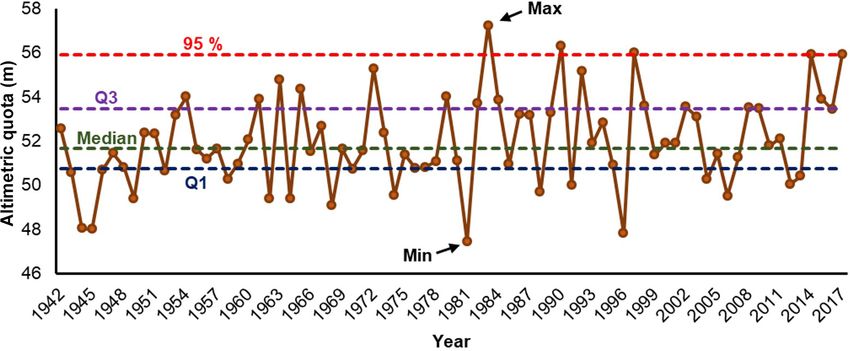
244     P. V. N. Araújo et al.: Delimitation of flood areas based on a calibrated DEM and geoprocessing: Uruguay River

Figure 5. Annual fluviometric maximum level records of the Uruguay River in Itaqui.

Table 3. Probability of the fluviometric level being matched or ex-
ceeded. Tr : flood return period.

                Probability        Tr   Altimetric
                (p)           (years)     river
                                          quota
                                           (m)
                0.5                2       51.66
                0.25               4       53.45
                0.1               10       54.58
                0.05              20       55.92
                0.01             100       57.24
                                                                      Figure 6. Linear regression analysis of SRTM image vs. ground
                                                                      control points (GCPs).
important to emphasize that the Uruguay River has large flow
variation, from the occurrence of great floods, which affect          Table 4. Indicators of DEM errors in relation to GCPs.
riverside populations, to lack of water for human consump-
tion and other necessities. The catchment of Uruguay basin                            DEM              Mean of    RMSE
has a fast-hydrologic response in which flood occurrence is                                            1H (m)      (m)
more dependent on meteorology than on initial conditions of                           SRTMOriginal       −2.84      3.14
soil moisture and flow (Tucci et al., 2003). Physical charac-                         SRTMCalibrated      0.00      1.00
teristics of the Uruguay River basin, such as the strong slope
of the drained terrain, river channel morphology, and the soil,
in conjunction with low water retention and deforestation of
                                                                         Comparing the error evaluators, it was already expected
the main river and tributary banks for the extraction of wood
                                                                      that the calibrated SRTM mean of the orthometric height
and/or agricultural use, assist in the surface drainage after in-
                                                                      variation (1H ) would be zero (Table 4). According to Araújo
tense rains, flooding, erosion, and silting of river beds (BID,
                                                                      et al. (2018) this happens due to the DEM plan being
2008).
                                                                      perfectly adjusted to the GCP network plan after calibra-
5.2   Delimitation of flood hazard areas                              tion, linking the MDE calibration to the Brazilian Geode-
                                                                      tic System (SGB). In relation to the RMSE of the original
Using the 700 GCPs, it was possible to evaluate and cali-             SRTM (non-calibrated SRTM), a RMSE of 3.14m was found
brate the DEM from the SRTM image. The linear regression              from comparison to the GCPs. This accuracy is approxi-
analysis showed strong correlation between the ground con-            mately 2 times greater than what was reported in the origi-
trol points and the SRTM altimetry data, generating a highly          nal SRTM specifications (6.20 m for South America). Araújo
robust model with R 2 = 0.81 and p < 0.001 (Figs. 6 and 7).           et al. (2018) found a similar value (3.10 m) when evaluat-
The SRTM calibration and correction model based on control            ing the DEM from SRTM at regional-scale analysis for the
points was determined as y = 0.7031x + 13.913.                        Piranhas–Açu River basin, in northeastern Brazil. When cal-
                                                                      ibrating the SRTM, an extreme improvement of the RMSE
                                                                      was verified, where the adjusted value of 1.00 m was found.

Nat. Hazards Earth Syst. Sci., 19, 237–250, 2019                               www.nat-hazards-earth-syst-sci.net/19/237/2019/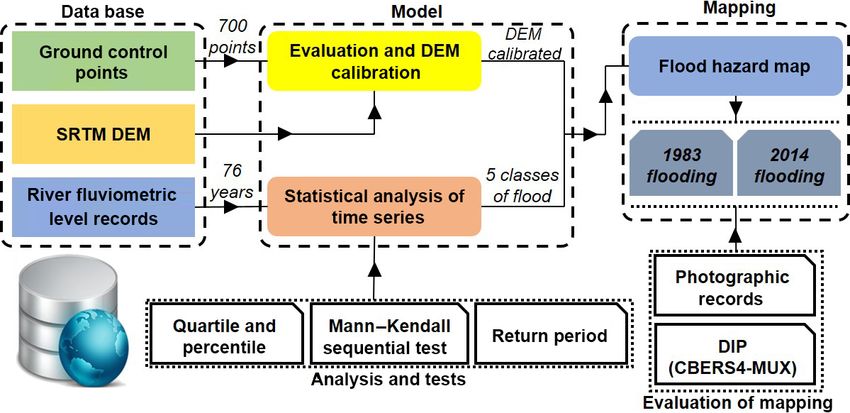
P. V. N. Araújo et al.: Delimitation of flood areas based on a calibrated DEM and geoprocessing: Uruguay River 245
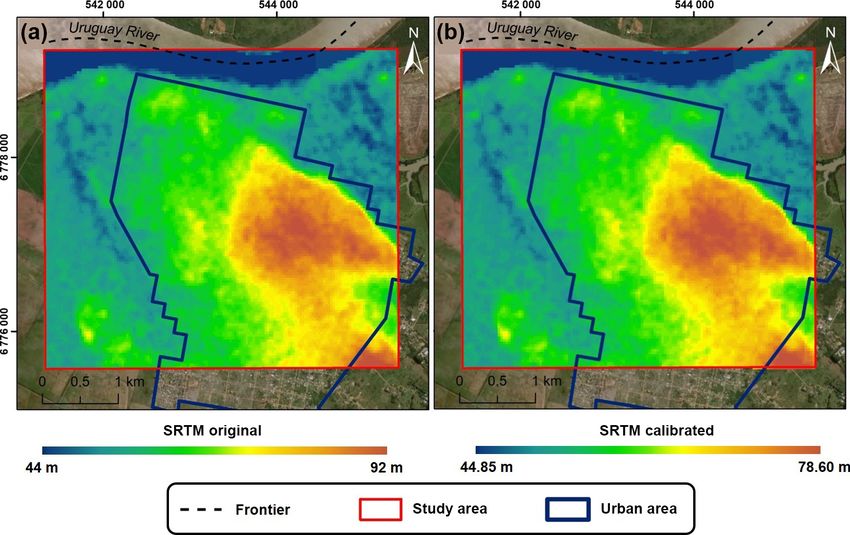
Figure 7. Digital elevation model (DEM): (a) SRTM original; (b) SRTM calibrated.
Table 5. Classes of flood hazard mapping in Itaqui, southern Brazil.
Class Altimetric river
quota used as
indicator
Extremely high flood hazard < 51.66
High flood hazard 51.66|–53.45
Moderate flood hazard 53.45|–55.92
Low flood hazard 55.92|–57.24
Non-floodable > 57.24
In this way, a 68.15 % decrease of RMSE value for the cal-
ibrated SRTM compared to the non-calibrated SRTM was
found (Table 4).
Assuming that the calibrated SRTM is linked to the SGB,
it was possible to apply the five flood hazard classes to the
altimetric model, as shown in Table 5. After the spatialization
of the classes it was possible to observe the flood behavior in
the study area (Fig. 8).
Figure 8. Flood hazard map of Itaqui, Rio Grande do Sul, south-
Mapping results of the flood hazard classes helped to iden-
ern Brazil. Neighborhoods: (a) Cerrinho Dois Umbus; (b) Centro;
tify areas with greatest potential for damage to the popu- (c) Ponte Seca; (d) Varzea; (e) Cidade Alta; (f) Cohab; (g) Enio
lation in the study area. In general, there was a river gra- Sayago; (h) Estacao; (i) Capelinha; (j) Dr. Ayub; (k) Jose da Luz;
dient upstream from the urban city center, mainly around (l) Vinte e Quatro de Maio; (m) Chacara; (n) Cafifas; (o) Vila Nova;
the north and west neighborhood outskirts of the urban area, and (p) Uniao.
with greater emphasis on the Cerrinho Dois Umbus, Cen-
tro, Ponte Seca, Varzea, Enio Sayo, and Capelinha neighbor-
hoods (Fig. 8). the Uruguay River flooded area for a 100-year return period
The methodological approach and resulting flood hazard (Tr = 100 years), obtained from the proposed model, also in-
map highlighted flood-prone areas throughout the municipal- dicating flood-prone areas. This return period shows the same
ity of Itaqui that have the potential of being exposed to flood- flood pattern that occurred in July 1983 when Itaqui suf-
ing events, inflicting suffering on the population and substan- fered its worst historical flood (altimetric level = 57.24 m).
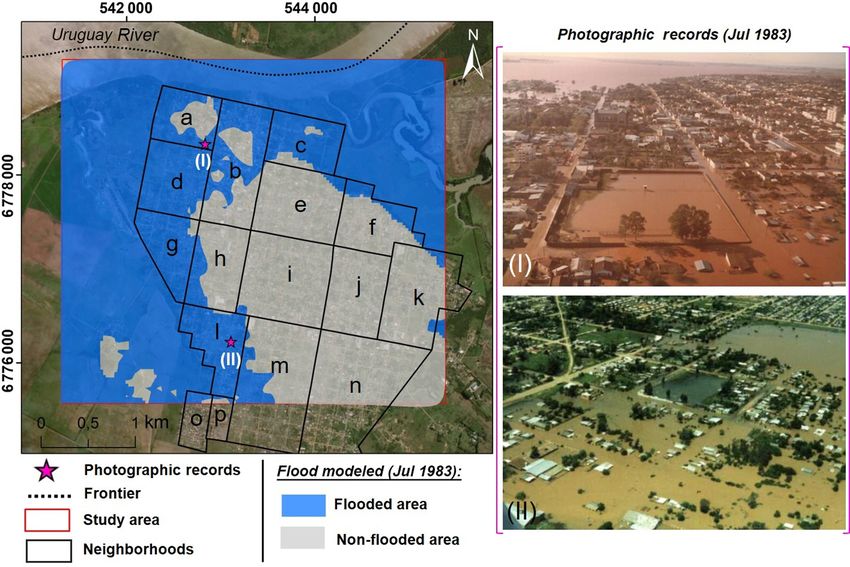
tial material damage. Figure 9 illustrated the boundaries of According to Saueressig and Robaina (2015), the water level
www.nat-hazards-earth-syst-sci.net/19/237/2019/ Nat. Hazards Earth Syst. Sci., 19, 237–250, 2019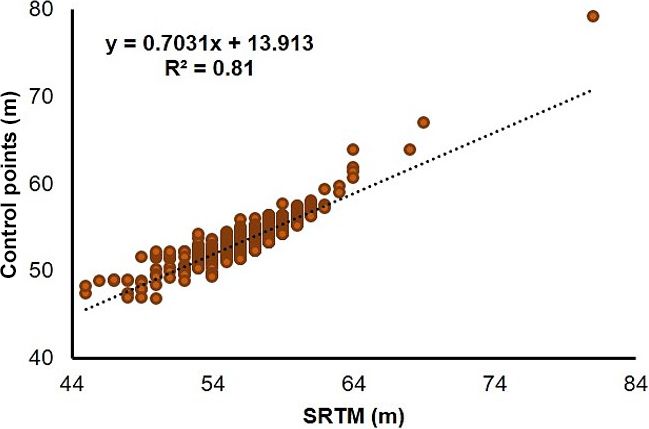
246     P. V. N. Araújo et al.: Delimitation of flood areas based on a calibrated DEM and geoprocessing: Uruguay River

Figure 9. The worst historical flooding of the Uruguay River basin (July 1983) has been used here as a base for a simulated flood event
in Itaqui. Neighborhoods: (a) Cerrinho Dois Umbus; (b) Centro; (c) Ponte Seca; (d) Várzea; (e) Cidade Alta; (f) Cohab; (g) Enio Sayago;
(h) Estacao; (i) Capelinha; (j) Dr. Ayub; (k) Jose da Luz; (l) Vinte e Quatro de Maio; (m) Chacara; (n) Cafifas; (o) Vila Nova; and (p) Uniao.
Photographic records: (I) the courtyard of the prison of Itaqui (Flores and Flores, 1983; Saueressig e Robaina, 2015); (II) the neighborhood
of Vinte e Quatro de Maio (Boeira, 1983; Saueressig, 2012).

reached the Marechal Deodoro Square, the courtyard of the                ning. In practice, the methodological strategy and the result-
Itaqui prison (Fig. 9), and most of the neighborhoods bor-               ing models presented in this study can be used for the opera-
dered by the Olaria stream.                                              tional real-time phase of flood monitoring during seasonal
   Geoprocessing techniques were successfully used to visu-              flood events in the Uruguay River basin. Such a method-
alize the extent of flooding and also to produce a significant           ological approach based on control by the local civil defense
improvement in forecasting flood hazard maps, but can be                 will allow residents to be evacuated from the areas that will
also employed to establish a decision-based support system               be affected. Thus, the communities who reside in “volantes
through a partnership between scientists, territorial planners,          houses” can be moved to places further from the flood haz-
and policy makers (Wiles and Levine, 2002; Sole et al., 2007;            ard area, and those who reside in masonry houses can be re-
Korah and López, 2015; Demir and Kisi, 2016; Sahoo and                   moved and sheltered, in addition to reducing damage costs
Sreeja, 2017). The hybrid color composite RGBI-765NDWI                   by minimizing losses of belongings.
also highlighted suspended sediment in the water column of
the Uruguay River and its tributaries. The result is a scene
with intrinsic differences in water color with regard to water           6    Conclusions
quality and it therefore benefits from precise demarcation be-
                                                                         A large part of the city of Itaqui is in floodplain area of the
tween the inundated and relatively dry areas, i.e., “flooded”
                                                                         Uruguay River, as are many of the riverside cities of the study
and “non-floodable” classes, respectively. Comparison be-
                                                                         area (Saueressig, 2012). The floods in these regions are inti-
tween the flood simulation model for the 12 June 2017 an-
                                                                         mately linked to the rise of the river level. Therefore, in the
nual maximum level record and the CBERS-4 MUX satellite
                                                                         case under study, the river level altimetry is the main driver
image for the same date showed that similar spatial behav-
                                                                         of the flood hazard.
ior was verified in both flooded areas (Fig. 10). A similitude
                                                                            Flood hazard maps are crucial for planning and interven-
is prominent between the result of the flood modeling and
                                                                         tion in flood-prone areas. The results of the Itaqui case study
the real flooded area based only on visual analysis (Fig. 10a
                                                                         can mainly be applied to characterizing hazards and sup-
and b, respectively).
                                                                         porting the implementation of flood risk management plans
   Mukolwe (2016) emphasized that supporting strategies for
                                                                         and flood risk maps for river basins and coastal areas, thus
flood hazard mitigation, or even a sufficient understanding of
                                                                         improving the overall availability of such risk management
the application of their spatial distribution, is a relevant en-
                                                                         tools. An equivalent methodological approach could be help-
terprise for assisting government management and risk plan-
                                                                         ful, for instance, in preparing urban charts to identify ar-

Nat. Hazards Earth Syst. Sci., 19, 237–250, 2019                                   www.nat-hazards-earth-syst-sci.net/19/237/2019/
P. V. N. Araújo et al.: Delimitation of flood areas based on a calibrated DEM and geoprocessing: Uruguay River 247 Figure 10. The 2017 historical flooding of the Uruguay River basin: (a) CBERS-4 MUX satellite image showing the extent of the floods in the Itaqui city area on 12 June 2017 (hybrid color composition: RGBI-765NDWI); and (b) simulated flood event in Itaqui for the same satellite imaging date. Neighborhoods: (a) Cerrinho Dois Umbus; (b) Centro; (c) Ponte Seca; (d) Varzea; (e) Cidade Alta; (f) Cohab; (g) Enio Sayago; (h) Estacao; (i) Capelinha; (j) Dr. Ayub; (k) Jose da Luz; (l) Vinte e Quatro de Maio; (m) Chacara; (n) Cafifas; (o) Vila Nova; and (p) Uniao. Photographic records: (I) the Federal Revenue Customs Building; (II) Osvaldo Aranha street (Silva, 2017); (III) Borges do Canto street (Silva, 2017). eas more suitable to occupation in the municipality. In cases munities. The flood hazard mapping methodology could be where the areas are already occupied, like in some locations particularly useful for regions with a good historic time series of the Itaqui city center, the result could be useful for defin- of fluviometric level gauge data. In general, the most limiting ing and implementing the necessary measures that address factors to be considered for adopting these methodological potentially damaging events. approaches are currently the availability of high-accuracy al- In Brazil, only a few studies involve mapping to assess timetry points, the GCPs, for calibrating the free DEM from potential flood damage. Spatial details of the hazard indica- the SRTM scene in regions impacted by a series of flood tors are a valuable tool for flood risk management since the events. Such a procedure involves a large amount of time, map provides a more direct and fast assessment than other both for the collection of local GCP data and also for post- methods. The methodology and materials applied to Itaqui processing data treatment. However, depending on the geo- proved effective in identifying flood hazard areas using free graphic location, IBGE level references (RRNN) can be used DEM from SRTM images that were calibrated based on a as GCPs. post-processed high-precision GNSS database, historic river This flood hazard mapping in digital format can be used level gauge data, and geoprocessing techniques, as basic in- as a database to assist governmental stakeholders, e.g., civil formation. defense, in partnership with other sectors of civil society It is worth mentioning that the methodological approach for implementation of flood risk management plans that applied to the Itaqui is adequate to be replicated to other mu- are more adaptable to local restrictive environmental con- nicipalities, in particular those of riparian and coastal com- straints. Thus, composing these plans can be more flexible, www.nat-hazards-earth-syst-sci.net/19/237/2019/ Nat. Hazards Earth Syst. Sci., 19, 237–250, 2019
248     P. V. N. Araújo et al.: Delimitation of flood areas based on a calibrated DEM and geoprocessing: Uruguay River

easily modifiable, and updatable in accordance with the dis-            Grande do Sul for providing river level gauge data. We also
tinguishing physiographic and socioeconomic setting of the              thank the reviewers of the Natural Hazards and Earth System
river basin.                                                            Sciences (NHESS) journal for their many insightful comments.
   In this distinct case study, the scenario modeling for the
1983 and 2017 flooding events were compared with a real                 Edited by: Dhruvesh Patel
                                                                        Reviewed by: Caterina Samela and one anonymous referee
flood of 12 June 2017 and high visual similarity was estab-
lished between them. The study area generally covers resi-
dential areas. Considering the results of this case study, it is
crucial to advise the Itaqui policy makers and politicians that
a planned public policy should be implemented to relocate               References
part of the urban population that occupy areas of high flood
hazard. However, the removal process of inhabitants to other            Abreu, R. F., Cunningham, C., Rudorff, C. M., Rudorff, N., Abatan,
areas without hazard, or even less risk, is complex and re-               A. A., Dong, B., Lott, F. C., Tett, S. F. B., and Sparrow, S.
quires a multidisciplinary strategy. It is already known that             N.: Contribution of anthropogenic climate change to April–
the population will suffer historical, social, and cultural im-           May 2017 heavy precipitation over the Uruguay river basin, B.
                                                                          Am. Meteorol. Soc., 12, 1–5, https://doi.org/10.1175/BAMS-D-
pacts that will make the planning more difficult to be entirely
                                                                          18-0102.1, 2018.
applied. Therefore, it is necessary that people have decent             Alaghmand, S., Abdullah, R. B., Abustan, I., and Vosoogh, B.: GIS-
housing, with adequate infrastructure and basic sanitation,               based River Flood Hazard Mapping in Urban Area (A Case Study
reducing their exposure and vulnerability to risk adversity.              in Kayu Ara River Basin, Malaysia), Int. J. Eng. Technol., 2,
Furthermore, it is necessary for communities to understand                488–500, 2010.
the importance of these changes, not only for the population’s          ANA – Agência Nacional de Águas: Conjuntura dos recur-
health but also for the Itaqui economy and sustainability.                sos hídricos no Brasil: regiões hidrográficas brasileiras,
   This paper also demonstrates that well-applied technical               Edição Especial, Brasília-DF, p. 163, available at:
measures based on geotechnologies, such as remote sensing,                http://www.snirh.gov.br/portal/snirh/centrais-de-conteudos/
GIS, and high-accuracy geodesy, give results in return that               conjuntura-dos-recursos-hidricos/regioeshidrograficas2014.pdf
can be very effective in urban and rural management with                  (last access: 10 June 2018), 2015.
                                                                        APFM – Associated Programme on Flood Management: Integrated
low-cost investments, highlighting the unique features of a
                                                                          flood management tools series: Flood Mapping, Issue 20, avail-
given locality, especially floodplains and flat low-lying ar-
                                                                          able at: https://library.wmo.int/pmb_ged/ifmts_20.pdf (last ac-
eas. This methodological approach is very effective for mit-              cess: 11 June 2018), 2013.
igating flooding damage in coastal and riparian areas. It can           Araújo, P. V. N., Amaro, V. E.; Alcoforado, A. V. C., and Santos,
be valuable in reducing strategic monitoring costs and the                A. L. S.: Acurácia Vertical e Calibração de Modelos Digitais de
operational expenses of providing assistance to population                Elevação (MDEs) para a Bacia Hidrográfica Piranhas-Açú, Rio
affected by severe flooding events and their consequences.                Grande do Norte, Brasil, Anuário do Instituto de Geociências –
                                                                          UFRJ, 41, 351–364, https://doi.org/10.11137/2018_1_351_364,
                                                                          2018.
Data availability. All data included in this study are available upon   Arrighi, C., Brugioni, M., Castelli, F., Franceschini, S., and Maz-
request by contacting the corresponding author.                           zanti, B.: Urban micro-scale flood risk estimation with parsi-
                                                                          monious hydraulic modelling and census data, Nat. Hazards
                                                                          Earth Syst. Sci., 13, 1375–1391, https://doi.org/10.5194/nhess-
Author contributions. PVNA, ABL and VEA designed the study;               13-1375-2013, 2013.
ABL and RMS conducted the acquisition of geodetic data;                 Bariani, C. J. M. V. and Bariani, N. M. V.: Distribuição es-
PVNA and VEA conducted the analysis and wrote the paper; all              pacial mensal de variáveis fisicoquímicas em cursos hídricos
authors reviewed this paper.                                              de Itaqui, RS, Geografia Ensino & Pesquisa, 17, 167–181,
                                                                          https://doi.org/10.5902/2236499410780, 2013.
                                                                        Barros, V. R., Doyle, M. E., and Camilloni, I. A.: Precipitation
                                                                          trends in southeastern South America: Relationship with ENSO
Competing interests. The authors declare that they have no conflict
                                                                          phases and with low-level circulation, Theor. Appl. Climatol., 93,
of interest.
                                                                          19–33, https://doi.org/10.1007/s00704-007-0329-x, 2008.
                                                                        BID – Banco Interamericano de Desenvolvimento: Plano Diretor
                                                                          de Desenvolvimento Sustentável da Região da Bacia do Rio
Special issue statement. This article is part of the special issue        Uruguai (Parte Brasileira), Diagnóstico da Região da Bacia
“Flood risk assessment and management”. It is a result of the             Uruguai, Relatório Final do Componente 1, 555 pp., available at:
EGU General Assembly 2018, Vienna, Austria, 8–13 April 2018.              http://www.mpf.mp.br/atuacao-tematica/ccr4/dados-da-atuacao/
                                                                          informes/pdfs/Relatorio_Diagnostico_VersaoFinal.pdf          (last
                                                                          access: 10 June 2018), 2008.
Acknowledgements. The authors express special thanks to the             Boggione, G. A., Pereira, G., Cardozo, F. S., and Fonseca, L. M.
Secretary of Environment and Sustainable Development of Rio               G.: Avaliação de imagens simuladas da câmera MUX do satélite

Nat. Hazards Earth Syst. Sci., 19, 237–250, 2019                                 www.nat-hazards-earth-syst-sci.net/19/237/2019/
P. V. N. Araújo et al.: Delimitation of flood areas based on a calibrated DEM and geoprocessing: Uruguay River 249
CBERS-4 aplicadas à análise ambiental, Bol. Ciênc. Geod., sec. Jensen, J. R.: Sensoriamento Remoto do Ambiente: Uma Per-
Artigos, 20, 590–609, 2014. spectiva em Recursos Terrestres, Tradução da Segunda Edição,
Chen, J., Hill, A. A., and Urbano, L. D.: A GIS-based Parêntese Editora, São José dos Campos, 598 pp., 2009.
model for urban flood inundation, J. Hydrol., 373, 184–192, Jongman, B.: Effective adaptation to rising flood risk, Nat.
https://doi.org/10.1016/j.jhydrol.2009.04.021, 2009. Commun., 9, 1986, https://doi.org/10.1038/s41467-018-04396-
Cook, A. and Merwade, V.: Effect of topographic data, 1, 2018.
geometric configuration and modeling approach on Joshi, P. M, Sherasia, N. K., and Patel, D. P.: Urban flood mapping
flood inundation mapping, J. Hydrol., 377, 131–142, by geospatial technique a case study of Surat City, IOSR J. Eng.,
https://doi.org/10.1016/j.jhydrol.2009.08.015, 2009. 2, 43–51, 2012.
Costa, S. B. and Lourenço, R. W.: Geoprocessing applied to the Kendall, M. G.: Rank Correlation Methods, Charles Griffin, Lon-
assessment of environmental noise: a case study in the city of don, 1975.
Sorocaba, São Paulo, Brazil, Environ. Monit. Assess., 172, 329– Komi, K., Neal, J., Trigg, M. A., and Diekkrüger, B.: Modelling of
337, https://doi.org/10.1007/s10661-010-1337-3, 2011. flood hazard extent in data sparse areas: a casestudy of the Oti
Demir, V. and Kisi, O.: Flood Hazard Mapping by Us- River basin, West Africa, J. Hydrol.: Reg. Stud., 10, 122–132,
ing Geographic Information System and Hydraulic Model: https://doi.org/10.1016/j.ejrh.2017.03.001, 2017.
Mert River, Samsun, Turkey, Adv. Meteorol., 2016, 4891015, Korah, P. I. and López, F. M. J.: Mapping Flood Vulnerable Areas
https://doi.org/10.1155/2016/4891015, 2016. in Quetzaltenango, Guatemala using GIS, J. Environ. Earth Sci.,
Dhiman, R., VishnuRadhan, R., Eldho, T. I., and Inamdar, A.: Flood 5, 132–142, 2015.
risk and adaptation in Indian coastal cities: recent scenarios, Liu, W. and Yamazaki, F.: Review article: Detection of inunda-
Appl. Water Sci., 9, 1–16, https://doi.org/10.1007/s13201-018- tion areas due to the 2015 Kanto and Tohoku torrential rain in
0881-9, 2019. Japan based on multi-temporal ALOS-2 imagery, Nat. Hazards
EB – Exército Brasileiro: 1◦ Regimento de Cavalaria Mecanizado, Earth Syst. Sci., 18, 1905–1918, https://doi.org/10.5194/nhess-
Seção de Comunicação Social, Apoio as famílias atingidas pela 18-1905-2018, 2018.
enchente, 2017. Mann, H. B.: Nonparametric tests against trend, Econometrica, 13,
Elnazer, A. A., Salman, S. A., and Asmoay, A. S.: Flash 245–259, https://doi.org/10.2307/1907187, 1945.
flood hazard affected Ras Gharib city, Red Sea, Egypt: a McCuen, R. H.: Hydrologic Analysis and Design, 2nd Edn., Pren-
proposed flash flood channel, Nat. Hazards, 89, 1389–1400, tice Hall, Upper Saddle River, NJ, 1998.
https://doi.org/10.1007/s11069-017-3030-0, 2017. McFeeters, S. K.: The use of the normalized differ-
ERDAS – Earth Resource Data Analysis System: ER Mapper: ence water index (ndwi) in the delineation of open
User’s guide, Norcross, GA, USA, 278 pp., 2008. water features, Int. J. Remote Sens., 17, 1425–1432,
ESRI – Environmental Systems Research Institute: ArcGIS Desk- https://doi.org/10.1080/01431169608948714, 1996.
top: Release 10, Redlands, CA, USA, 2011. Mistry, N. J.: Urban Floods: Case Study of Surat, Disast. Dev., 3,
Forkuor, G. and Maathuis, B.: Comparison of SRTM and ASTER 139–161, 2009.
Derived Digital Elevation Models over Two Regions in Ghana Mukolwe, M. M.: Flood hazard mapping: uncertainty and its value
– Implications for Hydrological and Environmental Model- in the decision-making process, CRC Press, Balkema, 150 pp.,
ing, in: Studies on Environmental and Applied Geomorphol- 2016.
ogy, edited by: Piacentini, M. and Miccadei, E., IntechOpen, Noman, N. S., Nelson, E. J., and Zundel, A. K.: Review
https://doi.org/10.5772/28951, 2012. of automated floodplain delineation from digital terrain
Gallien, T. W., Kalligeris, N., Delisle, M. P. C., Tang, B. X., Lucey, models, J. Water Resour. Plan. Manage., 127, 394–402,
J. T. D., and Winters, M. A.: Coastal Flood Modeling Chal- https://doi.org/10.1061/(ASCE)0733-9496(2001)127:6(394),
lenges in Defended Urban Backshores, Geosciences, 8, 1–24, 2001.
https://doi.org/10.3390/geosciences8120450, 2018. Ouma, Y. O. and Tateishi, R.: Urban Flood Vulnerability and
Gorokhovich, Y. and Voustianiouk, A.: Accuracy assessment of Risk Mapping Using Integrated Multi-Parametric AHP and GIS:
the processed SRTM-based elevation data by CGIAR using Methodological Overview and Case Study Assessment, Water, 6,
field data from USA and Thailand and its relation to the 1515–1545, https://doi.org/10.3390/w6061515, 2014.
terrain characteristics, Remote Sens. Environ., 104, 409–415, Ovando, A., Tomasella, J., Rodriguez, D. A., Martinez, J.
https://doi.org/10.1016/j.rse.2006.05.012, 2006. M., Siqueira-Junior, J. L., Pinto, G. L. N, Passy, P.,
Gupta, A. K.: Flood Disaster Mitigation and Management: A Syn- and Vauchel, P.: Extreme flood events in the Bolivian
thesis and Key Lessons, Disast. Dev., 3, 163–175, 2009. Amazon wetlands, J. Hydrol.: Reg. Stud., 5, 293–308,
Hengl, T. and Evans, I. S.: Mathematical and digital models of the https://doi.org/10.1016/j.ejrh.2015.11.004, 2016.
land surface, in: Geomorphometry. Concepts, Software, Appli- Pasquini, A. I. and Depetris, P. J.: Discharge trends and flow
cations, edited by: Hengl, T. and Reuter, H. I., Elsevier, 31–64, dynamics of South American rivers draining the southern
https://doi.org/10.1016/S0166-2481(08)00002-0, 2009. Atlantic seaboard: An overview. J. Hydrol., 333, 385–399,
IPCC: Climate Change 2014: Synthesis Report, Contribution of https://doi.org/10.1016/j.jhydrol.2006.09.005, 2007.
Working Groups I, II and III to the Fifth Assessment Report of Patel, D. P., Ramirez, J. A., Srivastava, P. K., Bray, M., and
the Intergovernmental Panel on Climate Change (IPCC), Geneva, Han, D.: Assessment of flood inundation mapping of Surat
Switzerland, 151 pp., 2014. city by coupled 1D/2D hydrodynamic modeling: a case ap-
plication of the new HEC-RAS 5, Nat. Hazards, 89, 93–130,
https://doi.org/10.1007/s11069-017-2956-6, 2017.
www.nat-hazards-earth-syst-sci.net/19/237/2019/ Nat. Hazards Earth Syst. Sci., 19, 237–250, 2019250 P. V. N. Araújo et al.: Delimitation of flood areas based on a calibrated DEM and geoprocessing: Uruguay River R Development Core Team: R: A language and environment for Sinnakaudan, S. K., Ghani, A. A., Ahmad, M. S. S., and Za- statistical computing, R Foundation for Statistical Computing, karia, N. A.: Flood risk mapping for Pari River incorporat- Vienna, Austria, available at: http://www.R-project.org/, last ac- ing sediment transport, Environ. Model. Softw., 18, 119–130, cess: 28 December 2017. https://doi.org/10.1016/S1364-8152(02)00068-3, 2003. Sahoo, S. N. and Sreeja, P.: Development of Flood Inundation Maps Sole, A., Giosa, L., and Copertino, V.: Risk flood areas, a study and Quantification of Flood Risk in an Urban Catchment of case: Basilicata region, WIT T. Ecol. Environ., 104, 213–228, Brahmaputra River, ASCE-ASME J. Risk Uncertain. Eng. Syst. https://doi.org/10.2495/RM070211, 2007. Pt. A, 3, A4015001, https://doi.org/10.1061/AJRUA6.0000822, Speckhann, G. A., Chaffe, P. L. B., Goerl, R. F., Abreu, 2017. J. J., and Flores, J. A. A.: Flood hazard mapping in Sanders, B. F.: Evaluation of on-line DEMs for flood in- Southern Brazil: a combination of flow frequency analy- undation modeling, Adv. Water Resour., 30, 1831–1843, sis and the HAND model, Hydrolog. Sci. J., 63, 87–100, https://doi.org/10.1016/j.advwatres.2007.02.005, 2007. https://doi.org/10.1080/02626667.2017.1409896, 2017. Sarhadi, A., Soltani, S., and Modarres, R.: Probabilistic flood Szypuła, B.: Digital Elevation Models in Geomorphology, in: inundation mapping of ungauged rivers: Linking GIS tech- Hydro-Geomorphology, edited by: Shukla, D. P., IntechOpen, niques and frequency analysis, J. Hydrol., 458–459, 68–86, https://doi.org/10.5772/intechopen.68447, 2017. https://doi.org/10.1016/j.jhydrol.2012.06.039, 2012. Tanguy, M., Chokmani, K., Bernier, M., Poulin, J., and Raymond, Saueressig, S. R.: Zoneamento das áreas de risco a inundação da S.: River flood mapping in urban areas combining Radarsat-2 área urbana de Itaqui-RS, MS Dissertation, Federal University of data and flood return period data, Remote Sens. Environ., 198, Santa Maria, Santa Maria-RS, Brazil, 101 pp., available at: http: 442–459, https://doi.org/10.1016/j.rse.2017.06.042, 2017. //repositorio.ufsm.br/handle/1/9362 (last access: 25 April 2018), Tucci, C. E. M., Clarke, R. T., Collischonn, W., Silva Dias, P. L., 2012. and Oliveira, G. S.: Long-term flow forecasts based on climate Saueressig, S. R. and Robaina, L. E. S.: Zoneamento das Áreas de and hydrologic modeling: Uruguay River basin, Water Resour. Risco a Inundação da Área Urbana de Itaqui (RS), Boletim Gaú- Res., 39, 1181, https://doi.org/10.1029/2003WR002074, 2003. cho de Geografia, 42, 672–687, 2015. Wiles, J. J. and Levine, N. S.: A combined GIS and HEC model Savage, J., Bates, P., Freer, J., Neal, J., and Aronica, G.: The impact for the analysis of the effect of urbanization on flooding: the of scale on probabilistic flood inundation maps using a 2D hy- Swan Creek watershed, Ohio, Environ. Eng. Geosci., 8, 47–61, draulic model with uncertain boundary conditions, in: Vulnera- https://doi.org/10.2113/gseegeosci.8.1.47, 2002. bility, Uncertainty and Risk: quantification, Mitigation, and Man- Yue, S. and Wang, C.: The Mann–Kendall Test Modified by Ef- agement (ICVRAM Proceedings, 13–16 July 2014, Liverpool), fective Sample Size to Detect Trend in Serially Correlated American Society of Civil Engineers, Liverpool, UK, 279–289, Hydrological Series, Water Resour. Manage., 18, 201–218, https://doi.org/10.1061/9780784413609.029, 2014. https://doi.org/10.1023/B:WARM.0000043140.61082.60, 2004. Silva, R. M.: Proposta de metodologia para definição de um mod- Zar, J. H.: Biostatistical Analysis, 5th Edn., Pearson Prentice-Hall, elo digital de elevação para monitoramento de áreas de inun- Upper Saddle River, NJ, 944 pp., 2010. dação, MS Dissertation, Federal University of Pampa, Alegrete- Zhang, W., Yan, Y., Zheng, J., Li, L., Dong, X., and Cai, H.: Tem- RS, Brazil, 145 pp., available at: http://dspace.unipampa.edu.br: poral and spatial variability of annual extreme water level in the 8080/jspui/handle/riu/2198 (last access: 25 April 2018), 2017. Pearl River Delta region, China, Global Planet. Change, 69, 35– Silva, R. M., Moreira, V. S., and Lopes, A. B.: Geodetic method 47, https://doi.org/10.1016/j.gloplacha.2009.07.003, 2009. to obtain a digital elevation model associated to the Brazilian Geodetic System, Int. J. Eng. Tech. Res., 7, 14–17, 2017. Nat. Hazards Earth Syst. Sci., 19, 237–250, 2019 www.nat-hazards-earth-syst-sci.net/19/237/2019/
You can also read