Port of Green Bay Economic Opportunity Study
←
→
Page content transcription
If your browser does not render page correctly, please read the page content below
Port of Green Bay
        Economic Opportunity Study
                                                                                                        Prepared for:
                                                                                                        Brown County Port and
                                                                                                        Resource Recovery Department
                                                                                                        2561 South Broadway
                                                                                                        Green Bay, WI 54304

                                                                                    Prepared by:
                                                                                    Brown County Planning Commission
                                                                                    305 E. Walnut Street, Room 320
                                                                                    PO Box 23600
                                                                                    Green Bay, WI 54305-3600
                                                                                    www.co.brown.wi.us/planning

Funded in part by the Wisconsin Coastal Management Program and the National Oceanic and Atmospheric Administration,
Office of Ocean and Coastal Resource Management under the Coastal Zone Management Act, Grant #AD129611-013.15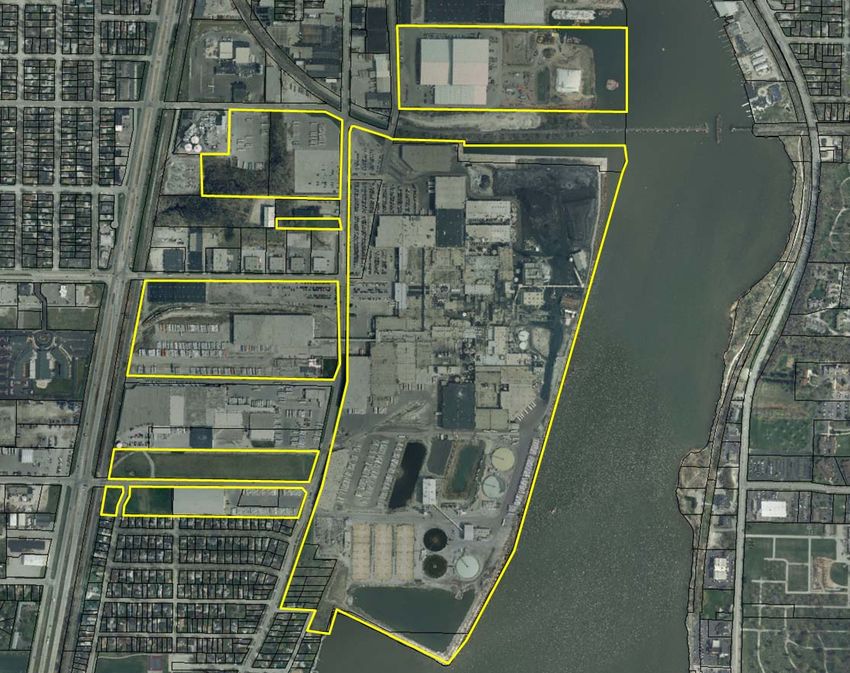
Adopted by the Brown County Harbor Commission on December 9, 2013

Acknowledgements

The Brown County Planning Commission would like to thank the members of the Brown County Harbor
Commission, Dean Haen, Mark Walter, and Jodi Meyer for their assistance in the completion of the 2013
Port of Green Bay Economic Opportunity Study.

Brown County Harbor Commission

Neil McKloskey, Chairman
Ron Antonneau
Craig Dickman
Bernie Erickson
Greg Flisram
John Hanitz
Bryan Hyska
Tom Klimek
Henry Wallace

Brown County Planning Commission Staff

Chuck Lamine, AICP, Planning Director
Cole Runge, Principal Planner
Aaron Schuette, Principal Planner
Peter Schleinz, Senior Planner
Lisa J. Conard, Planner
Dan Teaters, Planner
Jeff DuMez, LIO Coordinator
Jeremy DuChateau, GIS Technician
Lori Williams, Administrative Coordinator
Dorean Sandri, Administrative Secretary

                                                                                                    1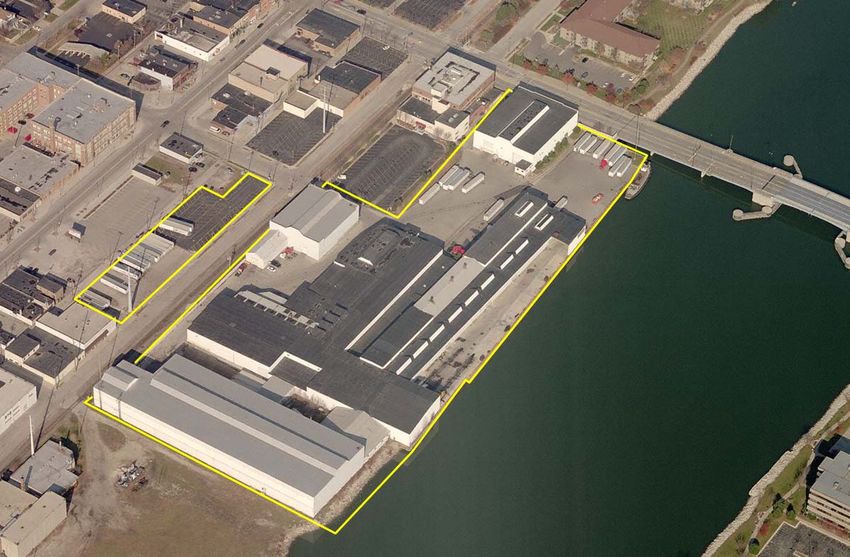
2
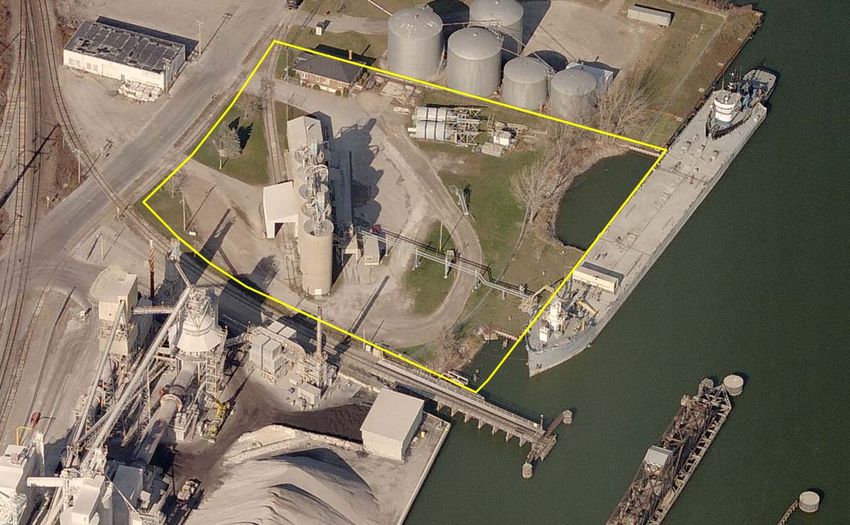
TABLE OF CONTENTS

CHAPTER 1:        INTRODUCTION ...................................................................................................................... 5
CHAPTER 2:        PORT OF GREEN BAY GUIDANCE DOCUMENTS ................................................................... 13
CHAPTER 3:        EXISTING CONDITIONS ......................................................................................................... 17
CHAPTER 4:        PORT DEVELOPMENT ........................................................................................................... 43
CHAPTER 5:        PORT INVESTMENT ANALYSIS .............................................................................................. 61

Figure 1-1:       Total Number of Vessels to Port of Green Bay 2002-2012 .................................................... 7
Figure 1-2:       Total Tonnage of Domestic Imports and Exports................................................................... 8
Figure 1-3:       Total Tonnage of Foreign Imports and Exports...................................................................... 8
Figure 1-4:       Percentages of Domestic Inbound Commodities 2010-2012 ........................................... 9-10
Figure 3-1:       Port Operator Locations ....................................................................................................... 18
Figure 3-2:       Summary of Existing Port Operations and Port-Related Amenities .................................... 35
Figure 3-3:       Lakes Michigan and Huron Average Yearly Low Water Levels ............................................ 40
Figure 3-4:       Lake Michigan Highest Annual Average Percent Ice Cover ................................................. 40
Figure 4-1:       Waterfront Plan Opportunity Areas for Port Development ................................................ 46
Figure 5-1:       Part of 700 Eastman Avenue ................................................................................................ 64
Figure 5-2:       Part of 1601 North Quincy Street ........................................................................................ 65
Figure 5-3:       McDonald Street Properties ................................................................................................ 66
Figure 5-4:       1341 State Street and 130 Ninth Street ............................................................................... 67
Figure 5-5:       239 Arndt Street ................................................................................................................... 68
Figure 5-6:       1611 State Street ................................................................................................................. 69
Figure 5-7:       MARAD Port Kit Outputs ...................................................................................................... 72

APPENDIX A: Detailed MARAD Port Kit Results ......................................................................................... 75

                                                                                                                                                       3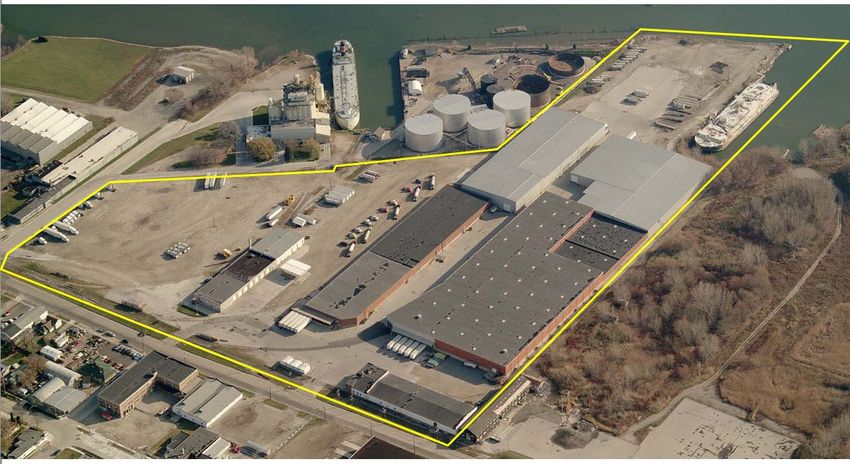
4
CHAPTER 1

                                                            Introduction
Project Description and Purpose

The Port of Green Bay is a
critical component of the
greater Green Bay and
Northeastern         Wisconsin
economy. Over two million
metric tons of commodities,
including coal, limestone,
cement, salt, pig iron, fuel oil,
forest products, and liquid
asphalt valued at more than
$300 million1, moves through
the port every year. Both the
2004       Brown        County
Comprehensive Plan and
2010 Lower Fox River and
Green       Bay      Shoreline
Waterfront Redevelopment
Plan identify expansion of port-related activities as a primary economic development objective.
However, the businesses that utilize the Port of Green Bay for the shipping of goods via the Great Lakes
have generally used all of the readily available land for port operations. Without access to additional
properties, the ability for existing port operators to expand, and new port operators to locate within
close proximity to the navigation channel is severely limited.

Over the past 25 years, the Fox River waterfront has undergone a dramatic change; from one that was
primarily industrial in nature to one that is a mixture of industrial, commercial, residential, and
recreational areas. As a result of this gradual change, the waterfront has become a more dynamic,
defining characteristic of the Green Bay urbanized area, thereby driving up demand for waterfront
property for non-port related activities, further diminishing the amount of available waterfront property
for port-related businesses. In 2010, Brown County developed the Lower Fox River and Green Bay
Waterfront Redevelopment Plan to identify general areas of the waterfront that should continue to be
encouraged to transition from industrial uses to more mixed uses and those that should remain
reserved for industrial activities related to the Port of Green Bay. The waterfront plan identified twelve
distinct “opportunity areas” along the Fox River from the Bay of Green Bay to the De Pere Dam, of which
four were identified that should remain primarily for port-related and/or industrial uses.

The intent of this document is to identify properties within the four port-related and/or industrial use
opportunity areas that if redeveloped for port-related uses would maximize the return on investment

1
    2010 Strategic Plan, Port of Green Bay, p. 6. www.portofgreenbay.com/media/2251/strategic-plan.pdf.
                                                                                                          5
for the Port of Green Bay, Brown County, and Northeastern Wisconsin in terms of compatible land uses,
projected employment, tax revenues, and overall contribution to the economy. The economic impact
information identified by this update for each of the potential sites can then be provided to existing and
prospective port operators when they are looking to expand or locate within proximity to the Port of
Green Bay. Furthermore, the study identifies potential resources for the Port to utilize, including grants
and services, as well as opportunities for the Port to capitalize upon, such as its designation as a Foreign
Trade Zone.

Overview of the Port of Green Bay

Port of Green Bay History

According to the Port of Green Bay2, the history of the Port dates back to the early 1800s when
commerce focused on fur trading and peltry. The first U.S. merchant vessel arrived in 1816 to stock Fort
Howard with garrison troops and provisions. By 1867, the principal products carried by commercial
vessels were lumber, barrels, shingles, wood, railroad ties, and other forest products; however, the 1871
Peshtigo fire dealt a severe setback to these wood-based shipments. Forest products eventually gave
way to flour shipping as wheat became the major agricultural crop. By the late 1800s, Green Bay was
the largest flour shipping port on the Great Lakes. Flour shipping remained strong through the mid-
1930s; however, coal and
petroleum coke became
the           predominant
commodities              as
manufacturing gained a
strong foothold in the
area. In anticipation of
the 1959 opening of the
St. Lawrence Seaway
System which connects
Green Bay to worldwide
markets, Brown County
created the Brown County
Harbor         Commission,
which today oversees the
operations of the Port of Green Bay.

2
    Port Overview, Port of Green Bay. http://www.portofgreenbay.com/business-opportunities/port-overview

                                                                                                           6
Port of Green Bay Today

The Port of Green Bay now includes 15 independent private operators who utilize the Port of Green Bay
to move an average of about two million tons of cargo on an average of about 200 ships each year. Port
businesses handle dry bulk commodities such as coal, limestone, and salt; bulk liquids such as petroleum
products, liquid asphalt, and tallow; breakbulk commodities including wood pulp and forest products;
and oversized cargo including machinery and wind turbine components. The Port maintains a shipping
channel from the entrance light to Grassy Island at a 26 foot depth and 500 foot width, from Grassy
Island to the Mason Street Bridge at a 24 foot depth and 300 foot width, and from the Mason Street
Bridge to the Georgia-Pacific turning basin at a 22 foot depth and 300 foot width.

Over the past ten years, port activity has largely mirrored the national economy, with strong growth in
the early part of the past decade, a sharp decrease in activity at the height of the national recession, and
subsequent slow, intermittent growth. Figure 1-1 depicts the total number of vessels visiting the Port of
Green Bay from 2002 through 2012.

Figure 1-1: Total Number of Vessels to Port of Green Bay 2002-2012

                        250                        234
                                     223                      214
                                            212
                        200                                          182                         188
                                                                            175
    Number of Vessels

                              164                                                                       170
                                                                                   140    142
                        150

                        100

                        50

                         0
                              2002   2003   2004   2005       2006   2007   2008   2009   2010   2011   2012
                                                                     Year

Source: Port of Green Bay Yearly Tonnage Reports, 2002-2012

In addition to the total number of vessels, a similar trend can be seen in total domestic and foreign
shipping through the Port. Figure 1-2 depicts the total inbound and exported domestic goods shipped
through the Port of Green Bay. Figure 1-3 depicts the total imported and exported foreign goods
shipped through the Port of Green Bay.

                                                                                                               7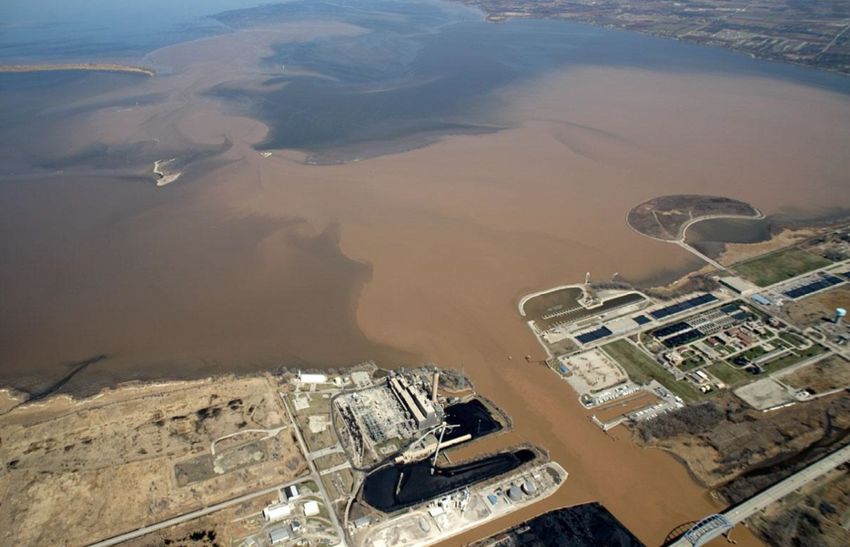
Figure 1-2: Total Tonnage of Domestic Imports and Exports

    Total Tonnage (metric tons)   2,500,000

                                  2,000,000

                                  1,500,000

                                  1,000,000

                                   500,000

                                            0
                                                 2002    2003      2004    2005    2006    2007    2008    2009    2010   2011   2012
                                                                                           Year

                                                               Total Domestic Imports     Total Domestic Exports

Source: Port of Green Bay Yearly Tonnage Reports, 2002-2012

Figure 1-3: Total Tonnage of Foreign Imports and Exports

                                  500,000
    Total Tonnage (metric tons)

                                  400,000

                                  300,000

                                  200,000

                                  100,000

                                        0
                                                2002    2003      2004    2005    2006    2007    2008     2009    2010   2011   2012
                                                                                          Year

                                                                Total Foreign Imports     Total Foreign Exports

Source: Port of Green Bay Yearly Tonnage Reports, 2002-2012

As is depicted in Figure 1-2 and 1-3, the Port of Green Bay has historically been heavily weighted toward
the import of domestic commodities as opposed to the import of foreign commodities or exports of
either. However, over the past three years both domestic and foreign exports of goods, specifically
petroleum products (including ethanol) and pig iron, have increased to become an important
component of the Port’s total tonnage. In recognition of this increase, in 2012 and 2013, the Port of
Green Bay was awarded the prestigious Robert J. Lewis Pacesetter award by the St. Lawrence Seaway
Development Corporation for registering the largest percentage increase (35 percent) in international
export tonnage of all U.S. Great Lakes ports for the year.

                                                                                                                                        8
The types of products moving into the Port of Green Bay on a yearly basis may change significantly
depending on the local, regional, national, and even international economy. Additional fluctuations may
occur due to changing manufacturing processes or products, or in the case of domestic salt imports,
how severe the past winter was. This is evident in Figure 1-4, which compares the total percentages of
domestic inbound commodities which moved into the Port from 2010 - 2012.

Figure 1-4: Total Percentages of Domestic Inbound Commodities 2010-2012

                            3.2%          5.4%
                        1.5%                            15.8%
                                                                        2010
                                                                          Cement
                                                                          Coal
                                                                          Gypsum
                                                                          Limestone
                36.7%
                                                                          Liquid Asphalt
                                                                          Petroleum Coke
                                                                36.9%
                                                                          U.S. Salt

                                   0.6%

                                4.1%   0.3%      2.8%
                         1.0%                           16.7%
                                                                        2011
                                                                          Cement
                                                                          Coal
                                                                          Gypsum
                                                                          Limestone
                38.0%
                                                                          Liquid Asphalt
                                                                          Petroleum Coke
                                                                          Pig Iron
                                                                36.3%
                                                                          U.S. Salt

                                       0.9%

                                                                                                     9
0.8% 5.4%
20.2%
2012
Cement
Coal
38.4%
Limestone
Liquid Asphalt
U.S. Salt
35.2%
Source: Port of Green Bay Yearly Tonnage Reports, 2010-2012
In addition to being a conduit for the importation and exportation of goods via Great Lakes shippers, the
Port of Green Bay operates Foreign Trade Zone #167, which was established in 1990. Within foreign
trade zones (FTZs), foreign and domestic merchandise may be moved into foreign trade zones for
operations not otherwise prohibited by law, generally including storage, exhibition, assembly,
manufacturing, and processing. Within a foreign trade zone (or sub zone) typical customs and border
patrol entry procedures and payments of duties are not required on foreign merchandise unless and
until it exits the Foreign Trade Zone for domestic consumption.
The Port of Green Bay’s Foreign Trade Zone #167 currently consists of a total of 4,001 acres of land,
generally located in Brown and Winnebago Counties. Specific sites within the foreign trade zone
include:
Site 1 (60 acres) – is located at South Point Road and Airport Road, adjacent to Austin Straubel
International Airport in the Village of Ashwaubenon, Brown County.
Site 2 (289 acres) – is in the Oshkosh Southwest Development Park located west of Oakwood
Road, north of STH 91, east of Clairville Road, and south of 20th Avenue in the City of Oshkosh
and Town of Algoma, Winnebago County.
Site 3 (1,654 acres) – is at the Austin Straubel International Airport, located in the Villages of
Ashwaubenon and Hobart, Brown County.
Site 4 (650 acres) - includes the Ashwaubenon Industrial Park and nearby properties, located
generally southwest of the intersection of South Ridge Road and Waube Lane in the Village of
Ashwaubenon in Brown County.
Site 5 (20 acres) – includes the Seven Generations Corporation facility, located west of
Packerland Drive, north of Partnership Drive, east of Commodity Lane, and south of Glory Road
in the Village of Ashwaubenon, Brown County.
10 Site 6 (162 acres) – includes the Oneida Industrial Park located at the intersection of East Adam
Drive and Short Road in the Village of Ashwaubenon, Brown County.
Site 7 (10 acres) – includes the SJ Spanbauer (Fox Valley Technical College) facility bounded by
West 20th Avenue to the north, Oregon Street to the east, West 23rd Avenue to the south, and
Minnesota Street to the west in the City of Oshkosh, Winnebago County.
Site 8 (1,318 acres) – includes Wittman Regional Airport in the City of Oshkosh and the Towns of
Algoma and Nekimi, Winnebago County.
Foreign Trade Zone #167 also includes subzones #167a, #167b, #167c, and #167d. Subzones may be
established by the federal Foreign Trade Zone Board when the board finds that existing zone facilities
cannot serve the specific purpose proposed.
FTZ #167a was established in 1996 and includes the Robin Manufacturing, USA, Inc. small engine
facilities located in Hudson, Wisconsin.
FTZ #167b was established in 1997, expanded in 1999, and includes the Polaris Industries Inc.
small-engine facilities located in Osceola, Wisconsin.
FTZ #167c was established in 1998 and includes the Sargento Foods cheese processing facilities
located in Plymouth, Wisconsin. The federal approval for FTZ #167c subsequently lapsed and is
therefore no longer active.
FTZ #167d was established in 2008 and includes the Marinette Marine Corporation shipbuilding
facilities located in Marinette, Wisconsin.
Utilizing the established FTZ and the existing and future subzones could provide a unique incentive for
businesses to work with the Port of Green Bay. Within Wisconsin, only Milwaukee has an active Foreign
Trade Zone program (Dane County has an established FTZ, but no active users). As Northeastern
Wisconsin’s economy becomes increasingly global in nature, the utilization of the Port’s FTZ designation
can provide a locational advantage to businesses and administration of the FTZ can provide an outside
revenue source for the Port.
Summary
The following chapters of the Port of Green Bay Opportunity Study will provide background on the
various guidance documents the Port uses, as well as the recommendations contained within them.
Furthermore, the document will identify the existing port operators and the opportunities that may exist
for the expansion of port-related uses to benefit the environment and the economy of Northeastern
Wisconsin.
1112
CHAPTER 2

                                    Port of Green Bay Guidance Documents
There are four primary documents that deal directly with the vision and operations of the Port of Green
Bay and/or guide land uses in areas with Port activity. The following section is intended to identify the
specific recommendations contained within those documents in regards to the Port of Green Bay.

Guidance Document Review

Port of Green Bay Strategic Plan

A strategic plan is a guiding document that sets forth specific initiatives
or objectives to make progress toward attaining an overarching vision.
The Port of Green Bay Strategic Plan, last updated in 2010, states as its
overarching vision, “The Port of Green Bay is an integral part of a
healthy Northeastern Wisconsin economy and provides a critical link to
national and global markets for Wisconsin enterprises”3. This vision is
broken down into four separate, but related, strategic themes:

       1. Open Markets – Open markets to Northeast Wisconsin
          enterprises through cost-effective and environmentally-
          conscious transportation. Specific strategic initiatives include the following:

       2. Sustainable Economics – Sustainable economics are creative, market-based decisions that
          strengthen the economy while protecting the environment.

       3. Expand Markets and Revenue – Expand markets and revenue by looking for ways for the Port to
          generate new revenue streams while maintaining existing revenue streams.

       4. World Class Operations – Strive for the Port of Green Bay to be a world-class operation.

Lower Fox River and Green Bay Shoreline Waterfront Redevelopment Plan

The purpose of the Lower Fox River and Green Bay Shoreline Waterfront Redevelopment Plan
(Waterfront Plan) was to identify potential ways the existing diverse waterfront uses and future
waterfront demands can be coordinated and balanced to create a sustainable future for the Lower Fox
River and Green Bay shoreline. The major developments associated with the completion of the plan
were an increased understanding of the competing interests along the waterfront and increased
communication and coordination among the waterfront communities and county.

3
    Port of Green Bay 2010 Strategic Plan. http://www.portofgreenbay.com/media/2251/strategic-plan.pdf. Accessed on December 12, 2012.
                                                                                                                                         13
The Waterfront Plan was completed in December 2010
and identifies twelve distinct “opportunity areas” based
on similar existing land uses. The plan specifically
recommends increasing port activity in the North and
South Bay Port Industrial Areas and the East Shore Paper
Mill Area, which are generally north of the Nitschke
(Main Street) Bridge in Green Bay. The plan also
recommends maintaining existing port activities in the
West Shore Paper Mill Area, except for the coal piles
south of the Mason Street Bridge, which is recommended
for redevelopment consistent with the City of Green Bay
Comprehensive Plan.
Specifically within the West Shore Paper Mill Area, the
plan recommends the relocation of the non-waterfront
dependent Green Bay Drop Forge for port use.
Additionally, the building and site currently being used to
compress sediments from the Fox River’s polychlorinated
biphenyl (PCB) clean-up may be available for port use following completion of the remediation project.
Much of the western end of the North Bay Port Industrial Area is already used by the Port of Green Bay
for the Bay Port Confined Disposal Facility to dewater sediments dredged from the outer harbor. The
eastern end of the North Bay Port Industrial Area includes many existing port-related businesses and
petroleum tank farms, including the 12.6 acre “Bylsby Property”, located at 1445 Bylsby Avenue, which
was recently purchased by the Port of Green Bay. The port is currently improving the property by
bringing in clean fill to ready the site for port-related business development. The port is continuing to
evaluate other properties in this area for purchase as they become available.
The South Bay Port Industrial Area is heavily industrialized and includes a number of active port users,
such as Graymont Lime and Stone, U.S. Venture, and St. Mary’s Cement. There are also a number of
underutilized waterfront and non-waterfront properties within this area, which the plan recommends
should be utilized for port-related uses if/when they become available.
City of Green Bay Comprehensive Plan
The purpose of a comprehensive plan is to set a
vision for how a community is to develop over
typically, a 20-year timeframe. The City of
Green Bay Comprehensive Plan was adopted in
2003, consistent with the direction set forth in
Chapter 66.1001 of the Wisconsin Statutes and
the 14 state-identified “Smart Growth Goals”.
14Specific to the Port of Green Bay, the City of Green Bay Comprehensive Plan recognizes the port as,
“…vital to the local and regional economy and must be maintained.”4 In addition to supporting the
activities of the Port of Green Bay, the comprehensive plan recommends the following: “Concentrate
port activities north of Main Street on the west side of the Fox River and north of the East River on the
east side of the Fox River. Also provide additional land for potential port users by relocating away from
the Fox River land uses that do not depend on the port/river.”5 This is also consistent with the direction
in the aforementioned Waterfront Plan.
Brown County Comprehensive Plan
The Brown County Comprehensive Plan – A Vision for Great
Communities, adopted in October, 2004 was developed to
create a guiding document upon which Brown County bases
land division and shoreland ordinance decisions in
cooperation with the local units of government. Brown
County’s comprehensive plan provides local communities
with examples of tools they can utilize to implement their
local comprehensive plans. Brown County’s future land use
map is a composite of the locally-developed maps, while the
goals, objectives, and policies are intended to be applied
county-wide in partnership with the local municipalities, non-
profit groups, and private sector. A comprehensive plan
provides a 20-year vision for a community based upon public
input, the state comprehensive planning law, and sound
planning and engineering principles. As with the City of
Green Bay Comprehensive Plan, the Brown County
Comprehensive Plan recognizes the Port of Green Bay as a
critical component of Brown County’s and Northeastern Wisconsin’s regional economy.
Recommendations in the Brown County Comprehensive Plan specific to the Port of Green Bay include6:
Increasing the depth of the navigation channel in the Fox River from 24 feet to 26 feet, and the
width from 100 feet to 250 feet.
Seek additional products to export from the area, such as finished foundry products, paper
converting machines, grain, and wood pulp.
Expand the port’s relationship with the area’s rail and trucking companies to receive additional
exportable goods and continue to enable imported materials to be shipped throughout the
region.
Continue to accumulate funds through docking fees and other charges to purchase land that can
be leased to port-related industries in the future.
4
Green Bay Smart Growth 2022, Adopted May of 2003. Volume I page 15-4.
5
Green Bay Smart Growth 2022, Adopted May of 2003. Volume II page 18-30.
6
Brown County Comprehensive Plan, pp. 129-130, adopted October 20, 2004, Brown County Planning Commission.
15 Coordinate land use activities with the City of Green Bay.
Continue to pursue federal and state grants to expand port activities.
The Brown County Planning Commission is currently in the process of updating the Brown County
Comprehensive Plan which will likely be completed in 2015. With regard to the port, it is expected the
plan will focus on opportunities to utilize the Port of Green Bay as a catalyst for economic development
in Northeastern Wisconsin through expanded intermodal transportation options, leveraging the Port’s
Foreign Trade Zone designation, and beneficial reuse of clean dredged material.
Summary
The four primary guiding documents for the Port of Green Bay all recognize the Port as being an integral
component of Northeastern Wisconsin’s economy and provide sound direction for the Port’s future.
There is an understanding that the Port is dependent upon improved waterfront locations for its
activities and therefore is a desire to cooperatively relocate non-waterfront dependent uses to other
locations in favor of Port-related activities. However, the location of new and expanded port uses
should be located within the four opportunity areas identified in the Waterfront Plan, which will not
conflict with the ongoing Downtown Green Bay redevelopment efforts, but will still support port
activities and by extension, the regional economy.
16CHAPTER 3
Existing Conditions
The Port of Green Bay is spread out along the shores of the Fox River from Green Bay south
approximately three miles upstream to the Georgia-Pacific Broadway Mill. Along this three-mile stretch
of river are located 15 private terminal operators that either import or export commodities through the
Port of Green Bay. A map depicting the location of the current (2013) port operators is located in Figure
3-1 and a short description of each follows:
C. Reiss Coal Company – The C. Reiss Coal Company has an improved dockwall and is located on
the west shore of the Fox River, immediately south of the Mason Street Bridge. It is a dry bulk
terminal company with additional facilities located around the Great Lakes Region. The C. Reiss
Coal Company is located on approximately 35 acres of riverfront property and has a 1,400 foot
sheet piling dockwall for the offloading of coal shipped into the Port of Green Bay. There have
been a number of efforts undertaken to relocate the bulk coal piles out of the downtown Green
Bay area, but to date, a site that meets the needs of the company and City has not been
identified.
17Figure 3-1
Port Operator Locations
!
. Bay Port
CDF
Green Bay
Bylsby Great
Property Lakes Wisconsin
Calcium
!
. !
. Public Service
!
.!. Flint Hill
Resources
!
. Fox River
Dock Company Noble
Petro
U.S.
Venture !
.
!
.
Sanimax
!
.!
. St Mary's
Cement
KK Integrated
!
. Graymont
Lime and
Logistics !
. Stone
r
ive
xR
Fo
KK Integrated
Logistics
!
.
C. Reiss
Coal Company
!
.
Lafarge
North
America Construction
!
.! Resource
µ
. Management
!
. RGL
Holdings
!
. Georgia-Pacific
West Mill
0 0.1 0.2 0.4
Miles
Map prepared by the Brown County
Planning Commission staff Construction Resource Management (CRM) – CRM is a captive service provider representing
Payne & Dolan, Zenith Tech, and Northeast Asphalt. CRM is a leader in materials and
construction for the heavy and highway construction business and specializes in the importation
of bulk asphalt. CRM is located on approximately 7 acres on the west shore of the Fox River at
the end of Ninth Street. The property includes a 400’ long slip with a sheet piling dockwall.
19 Flint Hill Resources (FHR) – FHR is a leading producer of fuels, petrochemicals and other
petroleum products such as base oils for lubricants and asphalt. FHR operates an asphalt
terminal near the mouth of the Fox River on approximately 3.5 acres of land. The site is located
immediately south of the Wisconsin Public Service Pulliam Power Plant on the west shore of the
Fox River, where it sells asphalt and polymer-modified asphalt for use in road paving projects in
Northeastern Wisconsin and Upper Michigan. The property includes approximately 990’ of
sheet piling dockwall along the Fox River and adjacent slip.
20 Fox River Dock Company (FRDC) – The Fox River Dock Company imports and distributes dry bulk
coal, salt, gypsum, and pig iron and is located immediately north of the I-43/Leo Frigo Bridge on
27.9 acres of land on the west side of the Fox River. The majority of FRDC cargo arrives for
distribution by Great Lakes vessels. Coal is transferred to trucks, which is then hauled to mills to
power their boilers. Salt is also transferred to trucks for transport to County highway sheds for
use as road salt. In addition to the 27.9 acres of land owned by the Fox River Dock Company,
FRDC has waterfront access to approximately 2,230 feet of improved dockwall along the Fox
River and adjoining slip.
21 Georgia Pacific – Georgia Pacific in Green Bay consists of four paper manufacturing facilities,
including the East Mill at the confluence of the East River with the Fox River and the West Mill at
the southern end of the port. The West Mill, as depicted below, utilizes the Port of Green Bay
for the importation of coal to fire its boilers. The West Mill is located on approximately 197
acres of land on the west side of the Fox River and includes a 1,300’ slip with sheet piling
dockwall along its northerly property boundary, adjacent to the Wisconsin Central rail line. The
remaining 1,540 feet of Georgia-Pacific shoreline largely consists of limestone riprap.
Additionally, the Georgia-Pacific West Mill has a crane pad, modern lighting, and security
measures for ship activity.
22 Great Lakes Calcium (GLC) – GLC provides customized mineral processing for the production of
agricultural products, glass, plastic fillers, coatings, adhesives and sealants, rubber, waste water
treatment, and fuel burning boilers. GLC is located on 10.2 acres of property on Bylsby Avenue
immediately south of the Wisconsin Public Service Pulliam Power Plant on the west side of the
Fox River. GLC has approximately 860’ of frontage on the north side of a sheet-pile slip it shares
with the Fox River Dock Company and Flint Hills Resources
23 KK Integrated Logistics – KK Integrated Logistics is a fully integrated global logistics company
with the ability to truck, rail, barge, ship, and manage inventory from origin to destination. KK
Integrated Logistics is located immediately south of the Walnut Street Bridge on the west side of
the Fox River in downtown Green Bay. ACE Marine rents a portion of the KK Integrated Logistics
site for modular aluminum vessel manufacturing. This 9.8 acre site includes an extensive
warehousing complex and approximately 940’ of sheet piling dockwall. Additionally KK
Integrated Logistics leases the two warehouses immediately north of Leicht Park from Graymont
Lime and Stone
24 Lafarge North America – Lafarge North America is a major supplier of construction materials in
the U.S. and Canada. They produce and sell cement, ready-mixed concrete, gypsum wallboard,
aggregates, asphalt, and related products for use in residential, commercial, and public works
construction projects across North America. The Lafarge property includes approximately 4.6
acres of land on the west side of the Fox River and includes access to an approximately 200’
sheet piling lined slip. The Lafarge property is located toward the southern end of the Port,
immediately north of Construction Resource Management.
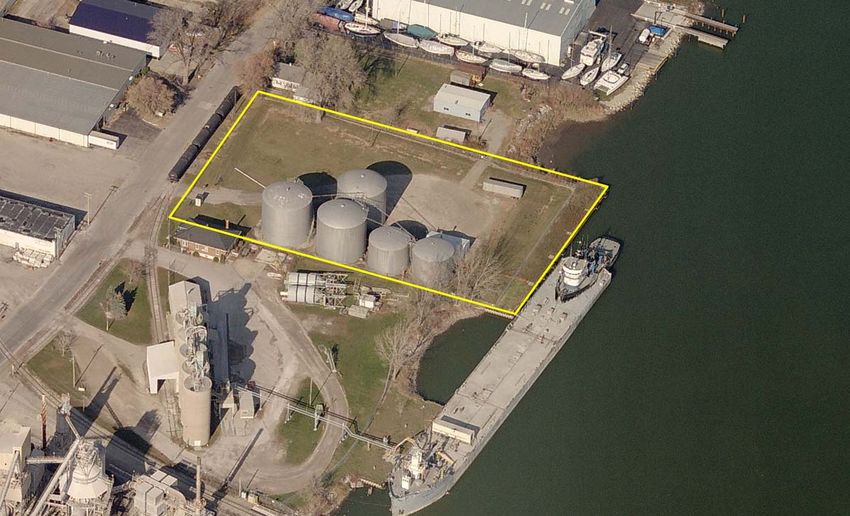
25 Noble Petro, Inc. – Noble Petro, Inc. is a North American commercial supplier and wholesale
distributor of refined petroleum products to wholesalers, utilities, railroads, and cogeneration
plants. Additionally, Noble Petro sells refined products on a truckload basis through various rack
facilities on third-party pipeline systems. Petroleum products are offloaded just south of the
Green Bay Yachting Club and piped to one of the two Noble Petro bulk storage tank properties.
The northern property located between North Quincy Street and Angie Avenue is approximately
20 acres and is approximately 3,400’ east of the Fox River. The southern Noble Petro property is
located immediately south of I-43 and consists of approximately 12 acres of land.
Pipeline
26 RGL Holdings – RGL Holdings represents a family of businesses including Leicht, Checker
Logistics, and RGL Specialty Services. These companies offer integrated material management
services, including expert capabilities in product handling, storage, and transportation
supported by flexible capacity and engineered processes. Its capabilities extend beyond
warehousing and transportation to include supply chain services and “one call distribution” for
customers. The RGL Holdings slip and warehouses total approximately 31 acres of land and are
located on the west bank of the Fox River, adjacent to Lafarge and CRM. The RGL Holdings slip
includes approximately 300’ of sheet piling dockwall.
27 Sanimax – Sanimax collects cooking oils and animal by-products from the food and meat
industries and processes them into useful materials for other industry sectors. Sanimax
generally exports tallow through the Port of Green Bay. The Sanimax terminal is located on 2.1
acres of land, has 240’ of sheet piling dockwall and is located on the west bank of the Fox River,
immediately north of St. Mary’s Cement.
28 St. Mary’s Cement – St. Mary’s Cement is a leading manufacturer of cement and related
construction products in the United States and Canada. For over 90 years, St. Mary’s Cement
has supplied cement-related materials to the Great Lakes Region and is also a significant
producer of concrete and aggregates to the Ontario, Canada market. St. Mary’s Cement has a
three acre site on the west bank of the Fox River with a 130’ sheet piling dockwall, immediately
north of Graymont Lime and Stone.
29 U.S. Venture – The petroleum operations division of U.S. Venture includes bulk petroleum
storage terminals, wholesale and branded distribution of petroleum products, multiple brand
convenience store wholesaling, and gas station-related real estate activities. The U.S. Venture
terminal includes approximately 43 acres of land lying on the east and west sides of N.
Broadway on the west side of the Fox River. The easterly parcel includes bulk petroleum
storage tanks, distribution system for trucking, and a 450’ sheet piling dockwall. The parcel on
the west side of North Broadway includes larger bulk petroleum tanks.
30 Graymont Lime and Stone – Graymont
Lime and Stone imports dry bulk
limestone from quarries in Michigan to
produce high quality calcium pebble
and hydrated lime for industrial and
agricultural uses. Processed calcium
oxide and hydrated lime may then be
shipped throughout the country by rail
and/or truck. The Green Bay Graymont
Lime and Stone plant has a 1,780’ sheet
piling dockwall for receipt of bulk
limestone from self-unloading lake
vessels and totals approximately 20.3
acres. The two warehouses on the
southern part of the property are
leased to KK Warehousing, while the
remaining southern 5.5 acres is
currently leased to the City of Green
Bay for use as an extension of Leicht
Park. The Graymont property is located
on the west bank of the Fox River
immediately south of St. Mary’s
Concrete, and north of Leicht Park.
As the result of a partnership between
the Port of Green Bay, Wisconsin
Department of Transportation, and the
forerunner to Graymont Lime and Stone
(Western Lime) to improve the dockwall
on the site, the Port of Green Bay currently owns an approximately 75’ wide by 1,180’ in length
strip of river frontage between Graymont Lime and Stone and the Fox River. The Port leases this
property back to Graymont for purposes of port access under the terms of a 25 year, 10 month
lease signed in 1994, which expires in February 2020. Following expiration of the lease, the
property will revert back to the ownership of Graymont Lime and Stone, or their assigns.
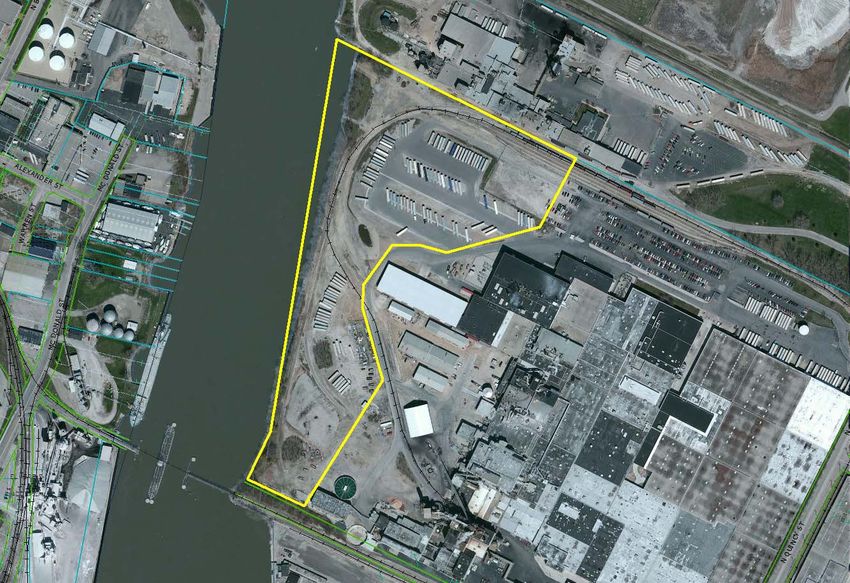
31 Wisconsin Public Service –
Wisconsin Public Service
(WPS) operates the coal-
fired Pulliam Power Plant
on the west side of the
mouth of the Fox River
and bay shore. Although
coal is currently delivered
to the power plant via rail,
WPS has had coal
delivered via Great Lakes
vessels in the past. The
approximately 225 acre
WPS property includes the
power plant, bulk coal
storage, rail access, and
an approximately 690’
long slip lined with sheet
pile dockwall on all sides.
Additionally, WPS owned
property includes much of
the Atkinson Marsh area
between Hurlbut Street
and the west bay shore.
Port of Green Bay Owned Property
In addition to serving as the manager of the Port of Green Bay, the Brown County Port and
Resource Recovery Department also owns property for the storing of channel dredgings and
properties deemed to be advantageous for the future growth and development of the Port of
Green Bay.
o Bay Port Property – The Bay Port Property located near the northern end of Military Avenue
and along the western bay shore is utilized as an engineered confined disposal facility (CDF)
for the dewatering and storage of outer harbor dredgings. The property totals
approximately 200 acres of land, including the areas actively used as a CDF and potential
future expansion cells.
32The Port of Green Bay is currently working with the Wisconsin Department of
Transportation and other public and private partners to identify “beneficial reuse”
possibilities for clean dredge materials from the outer ship channel. Additional clean dredge
materials are being used to rebuild the Cat Island Chain of Islands. Based on the utilization
of these materials for the Cat Island restoration and other beneficial reuse activities, it is
generally expected that the Bay Port CDF will have capacity to function well into the future.
33o Bylsby Property – The Bylsby Property is a 12.6 acre site located west of the Fox River Dock
Company and Great Lakes Calcium across Bylsby Avenue. The property formerly was the
site of a small bulk petroleum product tank farm and other buildings, which except for a
warehouse, have been removed. The Port of Green Bay is currently leasing a portion of the
land to Greenwood Energy and Great Lakes Calcium for bulk commodity storage.
34Figure 3-2: Summary of Existing Port Operators and Port-Related Amenities
Property Primary Acreage Slip Dockwall Rail Access
Product(s)
C. Reiss Coal Coal 35.0 acres No 1,400’ Yes
Company
Construction Asphalt 7.0 acres 400’ In slip Yes
Resource
Management
(CRM)
Flint Hill Petroleum 3.5 acres 990’ In slip and 120’ Yes
Resources along Fox River.
(FHR)
Fox River Dock Coal and salt 27.9 acres 2,230’ In slip and 660’ Yes
Company along Fox River
Georgia-Pacific Coal 197.0 acres 1,300’ In slip Yes
West Mill
Graymont Lime Bulk 25.8 acres No 1,780’ Yes
and Stone limestone
Great Lakes Customized 7.8 acres 860’ In slip Yes
Calcium (GLC) mineral
processing
KK Integrated Construction 9.8 acres No 940’ Yes
Logistics materials
LaFarge North Construction 4.6 acres 200’ In slip Yes
America materials
Noble Petro Petroleum 12.0 acres No No (pipeline) Yes
RGL Holdings Warehousing 31.0 acres 300’ In slip Yes
Sanimax Tallow 2.1 acres No 240’ Yes
St. Mary’s Cement 3.0 acres No 130’ Yes
Cement
U.S. Venture Petroleum 43.0 acres No 450’ No
Wisconsin Coal 225.0 acres 690’ In slip Yes
Public Service
(WPS)
Bay Port Confined 200.0 acres No No No
Property disposal
facility
Bylsby Property Bulk 12.6 acres No No Yes
commodities
35Port Operator Survey
As a component of this study, a survey of the 17 existing port operators was prepared to ascertain their
current and future needs and how the Port of Green Bay can help to facilitate the growth of their
business. The surveys asked the following questions:
Name of the port-related business.
Listing of top three commodities imported or exported through the port.
Whether the port operator foresees an expansion, contraction, or no change of the port-related
business over the next 10 years.
If an expansion is foreseen, will there be a need to increase the amount of land needed for port-
related activities.
How the Port of Green Bay can help facilitate the growth of the port-related business.
Of the 17 port operators, seven responses were received within three weeks of the initial distribution
and follow-up email. Of the seven respondents:
Six indicated no need for additional land, but one anticipated growth within the port operator’s
existing land base.
One indicated a need for additional land to accommodate business growth of approximately
7% - 8% per year.
Four stated that dredging of the Fox River and at a minimum maintaining the shipping channel
depth and width is a primary concern.
One stated that increasing the shipping channel to Seaway draft of 26’-27’ will be needed to
compete with other ports for new opportunities.
One stated a new shipping canal north of Atkinson Drive, northwest of the Fox River would be
beneficial.
One cited government regulations as a reason for closed export markets for their product.
Based on the results of this survey, it is apparent that at a minimum maintaining the current depth of
the shipping channel is critical to the future plans of the responding port operators. Although only one
respondent stated that increasing the depth to Seaway draft would be beneficial, it can be reasonably
assumed that all port operators would benefit from the ability to increase the tonnage of imports or
exports through the Port of Green Bay.
36Environmental Conditions
Except for a few rivers and streams in the southeastern and far eastern parts of Brown County, the
majority of rivers and streams, including major rivers such as the Fox River, East River, Duck Creek, and
the Suamico River all flow into the Bay of Green Bay. Because of past point-source pollution, the Lower
Green Bay and Fox River has been designated as an Area of Concern (AOC) under the United States –
Canada Great Lakes Water Quality Agreement (Annex 2 of the 1987 Protocol). According to the U.S.
Environmental Protection Agency, an AOC is a geographic area within the Great Lakes, “…that fail to
meet the general or specific objectives of the agreement where such failure has caused or is likely to
cause impairment of beneficial use of the area's ability to support aquatic life."7 The causes of
impairment of the Fox River and Lower Green Bay have historically been thought of the result of point
sources of pollution (end of pipe), such as industrial discharges and sewage treatment plants. Although
additional progress remains to be made on point sources, non-point source pollution is now (post Clean
Water Act) recognized as the major contributor to poor surface water quality in the Fox River and Lower
Green Bay.
On May 18, 2012, the U.S. Environmental Protection Agency approved the Total Maximum Daily Load
report (TMDL) for the Lower Fox River extending from the Lake Winnebago outlet through the lower Bay
of Green Bay. A TMDL is required under the Clean Water Act for all 303(d) impaired waters. According
to the TMDL, 63.0 percent of the sources of total phosphorus and 97.6 percent of the total suspended
solids within the Lower Fox River Basin are from non-point sources, such as residential yards, streets,
parking lots, farm fields, and barnyards. Proper management of Brown County’s shoreland zones and
environmentally sensitive areas will be a critical component of reducing total phosphorus and total
suspended solids to attain the goals identified in the TMDL.
The outlet of the Fox River into Green Bay receives the drainage from over 6,300 square miles of urban,
suburban, and agricultural runoff from Central and Northeastern Wisconsin. During the early spring
snowmelt period or immediately following spring and summer rain storms, the effect of nonpoint
sources of pollution becomes very apparent in the Fox River. The water turns dark brown, loaded with
suspended solids which carry excess nutrients and other pollutants from a multitude of nonpoint
sources. The solids are carried into the lower bay and as the water flow slows, the solids drop out of the
water column and are deposited in the river and lower bay. The photo documenting a Fox River
sediment plume was taken in April 2011 and is included in the Brown County Land and Water
Conservation Department 2011 Annual Report and 2012 Work Plan8.
7
http://www.epa.gov/glnpo/aoc/index.html
8
Brown County Land and Water Conservation Department 2011 Annual Report and 2012 Work Plan.
http://www.co.brown.wi.us/i_brown/d/land__water_conservation/2011_annual_report__2012_annual_work_plan.pdf
37The impact to the Port of Green Bay and the port operators from non-point source sedimentation is the
need for continued dredging within the 14-mile maintained shipping channel, slips, and dockwalls. Low
water levels have exacerbated the impact of the deposited sediments from the Fox River and increased
the need for dredging to maintain the authorized depths within the shipping channel. According to the
U.S. Army Corps of Engineers, approximately 180,000 cubic yards of material must be dredged each year
to provide for one-way vessel traffic at the authorized channel depths9. The Army Corps of Engineers
estimates that a loss of between one and two feet of channel depth results in increased transportation
costs of between $467,000 and $1.13 million annually.10
Dredging sediments from the Fox River must be done in a manner that minimizes the disturbance of
sediments contaminated with polychlorinated biphenyls (PCBs). The Fox River is currently undergoing a
massive PCB remediation effort through a combination of hydraulic dredging and capping to minimize
the risk to human health and the environment. Mechanical dredging of the shipping channel and the
hydraulic dredging of the contaminated river sediments are coordinated by the state and federal
oversight agencies to ensure there is little, if any, release of contaminant laden sediment back into the
water column.
One way to reduce the sedimentation of the shipping channel, and the subsequent cost, is to prevent
the soils from entering the waterways in the first place. Brown County has an extensive program in
place to establish vegetated waterways in agricultural fields to significantly reduce suspended solids in
9
U.S. Army Corps of Engineers, Green Bay Harbor, WI Overview page 1.
http://www.lre.usace.army.mil/ETSPubs/HFS/Green%20Bay%20Harbor.pdf.
10
U.S. Army Corps of Engineers, Green Bay Harbor, WI Overview page 2.
http://www.lre.usace.army.mil/ETSPubs/HFS/Green%20Bay%20Harbor.pdf.
38stormwater and the corresponding nutrients from agricultural lands, from entering the ditches, streams,
and rivers that eventually reach the Fox River. The Port of Green Bay should work with the Green Bay
Metropolitan Sewerage District (GBMSD), U.S. Army Corps of Engineers, Wisconsin Department of
Natural Resources, and the Brown County Land and Water Conservation Department to evaluate the
dredging cost savings associated with the quantity of soils currently being prevented from entering the
Fox River through the grassed waterways, and the potential future dredging cost savings should the
grassed waterways be expanded throughout the county and Fox-Wolf Watershed.
Great Lakes Water Levels
Water levels within the Great Lakes have a direct impact on water-borne shipping throughout the
region. When lake levels are high, Great Lakes vessels may carry full loads without fear of scraping
bottom. However, when lake levels are low, the vessels must lighten their loads in order to maintain
adequate draft. The Lake Michigan/Lake Huron basin is currently experiencing historic low water levels,
which is negatively impacting the quantity and therefore the relative efficiency of shipping goods into
and out of the Port of Green Bay.
According to the National Oceanographic and Atmospheric Administration Great Lakes Environmental
Research Laboratory (NOAA-GLERL), in December 2012 and January 2013, the monthly average low
water level in the Lake Michigan/Lake Huron basin (175.57 meters) dropped below the record low
recorded in 1964 (175.58 meters). The yearly low water levels have remained below the long-term
average yearly low water level (176.21 meters) since 1999.11. Figure 3-3 depicts the yearly average low
water levels for the Lakes Michigan and Huron basin since 1918.
11
NOAA-GLERL Water Levels of the Great Lakes, March 2013 brochure. http://www.glerl.noaa.gov/pubs/brochures/lakelevels/lakelevels.pdf.
39Figure 3-3: Lakes Michigan and Huron Average Yearly Low Water Levels
Surface Water Elevation (m) 177.5
177.0
176.5
176.0
175.5
175.0
1918
1921
1924
1927
1930
1933
1936
1939
1942
1945
1948
1951
1954
1957
1960
1963
1966
1969
1972
1975
1978
1981
1984
1987
1990
1993
1996
1999
2002
2005
2008
2011
Year
Long Term Average Low Water Level Yearly Low Water Level
Based on computerized modeling, seasonal outlooks indicate that water levels may continue to set new
record lows into the foreseeable future. According to NOAA-GLERL, the current record-setting low
water levels on Lakes Michigan and Huron are a result of many factors, including the large decrease in
water levels that took place on the upper lakes in the late 1990’s, the cyclical nature of the lake levels,
and increases in lake evaporation due to a lack of winter ice cover on the lakes, among others.
Figure 3-4 depicts the average percent ice cover for Lake Michigan for the years of 1973 through 2012.
In a typical year, the greatest percentage of ice cover occurs in February, which is reflected in the graph.
Figure 3-4: Lake Michigan Highest Annual Average Percent Ice Cover
100
90
80
Percent Ice Cover
70
60
50
40
30
20
10
0
Year
Percent Ice Cover
Source: NOAA-GLERI Great Lakes Water Level Dashboard, Accessed 3/13/2013 http://www.glerl.noaa.gov/data/now/wlevels/dbd/.
40For the Port of Green Bay, it is estimated that each inch of lost water accounts for about 100 tons of
cargo being left behind due to shallower drafts12. As a result of the historic low water levels, dredging
has taken on an even greater importance to ensure adequate draft is available for the Great Lakes
vessels importing and exporting commodities through the Port of Green Bay.
If the ports are not adequately dredged and are eventually closed to shipping, all commodities currently
entering and leaving the port would need to be shipped via rail and truck. According to the U.S. Army
Corps of Engineers, switching the import/export of these commodities from ship to rail and truck due to
closure of the Port of Green Bay would increase annual harmful emission rates by over 4,400 tons of
harmful particulate matter (PM-10), increase costs by $875,000 due to increased railroad related
accidents and $642,000 due to increased trucking related accidents. Furthermore, even the loss of just
one to two feet channel depth would result in increased transportation costs of between $467,000 and
$1.13 million annually.13 In order to ensure the Port’s continued viability, it is critical the shipping
channel continues to be dredged to, at a minimum, its federally authorized depths. This will allow
imports and exports vital to many of northeastern Wisconsin’s industries and municipalities to continue
to be delivered in the most environmentally friendly and economically efficient manner possible.
12
Nathan Phelps, “Low Water Levels Hurt Great Lakes Shippers’ Bottom Line”, Green Bay Press-Gazette, March 29, 2013.
13
U.S. Army Corps of Engineers, Green Bay Harbor, WI Overview, February 2012, pages 1-2.
http://www.lre.usace.army.mil/ETSPubs/HFS/Green%20Bay%20Harbor.pdf.
4142
CHAPTER 4

                                                     Port Development
The Port of Green Bay fills a critical role in the economy of Northeastern Wisconsin by providing an
efficient mode of transportation for the export and import of various commodities. In January 2013 the
Research and Traffic Group, in collaboration with the Chamber of Marine Commerce, the Canadian
Shipowners-Association, the St. Lawrence Seaway Management Corporation, and The Saint Lawrence
Seaway Development Corporation, prepared a report comparing the energy costs and environmental
impacts associated with transport of commodities by Great Lakes vessels, rail, and truck. The report,
Environmental and Social Impacts of Marine Transport in the Great Lakes – St. Lawrence Seaway Region
compares the three modes of transport in 2010 and after proposed “renewal” requirements, which are
expected regulations to improve the energy efficiency and lower the environmental impact of the three
modes of transport.

The report states a Great
Lakes vessel (U.S. Fleet) can
currently (2010) move a ton
of freight approximately
610 miles on one gallon of
fuel.      For comparison,
railroads can move a ton of
freight approximately 550
miles per gallon of fuel and
trucks can move a ton of
freight approximately 88
miles per gallon of fuel.
Post renewal actions, a
Great Lakes vessel (U.S.
Fleet) is projected to move
a ton of freight 887 miles on
one gallon of fuel, as compared to rail at 581 miles per ton per gallon of fuel and truck at 104 miles per
ton per gallon of fuel.14

Similar to the fuel efficiency advantages associated with Great Lakes vessels, under current conditions
greenhouse gas (GHG) emissions are significantly less for Great Lakes vessels than rail or truck.
Compared to the U.S. Great Lakes Fleet carrying one ton of cargo one mile, rail would emit 15% more
GHG and trucks 534% more GHG15. Post-renewal, the disparity in GHG emissions among the three
modes is expected to increase, furthering the advantage of the Great Lakes vessels. According to the

14
   Environmental and Social Impacts of Marine Transport in the Great Lakes-St. Lawrence Seaway Region Executive Summary p.6, Research and
Traffic Group, January 2013.
15
   Environmental and Social Impacts of Marine Transport in the Great Lakes-St. Lawrence Seaway Region Executive Summary p.8, Research and
Traffic Group, January 2013.
                                                                                                                                       43
report, rail and trucks carrying one ton of cargo a distance of one mile is projected to emit 57% and
698% more GHG, respectively as compared to the U.S. Fleet16.
The efficiencies exhibited by the report demonstrate the inherent efficiencies associated with shipping
commodities via Great Lakes vessels and by extension, the Port of Green Bay. The commodities,
whether bulk commodities such as salt, limestone, coal, or fuel oil, or break bulk commodities such as
wood pulp or forest products comprise essential raw material for major employers within Brown County
and the greater Northeastern Wisconsin region. In order for the Port of Green Bay to provide greater
levels of service for businesses to take advantage of these efficiencies, the Port will need to increase the
acreage devoted to port-related land uses.
Ideally for port development, available vacant land would be located adjacent to the Fox River with
improved bulkheads and slips for ships. However, the majorities of lands with these attributes are
already being utilized by port-related businesses or are located in the heart of downtown Green Bay and
are committed to non-port redevelopment. Therefore future growth of the Port will have to occur on
riverfront lands already occupied by other uses or on compatible non-waterfront properties. For
instance, the Port of Green Bay recently purchased the Bylsby property, which although not located
directly on the river, is located in relatively close proximity to the river, which indicates a willingness to
look at properties beyond the river’s edge and be creative in their use for port-related or port-
supportive businesses.
The Lower Fox River and Green Bay Shoreline Waterfront Redevelopment Plan (Waterfront Plan),
adopted in 2010, identified four distinct “opportunity areas” within the study area that should be
utilized for port-related development17:
The North Bay Port Industrial Area
The South Bay Port Industrial Area
The West Shore Paper Mill Area
The East Shore Paper Mill Area
All four of these areas are currently heavily industrialized and encouraging additional port-related
activities within these areas would encourage port expansion while not disrupting the City of Green
Bay’s downtown redevelopment plans. Additional port-related development in these areas could
actually assist downtown redevelopment by bringing additional employment opportunities to residents
located in the downtown and near-downtown neighborhoods.
The Waterfront Plan identifies the following criteria that should be utilized when an existing business is
proposed for relocation to accommodate a port-related business: 18
16
Environmental and Social Impacts of Marine Transport in the Great Lakes-St. Lawrence Seaway Region Executive Summary p.9, Research and
Traffic Group, January 2013.
17
Lower Fox River and Green Bay Shoreline Waterfront Redevelopment Plan, Brown County Planning Commission, December 2010.
http://www.public.applications.co.brown.wi.us/Plan/PlanningFolder/General%20Planning/Lower%20Fox%20River%20and%20Green%20Bay%2
0Shoreline%20Waterfront%20Redevelopment%20Plan%20LowRes.pdf.
18
Lower Fox River and Green Bay Shoreline Waterfront Redevelopment Plan, Brown County Planning Commission, December 2010, pp. 121-
122.
http://www.public.applications.co.brown.wi.us/Plan/PlanningFolder/General%20Planning/Lower%20Fox%20River%20and%20Green%20Bay%2
0Shoreline%20Waterfront%20Redevelopment%20Plan%20LowRes.pdf.
44You can also read