Decision tree-based detection of blowing snow events in the European Alps
←
→
Page content transcription
If your browser does not render page correctly, please read the page content below
Hydrol. Earth Syst. Sci., 25, 3783–3804, 2021
https://doi.org/10.5194/hess-25-3783-2021
© Author(s) 2021. This work is distributed under
the Creative Commons Attribution 4.0 License.

Decision tree-based detection of blowing
snow events in the European Alps
Zhipeng Xie1 , Weiqiang Ma1,4 , Yaoming Ma1,4 , Zeyong Hu2 , Genhou Sun3 , Yizhe Han1,4 , Wei Hu1,4 ,
Rongmingzhu Su1,4 , and Yixi Fan1,4
1 Land–Atmosphere    Interaction and its Climatic Effects Group, State Key Laboratory of Tibetan Plateau Earth System,
Resources and Environment (TPESRE), Institute of Tibetan Plateau Research,
Chinese Academy of Sciences, Beijing 100101, China
2 Key Laboratory of Land Surface Process and Climate Change in Cold and Arid Regions, Northwest Institute of

Eco-Environment and Resources, Chinese Academy of Sciences, Lanzhou, 730000, China
3 School of Atmospheric Sciences, Sun Yat-sen University, 135 Xingang Xi Road, Guangzhou, 510275, China
4 University of Chinese Academy of Sciences, Beijing, 100049, China

Correspondence: Zhipeng Xie (zp_xie@itpcas.ac.cn)

Received: 1 March 2021 – Discussion started: 11 March 2021
Revised: 11 May 2021 – Accepted: 5 June 2021 – Published: 2 July 2021

Abstract. Blowing snow processes are crucial in shaping the      DTM show great ability in detecting blowing snow occur-
strongly heterogeneous spatiotemporal distribution of snow       rence and are superior to commonly used empirical param-
and in regulating subsequent snowpack evolution in moun-         eterizations, specific assessment indicators varied between
tainous terrain. Although empirical formulae and constant        stations and surface conditions. Events for which blowing
threshold wind speeds have been widely used to estimate the      snow and snowfall occurred simultaneously were detected
occurrence of blowing snow in regions with sparse obser-         the most reliably. Although models failed to fully reproduce
vations, the scarcity of in situ observations in mountainous     the high frequency of local blowing snow events, they have
regions contrasts with the demands of models for reliable ob-    been demonstrated to be a promising approach requiring lim-
servations at high spatiotemporal resolution. Therefore, these   ited meteorological variables and have the potential to scale
methods struggle to accurately capture the high local vari-      to multiple stations across different regions.
ability of blowing snow. This study investigated the potential
capability of the decision tree model (DTM) to detect blow-
ing snow in the European Alps. The DTMs were constructed
based on routine meteorological observations (mean wind          1   Introduction
speed, maximum wind speed, air temperature and relative
humidity) and snow measurements (including in situ snow          Wind plays a key role in the snow distribution in moun-
depth observations and satellite-derived products). Twenty       tainous terrain, as it shapes both the spatial heterogene-
repetitions of a random sub-sampling validation test with an     ity of snowfall and the erosion, transport and deposition of
optimal size ratio (0.8) between the training and validation     surface snow via blowing snow processes. In addition to
subsets were applied to train and assess the DTMs. Results       their impacts on the strong spatiotemporal heterogeneity of
show that the maximum wind speed contributes most to the         the surface snow distribution, blowing snow processes also
classification accuracy, and the inclusion of more predictor     have important consequences for the subsequent evolution of
variables improves the overall accuracy. However, the spa-       the snowpack (Déry and Yau, 2002; Leonard and Maksym,
tiotemporal transferability of the DTM might be limited if the   2011) and the surface water and energy budgets (Lenaerts et
divergent distribution of wind speed exists between stations.    al., 2012a; Liston, 2004; Pomeroy and Gray, 1995; Sexstone
Although both the site-specific DTMs and site-independent        et al., 2018). Meanwhile, wind-induced snow transport can
                                                                 also be a major hazard, causing severe reductions to visibil-

Published by Copernicus Publications on behalf of the European Geosciences Union.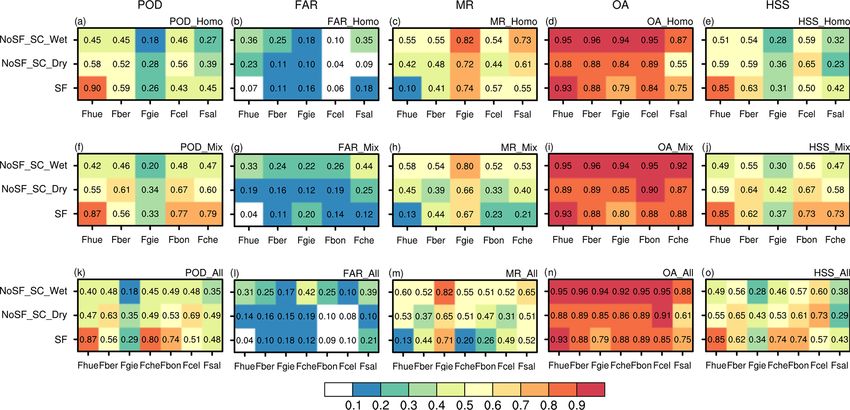
3784                              Z. Xie et al.: Decision tree-based detection of blowing snow events in the European Alps

ity near the ground and triggering snow avalanches (Lehn-          diameter between snow particles, and the particle mean ra-
ing and Fierz, 2008), with the potential for loss of life, prop-   dius (Gallée et al., 2001, 2013; Guyomarc’h and Mérindol,
erty damage, and disruption of transportation. Blowing snow        1998; He and Ohara, 2017; Lehning et al., 2000; Schmidt,
events result in large-scale snow mass divergence or conver-       1980, 1981). These parameterizations are widely used in nu-
gence from open, wind-exposed surfaces to wind-sheltered           merical models to describe wind-driven snow transport pro-
areas such as densely vegetated surfaces and topographic de-       cesses. Rather than being constant, it is widely accepted that
pressions (Essery and Pomeroy, 2004). Micro- and meso-             the threshold wind speed varies with temperature, humid-
scale variability in snow cover and snowmelt strongly influ-       ity, particle size, and deposition time (He and Ohara, 2017).
ences the surface radiation balance, surface discharge, ecol-      Though there are proposed relationships between the thresh-
ogy, and soil freeze/thaw and can be largely attributed to the     old wind speed and meteorological conditions, parameteriza-
spatial heterogeneity of surface snow redistribution caused        tions have only been validated for very limited areas (Gallée
by blowing snow (Liston, 2004; Mott et al., 2018). There-          et al., 2001; Li and Pomeroy, 1997a; Schmidt, 1981), and
fore, wind-driven snow redistribution is widely recognized as      there is no standard method for determining the meteorolog-
driving patterns in snow accumulation and snowpack evolu-          ical conditions under which blowing snow events occur (Li
tion in alpine basins and represents an important interaction      and Pomeroy, 1997b).
between the land and the overlying atmosphere.                        Recent attempts have been made to retrieve blowing snow
   Several specific instruments facilitate direct observation of   occurrences from satellite remote-sensing data (Palm et al.,
blowing snow at the local scale, for example, the mechanical       2011, 2018). Results demonstrate the validity of the remote
traps used by Budd et al. (1966), the optical sensors deployed     retrieval algorithms in detecting the blowing snow events
in the Antarctic and Alps (Snow Particle Counters, SPC; Sato       over the Antarctic, providing insights into the spatial and
et al., 1993; Nishimura and Nemoto, 2005; Vionnet et al.,          temporal variability of blowing snow events independently
2013), and the acoustic sensors (i.e., FlowCapt and SPC)           of modeling approaches. The satellite-based technique pro-
used to provide reliable measurements of blowing snow mass         vides the opportunity to derive blowing snow occurrences
flux (Chritin et al., 1999; Trouvilliez et al., 2015). However,    with wide spatial coverage, but it is hampered by the pres-
direct near-surface blowing snow observations are extremely        ence of clouds and the coarse vertical resolution (Gossart et
sparse in time and space. Alternative methods using empiri-        al., 2017). Moreover, satellite blowing snow detection is as-
cal formulae to parameterize blowing snow occurrence have          sociated with pronounced uncertainty and cannot detect the
been proposed (e.g., He and Ohara, 2017; Li and Pomeroy,           presence of blowing snow events at fine temporal resolution
1997a; Schmidt, 1980). One of the most important param-            (Palm et al., 2011), preventing its widespread application in
eters is the threshold wind speed for snow transport, as it        remote areas outside Antarctica.
determines the occurrence of blowing snow. A blowing snow             Progress has been made in obtaining large spatial-scale
event takes place when the wind exceeds the threshold wind         blowing snow estimates using various multiple data sources,
speed. Previous studies have demonstrated that cohesive re-        such as visual observations (Mahesh et al., 2003), ground-
sistance increases dramatically when snow becomes wet, as          based ceilometer observations (Gossart et al., 2017), and
the meltwater increases the associated cohesion between the        snow depth and simultaneous meteorological observations
particles (e.g., Li and Pomeroy, 1997a; Schmidt, 1980), and        (Guyomarc’h et al., 2019; Guyomarc’h and Mérindol, 1998;
sintering of snow particles has a significant bearing on the       Vionnet et al., 2013). However, direct observations are
cohesive force development as well (He and Ohara, 2017;            scarce, both in time and space. Snow depth measurements
Schmidt, 1980). Therefore, the presence of liquid water and        are more common than visual blowing snow observations
the associated snow metamorphism and aging processes typ-          or ground-based ceilometer observations but are not rou-
ically increase the bond strength in the surface snow layer        tinely included in conventional meteorological observation
(Bromwich, 1988; Li and Pomeroy, 1997a). As summarized             systems. Meanwhile, numerical modeling provides a use-
by Schmidt (1980), the threshold wind speed highly depends         ful tool to estimate blowing snow occurrences but relies not
on the cohesion between snow particles and was greatly in-         only on accurate forcing datasets (e.g., temperature and wind
fluenced by temperature, humidity and deposition time.             speed), but also on knowledge of the surface snow properties,
   The threshold wind speed is important for predicting the        which are difficult to accurately define. This is particularly
initialization of a blowing snow event. Threshold wind speed       notable in mountainous regions such as the Alps, where the
at the height of 10 m was found to be 9.9 m s−1 for wet snow       surface is strongly heterogeneous and environmental condi-
and 7.7 m s−1 for dry snow, and a formula that expresses the       tions are very variable.
threshold wind speed as a function of air temperature has             Whether a blowing snow event occurs or not is an im-
been proposed based on field observations from the Cana-           portant state variable for detailed simulations of blowing
dian Prairies (Li and Pomeroy, 1997a). Moreover, other pa-         snow processes. Standard meteorological instruments (dis-
rameterizations have also been established using the relation-     tinct from specific instruments such as SPC and FlowCapt,
ship between threshold wind speed and the microstructural          which are less commonly deployed) are often used in blow-
properties of surface snow, such as snow density, the bond         ing snow studies. In this study, we use a machine-learning-

Hydrol. Earth Syst. Sci., 25, 3783–3804, 2021                                      https://doi.org/10.5194/hess-25-3783-2021
Z. Xie et al.: Decision tree-based detection of blowing snow events in the European Alps                                             3785

Table 1. List of stations used in this study.

                                Station         Latitude   Longitude   Elevation   Data period
                                                   (◦ N)       (◦ E)      (m)
                                Fmor        45.02965       5.880547      2140      17 Sep 2013–10 Dec 2020
                                Fcmb       45.017311        6.17845      2460      23 Nov 2015–10 Dec 2020
                                Fber       44.949944       6.237082      2390      17 Sep 2013–10 Dec 2020
                                Fhue        45.10188       6.056158      2064      17 Sep 2013–10 Dec 2020
                                Fgie       45.855289       6.525692      1812      2 Jun 2011–10 Dec 2020
                                Fmon        45.30283        6.56593      2280      2 Nov 2013–10 Dec 2020
                                Fche       45.513248        6.95439      2869      16 May 2011–10 Dec 2020
                                Fbon       45.362431        7.05232      2480      16 May 2011–10 Dec 2020
                                Fcel        45.49057        6.40921      1924      16 May 2011–10 Dec 2020
                                Fsal       44.856754       5.952989      1975      16 Jun 2019–12 Dec 2020

based decision tree model (DTM) to detect the presence                    plied to the relative humidity to detect its abnormal change.
of blowing snow by exploiting routine meteorological ob-                  In addition, a threshold check was performed for the hourly
servations (such as wind speed, air temperature, precipita-               measured air temperature, wind speed, and maximum wind
tion and relative humidity) and snow measurements (in situ                speed. For example, data with T outside the range −50 to
snow depth observations and satellite-derived products) from              50 ◦ C or WSMAX greater than 40 m s−1 were considered
10 ISAW stations (http://isaw.ch/, last access: 12 Decem-                 unreliable and were discarded. Periods when both WS and
ber 2020). This study aims to develop a simple but efficient              WSMAX were zero for more than 3 consecutive hours and
tool to detect blowing snow occurrences and to advance our                when non-zero WS remain unchanged for more than 5 h were
understanding of the relationships between blowing snow                   also removed. Since blowing snow fluxes measured by the
processes and ambient meteorological conditions.                          FlowCapt sensors are sensitive to soil particles, false sig-
                                                                          nals are frequently detected; therefore, only data from winter
                                                                          and spring (from November to April) were used, minimizing
2     Data and methods                                                    the uncertainty resulting from this issue. Additional suspi-
                                                                          cious data were discarded when a blowing snow event was
2.1    Data                                                               recorded by the FlowCapt sensor without concurrent snow-
                                                                          fall and in the absence of snow cover or when the positive
Data were obtained from ISAW and include measurements                     air temperature lasted for more than 24 h. In this study, peri-
of blowing snow fluxes and surface meteorological variables.              ods of blowing snow occurrence were identified when posi-
These include mean and maximum wind speed (WS and WS-                     tive blowing snow flux was observed. This is different from
MAX) at 3.5 m height, wind direction (WD), air tempera-                   the work of Trouvilliez et al. (2015), who used a threshold
ture (T ), relative humidity (RH), snow depth (SD), and pre-              of 1 g m−2 s−1 to remove non-significant blowing snow oc-
cipitation about 30 observation stations. The surface meteo-              currences, and the work of Vionnet et al. (2013), who only
rological data are measured at every minute, and hourly aver-             analyzed events of durations longer than 4 h. The presence of
ages are stored. Although the available meteorological vari-              snow on the ground was determined based on the snow depth
ables vary between stations (for example, RH is only avail-               measurements from two snow depth sensors, the MODIS
able at Fmor, Fcmb, Fber, Fhue and Fgie), each ISAW sta-                  daily snow cover product (MOD10A1 and MYD10A1, Hall
tion is equipped with the FlowCapt acoustic sensor (Chritin               and Riggs, 2021) and the CryoLand fractional snow cover
et al., 1999) to measure blowing snow fluxes. In this study,              product over the Alps (http://cryoland.enveo.at, last access:
10 stations that include all the above-mentioned observations             12 December 2020). For detailed procedures, please refer to
were selected (Table 1), of which the Fsal station was used               the schematic flowchart in Fig. 1a.
in the sensitivity test and not used in constructing the DTMs.               As discussed above, internal physical properties of the
This maximizes the number of different dimensions (corre-                 snowpack, such as snow particle bonding, cohesion, and its
sponding to the different observed fields) that can be used               kinetic properties, greatly influence the strength of snow re-
to construct an efficient DTM for identifying blowing snow                sistance, which determines the initiation and persistence of
events.                                                                   blowing snow events (Li and Pomeroy, 1997b; Pomeroy and
   To minimize uncertainty in the classification stemming                 Gray, 1990; Schmidt, 1980). Previous studies have shown a
from the use of poor-quality data, strict data selection criteria         sharp contrast in the threshold wind speed for snow transport
were applied to observations. First, using a threshold value of           between fresh snow and aged snow (Huang et al., 2008; Lis-
50 % change within 1 h, the main change range check was ap-               ton et al., 2007; Xie et al., 2019), owing to the strength of the

https://doi.org/10.5194/hess-25-3783-2021                                              Hydrol. Earth Syst. Sci., 25, 3783–3804, 2021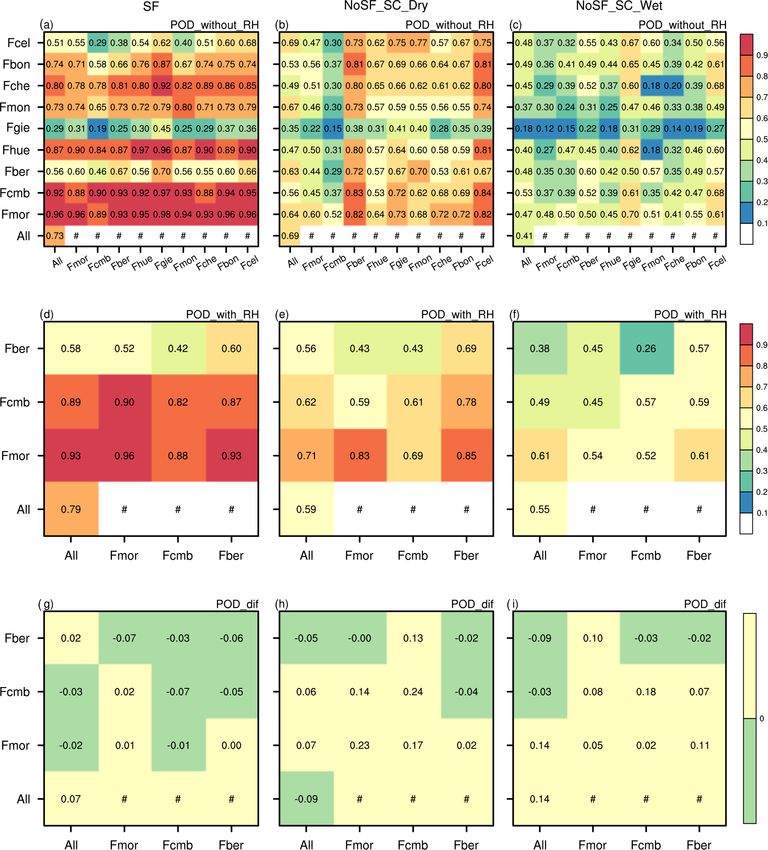
3786 Z. Xie et al.: Decision tree-based detection of blowing snow events in the European Alps
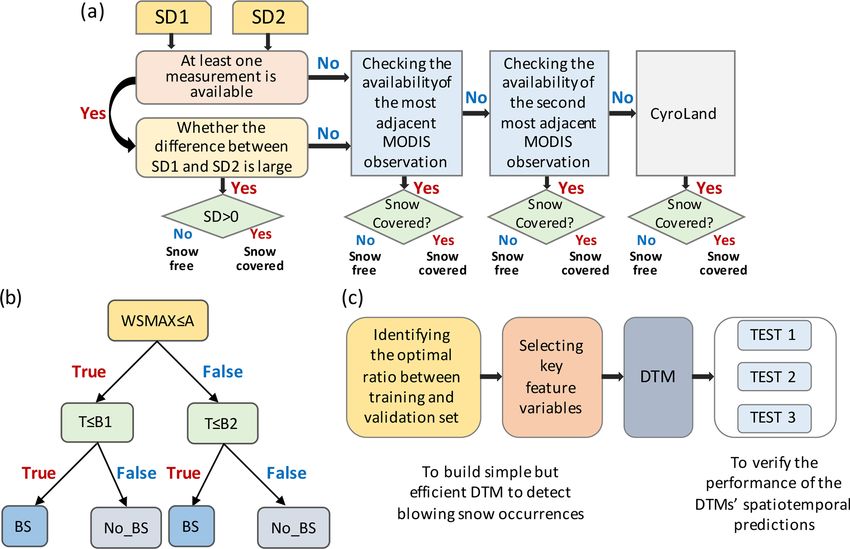
Figure 1. Schematic flowchart of (a) the procedures to identify the presence of snow, (b) flowchart of a simple decision tree model to detect
blowing snow occurrence (only WSMAX and T were used to construct the DTM, A denotes the threshold maximum wind speed, and B1 and
B2 denote the threshold air temperature), and (c) logical framework of this study. BS and No_BS denote with and without blowing snow
occurrence, respectively.
bond between snow particles depending on destructive meta-
morphism, melting, snow loading, and increased compaction
caused by overburden (Li and Pomeroy, 1997a, b; Oleson et
al., 2013). Newly fallen snow particles are characteristically
soft and powdery, with relatively low density, making new
snow particles much more likely to be lifted by the wind. The
occurrence of snowfall within the hourly measurement inter-
val is therefore the primary factor used to distinguish a blow-
ing snow event in the classification samples. Snowfall occurs
when a precipitation greater than 0 coincides with an air tem-
perature ≤ 0 ◦ C. As cohesive resistance increases dramati-
cally once snow becomes wet, there are very considerable
differences in the frequencies of blowing snow occurrence in
dry snow and wet snow (Li and Pomeroy, 1997b). Thus, the
wet/dry snow condition is also used as an attribute in estab-
lishing the classification tree model. Wet snow refers to the
Figure 2. The frequencies of occurrence of the three types of
snow which has either melted or received liquid precipitation
blowing snow at each station and at all stations combined. SF de-
notes snowfall condition and NoSF_SC_DRY denotes surface cov-
since the last snowfall, while dry snow is defined as snow
ered by dry snow without concurrent snowfall condition, and that has not received temperatures of 0 ◦ C or above or liquid
NoSF_SC_WET denotes the surface covered by wet snow without precipitation (Li and Pomeroy, 1997a). To accurately capture
a concurrent snowfall condition. The blowing snow frequency de- the different effects of ambient atmospheric conditions on the
notes the ratio between occurrences of blowing snow for a given occurrence of blowing snow, the quality-controlled data were
atmospheric condition divided by the total number of occurrences categorized into three types: snowfall (SF), surface covered
of this atmospheric condition. by wet snow without concurrent snowfall (NoSF_SC_WET),
and surface covered by dry snow without concurrent snow-
fall (NoSF_SC_DRY). The occurrence frequencies of the
three types of blowing snow at each station and at all stations
Hydrol. Earth Syst. Sci., 25, 3783–3804, 2021 https://doi.org/10.5194/hess-25-3783-2021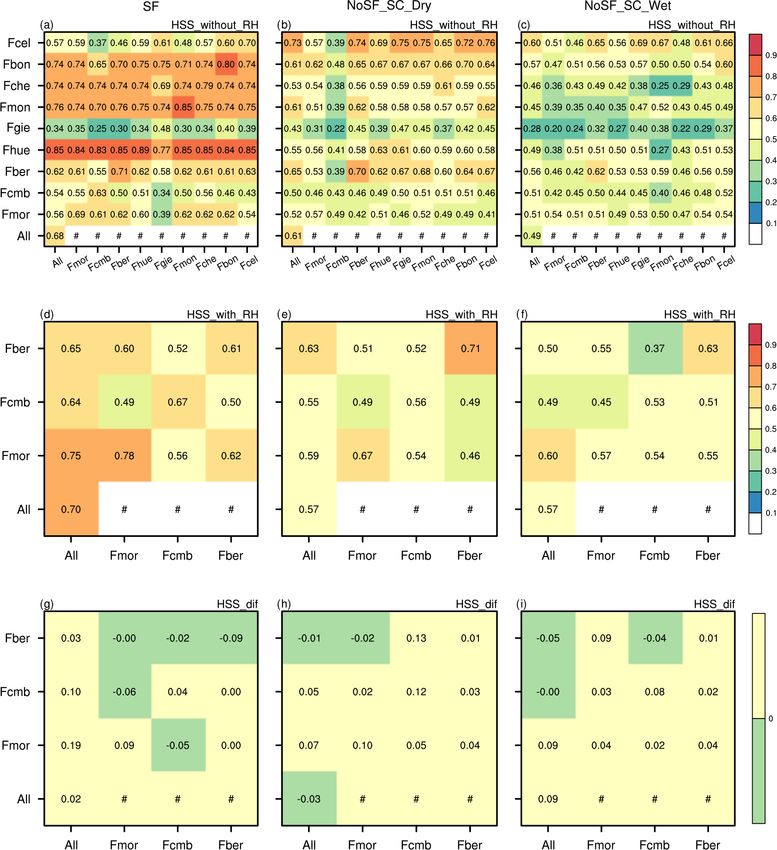
Z. Xie et al.: Decision tree-based detection of blowing snow events in the European Alps                                     3787

combined are shown in Fig. 2. A higher occurrence of blow-            To reduce the classification uncertainty attributable to
ing snow events was detected under the concurrent falling          training data selection, 20 repetitions of a random sub-
snow condition than other conditions.                              sampling validation method were applied (with the optimal
                                                                   ratio between the training and validation sets) in the construc-
2.2   Method                                                       tion of each decision tree model. In each cross-validation, the
                                                                   vast majority of available observations were used for train-
Decision tree analysis uses a machine-learning algorithm to        ing, and the remaining set was used to validate the model.
build a tree-like classification structure and regression model    At the end of the cross-validation, 20 testing probabilities
to identify a set of characteristics that can best differenti-     were created and averaged before the final analysis. The ac-
ate between individual classes based on a categorical fea-         curacy of the model was first calculated by comparing the ac-
ture variable. This method has become increasingly popu-           tual and predicted classifications. The correspondence of pre-
lar in industrial applications and scientific research. It has     dicted and observed blowing snow events was then quantita-
been proven to be a very useful and efficient technique in         tively assessed using the overall accuracy (OA) index, false
processing remote-sensing images (Yang et al., 2017), pre-         alarm rate (FAR), probability of detection (POD), Heidke
dicting natural hazard events (Park and Lee, 2014; Ragettli        skill score (HSS) and missing rate (MR). These evaluation
et al., 2017), and estimating hydro-meteorological variables       metrics are defined from the contingency table of dichoto-
such as winter lake ice (Sharma et al., 2019) and snow depth       mous events in Table 3 and can be written in the form
(Gharaei-Manesh et al., 2016).
   A classification tree is composed of decision nodes that        OA = (a + d)/(a + b + c + d),                               (1)
represent attributes of the samples to be classified, branches     FAR = b/(a + b),                                            (2)
that represent the different possible outcomes of a decision
node, and leaves that represent the possible classification        POD = a/(a + c),                                            (3)
(Fig. 1b shows a simple decision tree model). Building a clas-                     2(ad − bc)
                                                                   HSS =                                 ,                     (4)
sification tree requires two steps: a learning step and a clas-          (a + c)(c + d) + (a + b)(b + d)
sification step. In the learning step, a classification model is   MR = c/(a + c).                                             (5)
developed based on multi-dimensional training data with la-
beled attributes. In this step, the maximum depth of the tree      The overall agreement between estimated and actual blow-
can be used as a control variable for pre-pruning to optimize      ing snow events is captured in OA, which ranges from 0 to 1,
the decision tree. In the classification step, independent data    with 1 representing a perfect classification. The FAR mea-
are used to verify the accuracy of the constructed model.          sures the fraction of forecasted events that did not actually
   In this study, we use the scikit-learn package (Pedregosa et    occur, and the MR denotes the proportion of blowing snow
al., 2011), an open-source Python module for machine learn-        events that actually occurred but were not captured by the
ing, to build DTMs and to identify the occurrence of blowing       DTM model (both range from 0 to 1, with an optimal perfor-
snow events based on routine meteorological observations.          mance of 0), and the POD is the fraction of observed blow-
Information on the construction of the decision tree model is      ing snow events that were correctly identified by the models
detailed in the next section, for instance, the selection of key   (range from 0 to 1, with 1 representing the perfect score).
characteristic variables used to build the tree and identifica-    When one category is dominant, previous studies have re-
tion of the optimal ratio between the training and validation      ported that the OA is not sufficient, as it can be hedged by
sets. We conducted three sensitivity tests to verify the spa-      forecasting common events more frequently (Roebber et al.,
tiotemporal prediction of the established DTMs (Table 2). In       2003; Notarnicola et al., 2013). The HSS accounts for this
Test 1, 80 % of the out-of-bag (OOB) observations from each        bias by characterizing the skill of the compared dataset with
site and all stations were used to construct the site-specific     regards to the no-skill random forecasts. The HSS ranges
decision tree model (SSDTM) and site-independent decision          from −1 to 1, with 1 representing a perfect classification
tree model (SIDTM). This test offers a comprehensive as-           skill, 0 representing a random classification and negative val-
sessment of the decision tree model in identifying the occur-      ues corresponding to a decision tree-based classification that
rence of blowing snow at both temporal and spatial scales. In      is less accurate than a random classification.
Test 2 and Test 3, only five stations were selected to train the
model. The main difference between these two tests lies in
the distribution characteristics of the feature variables among    3     Results
stations; three stations (Fmor, Fcmb and Fmon) were both
                                                                   3.1    Sensitivity to the proportion of training samples
involved in these two tests. Tests 2 and 3 serve as a com-
plementary test for further accuracy assessment of the spa-        Training a model is the first step in making good predictions.
tiotemporal prediction. The logical framework of this study        Splitting the available dataset into a training portion and a
is presented in Fig. 1c.                                           validation portion is therefore necessary to build a solid ba-
                                                                   sis with which to train and test a model. Theoretically, the

https://doi.org/10.5194/hess-25-3783-2021                                          Hydrol. Earth Syst. Sci., 25, 3783–3804, 2021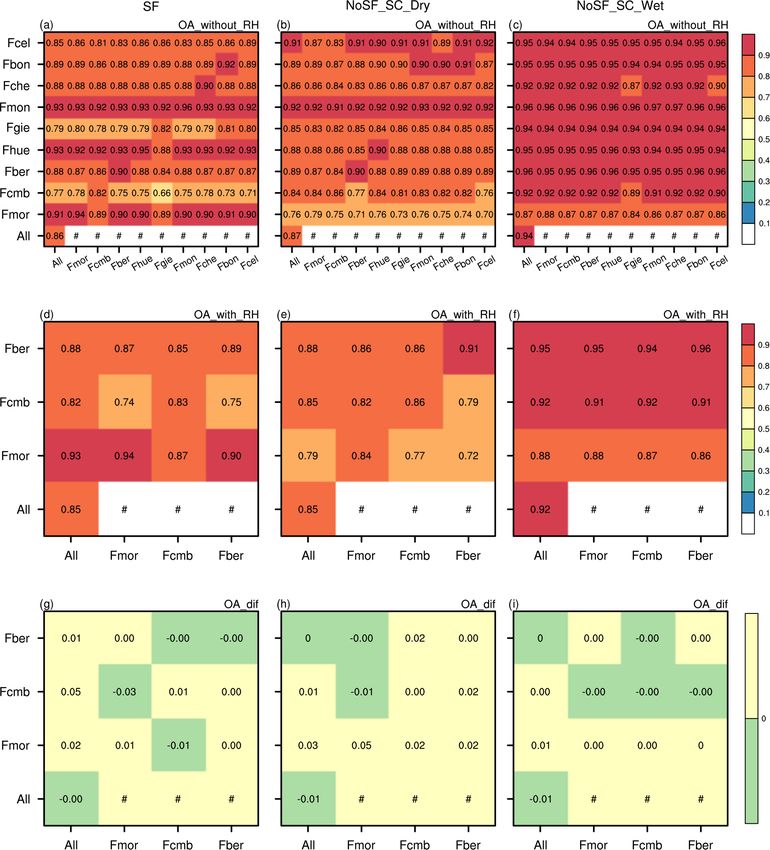
3788                                 Z. Xie et al.: Decision tree-based detection of blowing snow events in the European Alps

Table 2. Summary of three tests conducted to verify the performance of the spatiotemporal prediction of the DTM.

                          Test 1                     Test 2                              Test 3
             Training     80 % of the observations   Observations from five stations     Observations from five stations
                          of each station;           with homogeneous distribution of    with heterogeneous distribution of
                          80 % of the observations   feature variable (Fmor, Fcmb,       feature variable (Fmor, Fcmb,
                          from all stations.         Fmon, Fbon, Fche)                   Fmon, Fsal, Fcel)
             Validation   20 % of the observations   Observations from Fhue, Fber,       Observations from Fhue, Fber,
                          of each station;           Fgie, Fcel, Fsal                    Fgie, Fon, Fche
                          20 % of the observations
                          from all stations.

Table 3. Contingency table for blowing snow events and the corre-     3.2   Sensitivity to the feature variables
sponding indices used for the computation of evaluation metrics.

                                                                      The current decision tree uses a greedy algorithm, mean-
                                       Observed blowing
                                          snow event                  ing that an optimal node construction and attribute combi-
                                                                      nations were selected to build the classification tree model.
                                       Yes      No                    To construct an efficient model capable of being applied
         Estimated blowing     Yes      a        b                    across broad spatial and temporal scales, a major challenge
         snow event            No       c        d                    is to select the fewest number of feature variables to con-
                                                                      struct a model with the highest classification accuracy. Al-
                                                                      though many factors (including land surface characteristics
DTM should be trained on a larger portion of the data to              and ambient meteorological conditions) can influence the oc-
more accurately capture the underlying spread and pattern             currence of a blowing snow event, it is unrealistic to consider
of data. However, real datasets are often imbalanced, with            all factors in the estimation because of the requirement for
random noise; therefore, a certain portion of the validation          spatiotemporal transferability. Therefore, the possible pre-
dataset must be retained to verify the model’s ability to de-         dictor variables used in this study comprise WS, WSMAX,
rive the underlying pattern of observations and to ensure the         T and RH.
reliability of the assessment.                                           To assess the relative importance of each single feature
   Sensitivity tests were conducted and evaluated to confirm          variable and to determine a suitable rule for training sam-
the appropriate ratio between the training subset and valida-         ples, nine combinations of feature variables for each of the
tion subset. Starting with observations from all stations (All),      three conditions (SF, NoSF_SC_WET and NoSF_SC_DRY)
a varying proportion of these stations was retained as the            were selected from each station and all stations (All) to train
training dataset (range from 0.5 to 0.9, at 0.01 increments),         the decision tree model. That is to say, in theory, there will
from which 2400 DTMs were established (here, 2400 =                   be a total of 5400 DTMs trained (9 × 10 × 20 × 3). However,
40×3×20: this represents the 40 training sets from 0.5 to 0.9;        the RH observations are only available at Fmor, Fcmb and
three groups SF, NoSF_SC_DRY and NoSF_SC_WET; and                     Fber stations (RH observations from Fhue and Fgie stations
20 repetitions of the random sampling). As listed in Ta-              were discarded due to their frequent and dramatic fluctua-
ble 4, the overall classification accuracy of these models            tions over short periods); therefore, 4680 DTMs were eventu-
ranged from 0.848 to 0.935, indicating that models predicted          ally obtained. Figure 3 displays the accuracy of these DTMs
the occurrence of blowing snow events very accurately. The            in estimating the blowing snow occurrence in the validation
variation range and standard deviation of overall accuracy            samples. The total score, which is a synthetic demonstra-
changed slightly with decreasing sample size: the accuracy            tion of the 20 random sampling tests of the DTMs, is also
range ranged from 1.06 × 10⁻³ to 7.19 × 10⁻³ , and the stan-          shown in Fig. 3. The total scores are calculated by ranking
dard deviation increased from 2.23×10⁻⁴ to 15.26×10⁻⁴ as              the accuracies of DTMs trained at each station with differ-
sample size decreased. According to the sensitivity analysis,         ent combinations of predictor variables (the model with the
training sample size had a small influence on the classifica-         highest accuracy scores the highest: 9 for All, Fmor, Fcmb
tion accuracy of the DTM. However, because the reliability            and Fber and 7 for the other stations without RH observa-
of the accuracy assessment decreased with decreasing val-             tions). Furthermore, as the mean accuracy was also included,
idation sample size, the training set proportion of 0.8 was           the maximum values of scores are 189 and 140 for stations
recommended in this study.                                            with and without RH observations, respectively. As shown
                                                                      in Fig. 3, even though the same attribute combination was
                                                                      used, model accuracy varied widely not only between sta-

Hydrol. Earth Syst. Sci., 25, 3783–3804, 2021                                           https://doi.org/10.5194/hess-25-3783-2021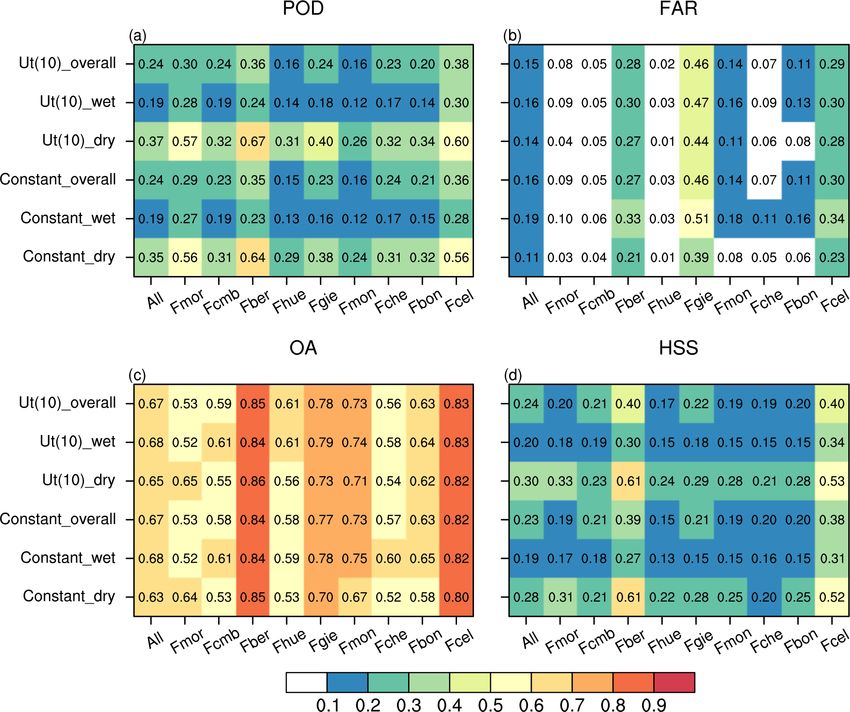
Z. Xie et al.: Decision tree-based detection of blowing snow events in the European Alps 3789
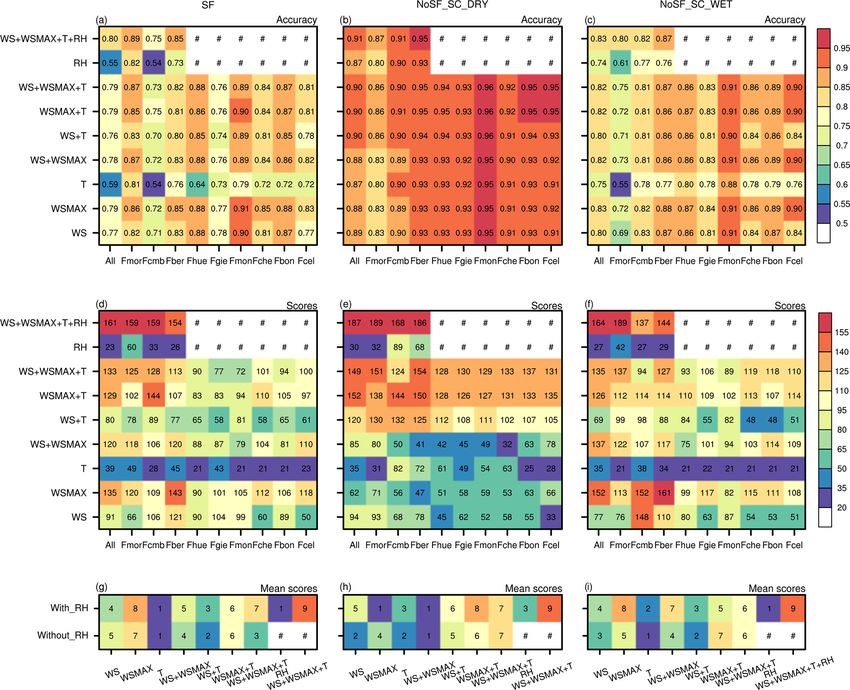
Figure 3. The mean overall accuracy (a–c) and scores (d–f) of the site-independent DTM (All) and the site-specific DTMs trained with
different feature variable combinations in snowfall conditions (SF), dry snow cover conditions (NoSF_SC_DRY) and wet snow cover con-
ditions (NoSF_SC_WET), and the mean scores of models constructed based on feature variable combinations with and without the RH in-
cluded (g–i). The pound sign (#) indicates that the SSDTM was not constructed using RH. WS is mean wind speed; WSMAX is the maximum
wind speed; T is air temperature; RH is relative humidity.
Table 4. Performance statistics of decision tree models constructed under different situations with varied ratios for training and testing
datasets (ranging from 0.5 to 0.9).
Condition∗ Sample Range Standard Max/min Description
size (10−3 ) deviation overall
(10−4 ) accuracy
SF 9251 7.19 15.26 0.855/0.848 Snowfall
NoSF_SC_DRY 74 915 2.26 4.66 0.871/0.869 No snowfall but with
dry snow cover
NoSF_SC_WET 258 872 1.06 2.23 0.935/0.934 No snowfall but with
wet snow cover
∗ The situations are listed based on sample size.
https://doi.org/10.5194/hess-25-3783-2021 Hydrol. Earth Syst. Sci., 25, 3783–3804, 2021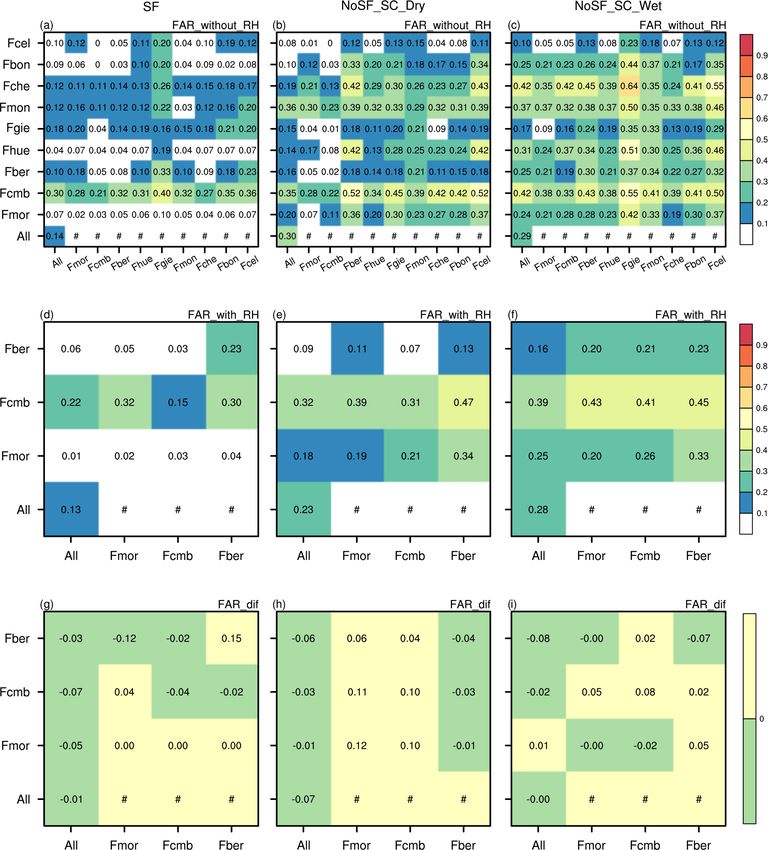
3790                              Z. Xie et al.: Decision tree-based detection of blowing snow events in the European Alps

tions, but also between different snow conditions. Generally,     These results are closely consistent with the mean overall ac-
models presented higher overall accuracies under dry snow         curacy results discussed above, implying that they are repre-
conditions than the other two conditions. Although models         sentative of the mean overall accuracy. Moreover, synthetic
derived for snowfall conditions produced accuracies com-          scores could reveal further information that the averaged ac-
parable with models for the ground surface covered by wet         curacy cannot clearly illustrate. For instance, except for the
snow, the latter were more effective in accurately detecting      models trained with only T or RH, there were no notable dif-
blowing snow occurrence than the former.                          ferences in mean accuracy among the various combinations.
                                                                  However, a substantial divergence of synthetic scores was
3.2.1   Air temperature and relative humidity                     seen among different combinations. In snowfall conditions,
                                                                  WSMAX scored highest at most of the stations, while the
Of all the attribute combinations evaluated, models trained       combination of WS, WSMAX and T ranked highest in the
merely with either T or RH presented the lowest accuracy          other two conditions. When the land surface was covered by
(Fig. 3a–c), indicating that the use of T or RH alone cannot      dry snow, the model scores were greatly increased with the
fully capture the variance in the validation samples. How-        inclusion of T , demonstrating the key role of T in influenc-
ever, significant improvements were achieved when either          ing the blowing snow occurrences. The contribution of T was
WS or WSMAX were accompanied by T or RH, even though              more important to the model accuracy than WS or WAMAX,
the single factors performed poorly when used alone. Taking       as the blowing snow occurrence regime of dry snow is more
Fcmb station in snowfall conditions as an example, model          sensitive to temperature variation than to shear stress (Li and
accuracy increased from 0.54 when the model trained merely        Pomeroy, 1997b). The scores shown in Fig. 3g–i are the inte-
with T to 0.8 or 0.82 when WS or WSMAX was added, re-             grated scores across stations. One noticeable distinction be-
spectively. These results suggest that neither T nor RH is        tween models trained with and without RH inclusion was in
the guarantee of model accuracy, although the model with          the optimal attribute combination. When RH was included in
more predictor variables used generally achieved relatively       the feature variables, the models trained with the combina-
high accuracy.                                                    tion of WS, WSMAX, T and RH yielded the highest score
                                                                  across all conditions, while the optimal combination varied
3.2.2   Mean and maximum wind speed                               with conditions when RH was unavailable. This comparison
                                                                  suggested that redundant information in the combinations
Models trained with a combination that included WAMAX             of WS, WSMAX and T might slightly weaken the efficiency
outperformed the other models, revealing that WSMAX               of the DTM and further demonstrated the importance of WS-
rather than WS contributed the most to the model accuracy,        MAX in constructing an accurate and efficient DTM.
highlighting the importance of WSMAX in constructing a               Finally, models were trained with only WSMAX in snow-
reliable DTM. The result is reasonable, as the fastest wind       fall conditions, while the combination of WS, WSMAX,
speed acts as the primary driving force that allows wind shear    T and RH (if available) was used for further analysis in snow-
stress to overcome snow cohesion, bonding and frictional re-      covered conditions.
sistance (He and Ohara, 2017). Wind transport of snow can
be initiated once the fastest wind speed exceeds the thresh-      3.3   Validation of the SSDTMs and SIDTM
old wind speed, and the blowing snow process can then be
sustained by relatively low wind speeds. In other words, the      In this section, validations were conducted to assess the pre-
fastest wind speed and the mean wind speed control the oc-        dictive performance of DTMs. Similarly to the sensitivity
currence and persistence of blowing snow events, respec-          tests conducted above, 20 DTMs were trained at each sta-
tively. Generally, model accuracy improved as more predic-        tion, based on randomly selected datasets comprising 80 %
tor variables were used. However, strongly correlated feature     of the sample observations. The optimal combinations of
variables might slightly affect the model accuracy; this was      feature variables determined in Sect. 3.2 were used. Each
evident when WS was added to WSMAX in snowfall con-               DTM was evaluated by the remaining 20 % observations at
ditions. Overall, this comparison indicates the superiority of    the corresponding training station and by all available obser-
DTM as a means of blowing snow identification, which is           vations from the other stations. The divergence between the
achieved by making full use of all available feature variables.   SSDTMs and SIDTM was compared for assessing the po-
   The model accuracy analyzed above presents the over-           tential of the DTM to be scaled to multiple stations across
all performance of models in identifying the occurrence of        regions. There were 660 (11 × 20 × 3) and 240 (4 × 20 × 3)
blowing snow. Synthetic scores displayed in Fig. 3d–f show        DTMs in total, trained with and without RH, respectively.
that the attribute combinations including WSMAX generally         The mean OA, FAR, POD and HSS of the 20 random sam-
achieved a higher ranking. Model scores in either wet snow        pling tests are compared and analyzed in this section.
cover or dry snow cover further indicated the need for assim-        According to the results in Fig. 4a–c, either the SSDTMs
ilating more attribute information to improve the classifica-     or the SIDIM exhibited high overall accuracy throughout
tion accuracy of models, particularly in wet snow conditions.     the range of conditions (from 0.66 to 0.96 and 0.72 to 0.96

Hydrol. Earth Syst. Sci., 25, 3783–3804, 2021                                      https://doi.org/10.5194/hess-25-3783-2021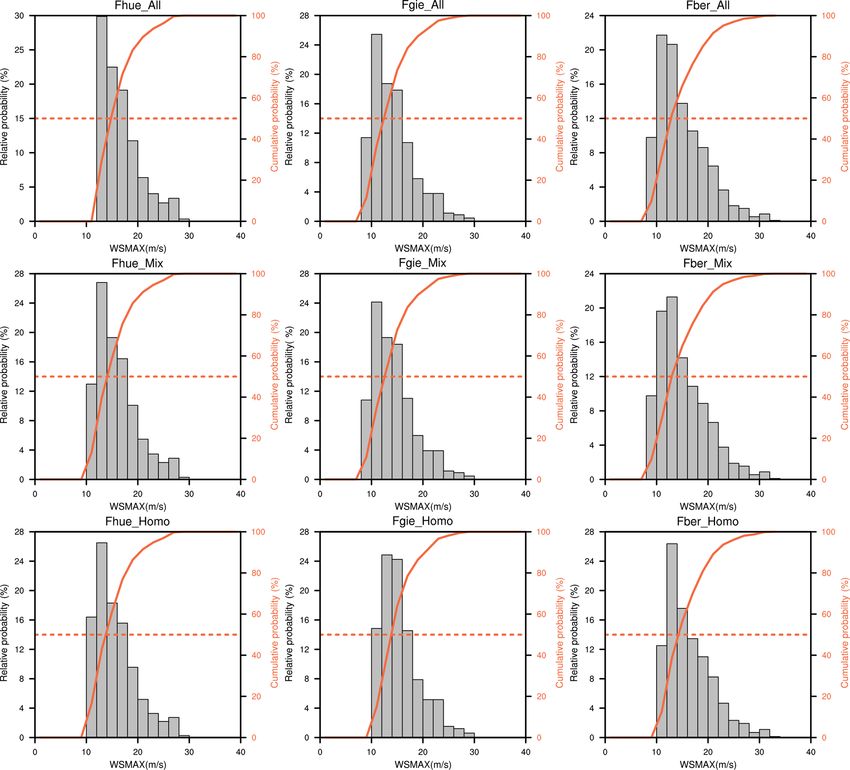
Z. Xie et al.: Decision tree-based detection of blowing snow events in the European Alps                                        3791

Figure 4. The overall accuracy (OA) of the SIDTM and SSDTMs trained without (a–c) and with (d–f) RH, and their difference (g–i) in SF,
No_SF_DRY and No_SF_WET conditions, respectively. The x axis represents the SIDTM and SSDTMs constructed based on 80 % of
corresponding observations, and the y axis represents the validation stations.

for models trained with and without RH considered, respec-           agonal rising up to the right) was not always higher than the
tively). However, there were differences among stations and          accuracy evaluated at other stations, demonstrating the high
conditions. The DTMs trained and evaluated with observa-             ability of DTMs in accurately capturing the blowing snow
tions in wet snow conditions showed the best predictive per-         occurrences outside the training range (both temporal and
formance among three conditions except for the evaluations           spatial). When comparing the overall accuracy between mod-
conducted at Fmor station. Overall classification accuracy at        els trained with and without RH at those stations with RH ob-
stations where SSDIMs were trained (those lying in the di-

https://doi.org/10.5194/hess-25-3783-2021                                          Hydrol. Earth Syst. Sci., 25, 3783–3804, 2021
3792                                Z. Xie et al.: Decision tree-based detection of blowing snow events in the European Alps

Figure 5. The same as Fig. 4 but for the probability of detection (POD).

servations available (Fig. 4d–i), the inclusion of RH is seen              under wet snow conditions. However, there were clear differ-
to increase the performance of DTMs to a certain extent.                   ences for between both the SSDTMs and SIDTM in detecting
   Although OA represents the overall classification skill of              the blowing snow events that occurred at different stations.
the models, POD is an important metric characterizing the                  At Fmor, Fcmb and Fhue stations, all the DTMs showed con-
models’ ability to detect blowing snow events. As shown in                 sistently high skill in accurately identifying the true blowing
Fig. 5, the DTMs constructed under snowfall conditions were                snow events (the POD values were above 0.82), even higher
generally more accurate in detecting blowing snow occur-                   than identifying the blowing snow events that occurred at
rences than the models established under the other two con-                the stations used for training the DTMs. Taking the SSDTM
ditions, and DTMs exhibited the lowest detective capacity                  trained at Fgie station as an example, 98 %, 97 % and 96 %

Hydrol. Earth Syst. Sci., 25, 3783–3804, 2021                                               https://doi.org/10.5194/hess-25-3783-2021
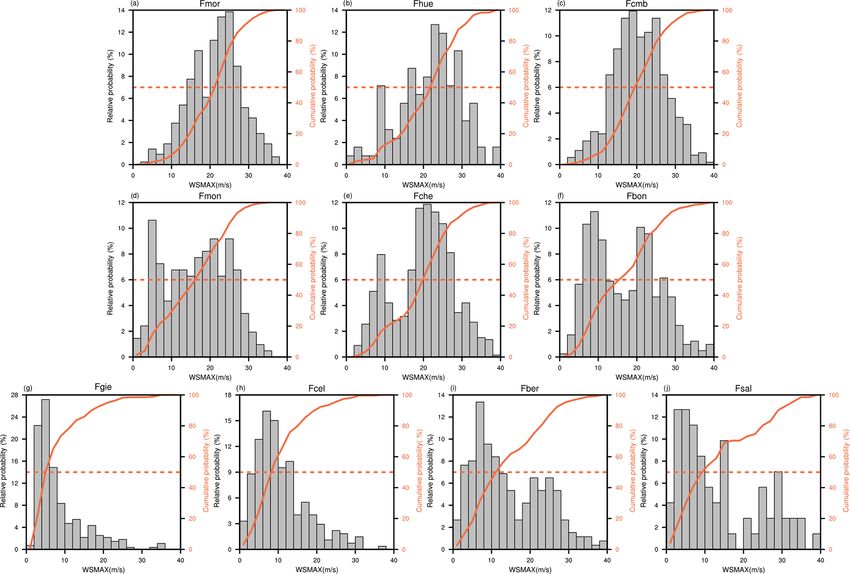
Z. Xie et al.: Decision tree-based detection of blowing snow events in the European Alps                                                3793

Figure 6. The relative probability and cumulative probability of blowing snow occurrences, plotted with the maximum wind speed. The
histogram is the relative probability and the orange solid curve is the cumulative probability, respectively. The orange dash line is the 50 %
cumulative probability.

of blowing snow events were accurately detected at Fmor,                 however, the improvement was more limited and was only
Fcmb and Fhue stations, dropping to 45 % at Fgie station                 achieved in 5 of 13 tests (Fig. 5g).
(Fig. 5a). In snowfall conditions, the POD values dropped                   The relatively low PODs at Fgie, Fcel and Fber stations
sharply when DTMs were evaluated at Fgie and Fcel stations               under snowfall conditions reflect the significantly lower max-
(only up to 45 % and 68 % of blowing snow events occurring               imum wind speeds at these stations when compared with
at Fgie and Fcel stations were accurately identified, respec-            other stations. The relative probability and cumulative prob-
tively). Although these differences narrowed dramatically in             ability of maximum wind speed at each station, with concur-
snow-covered conditions (Fig. 5b and c), the capabilities of             rent blowing snow (Fig. 6), indicate that about 50% of the
both the SSDTMs and SIDTM remain relatively low in de-                   blowing snow events occurred at Fgie, Fcel and Fber stations
tecting the blowing snow events that occurred at Fgie sta-               occurred when maximum wind speed was below 10 m s−1
tion; the performance deteriorated further when the surface              (Fig. 6g–i), demonstrating that most of the blowing snow
was covered by wet snow (only up to 29 % of blowing snow                 events at these three stations were initiated by relatively low
events were detected). The low POD values corresponding to               maximum wind speed; this was much lower than that at other
the high miss rate indicate that blowing snow events occur-              stations (Fig. 6a–f). DTMs trained with higher maximum
ring at Fgie station were seriously underestimated by both the           wind speeds generally choose a larger threshold WSMAX
SSDIMs and the SIDIM. The differences in POD shown in                    for the occurrence of blowing snow, thus resulting in an un-
Fig. 5g–i illustrate that the detective ability can be improved          derestimation of blowing snow events when the models were
when RH serves as a feature variable to train the DTM, as                applied to stations with low maximum wind speed. To verify
was particularly noticeable in snow-covered conditions (with             this speculation, DTMs were assessed at Fsal station, since
maximum increases of 24 % and 18 % for dry snow cover                    relatively low maximum wind speeds were also reported at
and wet snow cover, respectively). For snowfall conditions,              this station. As expected, all the DTMs significantly under-

https://doi.org/10.5194/hess-25-3783-2021                                               Hydrol. Earth Syst. Sci., 25, 3783–3804, 2021
3794                             Z. Xie et al.: Decision tree-based detection of blowing snow events in the European Alps

Figure 7. The POD (a), FAR (b), MR (c), OA (d) and HSS (e) of SIDTM and SSDTMs assessed at Fsal station, where the maximum wind
speed was relatively low (similar to Fgie, Fcel and Fber stations).

estimated the frequency of blowing snow events at this sta-       RH was included in the DTM training. In conclusion, even
tion (Fig. 7). However, in snow cover scenarios, and except       though the datasets inevitably suffer from imbalanced ob-
for Fgie and Fsal stations, the distribution of maximum wind      servations, both the constructed SIDTM and SSDTMs are
speeds was broadly consistent among the stations (figure not      promising in detecting blowing snow occurrence with con-
shown), and thus the differences between the models evalu-        siderable accuracy.
ated at these stations were small (Fig. 7).
   The FAR values evaluated at each station were compared         3.4   Spatiotemporal transferability assessments
in Fig. 8. In general, FAR was slightly lower when falling
snow was detected than that in other conditions. For exam-        Spatial and temporal transferability refers to how applica-
ple, except for the model trained at Fgie station, the FAR        ble a classifier model is across broad spatial and temporal
values for both the SSDTMs and SIDTM evaluated at Fmor,           scales. Due to the temporal independence of the randomly
Fhue and Fbon stations were below or equal to 10 %, accom-        chosen 80 % of samples, the accuracy of the temporal predic-
panied by high OA and POD values, indicating a good re-           tion of models can be assessed based on the remaining set.
trieval performance in estimating blowing snow occurrence.        Furthermore, the spatially independent datasets from other
However, the blowing snow events under wet snow condi-            validation stations can be used to assess the accuracy of spa-
tions were more likely to be falsely identified. One obvi-        tial prediction. As mentioned in the previous analysis, the
ous distinction in POD values between the SIDTM and SS-           constructed DTMs performed commendably in temporal ex-
DTMs trained with RH was that the SIDTM showed a robust           trapolation and are very much applicable to the estimation of
improvement in reducing the probability of false detection        blowing snow occurrence at other stations outside the train-
whatever the circumstances, while its effectiveness for SS-       ing range. In this section, sensitivity tests were conducted to
DTMs varied between stations and conditions.                      further evaluate and explore the spatiotemporal transferabil-
   Although blowing snow events frequently occur in the           ity of the DTMs.
study region, blowing snow is still a rather rare weather phe-       As shown in the assessment of SSDTM across differ-
nomenon. Analysis of OA, POD and FAR demonstrated the             ent stations, all the SSDTMs showed consistently accurate
great ability of the DTMs in accurately identifying the oc-       performance in estimating the occurrence of blowing snow
currence of blowing snow; however, when considering the           events at the station the SSDTM trained, demonstrating the
impact of the imbalanced dataset, the HSS index, which is         high capacity of models in the temporal prediction of blow-
particularly suitable for the evaluation of forecast skill for    ing snow events. Meanwhile, the model accuracy obtained
rare events (Doswell et al., 1990), should be analyzed. De-       at each validation station was comparable to, or even better
spite the considerable fluctuations in HSS across stations and    than, that assessed at the respective station where each model
conditions as shown in Fig. 9, the generally high HSS indi-       was trained at. For example, the model trained at Fcmb sta-
cated that the DTMs showed promising agreement with in            tion yielded an overall classification accuracy of 0.82 when
situ blowing snow measurements (except for Fgie station,          evaluated at Fcmb station (Fig. 4a), but the model achieved
where HSS values less than 0.4 were frequently observed).         a markedly higher accuracy when applied at Fmor (0.89),
Generally, the consistency between the actual blowing snow        Fhue (0.92) and Fmon (0.92) stations. Notably, this pattern
events and estimates using the DTM was improved when              was more pronounced in HSS (Fig. 9).

Hydrol. Earth Syst. Sci., 25, 3783–3804, 2021                                      https://doi.org/10.5194/hess-25-3783-2021
Z. Xie et al.: Decision tree-based detection of blowing snow events in the European Alps                                  3795

Figure 8. The same as Fig. 4 but for the FAR.

   To explore the accuracy of temporal prediction further, two     and the last two stations, particularly the WSMAX. The other
datasets were created and used in two sensitivity experiments      dataset contained a more homogeneous distribution of obser-
(Test 3 listed in Table 2). Both datasets included observations    vations compared with the Mix (Homo; observations from
from five stations, and the major difference between them          Fmor, Fcmb, Fmon, Fbon and Fche were included). When
was whether the differences in the distribution of feature vari-   models were trained with one of the datasets, observations
ables across stations were significant. One dataset was com-       from the stations which were not included in the training
posed of observations from Fmor, Fcmb, Fmon, Fsal and              dataset were used to assess its predictive performance. The
Fcel stations (Mix), with substantial differences in the dis-      results of these two sensitivity tests will also be compared
tributions of feature variables between the first three stations   with the performance of models constructed using 80 % of

https://doi.org/10.5194/hess-25-3783-2021                                      Hydrol. Earth Syst. Sci., 25, 3783–3804, 2021
3796                               Z. Xie et al.: Decision tree-based detection of blowing snow events in the European Alps

Figure 9. The same as Fig. 4 but for the HSS.

observations from all stations to explore the effect of differ-   on the model performance, as shown in the assessment con-
ent numbers of training stations on the model accuracy.           ducted at Fhue station (comparing the first and second rows
   As shown in Fig. 10, the model trained with either the         of Fig. 10). These results indicated that the DTM shows ro-
Mix (Fig. 10i) or Homo (Fig. 10d) dataset presented simi-         bust spatial transferability and, importantly, was indepen-
lar OA to the SIDTM (Fig. 8n) when evaluated at the same          dent of the source of the training data and the number of
stations. The accuracies of these models were comparable          stations used. When compared at Fber, Fgie, Fcel and Fsal
to that of the SIDTM and even to models constructed based         stations, the model trained with observations from all sta-
only on observations from an individual station. Moreover,        tions (third row) outperformed the model trained with the
the source of the training samples had a minimal impact           Homo dataset (second row) in terms of the POD and HSS

Hydrol. Earth Syst. Sci., 25, 3783–3804, 2021                                    https://doi.org/10.5194/hess-25-3783-2021
Z. Xie et al.: Decision tree-based detection of blowing snow events in the European Alps                                      3797

Figure 10. The assessment indicators of DTMs trained based on observations from five stations with a homogeneous distribution (a–e),
inhomogeneous distribution (f–j) of the feature variable, and the DTM trained based on observations from all the stations.

indices; improvement was also noted in the MR. However,             ing DTMs. In this case, data preprocessing (e.g., the scenario
poorer performance was noted at Fhue, Fbon and Fche sta-            classification method used in this study) is an important and
tions when the model was trained with observations from             effective step in reducing the heterogeneity of data and im-
all stations instead of the Homo dataset, as evident form the       proving the effectiveness of the model.
lower POD and HSS and larger MR (particularly in dry snow
cover conditions). This divergence may partly be explained
by the larger threshold maximum wind speed for the occur-           4     Discussion
rence of blowing snow in models trained with observations
                                                                    4.1    Influence of training data on the DTM
from all stations, which prevents the identification of blowing
snow events at stations with relatively high maximum wind           At stations where a low probability of blowing snow detec-
speed (see Fhue station in Fig. 11: the frequency of blowing        tion was observed (i.e., Fber and Fgie: Fig. 5), a considerable
events follows WSMAX). Meanwhile, blowing snow is more              improvement in the OA, POD, HSS and MR was achieved
likely to be predicted at stations with relatively low maxi-        when the DTM was trained with the Mix dataset instead
mum wind speeds (i.e., the Fgie and Fber stations) due to           of the Homo dataset. For example, a 17.3 % increase in the
the lower threshold maximum wind speed. The occurrence              POD, an increase in HSS from 0.59 to 0.64, and a decrease
of blowing snow events was underestimated at the relatively         in MR (−0.09) were achieved at Fber station under dry snow
low maximum wind speed stations (e.g., Fgie station). The           cover conditions. Distinct difference was noted at Fber, Fgie,
accuracy of estimating blowing snow events increased as the         Fcel and Fsal between models trained with or without hetero-
threshold WSMAX decreased.                                          geneous training samples. However, the source of the train-
   The DTMs were established on the principle of maxi-              ing dataset and the distribution characteristics of predictor
mum inclusiveness, enabling their applicability across broad        variables exerted only a slight impact on the model perfor-
spatial and temporal scales by synthesizing all the features        mance at other stations (e.g., Fhue). In general, using training
in the available observations. However, conventional algo-          data with heterogeneous information can effectively improve
rithms are often biased towards the majority class without          the classification accuracy while promoting the spatiotempo-
considering the data distribution. When there is a need to          ral transferability of the DTM.
handle heterogeneous data from various sources, the model              Models did not show consistent improvement in estimat-
must seek a good compromise between accuracy, efficiency            ing blowing snow occurrence at all stations when trained
and a good fit to all the training samples; therefore, the prob-    with 80 % of all observations. For example, as mentioned
ability of compromise increases as data heterogeneity in-           earlier, the model showed a marked decrease in POD and
creases. This is an important issue to be aware of when us-         increase in MR in dry snow cover conditions at Fhue, Fche

https://doi.org/10.5194/hess-25-3783-2021                                        Hydrol. Earth Syst. Sci., 25, 3783–3804, 2021
3798 Z. Xie et al.: Decision tree-based detection of blowing snow events in the European Alps
Figure 11. The same as Fig. 6 but only for the DTM constructed based on observations from all stations (All) and observations from
five stations with a heterogeneous distribution (Mix) and homogeneous distribution (Homo) of feature variables, respectively. DTMs were
assessed at stations with relatively high maximum wind speed (Fhue) and with relatively low maximum wind speed (Fgie and Fber).
and Fbon stations, revealing that heterogeneity of the train- tic, physical basis (Li and Pomeroy, 1997b), wind speed
ing data is a key factor in influencing the performance of has been widely used in empirical formulae as a critical in-
the DTM. Meanwhile, the results also highlighted the im- dicative parameter to simulate the wind transport of snow
portance of a reliable and impartial training dataset; strongly (Schmidt, 1980; Pomeroy and Gray, 1990). A DTM is a
imbalanced datasets should be avoided. black-box model, in which it is difficult to envisage how the
different components operate and interact. However, sensi-
4.2 Influence of meteorological and environmental tivity tests have demonstrated that the maximum wind speed
factors on the DTM played a decisive role in the model predictions. The thresh-
old wind speed for snow transport refers to the minimum
The occurrence of blowing snow events depends largely on wind speed required to initiate the saltation of snow. Once
a combination of meteorological and environmental factors, the fastest wind speed exceeds the threshold wind speed, the
such as wind speed, wind direction, air temperature, topog- wind shear stress overcomes the snow cohesion, bonding and
raphy and vegetation. Wind speed serves as the driving force frictional resistance, thereby initiating a blowing snow event.
for the initiation of blowing snow. As it is difficult to de- The blowing snow process can then be sustained by a rela-
termine the occurrence of blowing snow on a determinis- tively low wind speed. Thus, the maximum wind speed (in-
Hydrol. Earth Syst. Sci., 25, 3783–3804, 2021 https://doi.org/10.5194/hess-25-3783-2021Z. Xie et al.: Decision tree-based detection of blowing snow events in the European Alps 3799
stead of the mean wind speed) contributes most strongly to plied. Internal defects of the FlowCapt sensor (in terms of
the classification accuracy of the DTM. hardware and numerical processing) are another important
Air temperature, one of the most critical parameters af- source of uncertainty (Trouvilliez et al., 2015), although the
fecting the microstructural structure and internal physical suitability of the instrument in measuring blowing snow has
properties of the snowpack, is associated with snow cohe- been evaluated and results have demonstrated its reliability
sive resistance. Cohesive resistance increases considerably in blowing snow studies (Chritin et al., 1999; Cierco et al.,
when snow becomes wet, as water increases the cohesive 2007; Das et al., 2012; Trouvilliez et al., 2015). Neverthe-
bonding force between particles. This leads to a sharp con- less, the rate of snow transported recorded by the FlowCapt
trast of the threshold wind speed for snow transport be- can be underestimated (Trouvilliez et al., 2015). Therefore,
tween wet snow and dry snow. As demonstrated by Li and as the occurrence of blowing snow events was determined
Pomeroy (1997b), condensation and crystal growth occur based only on the FlowCapt measurements, inevitable uncer-
in the snowpack when the saturation vapor pressure is low, tainties exist in this study. To minimize the underestimation
leading to a gradual increase in snow particle bonding resis- of blowing snow measured by the FlowCapt, all records with
tance and lowering the probability of blowing snow occur- blowing snow fluxes exceeding 0 were classified as blowing
rence. Relative humidity, the ratio of vapor pressure and sat- snow events in this study. This is different from Trouvilliez
uration vapor pressure, therefore has important implications et al. (2015), who used a higher (non-zero) threshold value to
for snow aging processes (i.e., metamorphism, despite Arm- remove non-significant blowing snow occurrence when pro-
strong and Brun (2008) reporting that snow metamorphism in cessing FlowCapt measurements.
alpine snowpack is mainly driven by temperature gradient). The problem of strongly skewed data distribution is rather
Wind direction is also an important factor influencing blow- common in real-world applications and introduces unique
ing snow events and is closely associated with topography challenges when training machine-learning models. The term
and wind speed (Roebber et al., 2003). Wind speed can vary “imbalanced data” typically refers to the problem where the
considerably with wind direction, as site-specific topography number of different classes of data is not equally distributed.
may preclude blowing snow under certain wind directions at In this study, for example, the blowing snow events are gen-
particular stations. Preliminary studies have suggested an im- erally outnumbered by the non-blowing snow events. Learn-
provement in blowing snow estimates when taking into con- ing from imbalanced data has been the subject of many pa-
sideration the wind direction (Baggaley and Hanesiak, 2005; pers, workshops, special sessions and dissertations. How-
Vionnet et al., 2018). However, for the consideration of the ever, there is no definite solution. In practice, data imbalance
highly site-specific wind speed and large variations of pre- is addressed by a number of methods: using ensemble cross-
vailing wind speed across stations, the impact of wind direc- validation to justify the model robustness, undersampling the
tion is not considered in this study in constructing the DTMs. majority class or oversampling the minority class (Zhou and
Generally, snow is eroded from wind-exposed surfaces (e.g., Liu, 2006), or assigning different weights to balance the ratio
flat surfaces, hilltops, windward slopes, and sparsely vege- for each category (Jo and Japkowicz, 2004).
tated surfaces) and deposited in wind-sheltered areas such
as densely vegetated surfaces and topographic depressions 4.4 Comparison with other indirect methods
(Li and Pomeroy 1997a; Liston and Sturm, 1998; Xie et al.,
2019). The topography is also very site-specific, and quan- It was extremely difficult to distinguish unreliable records
tifying its potential impacts on blowing snow occurrence is in the quality-controlled data, and it is inevitable that the
challenging. Thus, the temporal transferability of the DTM use of these records in the construction of the DTMs neg-
is likely to drop sharply, and more widespread adoption of atively affects the model’s skill in detecting blowing snow
the DTM will be hindered once the wind direction and to- events. Despite these shortcomings, the calculated accuracies
pography are used as feature variables. Vegetation can be ef- for both the SIDTM and SSDTMS were superior to (and in
fectively quantified by LAI or NDVI; however, the sparse most cases much better than) the empirical parameterization
stations in the study region limit its usage here. schemes using (i) constant threshold wind speed (7.7 m s−1
for dry snow transport and 9.9 m s−1 for wet snow trans-
4.3 Potential sources of error in the DTM port, abbreviated as Constant_dry and Constant_wet, respec-
tively; Li and Pomeroy, 1997a), and (ii) the dynamic thresh-
The FlowCapt sensor is sensitive to soil particles, resulting in old adapts to the evolution of air temperature (abbreviating
false alarms for blowing snow events (Vionnet et al., 2018). as Ut(10), Ut(10)_wet and Ut(10)_dry shares the same ex-
Therefore, one of the greatest uncertainties is attributed to pression but used to detect wet snow and dry snow transport,
unreliable blowing snow events recorded by the FlowCapt respectively; Li and Pomeroy, 1997a). As shown in Fig. 12,
sensors. Although records corresponding to detected blow- the dynamic threshold wind speed outperforms overwhelm-
ing snow events with an absence of simultaneous snow cover ingly the constant threshold wind speed in detecting blowing
and snowfall were removed, unreliable blowing snow events snow occurrence, while the former’s performance evaluation
may still exist in the dataset with strict quality control ap- metrics (except for the FAR) characterizing the ability and ef-
https://doi.org/10.5194/hess-25-3783-2021 Hydrol. Earth Syst. Sci., 25, 3783–3804, 2021You can also read