Development of a Universal Water Quality Index (UWQI) for South African River Catchments - MDPI
←
→
Page content transcription
If your browser does not render page correctly, please read the page content below
water
Article
Development of a Universal Water Quality Index
(UWQI) for South African River Catchments
Talent Diotrefe Banda *          and Muthukrishnavellaisamy Kumarasamy
 Department of Civil Engineering, School of Engineering, College of Agriculture, Engineering and Science,
 University of KwaZulu-Natal, Howard College, Durban 4041, South Africa; kumarasamy@ukzn.ac.za
 * Correspondence: diotrefetb@yahoo.co.uk; Tel.: +27-15-291-1176

 Received: 30 April 2020; Accepted: 26 May 2020; Published: 28 May 2020

 Abstract: The assessment of water quality has turned to be an ultimate goal for most water resource
 and environmental stakeholders, with ever-increasing global consideration. Against this backdrop,
 various tools and water quality guidelines have been adopted worldwide to govern water quality
 deterioration and institute the sustainable use of water resources. Water quality impairment is
 mainly associated with a sudden increase in population and related proceedings, which include
 urbanization, industrialization and agricultural production, among others. Such socio-economic
 activities accelerate water contamination and cause pollution stress to the aquatic environment.
 Scientifically based water quality index (WQI) models are then essentially important to measure
 the degree of contamination and advise whether specific water resources require restoration and to
 what extent. Such comprehensive evaluations reflect the integrated impact of adverse parameter
 concentrations and assist in the prioritization of remedial actions. WQI is a simple, yet intelligible
 and systematically structured, indexing scale beneficial for communicating water quality data to
 non-technical individuals, policymakers and, more importantly, water scientists. The index number is
 normally presented as a relative scale ranging from zero (worst quality) to one hundred (best quality).
 WQIs simplify and streamline what would otherwise be impractical assignments, thus justifying
 the efforts of developing water quality indices (WQIs). Generally, WQIs are not designed for broad
 applications; they are customarily developed for specific watersheds and/or regions, unless different
 basins share similar attributes and test a comparable range of water quality parameters. Their design
 and formation are governed by their intended use together with the degree of accuracy required,
 and such technicalities ultimately define the application boundaries of WQIs. This is perhaps the
 most demanding scientific need—that is, to establish a universal water quality index (UWQI) that
 can function in most, if not all, the catchments in South Africa. In cognizance of such a need, this
 study attempts to provide an index that is not limited to certain application boundaries, with a
 contribution that is significant not only to the authors, but also to the nation at large. The proposed
 WQI is based on the weighted arithmetic sum method, with parameters, weight coefficients and
 sub-index rating curves established through expert opinion in the form of the participation-based
 Rand Corporation’s Delphi Technique and extracts from the literature. UWQI functions with thirteen
 explanatory variables, which are NH3 , Ca, Cl, Chl-a, EC, F, CaCO3 , Mg, Mn, NO3 , pH, SO4 and
 turbidity (NTU). Based on the model validation analysis, UWQI is considered robust and technically
 stable, with negligible variation from the ideal values. Moreover, the prediction pattern corresponds
 to the ideal graph with comparable index scores and identical classification grades, which signifies the
 readiness of the model to appraise water quality status across South African watersheds. The research
 article intends to substantiate the methods used and document the results achieved.

 Keywords: universal water quality index (UWQI); water quality index (WQI); water quality indices
 (WQIs); weight coefficients; sub-index rating curves; sub-index functions; Delphi method

Water 2020, 12, 1534; doi:10.3390/w12061534                                       www.mdpi.com/journal/water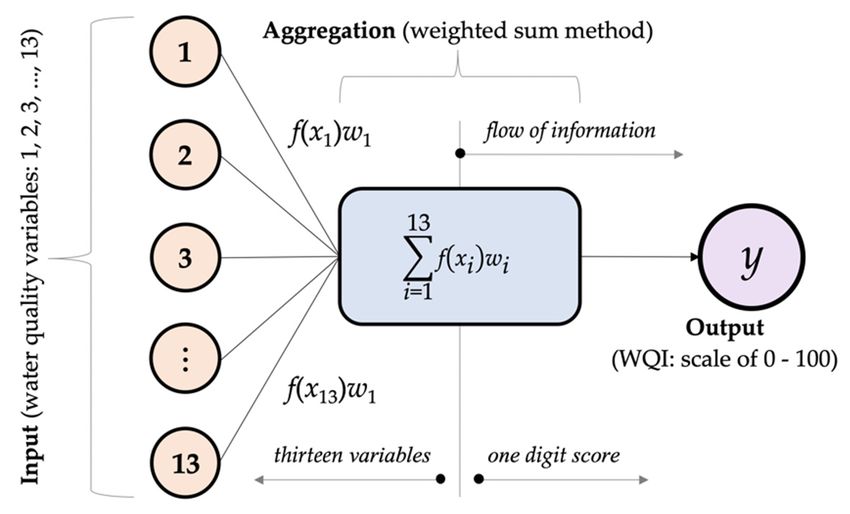
Water 2020, 12, 1534                                                                                 2 of 22

1. Introduction
      The water quality index (WQI) is the most popular method of exhibiting the water quality of surface
water bodies. WQI models are better known for delivering a comprehensive and explicit representation
of water contamination for both surface water basins and groundwater reservoirs. The appraisal
concept is concise and more straightforward, leading to wide acceptance across the water science
community [1]. WQI provides a single numeric value that expresses the status of water quality through
the integration of multiple microbiological and physico-chemical parameters [1,2]. Water quality index
scores are classified using a diverse array of rating scales, but the frequently used grading system ranges
from zero (bad quality) to one hundred (excellent quality) [2–5]. WQI scores are dimensionless [6], and
can be further categorized using descriptive ranks associated with terms like “poor”, “marginal”, “fair”,
“good” and “excellent” [3–5,7]. Water quality indices (WQIs) are typically used by water authorities,
water scientists, policymakers and the general public for decision-making, delineating spatial and
temporal trends, tracing contamination sources, appraising regulatory guidelines and environmental
policies and, most importantly, for suggesting future recommendations [6,8].
      The main objective of WQIs is to convert multiple parameter data into information that is
understandable by both technical and non-technical personnel. The ability of WQIs to synthesize
complex scientific data into simple and easily understood formats makes them the most fundamental
and indispensable elements of water quality monitoring agenda. Therefore, they are universally
acknowledged as a “lifeline” for water quality studies, and their development continues as an ongoing
affair [7]. Despite their range of applications and the variety of WQIs developed this far, there is still
no definite and commonly acceptable methodology for developing water quality indices [6,9]. Instead,
numerous techniques and approaches exist in WQI formation, but the conventionally employed
method involves (a) the determination of relevant water quality variables, (b) the establishment of
sub-indices, (c) the generation of significant weightage coefficients, (d) the aggregation of sub-indices
and, lastly, (e) the attribution of a water classification schema [7,8,10–12]. Each step has alternative
methods to consider, which mean that it is extremely important to decide the most suitable method
for each scenario. Notwithstanding technical knowledge of WQIs, the developer should apply due
diligence and avoid subjective judgements and bias in the process of establishing WQIs, otherwise the
WQI will inherit abnormalities and be considered dysfunctional [7]. For the current study, an index
model for water pollution control and river basin planning functions has been established using expert
opinion in the form of the participation-based Rand Corporation’s Delphi Technique and extracts from
the existing literature. The process yielded thirteen input variables, namely NH3 , Ca, Cl, Chl-a, EC, F,
CaCO3 , Mg, Mn, NO3 , pH, SO4 and turbidity (NTU). In addition to the parameter selection, expert
opinion was also applied to develop significant ratings and parameter weightage coefficients. The
universal water quality index (UWQI) model is an increasing scale index founded on the weighted
arithmetic sum method with resultant values ranging from zero (very bad quality) to one hundred
(good quality). The overall classification is centered on five categories, with the Class 1 rank denoting
“good water quality” and Class 5 rank representing very bad water quality. Following the review
by Banda and Kumarasamy [7], it has been noted that most WQIs are designed for particular region
and are source specific, thus creating a gap and ample scope to develop a universally acceptable WQI.
However, it is a demanding task and is extremely difficult to develop a water quality model that is
globally acceptable, and hence the current studies only focus on national boundaries—that is, they
focus on a model only applicable to South African river catchments. Though this prospect is seemingly
problematic to deal with, it is pertinent and recommended that water quality experts embark on
developing a unified model that can be utilized across the globe. However, the immediate mission is to
develop nationally acceptable water quality indices and break the barrier of region-specific models [7].
Moreover, this study attempts to break such barriers through the development of a universal index
that is applicable to most river catchments in South Africa, thereby promoting a standardized way of
monitoring and comparing the water quality of various watersheds at a national level, which might
eventually assist in the prioritization of water resources across all nine provinces in South Africa.
Water 2020, 12, 1534 3 of 22
Umgeni Water Board (UWB) provided the water quality dataset used to test the UWQI.
The data are from six sampling stations located in four different catchments under the jurisdiction
of Pongola-Mtamvuna Water Management Area (WMA) in KwaZulu-Natal Province, South Africa.
The four watershed regions are Umgeni, Umdloti, Nungwane and Umzinto/uMuziwezinto River
catchments. The UWQI is earmarked for national application, but it is far-reaching and beyond the
scope of the study to test the model against data from all 148 catchment regions in South Africa.
Nevertheless, the four catchments used are adequate to ascertain the functionality of the model and the
process is a step towards the ultimate goal of testing the model against most, if not all, the catchment
areas in South Africa. The model responded steadily to the variation in parameter values and managed
to indicate spatial and temporal changes in water quality for the four catchment areas considered
for the study. It should be noted that the UWQI is formed autonomously without being linked to
a particular dataset or specific region. The methods used are exclusively independent from such
associations and the UWB dataset is entirely for testing purposes, upon which tasks can be performed
using any other available data.
2. Methods
2.1. Research Data
The water quality monitoring process demands substantial amount of resources; therefore, the
current study could not collect samples specific to the research work. Alternatively, water quality data
from Umgeni Water Board (UWB) assisted in testing the functionality of the model. The dataset was
comprised of 416 samples, tested monthly for a period extending to four years. The water quality
records are from six sampling stations located in four different catchment areas, namely Umgeni,
Umdloti, Nungwane and Umzinto/uMuziwezinto River catchments.
The UWB data were sampled in accordance with standard methods prescribed by the Department
of Water and Sanitation (DWS), and analyzed according to international standards in an ISO 9001
accredited laboratory owned and operated by UWB [13]. The research dataset from UWB satisfactorily
provided all the required thirteen water quality parameters, and these are ammonia, calcium, chloride,
chlorophyll-a, electrical conductivity, fluoride, hardness, magnesium, manganese, nitrate, pondus
Hydrogenium, sulphate and turbidity. Testing the model with data from these four river catchments
supports the objective of establishing a UWQI applicable to a greater part of the country, if not the
whole of South Africa. More than the availability of data from UWB, the economic significance of
KwaZulu-Natal Province [14,15], the distinctiveness of its inter-basin arrangements, the scope of the
transfer schemes involved and the extensive water demand [16,17] encouraged the choice of the study
area, which falls under Pongola-Mtamvuna water management area (WMA) [18,19]. The project
data were adequate to examine the model and complement the objective of developing a universally
acceptable water quality model.
2.2. Universal Water Quality Index (UWQI)
Various methods are documented in the literature and, among them, there is no one distinctive
method regarded as the supreme and favorable method for developing water quality indices (WQIs).
Each method has its own considerable problems and the universal water quality index (UWQI) was
formulated using the conventional method of establishing water quality indices. Moreover, the
technique involves four common steps, which are (1) selecting water quality variables, (2) establishing
relative weightage coefficients (3) forming sub-index rating curves and sub-index functions and (4)
deriving the appropriate aggregation or indexing model [8,10–12]. The methods employed for the
development of the UWQI are selected based on a couple of reasons. Firstly, they eliminate individual
bias through the incorporation of objective and subjective opinions from water quality scientists
through appraisal questionnaires. Secondly, compared to other available techniques, the chosen
methods are both practical, convenient and easy to implement in electing variables and generatingWater 2020, 12, 1534 4 of 22
weightage coefficients [20]. Lastly, the methods are proven and have been performed in various WQI
studies [21–35].
2.2.1. Selection of Water Quality Variables
These steps and procedures were performed cautiously with cognizance of the fact that the model
should widen its application boundaries and target to become a nationally accepted water quality
monitoring tool. Based on this fact, a fixed set of parameters were established using expert opinions.
The advantage of a fixed set of variables is that the model can be applied in various catchments
without the possibility of altering the structure and functionality of the model [9], thereby permitting
stakeholders to fairly compare the water quality of different sites and develop a more informed
national prioritization schedule without prejudice. Further to this, expert opinion has the advantage of
promoting the acceptability of the model, in the sense that most of the experts engaged are also the
targeted end users of the model; therefore, the idea that they were involved in the process of developing
the UWQI may eventually facilitate acceptance through a sense of ownership. Nevertheless, this alone
does not warrant the usefulness of the model, the authors exercised enormous care and great attention
to ensure that the most significant variables were incorporated in the UWQI. Importantly, the authors
had to optimize the ideal number of parameters necessary to provide a meaningful water quality
index value.
Following the Rand Corporation’s Delphi Technique, a panel of thirty water specialists from
government parastatals, the private sector and academia was established. Delphi Questionnaires were
circulated to the participants and they were asked to consider twenty-one water quality parameters
for their possible inclusion in the UWQI. The panelists were instructed to designate each variable
as: “Include” and “Exclude” and further assign a relative significance rating against each variable
elected as “Include.” The rating scale ranged from one to five, whereby “scale 1” denoted the highest
significance and “scale 5” represented a comparatively low significance. In addition to the prescribed
twenty-one parameters, the experts were allowed to add, at most, five more variables if desired. A total
of twenty-one questionnaires were returned out of the thirty questionnaires circulated. The Rand
Corporation’s Delphi Technique is described in detailed by Horton [21], Brown et al. [22] and Linstone
and Turoff [36,37] and applied in several studies, which include those by Nagels et al. [33], Kumar and
Alappat [34] and Almeida et al. [35].
Complementarily, the existing literature on WQIs was used to select the most significantly used
water quality variables. Thirty-seven studies were considered and each variable was designated as
“Include” if it corresponded to the twenty-one parameters considered for the Delphi Questionnaires;
otherwise, it was designated as “Not Included.” Furthermore, the formerly assigned significance rating
was adopted as the relative significance rating for each parameter that was “Included” in the study in
question. The rating was based on a scale ranging from one to five, with “Scale 1” representing the
lowest significance and “Scale 5” for relatively high significance. If a different significance rating scale
was used in the existing study, the original rating values were equivalently transformed to match the
preferred rating scale using Equation (1), as follows:
y = a + (b − a)(xi − xmin )/(xmax − xmin ) (1)
where y is the new rating; a, b, are minimum and maximum values of the targeted significance scale
rating; xmin , xmax , are minimum and maximum possible ratings in the specified significance scale; xi is
the ith rating value of the specified scale.
Finally, a holistic ranking order was derived from the combined effect of the two aforementioned
methods, upon which a rejection rationale was employed to eliminate redundant variables that are not
commonly monitored across South African river catchments [20].Water 2020, 12, 1534 5 of 22
2.2.2. Establishing Weight Coefficients
Each parameter has different effects on water classification; hence, weighting factors are used to
reflect their influence on the index model. These mathematical tools are assigned to each water quality
variable based on the level of significance of the overall index value [9,38]. Parameter significance
ratings assigned on Delphi questionnaires and those extracted from the literature on WQI publications
were considered as preliminary significance ratings (see Section 2.2.1). Parameter significance ratings
(bi ) were then established by aggregating the preliminary ratings from the two methods. Relative
weight coefficients (wi ) are directly proportional to the significance ratings and they were established
P
from dividing the parameter significance rating value (bi ) by the sum of all ratings ( bi ) using
Equation (2) [3]. The weight coefficients are presented as decimal figures with a total sum of unity, the
reason being that the combined effect of the water quality parameters should not exceed one hundred
percent [3]. If this does occur, the aggregation of sub-indices will be compromised, and the water
quality index will be deemed dysfunctional. Expert opinion techniques were employed primarily to
produce comparative weights which minimize prejudice and uphold the integrity of the index model.
bi
wi = Pn (2)
i = 1 ( bi )
where bi is the assigned significance rating of the ith water parameter (one being the lowest rating and
five the highest rating); wi is the final weight coefficient for the ith water parameter (decimal value);
n is the total number of the rated water quality parameters.
2.2.3. Formation of Sub-Indices
Considering that water quality parameters are monitored in different scientific units, sub-indices
are applied to convert the different units of measure into a single common non-dimensional scale [7].
This is a common practice and the conventional method involves sub-index rating curves which are
later transformed into mathematical functions commonly known as sub-indices. For practical purposes,
fixed key points of the rating curves were graphically established with reference to the permissible
concentration limits. Straight-line graphs were used to converge the plotted points and produce a
series of linear graphs, which were further converted into linear sub-index functions. Target Water
Quality Ranges (TWQRs), as prescribed by DWAF [39–41], were consulted in the process.
2.2.4. Aggregation Formula
A scenario-based analysis was used to modified and align the model with local conditions to
develop the final universal water quality index (UWQI), which is an improved version of the weighted
sum method. The model equation integrates sub-index values of selected parameters in relation to the
assigned weights and obtains the overall water quality status, which is presented as a unitless number
ranging from 0 to 100. The rationale employed is based on solving multiple systems of equations [42],
where key points of the rating curves were used to generate a series of m equations, with two unknown
variables (x, z) and n water quality parameters in the form
WQI1 = (1/x1 )(SI11 w1 + SI12 w2 + SI13 w3 + . . . + SI1n wn )z 1
WQI2 = (1/x2 )(SI21 w1 + SI22 w2 + SI23 w3 + . . . + SI2n wn )z 2
(3)
...
WQIm = (1/xm )(SIm1 w1 + SIm2 w2 + SIm3 w3 + . . . + SImn wn )z m
where WQI1, . . . , m are the ideal water quality index values corresponding to the key points of the
rating curves; x1, . . . , m are the equation denominators (first unknown variable); SIm1, . . . , mn are the
corresponding sub-indices; w1, . . . , n are relative weight coefficients for the thirteen water quality
parameters and z1, . . . , m are the equation exponentials (second unknown variable).Water 2020, 12, 1534 6 of 22
The first step was to find the optimum values of x and z; thereafter, the closest x-value was
rounded off and substituted into the same set of equations to find the corresponding optimum z-value,
which becomes the final exponential factor of the UWQI.
Using the thirteen selected water quality variables, weightage coefficients and sub-indices,
the improved weighted sum method proved to be the most appropriate and relevant method to develop
a UWQI for assessing water quality in South African river catchments. Hypothetically, this advocates
the readiness of the UWQI model and deems the study a success. Such a milestone provides a tool
that can be adopted at the national level to help solve the challenges experienced by water quality
professionals.
Water 2020, 12, x FORThe structure
PEER REVIEW of the universal water quality index model is represented in Figure 1.
6 of 22
Figure
Figure 1. Design
1. Design diagram
diagram indicating
indicating thethe framework
framework and
and concept
concept considered
considered forfor
thethe establishment
establishment ofof
the
the universal water quality index (UWQI) model. A model framework showing
universal water quality index (UWQI) model. A model framework showing the thirteen water quality the thirteen water
quality input variables x , x , x3 , . . . , x13 , their corresponding weights, w1 to w13 , sub-index functions,
input variables x1, x2, x3, …,1 x132, their corresponding
P weights, w1 to w13, sub‐index functions, f(x1) to f(x13),
f (x1 ) to f (x13 ), and the aggregation function f (xi )wi applied to calculate the weighted influence of the
and the aggregation function f(xi)wi applied to calculate the weighted influence of the input variables.
input variables.
2.3. Water
2.3. Classification
Water Classification
In In
thetheinterest of simplifying
interest of simplifyingthe interpretation of water
the interpretation of quality index (WQI)
water quality indexvalues,
(WQI) mostly
values,to
accommodate non‐technical
mostly to accommodate individuals,
non-technical an indexancategorization
individuals, index categorization schema was was
schema established. The
established.
classification mechanism
The classification is based
mechanism is on an increasing
based scale index
on an increasing scaleandindex theand
advantage of this system
the advantage is that it
of this system
is identical toidentical
is that it is a normaltopercentage hierarchy [3];
a normal percentage therefore,
hierarchy [3];the public can
therefore, theeasily
publicrelate to its function
can easily and
relate to its
interpretation.
function andThe UWQI model
interpretation. The yields
UWQI WQI values
model between
yields zero and
WQI values one hundred.
between zero and Accordingly,
one hundred. the
WQIAccordingly, the WQI scores are categorized using classes ranging from one to five, with “Class 1”of
scores are categorized using classes ranging from one to five, with “Class 1” representing water
therepresenting
highest degree of purity
water with a possible
of the highest degree of maximum
purity withscore of one hundred
a possible maximum and, viceofversa,
score “Class 5”
one hundred
denotes water
and, vice quality
versa, of the
“Class 5”poorest
denotesdegree
water with index
quality of scores nearing
the poorest or equal
degree withtoindex
zero. scores
In order to close
nearing
gaps
or equal to zero. In order to close gaps identified in some of the existing classification scales with
identified in some of the existing classification scales [7], appropriate mathematical functions [7],
logical linguistic
appropriate descriptors, which
mathematical include,
functions with but are not
logical limiteddescriptors,
linguistic to, ʺgreater than”,
which ʺless than”,
include, butand
areʺequal
not
to”limited
were used to appraise
to, “greater WQI“less
than”, scores and we
than”, andrespectively
“equal to” assigned
were used them to the corresponding
to appraise WQI scores and category.
we
respectively assigned them to the corresponding category.
3. Area of Study
3. Area of Study
3.1. Background and Specific Considerations
3.1. Background and Specific Considerations
A substantial increase in population and improper disposal of wastewater have a significant
influenceA substantial increase
on diminishing in quality
water population and and
in rivers improper disposalwater
other surface of wastewater
reservoirs.have
As aaconsequence,
significant
influence
routine on quality
water diminishing water quality
assessment in riverscontrol
and pollution and other surfaceare
measures water reservoirs.
necessary As a consequence,
to preserve and restore
routine water quality assessment and pollution control measures are necessary to preserve
the healthiness of surface water bodies [43]. On the same basis, this study attempts to put forward and restore a
the healthiness of surface water bodies [43]. On the same basis, this study attempts to put
practical and standardized tool that can be used for monitoring surface water quality across all South forward
a practical
African riverand standardized
catchments. tool that
Despite can be
the fact used
that thefor monitoring
current study surface
targets water quality
all South acrossriver
African all
catchments, a specific dataset from a distinct Water Service Authority (WSA) was considered to ascertain
the appropriateness of the proposed model. It would be a far‐reaching and considerable effort to test the
model against water quality data from all the Water Boards (WBs) in South Africa. On these grounds,
water quality data from Umgeni Water Board (UWB) was deemed appropriate to establish the
effectiveness of the developed water quality model. The selection of UWB does not devalue the purposeWater 2020, 12, 1534 7 of 22
South African river catchments. Despite the fact that the current study targets all South African
river catchments, a specific dataset from a distinct Water Service Authority (WSA) was considered to
ascertain the appropriateness of the proposed model. It would be a far-reaching and considerable effort
to test the model against water quality data from all the Water Boards (WBs) in South Africa. On these
grounds, water quality data from Umgeni Water Board (UWB) was deemed appropriate to establish
the effectiveness of the developed water quality model. The selection of UWB does not devalue the
purpose of the study, rather it is the beginning of a long-term undertaking to demonstrate that the
developed model is indeed universal and applicable to most, if not all, South African river catchments.
Umgeni Water Board is a Water Service Authority responsible for the water and sanitation
affairs of KwaZulu-Natal Province in South Africa [44,45]. UWB falls under the jurisdiction of
Pongola-Mtamvuna Water Management Area (WMA) which has four primary drainage regions
labelled T, U, V and W. Among the four regions, primary drainage basin U was considered for the
current study. Further to this, only four secondary drainage regions were selected and these are
Umgeni, Umdloti, Nungwane and Minto River catchments, which are identified by the Department
of Water and Sanitation (DWS) as U20, U30, U70 and U80, respectively. Umgeni River catchment is
the largest of the four; consequently, it is regarded as the primary study area, and henceforth it is
considered more significant than the other three catchments.
3.2. Umgeni River Catchment
Umgeni River catchment is a sub-humid drainage basin located along the Indian Ocean coastline
in KwaZulu-Natal Province in the Republic of South Africa [14,46,47]. Having a diversified land usage
and multiple water supply systems, Umgeni basin is regarded as one of the most complex drainage
regions in the country. The basin is subdivided into twelve quaternary drainage regions, also known as
quaternary catchments (QCs). Seven of the QCs are situated in the upper most part of Umgeni basin,
three are in the middle and two are in the lower part of the secondary drainage region [13,46]. Umgeni
River catchment plays a major role in the economic development of the country; it serves South Africa’s
biggest trading port and the second largest province in terms of population and economic sizes [14].
This is why Umgeni is considered one of the most significant river catchments in South Africa.
Significantly, Umgeni basin addresses the water needs of the Durban–Pietermaritzburg business
corridor and act as the primary source of water supplied to the Port of Durban, which is the biggest
trading port in Africa and contributes significantly to the Gross Domestic Product (GDP) of South
Africa [14,15]. Considering the social and economic activities in KwaZulu-Natal, the province is
regarded to be a highly ecologically disturbed region [13], and this describes the motivation for
the adoption of Umgeni catchment as the main study area. The current activities and projected
developments in Umgeni River catchment have extraordinary effects on the national water resources
and require a comprehensive water management monitoring model that focuses on protecting the
water reserves. It is therefore important to develop a water quality index model that can be adopted to
better understand the dynamics of water quality changes in Umgeni River catchment and South Africa
as a whole. The model will provide institutional support in delineating water quality concerns across
various river catchments and provide substantial information to water technocrats and decision-makers.
Umgeni River catchment has a surface area nearly 4432 km2 , with Umgeni River being the major
water channel of the drainage basin [13,15,19,48]. The 232-kilometre-long river originates from the
Drakensberg mountains and flows eastwards towards the Indian Ocean, with four main cardinal
tributaries, namely Lions, Karkloof, Impolweni and Umsunduzi Rivers [19,47]. Lions River is the
most contributing tributary in the upstream of Midmar Dam and it serves as the transfer channel,
conveying water resources from the adjacent Mooi River Catchment [13]. The basin land cover is
characterized as heterogeneous, mostly consisting of urban areas, natural forest, commercial sugarcane
plantations, small-scale and commercial agricultural farms and the Port City of Durban [13–15,46].
Notably, Umgeni River supports the livelihood of informal settlers residing along the river course.
They rely on the river for various household activities, irrigation and livestock production [49].Water 2020, 12, 1534 8 of 22
The rainfall pattern of Umgeni basin is seasonal, with rains concentrated in the summer months
(October to March). The amount of precipitation is highly variable, increasing from the western side
to the eastern part of the river catchment. Highest rainfall occurs in coastal areas with a range of
1000 mm/y to 1500 mm/y [15,47]. The inland parts of Umgeni basin generally receive rainfall ranging
from 800 mm/y to 1000 mm/y [15,46,50]. The average annual temperature ranges from 12 ◦ C to 22 ◦ C;
leading to evaporation rates between 1567 mm/y and 1737 mm/y [13]. Four major dams are used to
regulate and reserve the water resources in Umgeni drainage region, and these are Midmar, Albert
Falls, Nagle and Inanda [13,16]. Midmar Dam supplies Pietermaritzburg and some portions of Durban,
whereas Albert Falls, Nagle and Inanda Dams cater for the greater part of the Durban metropolitan
area [19,46,47]. In addition to the four major dams, there is also Henley Dam, situated south of Midmar
Dam along the Msunduzi River, a tributary of the Umgeni River. Apart from that, there are about
300 farm dams utilized for irrigating nearly 185 km2 of commercial farms in the Umgeni catchment
area [46].
3.3. Umdloti River Catchment
Umdloti catchment is situated north-east of Umgeni basin, adjacent to Nagle and Inanda Dams.
The catchment has an estimated area of 597 km2 with Umdloti River as the main watercourse of the
basin [51]. The river source is found in the Noodberg area and stretches for nearly 88 km, flowing
eastwards toward the Indian Ocean. The river estuary is approximately 25 km northeast of central
Durban [48,52]. A considerable portion of the catchment is utilized for commercial farming, dominated
by sugarcane and banana plantations with minimal vegetable and citrus farming. Apart from these,
other establishments include residential areas, Verulam Town, game reserves, Hazelmere Dam and
Hazelmere wastewater treatment plant [52]. In a similar manner to Umgeni basin, the catchment
experiences summer rainfall, with mean annual precipitation ranging between 800 mm and 1125 mm.
Temperatures vary from 9 ◦ C in winter to 38 ◦ C in summer [52]. Hazelmere Dam is the major water
impoundment in Umdloti catchment [51]. The dam was established to service the domestic, industrial
and agricultural needs of the Durban area, including the new Durban International Airport [48,52].
3.4. Nungwane River Catchment
Located southwest of Umgeni drainage region, Nungwane River catchment has mean annual
precipitation of 938 mm/y and annual evaporation close to 1200 mm/y. The significant impoundment
in the quaternary catchment is the Nungwane Dam, situated along the Nungwane River, which is a
tributary of Lovu River [53]. The impoundment was built in 1977, with a catchment area of 58 km2 ,
and raw water from Nungwane Dam is treated at Amazimtoti water treatment plant and then supplies
eThekwini Municipality [53].
3.5. Umzinto/uMuziwezinto River Catchment
Umzinto River catchment, also known as uMuziwezinto River catchment, lies further south
of Nungwane Dam. According to Umgeni Water [53], the river basin receives rainfall averaging
985 mm/y, with an evaporation rate of 1200 mm/y. In 1983, Umzinto Dam was constructed along
Umzinto/uMuziwezinto River, with a catchment area of about 52 km2 . Together with EJ Smith Dam,
raw water from Umzinto Dam is treated at Umzinto water treatment plant (WTP) and distributed
to Ugu District Municipality [53,54]. Both dams, EJ Smith and Umzinto, supply raw water to the
operation of Umzinto WTP [53,54].
3.6. Sampling Locations
Umgeni Water Board (UWB) established water sampling stations to enhance water quality
monitoring and the stations are strategically positioned to provide a holistic understanding of water
affairs within the service area of KwaZulu-Natal Province. Instead of establishing new research-based
sampling stations, the current studies utilized water quality data collected by UWB. At least one orWater 2020, 12, 1534 9 of 22
more stations were considered for each of the four drainage basins discussed in the preceding sections.
Further details of the selected sampling stations are included in Table 1 and Figure 2.
Table 1. Details of sampling stations relevant to the study.
Identity Codes Sampling Location Coordinates (DMS)*
Sampling Station Identity
Station Catchment Latitude Longitude
◦ ◦
1 Henley Dam DHL003 U20 S 29 370 25.734” E 30 140 49.754”
◦ ◦
2 Hazelmere Dam DHM003 U30 S 29 350 53.722” E 31 020 32.121”
◦ ◦
3 Inanda Dam 0.3 km DIN003 U20 S 29 420 27.403” E 30 520 03.352”
◦ ◦
4 Midmar Dam DMM003 U20 S 29 290 47.332” E 30 120 05.655”
◦ ◦
5 Umzinto Dam DMZ009 U80 S 30 180 40.676” E 30 350 34.580”
◦ ◦
6 Nungwane Dam DNW003 U70 S 30 000 24.473” E 30 440 36.150”
Source: Umgeni Water Board. Notes: * location coordinates are based on the World Geodetic System 84 (WGS 84);
degrees, minutes and seconds (DMS). Although Umgeni Water Board has more water quality monitoring stations,
Water 2020, 12,1xshows
Table FOR PEER REVIEW
only the six water quality monitoring stations considered in this study. 9 of 22
Figure 2. Locality map for sampling stations: (a) all six sampling stations, (b) Henley Dam, (c) Hazelmere
Figure 2. Locality map for sampling stations: (a) all six sampling stations, (b) Henley Dam, (c) Hazelmere
Dam, (d) Inanda Dam, (e) Midmar Dam, (f) Umzinto Dam, and (g) Nungwane Dam.
Dam, (d) Inanda Dam, (e) Midmar Dam, (f) Umzinto Dam, and (g) Nungwane Dam.
Source: The underlying map of Figure 2 was downloaded from Google Earth and station
Source: The underlying map of Figure 2 was downloaded from Google Earth and station coordinates
coordinates are from Umgeni Water Board (UWB) (Table 1). Sampling station identification numbers:
are from Umgeni Water Board (UWB) (Table 1). Sampling station identification numbers: (1) Henley Dam
(1) Henley Dam DHL003, (2) Hazelmere Dam DHM003, (3) Inanda Dam DIN003, (4) Midmar Dam
DHL003, (2) Hazelmere Dam DHM003, (3) Inanda Dam DIN003, (4) Midmar Dam DMM003, (5) Umzinto
DMM003, (5) Umzinto Dam DMZ009, and (6) Nungwane Dam DNW003.
Dam DMZ009, and (6) Nungwane Dam DNW003.
The economic importance of the Umgeni Basin, the uniqueness of its inter-basin arrangements, the
The economic importance of the Umgeni Basin, the uniqueness of its inter‐basin arrangements, the
magnitude of the transfer schemes involved and the extensive water demand require comprehensive
magnitude of the transfer schemes involved and the extensive water demand require comprehensive
water resource management. All of these factors distinctively motivated the identification and selection
water resource management. All of these factors distinctively motivated the identification and selection
of the Umgeni River catchment as the main study area. Beyond that, three additional catchments were
of the Umgeni River catchment as the main study area. Beyond that, three additional catchments were
incorporated into the study in order to further examine the model and complement the objective of
incorporated into the study in order to further examine the model and complement the objective of
developing a universally acceptable water quality model.
developing a universally acceptable water quality model.
4. Results and Discussion
4. Results and Discussion
4.1. Research Dataset
4.1. Research Dataset
Regular water quality sampling and analysis is a costly and demanding task, hence acquiring
Regular
large water
volumes qualityquality
of water sampling
dataand analysis
is often is a costly
a challenge andand demanding
requires task, hence
significant amountacquiring large
of financial
volumes of water quality data is often a challenge and requires significant amount of financial resources
[55,56]. Given that the authors could not gather their own samples, water quality data from Umgeni
Water Board (UWB) were used to attest the functionality of the model. The dataset from UWB is for six
sampling stations that fall under the jurisdiction of four different catchment areas. It contains 416
monthly samples for a period of four years, ranging from June 2014 to July 2018 and the dataset statisticsWater 2020, 12, 1534 10 of 22
resources [55,56]. Given that the authors could not gather their own samples, water quality data from
Umgeni Water Board (UWB) were used to attest the functionality of the model. The dataset from UWB
is for six sampling stations that fall under the jurisdiction of four different catchment areas. It contains
416 monthly samples for a period of four years, ranging from June 2014 to July 2018 and the dataset
statistics are presented in Table 2. Hardness (CaCO3 ) tests were recorded on a quarterly basis and,
where possible, using the measured values of calcium (Ca) and magnesium (Mg); alternatively, the
estimation of missing CaCO3 values was achieved through Equation (4).
CaCO3 = 2.497Ca + 4.118Mg (4)
where all parameter concentration levels are in mg/L. The method is common practice and is prescribed
in the literature [3,39,40,57,58].
Table 2. Descriptive statistics for observed water quality data for UWB for a period ranging from 2014
to 2018.
Water Quality Variables 7
S.No.1 Statistics
NH3 Ca Cl Chl-a EC F CaCO3 Mg Mn NO3 pH SO4 Turb
1 Min. 2 0.04 4.32 3.16 0.14 6.84 0.10 21.29 2.55 0.01 0.41 7.20 0.16 3.90
Mean 3 0.12 6.90 8.67 6.33 11.13 0.11 34.59 4.21 0.07 1.27 7.78 2.13 36.64
Max. 4 0.56 14.20 21.40 68.31 21.80 0.54 69.55 8.28 0.59 2.27 8.60 3.46 367.00
Std. Dev.5 0.09 1.61 2.30 11.67 2.17 0.06 7.55 0.91 0.12 0.50 0.28 0.71 61.57
CoV 6 (%) 72.68 23.37 26.56 184.30 19.47 56.76 21.83 21.59 166.03 39.19 3.55 33.45 168.05
2 Min. 0.04 3.80 19.40 0.14 15.80 0.10 27.69 3.27 0.01 0.10 6.80 1.56 1.20
Mean 0.09 5.45 28.87 6.23 18.18 0.12 34.15 4.99 0.03 0.37 7.90 6.38 31.62
Max. 0.16 18.80 40.50 92.22 22.30 0.20 81.45 8.38 0.14 3.54 9.10 13.40 293.00
Std. Dev. 0.02 1.67 3.82 13.62 1.23 0.02 6.41 0.61 0.03 0.41 0.47 2.13 38.95
CoV (%) 24.83 30.58 13.25 218.73 6.78 19.01 18.77 12.26 90.51 111.39 5.89 33.35 123.20
3 Min. 0.04 7.35 18.70 0.14 7.85 0.13 31.16 3.11 0.01 0.05 0.00 11.50 0.60
Mean 0.10 15.87 32.80 4.66 28.64 0.16 71.20 7.67 0.03 0.71 7.59 16.51 2.25
Max. 0.27 30.50 43.90 19.50 33.60 0.22 128.46 12.70 0.29 9.58 8.80 24.20 19.30
Std. Dev. 0.03 4.70 4.36 3.70 2.53 0.02 18.32 1.78 0.05 0.90 0.76 2.27 2.00
CoV (%) 30.18 29.64 13.30 79.33 8.84 12.11 25.74 23.17 157.57 125.59 10.02 13.75 88.90
4 Min. 0.04 1.00 1.82 0.18 6.99 0.10 6.67 1.00 0.01 0.10 6.00 0.95 1.10
Mean 0.11 5.93 4.35 4.70 7.67 0.10 27.91 3.14 0.01 0.32 7.87 1.86 5.23
Max. 0.61 18.50 7.88 25.62 8.93 0.21 79.00 8.08 0.08 4.50 8.50 2.64 19.10
Std. Dev. 0.08 2.58 0.92 4.84 0.38 0.02 10.90 1.07 0.01 0.61 0.39 0.35 3.78
CoV (%) 75.45 43.57 21.08 103.00 4.89 17.35 39.06 34.08 86.38 189.44 4.91 18.99 72.24
5 Min. 0.04 1.91 31.90 0.14 18.80 0.11 11.07 1.53 0.01 0.05 6.80 1.72 1.24
Mean 0.12 10.34 50.83 3.72 31.95 0.22 61.44 8.65 0.18 0.32 7.81 10.33 9.43
Max. 0.99 17.00 79.00 30.39 48.00 0.39 102.57 14.60 1.21 2.18 8.40 23.10 75.40
Std. Dev. 0.13 2.98 12.00 4.95 6.53 0.07 17.09 2.53 0.22 0.39 0.35 4.70 12.61
CoV (%) 110.62 28.79 23.60 133.02 20.43 30.67 27.82 29.30 126.21 120.10 4.45 45.52 133.83
6 Min. 0.04 1.00 12.00 0.14 13.20 0.10 6.62 1.00 0.01 0.10 7.30 0.16 2.00
Mean 0.12 3.76 24.49 4.13 14.84 0.10 25.62 3.94 0.02 0.45 7.87 3.14 8.63
Max. 0.68 7.91 37.10 11.92 16.60 0.10 36.39 5.02 0.15 1.77 8.70 7.16 29.20
Std. Dev. 0.09 1.12 3.55 2.45 0.99 0.00 6.40 0.96 0.03 0.36 0.31 1.30 5.69
CoV (%) 71.12 29.83 14.51 59.51 6.66 0.00 24.98 24.31 120.12 78.90 3.99 41.52 65.87
Source: Umgeni Water Board. Notes: 1 sampling station identification number, 2 minimum measured water quality
values, 3 mean/average of measured water quality values, 4 maximum measured water quality values, 5 standard
deviation, 6 coefficient of variation as a percentage, and 7 water quality variables measured in mg/L, except for
chlorophyll-a (µg/L), electrical conductivity (µS/m), pondus Hydrogenium (unitless), and turbidity (NTU).
The samples obtained from UWB were adequate and contributed significantly towards the success
of the current study. Umgeni water quality data were considered based on availability; other than
being a priority and limiting the number of WBs used for testing, the models do not devalue the
significance of the study. The rationale used in developing the universal water quality index is
completely independent of the dataset used for testing the functionality of the model; nevertheless,
as an ongoing project and in support of the current studies, it is recommended that additional data
from other WBs, if not all, be considered and documented separately.Water 2020, 12, 1534 11 of 22
4.2. Water Quality Variables and their Relative Weightage Coefficients
With the aid of the Delphi method and the existing literature, a fixed set of thirteen physico-chemical
parameters were found to be adequate and appropriate to analyze and compare water quality status
among different sites. A fixed system requires enormous care, attention, experience and proficiency
to ensure that the most significant variables are incorporated in the WQI. Expertise is required to
delineate what might be regarded as too few or too many variables, the ability to optimize the ideal
number of parameters necessary or just enough to calculate a meaningful water quality index value [7].
Therefore, the study involved expert opinions through a group of selected professionals and extracts
from similar studies. Accordingly, the most appropriate variables considered for inclusion in the
UWQI are ammonia (NH3 ), calcium (Ca), chloride (Cl), chlorophyll-a (Chl-a), electrical conductivity
(EC), fluoride (F), hardness (CaCO3 ), magnesium (Mg), manganese (Mn), nitrate (NO3 ), pondus
Hydrogenium (pH), sulphate (SO4 ) and turbidity (Turb).
Considering that, in the current study, water quality parameters are viewed to have different
influences on the overall classification of water, some variables are considered greater than others;
therefore, weights were established to appropriately reflect the diversity of each parameter. The
comparative scale used is biased towards the level of influence and significance towards the overall
index value [9,38]. As represented in Table 3, two sets of parameter significance ratings obtained from
the participation-based Delphi method and extraction from the existing literature are used to derive
the weight ratings based on a common scale of influence, ranging from one (lowly rated) to five (highly
rated). Given the Delphi significance rating (ci ) and the literature significance rating (di ), the parameter
weight rating (bi ) is given by (ci + di )/2, whereas the final weight coefficient (wi ) is transformed by
dividing the relevant parameter weight rating (bi ) by the sum of all weight ratings (wi = bi / bi ) and
P
the index weight coefficients are represented as a decimal number with a sum equal to one (w1 + w2 +
w3 + . . . + wn = 1). In principle, this theory governs the model from computing index values in excess
of one hundred percent, otherwise the aggregation process will be compromised and will jeopardize
the scientific steadiness of the model [3].
Table 3. Parameters of consideration and their weight coefficients.
Impact Weight Ratings and Weightage Coefficients
Variable Identity and Name
Delphi Rating (ci ) Literature Rating (di ) Weight Rating (bi ) Weight Coefficient (wi )
1 Ammonia 4.3684 3.5033 3.9358 0.1035
2 Calcium 3.5263 1.9961 2.7612 0.0726
3 Chloride 3.7143 1.9249 2.8196 0.0742
4 Chlorophyll a 1.7222 1.0000 1.3611 0.0358
Electrical
5 2.9474 2.3136 2.6305 0.0692
Conductivity
6 Fluoride 3.7500 3.4619 3.6059 0.0949
7 Hardness 2.5714 1.8943 2.2329 0.0587
8 Magnesium 3.4667 1.9334 2.7000 0.0710
9 Manganese 3.8125 3.1093 3.4609 0.0910
10 Nitrate 3.9048 3.0072 3.4560 0.0909
pondus
11 4.3333 2.5949 3.4641 0.0911
Hydrogenium
12 Sulphate 2.9167 2.9712 2.9439 0.0774
13 Turbidity 2.6667 2.6226 2.6446 0.0696
Totals 38.0167 1.0000
Notes: parameters are listed alphabetically. Using final weight coefficients in Table 3, the following order of
importance is achieved: NH3 > F > pH > Mn > NO3 > SO4 > Cl > Ca> Mg > Turb > EC > CaCO 3 > Chl-a.
4.3. Formation of Parameter Sub-Index Rating Curves and Sub-Index Functions
Given the fact that the identified model input variables are assessed using different units of
measurement, sub-indices were then developed to transform the measurement units into a common
unitless scale. Moreover, the adopted indexing model can only aggregate parameters with a common
scale, which became more necessary in order to harmonize the parameter values using a standardized
non-dimensional scale. In relation to the permissible water quality parameter concentrations prescribedWater 2020, 12, 1534 12 of 22
by DWAF [39–41], fixed key points of the rating curves were established (see Table 4) and converged
with straight-line graphs. Thereafter, the linear equations associated to the straight-line graphs were
collectively transformed into linear sub-index functions. The advantage with this technique is that
sub-index functions are able to interpolate the limits in between water classification categories using
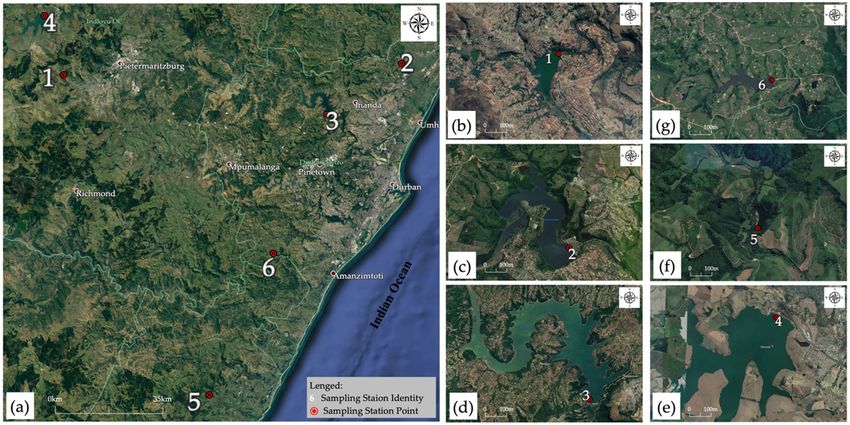
the linear regression method. Examples of the final sub-index curves are included in Figure 3, whereas
examples of sub-index functions are represented mathematically from Equation (5) to Equation (7).
−56.627xa + 97.609, if xa ≤ 1.4
a + 216, if 1.4 < xa ≤ 1.5
−140x
SIa = (5)
−12xa + 24, if 1.5 < xa ≤ 2.0
0, otherwise
−1.0707xb + 100, if xb ≤ 46.70
−2.0301xb + 144.08, if 46.70 < xb ≤ 60
SIb = (6)
−0.7667xb + 69, if 60 < xb ≤ 90
0, otherwise
100, if xc ≤ 50
110, if 50 < xc ≤ 150
−0.4x +
c
−0.1286xc +69.286, if 150 < xc ≤ 500
SIc = (7)
5, if 500 < xc ≤ 600
0, otherwise
where SIa,b, . . . , c are sub-index functions for (a) ammonia, (b) calcium, (c) chloride; xa,b, . . . , c are the
observed water quality reading of the respective water quality parameter. Due to the nature of the
article, only sub-index rating curves and mathematical functions for NH3 , Ca and Cl are presented
herein; the rest are documented elsewhere.
Table 4. Range of water quality parameters and their key points defined for sub-index rating curves.
Key Points of the Sub-Index Graph (SI0, . . . , 100 = Sub-Index Zero to Sub-Index One Hundred)
Variable Unit Class 5 Class 4 Class 3 Class 2 Class 1
SI0 SI5 SI10 SI25 SI45 SI50 SI55 SI75 SI90 SI95 SI100
1 NH3 mg/L 2.00 1.58 1.47 1.28 0.93 0.84 0.75 0.40 0.13 0.05 0.00
2 Ca mg/L 90.00 83.47 76.95 59.01 49.16 46.70 42.03 23.35 9.34 4.67 0.00
3 Cl mg/L 601.00 501.00 461.01 344.37 188.85 150.00 137.50 87.50 50.00 50.00 50.00
4 Chl-a µg/L 29.00 24.00 20.00 17.00 13.00 12.00 11.00 5.50 1.00 1.00 1.00
5 EC µS/m 492.86 471.44 450.00 385.77 300.00 278.58 257.15 171.45 70.00 70.00 70.00
6 F mg/L 1.51 1.38 1.27 0.92 0.46 0.35 0.33 0.27 0.05 0.05 0.05
7 CaCO3 mg/L 300.00 280.00 260.00 200.00 180.00 175.00 170.00 150.00 75.00 50.00 0.00
8 Mg mg/L 91.00 82.00 74.00 50.00 46.00 45.00 44.00 40.00 32.50 30.00 0.00
9 Mn mg/L 1.54 1.43 1.33 1.03 0.63 0.53 0.49 0.34 0.05 0.05 0.05
10 NO3 mg/L 2.00 1.75 1.50 0.95 0.75 0.70 0.65 0.37 0.07 0.03 0.00
11 pH a Unitless 4.00 4.00 4.00 4.19 4.94 5.12 5.31 6.06 6.62 6.81 7.00
pH b Unitless 11.00 11.00 11.00 10.81 10.06 9.87 9.69 8.94 9.37 8.19 8.00
12 SO4 mg/L 350.00 310.00 270.00 150.00 113.98 104.99 95.99 60.00 37.50 30.00 0.00
13 Turb NTU 45.00 27.50 10.00 8.75 7.08 6.67 6.25 4.60 3.40 3.00 0.00
apondus Hydrogenium lower limits (pH a ), b pondus Hydrogenium upper limits (pH b ). The key points are based
on Target Water Quality Ranges (TWQRs) as prescribed by DWAF [39–41].SIc = ‐0.1286xc +69.286, if 150 < xc ≤ 500 (7)
⎨ 5, if 500 < xc ≤ 600
⎪
⎩ 0, otherwise
where SIa,b, … ,c are sub‐index functions for (a) ammonia, (b) calcium, (c) chloride; xa,b, … ,c are the observed
water quality reading of the respective water quality parameter. Due to the nature of the article, only
Water 2020, 12, 1534 13 of 22
sub‐index rating curves and mathematical functions for NH3, Ca and Cl are presented herein; the rest are
documented elsewhere.
(a) (b) (c)
100 100 100
90 90 90
80 80 y = ‐1.0707x + 100 80
70 y = ‐56.627x + 97.609 70 70 y = ‐0.4x + 110
Sub‐Index
Sub‐Index
60
Sub‐Index
60 60
50 50 50
40 40 40 y = ‐0.1286x + 69.286
30 y = ‐12x + 24 30 y = ‐2.0301x + 144.8 30
20 20 20
10 y = ‐140x + 216 10 y = ‐0.7667x + 69
10
0 0 0
0.0 0.4 0.8 1.2 1.6 2.0 0 20 40 60 80 100 0 100 200 300 400 500 600
Ammonia (mg N/L) Calcium (mg Ca/L) Chloride (mg Cl/L)
Figure
Figure 3. Examplesofofthe
3. Examples thegraphically
graphically established
established parameter
parameter sub-index
sub‐index rating
rating curves
curves for
for the the selected
selected water
water quality parameters (a) NH , (b) Ca and
quality parameters (a) NH3, (b) Ca3 and (c) Cl. (c) Cl.
4.4. Weighted Indexing Model (UWQI)
Table 4. Range of water quality parameters and their key points defined for sub‐index rating curves.
The mathematical structure and
Key Points application
of the of indexing
Sub‐Index Graph modelszero
(SI0, …, 100 = Sub‐Index is to
normally
Sub‐Index onegoverned
hundred) by the
degree of accuracy
Variable Unit perceived and the
Class 5 type of weightage Class 4 coefficients, Class which
3 might Classbe2 equally
Class 1or
SI0 SI5 SI10 SI25 SI45 SI50
unequally defined. Various aggregation methods exist, and each SI 55
technique SI75
hasSIits90
ownSI95formidable
SI100
1 NH3 mg/L 2.00 1.58 1.47 1.28 0.93 0.84 0.75 0.40 0.13 0.05 0.00
challenges;
2 Ca thus,mg/L
the index developer
90.00 83.47 has to decisively
76.95 59.01 select the
49.16 46.70most appropriate
42.03 23.35 and
9.34 relevant
4.67 indexing
0.00
3
model, Cl
preferably mg/L 601.00 fewer
one with 501.00complications
461.01 344.37that
188.85
might150.00 adversely137.50 influence
87.50 50.00final
the 50.00
index50.00
value.
4 Chl‐a μg/L 29.00 24.00 20.00 17.00 13.00 12.00 11.00 5.50 1.00 1.00 1.00
Otherwise,
5 EC defining
μS/m the best
492.86 and absolute
471.44 450.00 aggregation
385.77 300.00model 278.58 is close
257.15 to impossible.
171.45 70.00 Since
70.00there is no
70.00
supreme
6 Fand favorable
mg/L technique
1.51 1.38 of formulating
1.27 0.92 water
0.46 quality 0.35 indices
0.33 (WQIs),
0.27 various
0.05 aggregation
0.05 0.05
7 CaCO3 mg/L 300.00 280.00 260.00 200.00 180.00 175.00 170.00 150.00 75.00 50.00 0.00
methods
8 Mg
were tried
mg/L
and tested.
91.00
The
82.00
modified
74.00
weighted
50.00 46.00
sum 45.00
(additive)
44.00
method
40.00
was
32.50
found
30.00
to be
0.00
the
most
9 appropriate
Mn for
mg/L the development
1.54 1.43 of
1.33a universal
1.03 water
0.63 quality
0.53 index
0.49 for monitoring
0.34 0.05 South
0.05 African
0.05
10 NO3 The
watersheds. mg/L
modified2.00 weighted
1.75 1.50 (additive)
sum 0.95 0.75
method 0.70
is 0.65
represented 0.37
in 0.07
Equation 0.03[26–28].
(8) 0.00
11 a pH Unitless 4.00 4.00 4.00 4.19 4.94 5.12 5.31 6.06 6.62 6.81 7.00
pH b Unitless 11.00 11.00 11.00 10.81 10.06 9.87
2 9.69 8.94 9.37 8.19 8.00
12 SO4 mg/L 350.00 310.00 270.00 150.001 n
113.98
X 104.99
95.99 60.00 37.50 30.00 0.00
13 Turb NTU 45.00 27.50 WQI =
10.00 8.75 7.08 si wi6.67
6.25 4.60 3.40 3.00 0.00 (8)
100
apondus Hydrogenium lower limits (pH a), b pondus Hydrogenium
i=1 upper limits (pH b). The key points
are based on Target Water Quality Ranges (TWQRs) as prescribed by DWAF [39,40,41].
Upon conducting a scenario-based analysis, the modified weighted sum equation has been further
improved to align
4.4. Weighted it with
Indexing Modellocal conditions and the developed final universal water quality (UWQI)
(UWQI)
model is presented in Equation (9):
The mathematical structure and application of indexing models is normally governed by the degree
of accuracy perceived and the type of weightage n coefficients,
1.0880563which might be equally or unequally
defined. Various aggregation methodsWQI exist,=
2 X
andeachsitechnique has its own formidable challenges; thus,
w i
(9)
3 appropriate
the index developer has to decisively select the most i=1 and relevant indexing model, preferably
one with fewer complications that might adversely influence the final index value. Otherwise, defining
where
the bestUWQI is the aggregated
and absolute aggregationindex
modelvalue ranging
is close from zero
to impossible. to hundred,
Since there is nowith zeroand
supreme representing
favorable
water of poor quality and hundred denoting water of the highest quality; s is
technique of formulating water quality indices (WQIs), various aggregationi methods were triedthe sub-index value of
and
the ith water quality parameter obtained from the sub-index linear functions and
tested. The modified weighted sum (additive) method was found to be the most appropriate for the the values range
from zero to hundred, similar to WQI values; wi is the weight coefficient value for the ith parameter
represented as decimal number and the sum of all coefficients is one, (w1 + w2 + w3 + . . . + wn = 1);
n is the total number of sub-indices—in this case, n = 13.
4.5. Scenario-Based Model Validation Analysis
Scenario-based analysis helps to identify potential data-processing gaps, which, in turn, enlighten
us as to the necessary precautions that are imperative in order to minimize the impact, or perhaps
eliminate the problem completely. To determine such precautions, ideal sets of predictive variables have
been established under a variety of scenarios to calculate specific water quality variables. Considering
increments of five scores, nine probable scenarios have been examined to demonstrate the model’sYou can also read