Lightning occurrences and intensity over the Indian region: long-term trends and future projections
←
→
Page content transcription
If your browser does not render page correctly, please read the page content below
Atmos. Chem. Phys., 21, 11161–11177, 2021
https://doi.org/10.5194/acp-21-11161-2021
© Author(s) 2021. This work is distributed under
the Creative Commons Attribution 4.0 License.

Lightning occurrences and intensity over the Indian region:
long-term trends and future projections
Rohit Chakraborty1 , Arindam Chakraborty2,3 , Ghouse Basha4 , and Madineni Venkat Ratnam5
1 Divecha Centre for Climate Change, Indian Institute of Science, Bangalore, India
2 Centrefor Atmospheric and Oceanic Studies, Indian Institute of Science, Bangalore, India
3 DST-Centre of Excellence in Climate Change, Divecha Centre for Climate Change, IISc, Bangalore, India
4 Atmospheric Structure and Dynamics Group, National Atmospheric Research Laboratory, Tirupati, India
5 Aerosol Radiation and Trace Gases Group, National Atmospheric Research Laboratory, Tirupati, India

Correspondence: Rohit Chakraborty (rohitchakrab@iisc.ac.in)

Received: 17 December 2020 – Discussion started: 12 January 2021
Revised: 20 May 2021 – Accepted: 21 June 2021 – Published: 23 July 2021

Abstract. Lightning activity constitute the major destructive      tilinear regression equations, which are then employed in
component of thunderstorms over India. Hence, an under-            multiple global circulation models (GCMs) to understand the
standing of the long-term variability in lightning occurrence      long-term impact of urbanization on lightning over the period
and intensity and their interrelation with various causative       from 1950 to 2100. The analysis reveals a uniform increase
factors is required. Long-term (1998–2014) Tropical Rainfall       in lightning occurrence and intensity using both urbaniza-
Measuring Mission (TRMM) satellite-based lightning obser-          tion scenarios; however, accelerated growth is observed in
vations depict the most frequent lightning occurrences along       the RCP8.5 projections after the year 2050, as also observed
the Himalayan foothills, the Indo-Gangetic plains and coastal      from the surface warming trends. As a result, lightning fre-
regions, while the intensity of these lightning strikes is found   quency and intensity values across the Indian region are
to be strongest along the coastal regions and in the Bay of        expected to increase ∼ 10 %–25 % and 15 %–50 %, respec-
Bengal. In addition, both of the abovementioned lightning          tively, by the end of the century with the highest risk along
properties show a very strong intensification (∼ 1 %–2.5 %         the coasts; hence, this requires immediate attention from pol-
annually) across all Indian regions during the 1998–2014 pe-       icymakers.
riod with the maximum trends along the coasts. Accordingly,
a detailed statistical dominance analysis is performed which
reveals total column water vapor (TCWV) to be the dom-
inant factor behind the intensification in lightning events,       1   Introduction
while instability, measured by the convective available po-
tential energy (CAPE), and aerosol optical depth (AOD)             Intense thunderstorm events form a very common climatic
jointly control the lightning frequency trends. An increase        feature over the Indian subcontinent. These phenomena are
in surface temperatures has led to enhanced instability and,       generally accompanied by widespread lightning, wind gusts
hence, stronger moisture transport to the upper-troposphere        and heavy rainfall which induce various socioeconomic haz-
and lower-stratosphere regions, especially along the coasts.       ards. However, among the abovementioned by-products of
This transported moisture helps deplete the ozone concentra-       storms, lightning occurrences have been found to cause the
tion, leading to reduced temperatures and elevated equilib-        greatest damage to life with a death toll of more than 2500
rium levels, which finally results in stronger and more fre-       every year over the last 2 decades (Livemint, 2000). In ad-
quent lightning events, as also evidenced by the trend anal-       dition, recent years have witnessed some of the most se-
ysis. Consequently, the relationships between lightning and        vere lightning calamities (according to available records) –
its causative factors have been expressed in the form of mul-      for example, more than 100 lives were lost to lightning on
                                                                   25 June 2020 (Washington Post, 2020).

Published by Copernicus Publications on behalf of the European Geosciences Union.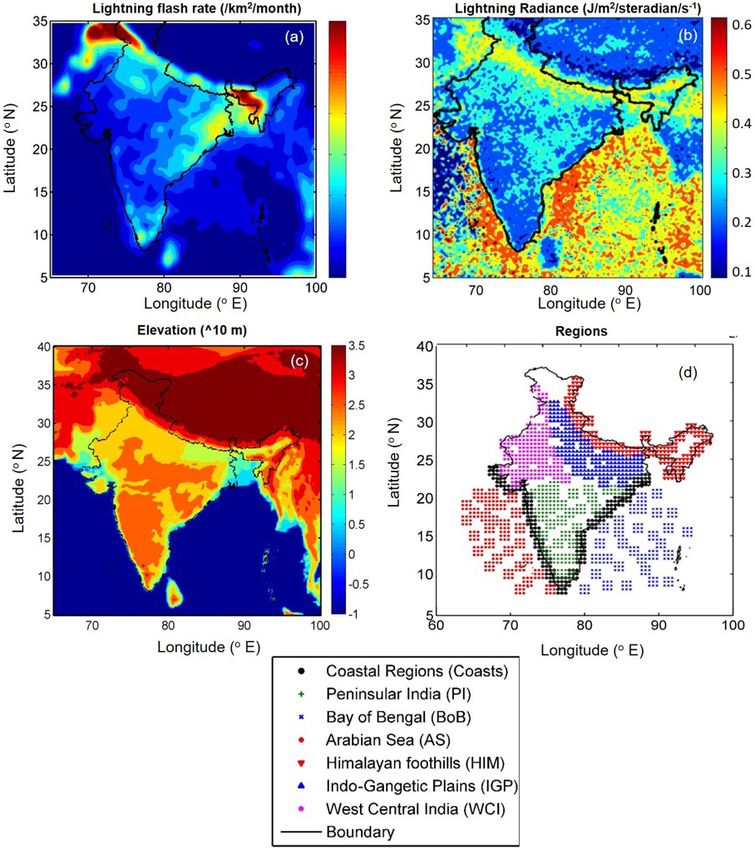
11162                                    R. Chakraborty et al.: Lightning occurrences and intensity over the Indian region

   Over the tropics, the noninductive (collision-based) charg-     to the greenhouse-gas-emission-induced surface warming ef-
ing interaction between ice crystals and graupel particles is      fects both over India and across the globe. A study by Shin-
found to be the major factor behind the evolution of light-        dell et al. (2006) reported that a minimum 10 % increase in
ning events during typical thunderstorms (Takahashi, 1978;         lightning activity can be expected for every 1 ◦ C increase due
Mansell and Ziegler, 2013). Accordingly, in this mechanism,        to global warming. Kandalgaonkar et al. (2005) suggested
the magnitude of charge generated per collision depends on         that a 1 ◦ C rise in surface temperature over India leads to
the relative velocity of the colliding particles, the hydrome-     a 20 %–40 % enhancement in average lightning flash den-
teor concentration of graupel and ice, and their correspond-       sity. According to Riemann-Campe et al. (2009) and Prein et
ing size distributions (Shi et al., 2015); in turn, these fac-     al. (2017), a recent increase in temperature has led to a rise in
tors are controlled by the atmospheric moisture content (total     moisture ingress; consequently, the frequency and severity of
column water vapor), thermodynamic instability (convective         intense convective activity have shown a steep rise globally.
available potential energy) and the possibility of cloud nucle-       Over India, Murugavel et al. (2012) and Chakraborty
ation from aerosols. Additionally, Kumar and Kamra (2012)          et al. (2019) showed a systematic increase in CAPE that
suggested that orographic lifting also has a strong influence      was attributed to thermodynamic instability conditions and
on lightning, although only in limited high-altitude regions       large-scale dynamics coupled with a decrease in upper-
of the Indian subcontinent.                                        tropospheric temperatures during that period. Satellite mea-
   Lightning flashes have been found to be significantly           surements have also shown a prominent increase in aerosol
correlated with convective rain, total column water vapor          concentrations over Asia due to the intense growth in ur-
(TCWV), or surface relative humidity over both land and            banization and industrialization (Massie et al., 2004). Con-
sea regions, according to previous studies (Price and Fed-         sequently, a new set of research attempts have tried to ex-
ermesser, 2006; Siingh et al., 2011; Shi et al., 2018). This       press lightning and thunderstorm severities in form of their
is because higher humidity levels lead to stronger hydrome-        causative factors which are employed in global climate mod-
teor concentration and updraft velocities, both of which con-      els (GCMs) to provide future projections of extreme events
tribute to intense lightning. Moreover, high values of insta-      (Diffenbaugh et al., 2013). Romps et al. (2014) expressed the
bility represented by convective available potential energy        lightning flash rate in terms of the product between CAPE
(CAPE) are essential for lifting the available moisture with       and the precipitation rate which, when implemented in eight
strong updrafts above the freezing level where they form ice       climate models, revealed a 12 ± 5 % increase in lightning per
and graupel particles which collide to initiate charge separa-     1 ◦ C of warming over the USA. Later, a range of other prox-
tion and lightning; this has already been demonstrated both        ies were also used over GCMs for lightning projections, but
theoretically and statistically in various previous research at-   all of them also provided a similar increase in lightning both
tempts (Galanaki et al., 2015; Saha et al., 2017; Dewan et al.,    globally and over the USA (Banerjee et al., 2014; Romps,
2018).                                                             2019). However, as already hinted by Michalon et al. (1999)
   Finally, coming to the impact of aerosol optical depth          many years ago, most of the modeling attempts are expected
(AOD), a study by Shi et al. (2020) reported that the lightning    to fail in providing a holistic understanding of changing light-
flash rates are strongly correlated when AOD < 1 due to the        ning climatology; interestingly, this is also found to be true at
cloud/ice condensation nuclei formation characteristics from       present, as evidenced from major disagreements in the mag-
sulfates (Jin et al., 2018), desert dust (Boose et al., 2019) or   nitude of the projected trends among all of the abovemen-
even sea salt aerosols (de Leeuw et al., 2011). Conversely,        tioned studies.
when AOD > 1, larger concentrations of cloud condensation             With reference to the previous sections, it is understood
nuclei normally result in more supercooled droplets, lead-         that (1) a very few studies on lightning have been carried out
ing to stronger lightning (Williams and Stanfill, 2002). How-      in the tropics, especially over the Indian region (Pereira et
ever, excessively high aerosol concentrations may also result      al., 2010), and none of the remaining attempts have tried to
in reduced cloud droplet size (Twomey et al., 1984) which          depict the future projections of lightning; (2) all of the above-
reduces the efficiency of the noninductive charging process.       mentioned studies have utilized very poor-resolution light-
In addition, an excess of absorptive aerosols (such as black       ning datasets and, hence, did not provide a holistic mecha-
carbon) warms the atmosphere and cools the surface (Kar et         nism behind the climatological variations in lightning evo-
al., 2009; Talukdar et al., 2019) which further reduces the        lution; and (3) none of these attempts have focused on the
CAPE and lightning. Hence, the reported relationships be-          variation in lightning radiance or intensity, which is expected
tween lightning and aerosols are still unclear, and further        to be much more connected with the underlying physical
studies are required to unravel them (van den Heever and           processes compared with the frequency values. Thus, in the
Cotton, 2007).                                                     present study, high-resolution lightning datasets of frequency
   From a climatic point of view, a series of studies in recent    and intensity are used over the Indian region, and an at-
years have shown that thunderstorm severity, lightning and         tempt is made to identify the most dominant factors affect-
its various controlling factors have been increasing promi-        ing the spatiotemporal variability in the lightning properties
nently in the recent decades, and this has been attributed         in a complete manner. Finally, the results of this dominance

Atmos. Chem. Phys., 21, 11161–11177, 2021                                          https://doi.org/10.5194/acp-21-11161-2021
R. Chakraborty et al.: Lightning occurrences and intensity over the Indian region                                            11163

analysis are expressed in the form of a multivariate regres-       basis so that the magnitudes of both these parameters remain
sion analysis and subsequently applied on multi-model GCM          along the same 0–1 scale for simplicity with respect to anal-
datasets to generate reliable future projections of lightning      ysis. However, for ease of region-wise analysis, the yearly
occurrences and intensity over India for the next few decades      time series of both of these parameters has been analyzed on
subject to various urbanization scenarios.                         a fixed grid resolution of 1◦ .
   The paper is structured as follows. A detailed illustration        As we utilize the lightning radiance measurements from
of the various datasets used in this study is given in Sect. 2.    satellite observations, it may be best to explain the impor-
The results section is divided into four subsections: the first    tance of these data for weather and climate because this at-
two subsections (Sects. 3.1 and 3.2) discuss the spatial dis-      tribute has never been extensively discussed in past research
tribution of lightning and its 17-year trends, and they also       attempts (unlike lightning frequency or flash rate). It is well
try to identify the dominant factors responsible for the mul-      known that lightning activity originates due to charge separa-
tidecadal changes in lightning; Sect. 3.3 proposes a proba-        tion in mixed-phase clouds, but it requires a sufficient amount
ble physical mechanism to relate how the recently acceler-         of electrostatic charge to shatter the insolation capacity of the
ated global warming trends can modulate the climatic inten-        atmosphere and descend to the Earth’s surface, thereby caus-
sification and abundance of lightning; and Sect. 3.4 tries to      ing widespread damage to life and property. However, a ma-
implement the abovementioned hypothesis on multiple long-          jority of these lightning occurrences are not strong enough;
term global climate model datasets to provide reliable future      hence, they remain as inter-cloud lightning without any real
projections of lightning intensity and occurrence subject to       impact on the climate or socio-economy. On the other hand,
various degrees of urbanization. In conclusion, Sect. 4 sum-       according to some novel studies like Uman (1986), only
marizes all of the results to produce a simplified picture that    10 %–20 % of total lightning activity remains strong enough
tries to quantify the long-term impacts of global warming on       to reach the ground, thereby inflicting widespread socioeco-
lightning extremes over the Indian region for future policy-       nomic impacts. Consequently, the climatological variation in
makers.                                                            lightning intensity or radiance also needs to be monitored
                                                                   very closely by present policymakers in order to prevent any
                                                                   impending catastrophes in the future.
2   Datasets used                                                     Next, the gridded datasets of the causative meteorolog-
                                                                   ical factors, namely CAPE and TCWV, are utilized from
Lightning observations for the present study are obtained          the Climate Forecast System Reanalysis (CFSR), devel-
from Lightning Imaging Sensors (LISs) aboard the Tropical          oped by NOAA’s National Center for Environmental Pre-
Rainfall Measuring Mission (TRMM) satellite which orbits           diction (NCEP; https://psl.noaa.gov/data/gridded/data.ncep.
the Earth at 350 km elevation between 35◦ N and 35◦ S at a         reanalysis.html, last access: 16 July 2021) datasets (Kalnay
rate of 16 orbits d−1 (Christian et al., 2003). These LISs can     et al., 1996) as provided by the Physical Sciences Division
detect both intra-cloud and cloud-to-ground discharges irre-       of NOAA Earth System Research Laboratory (ESRL PSD)
spective of day or night conditions with a flash detection effi-   for the period from 1948 to 2014. These datasets are pro-
ciency of 73 ± 11 % and 93 ± 4 %, respectively (Boccippio et       vided at a coarse spatial resolution of 2.0◦ × 2.0◦ for CAPE
al., 2002). The lightning observations are done by monitoring      and 2.5◦ × 2.5◦ for TCWV; hence, they had to be interpo-
illumination pulses along the 777.4 nm atomic oxygen mul-          lated to a 1◦ resolution and averaged yearly for subsequent
tiplet with a very fine spatial (5.5 km) and temporal (2 ms)       analysis. The datasets of aerosol optical density (AOD) over
resolution. Every time an illumination pulse registers an in-      the maximum availability period of 2000–2014 are obtained
tensity greater than the predefined background noise level,        from the Level-3 (L3) MODIS Terra Atmosphere Monthly
it is considered as a separate lightning event after which all     Global Product MOD08_M3 at a 1 × 1 grid resolution (Plat-
such events occurring within an integration time of 330 ms         nick et al., 2015) over the Indian subcontinent. Further details
are collectively considered as single lightning flashes. The       can be obtained at https://ladsweb.modaps.eosdis.nasa.gov/
view times of these flashes are also recorded separately in or-    archive/allData/61/MOD08_M3/ (last access: 16 July 2021).
der to obtain the monthly flash rate climatological datasets.      Gridded altitude datasets at a 0.25◦ resolution are taken from
Here, it may be noted that most past studies have used pre-        the GMTED2010 global digital elevation model within the
processed monthly averaged lightning flash rates after 2.5◦        framework of the TEMIS project (Danielsen and Gesch,
and 99 d smoothing of the actual data which may have com-          2011). Finally, the future projections of lightning properties
promised the actual distribution of lightning properties in        for various urbanization scenarios are derived using grid-
those cases. Hence, in this study, the actual lightning obser-     ded datasets of the temperature, humidity and ozone profiles
vations from ∼ 95 800 satellite passes have been utilized dur-     with aerosol optical depth at 550 nm from 11 general circula-
ing the total availability period from 1998 to 2014. These         tion models (GCMs) in the Coupled Model Intercomparison
lightning flash (km−2 ) datasets are compiled monthly and          Project (CMIP5) archive (https://esgf-node.llnl.gov/search/
then averaged annually, whereas the lightning radiance val-        cmip5/, last access: 16 July 2021) during 1950–2100. Further
ues (J m−2 steradian−1 s1 ) are averaged directly on a yearly

https://doi.org/10.5194/acp-21-11161-2021                                        Atmos. Chem. Phys., 21, 11161–11177, 2021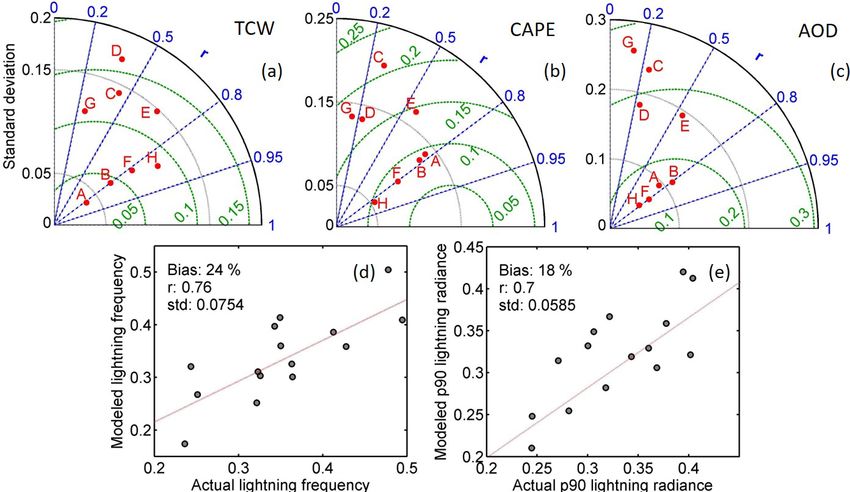
11164                                   R. Chakraborty et al.: Lightning occurrences and intensity over the Indian region

details of these datasets are provided in Taylor et al. (2012)    particularly in the AS (de Leeuw et al., 2011), may also act
and in subsequent sections of this study.                         as a secondary factor. Nevertheless, the AS still experiences
                                                                  lower lightning radiance than the BoB, which is probably due
                                                                  to local meteorological factors as described earlier. Further-
3     Results and discussion                                      more, the lightning radiance values are found to be distinctly
                                                                  lower over peninsular India (PI), western and western cen-
3.1    Spatial distribution of lightning properties               tral India (WCI) and the Himalayan foothills (HIM), as they
                                                                  receive much less moisture than the rest of India. In addi-
The climatological average of lightning frequency shown in        tion, a secondary radiance maximum is observed over the
Fig. 1a depicts much higher values over the land regions          IGP due to moderate moisture supply and aerosols which can
compared with the Arabian Sea (AS) and the Bay of Ben-            act as potential ice condensation nuclei (ICN)/CCN, thereby
gal (BoB). This is due to the occurrence of stronger sensi-       increasing the number of colliding hydrometeors for more
ble heat fluxes over the land regions resulting in stronger up-   lightning radiance.
drafts and, hence, more lightning (Kumar and Kamra, 2012).           Thus, based on these spatial distributions of lightning oc-
The highest magnitude is observed along the foothills of Hi-      currence and intensity, a group of seven regions are proposed
malayas (72–95◦ E) which implies the effect of orographic         for further analysis, as depicted in Fig. 1d: the two coastlines
convection on lightning events. In these regions, the high val-   share high lightning occurrences as well as intensity and are
ues of lightning flashes are found to be associated with the      hereafter referred as “Coasts”; PI is a landlocked region be-
occurrence of a mountain breeze front during the afternoon        tween the abovementioned coasts with moderate values of
hours (Boeck et al., 1999). The secondary spatial maximum         both lightning properties; regions 3 and 4 are the respective
of lightning is observed along the coastline and can be at-       sea regions, namely the BoB and the AS, as their response to
tributed to widespread moisture advection from the adjoining      lightning occurrences and radiances are quite different; the
seas (Kumar and Kamra, 2012).                                     Himalayan foothills are considered to observe the effect of
    The BoB experiences moderately high lightning frequen-        orographic convection on lightning properties independently;
cies due to high sea surface temperatures (SSTs; above a          the IGP is selected as it experiences quite high lightning oc-
critical threshold of 28 ◦ C, according to Gadgil et al., 1984)   currences and intensity due to complex aerosol, instability
which lead to frequent cyclonic storms and lows in this re-       and moisture interactions; and, finally, WCI, a remote inland
gion. However, the AS experiences lower lightning frequen-        region, is considered, as it experiences lower lightning prop-
cies due to lower SSTs in this region (Kumar and Kamra,           erties due to a dearth moisture supply despite an important
2012). Furthermore, low lightning frequencies are observed        contribution from land heating and aerosols.
along the peninsular India due to reduced moisture supply, as        The climatologically averaged distributions of lightning
it is geographical bounded by mountainous terrain along the       frequency and intensity along with the four most potential
coasts from both sides. In addition, moderately high light-       factors influencing them (TCWV, CAPE, AOD and altitude)
ning frequencies are observed along the Indo-Gangetic Plain       are shown in Fig. S1 in the Supplement for different regions.
(IGP), which can be due to the complex interactions among         For lightning frequency, the mean and percentiles are highest
the moderate moisture supply from BoB, local instability,         in the HIM and lowest in PI and the AS. However, the ex-
and the cloud condensation nuclei (CCN) effects from trans-       treme values for the Coasts and WCI are found to be higher
ported (Boose et al., 2019) and emitted aerosols. Finally, very   than HIM because of the frequent cyclonic and low-pressure
low lightning occurrence values are seen over western and         systems that are prevalent in these regions (Fig. S1a). The
western central India (WCI), which can be due to a dearth         lowest lightning frequency is observed over the AS. The radi-
moisture supply despite the contribution from transported         ance and CAPE follow similar variability (i.e., higher values
dust aerosols here.                                               are observed over the BoB and Coasts due to more mois-
    Contrary to the occurrence climatology, the lightning radi-   ture availability and thunderstorm occurrences, whereas the
ance values (Fig. 1b) are much lower over majority of land        other regions experience low to moderate values; Fig. S1b).
regions, which is solely due to higher moisture content val-      However, a lot of extremes are observed in the IGP and WCI
ues over the coastal regions leading to more graupel (ice         which implies that the occurrence of surface heating leads to
and hail particle concentrations above the freezing layer), as    higher cloud-base heights and more ice-phase hydrometeors,
shown in Murugavel et al. (2012). Yet, the maximum radi-          resulting in more lightning in these regions, as also supported
ance values are observed exactly along the coastline regions      from previous studies (Price, 2009; Shindell et al., 2006).
and decrease gradually as one moves further into the seas.           The total moisture content (TCWV) is found to be highest
This indicates the importance of the thermal land–sea con-        along the Coasts and adjoining sea regions based on lightning
trast which causes strong moisture advection from both land       occurrences and intensity. Incidentally, the remote inland lo-
and sea breezes along the land–sea boundary (Pielke, 1974),       cations like PI and WCI receive a much reduced moisture
resulting in more hydrometeors and, hence, the largest radi-      supply, which is the primary reason behind the lower light-
ance. However, the presence of giant CCN marine aerosols,         ning radiances in those regions. The IGP and WCI regions

Atmos. Chem. Phys., 21, 11161–11177, 2021                                         https://doi.org/10.5194/acp-21-11161-2021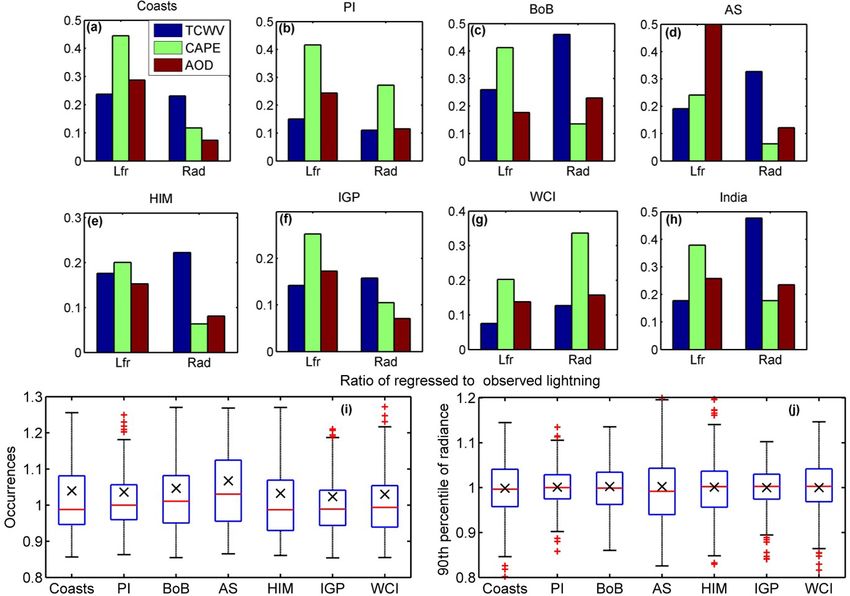
R. Chakraborty et al.: Lightning occurrences and intensity over the Indian region 11165
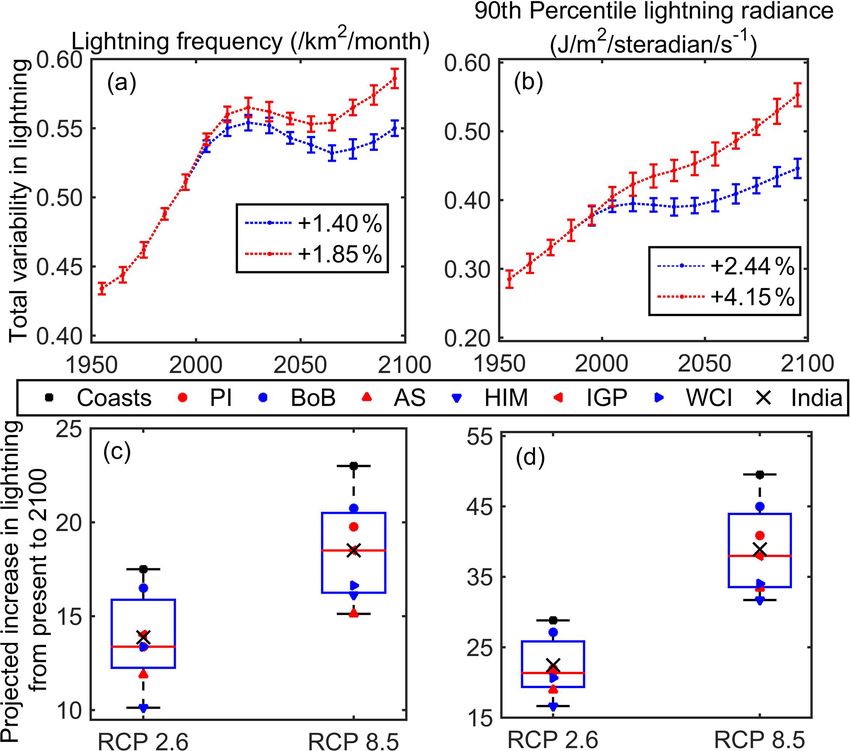
Figure 1. Climatological mean (a) lightning flash rate and (b) lightning radiance over India averaged from 1998 to 2014; (c) altitude above
mean sea level on a base 10 logarithmic scale (seas denoted by −1); and (d) the representation of the seven regions used in the study.
show the highest AOD values due to dust transport from ported by various past research attempts (Barros and Lang,
the Thar and Sahara deserts along with large-scale emissions 2003).
from various anthropogenic activities which have very com-
plex impacts on convection. Likewise, the Coasts also receive 3.2 Temporal variation in lightning properties
a moderate aerosol supply from the adjoining seas, as pre-
viously described, which further supports lightning forma- 3.2.1 Long-term trends in lightning frequency and
tion. The HIM region depicts the highest altitudinal varia- intensity over the Indian region
tion among all of the regions, with a significant fraction of
the area inside the HIM present above 4 km height, thereby The 17-year time series showing variations in the mean an-
supporting widespread orographic-lifting-induced lightning nual lightning frequency and radiance are depicted for seven
activity. In contrast, PI and IGP exhibit an infinitesimally regions as well as all of India in Fig. S2 along with their re-
small altitudinal variation (< 500 m) which may not be suffi- spective standard error values. Robust-fit regression analysis
cient to support any orographic convection.In WCI, the alti- is employed to study whether there are any statistically sig-
tude ranges are considerably higher which, in turn, provides nificant trends in the lightning frequency and radiance. At the
a small but vital contribution towards lightning, as also sup- same time, a detailed description regarding the yearly trends
(in percent) of lightning properties and their controlling fac-
https://doi.org/10.5194/acp-21-11161-2021 Atmos. Chem. Phys., 21, 11161–11177, 2021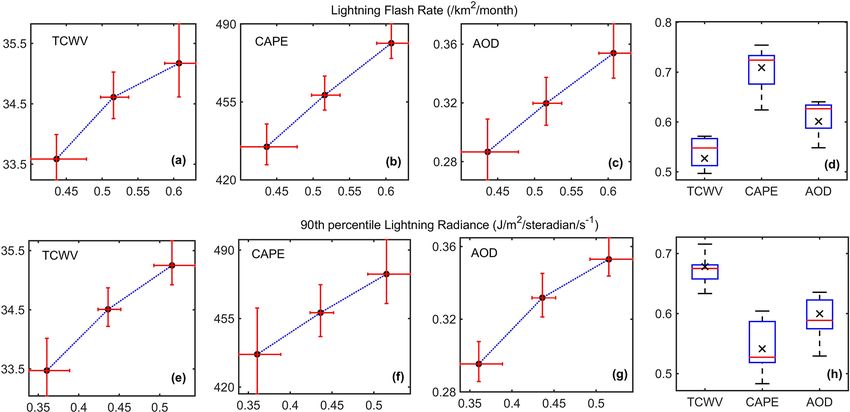
11166                                    R. Chakraborty et al.: Lightning occurrences and intensity over the Indian region

tors (TCWV, CAPE and AOD) are depicted along with their            porting the suitability of using the 90th percentile (p90) of
corresponding correlation coefficients in Fig. 2. The trends       radiances only in the subsequent sections.
in lightning frequency are found to be the highest over the           The trends in TCWV (Fig. 2a) are uniform (0.3 % yearly or
Coasts, the BoB and the AS (with a total increase of ∼ 30 %)       5 % in total) across all regions with decent correlation values;
with reasonably high correlation coefficient values, which         these trends are expected to increase in all regions due to the
can again be attributed to an increase in both moisture con-       prominent greenhouse-gas-emission-induced global warm-
tent and instability in these regions. However, the other re-      ing, as has already been observed in previous studies for
gions depict much weaker values of both of these quantities.       all of the abovementioned Indian areas except HIM. CAPE,
Here, it is interesting to note that the IGP depicts a much        which represents the atmospheric instability, is the main rea-
weaker lightning trend which may be due to complex aerosol         son for lightning evolution; hence, this parameter also depicts
interactions, as explained before. However, in total, India has    strong interzonal variability like lightning. The Coasts and
faced a ∼ 25 % increase in lightning frequency (with very          sea regions experience a much stronger increase of ∼ 9 % in
high correlation values) in these 17 years, which is alarming      17 years, implying more thunderstorm activity in the present
and will be discussed in detail later in this paper.               due to a prominent global-warming-induced land–sea ther-
   The mean annual lightning radiances show gradually in-          mal contrast. However, the rest of the country exhibits a
creasing trends (with a total increase of ∼ 20 %) in almost all    much weaker increase (∼ 5 %). Further, the trends in the IGP
regions. However, the magnitudes of the trends (in percent)        and WCI are even lower due to the complex aerosol effect.
as well as the correlation coefficients are much lower com-        Finally, AOD is found to increase most significantly through-
pared with the lightning frequency which implies that aver-        out India compared with the other parameters; however, the
age radiance may not be a suitable parameter to investigate        southern Indian maritime regions experience a much lower
the future variations in lightning. It is known that, TRMM         rise of ∼ 25 % compared with deep inland regions (WCI and
observes both cloud–cloud and cloud–ground types of light-         IGP), with a ∼ 40 % increase indicating that aerosols may
ning strikes together, and of these lightning strikes, only the    only play a more dominant role in modulating the trends
strongest 10 % of the total strikes are intense enough to reach    in lightning properties in the continental northern Indian re-
the ground in the tropics (Uman, 1986) and cause immense           gions.
damage to life and property (Holle et al., 2019). Now, as it
is more important to understand the trends in these extreme        3.2.2   Investigation of the dominant factors affecting
cases, the regional trends in 90th percentile of lightning radi-           the lightning trends over India
ances are examined (Fig. 2a). The trends depict a very promi-
nent India-wide trend of ∼ 30 % with higher correlation val-       The previous sections depict a series of spatially varying
ues compared with the mean lightning radiance (Fig. 2b).           complex interactions among TCWV, CAPE and AOD that
Additionally, the coastal and sea regions depict much higher       resulted in an increasing trend in both of the abovementioned
trends (> 40 %) than the rest of India, which is extremely         lightning properties over the Indian region. In order to iden-
alarming for policymakers at present. The HIM region, how-         tify the most dominant factors affecting the trends in light-
ever, has not shown any change in lightning radiance which         ning, a clustering analysis was carried out for each Indian
may due to the marginal increase in TCWV and CAPE there.           region. Hence, the lightning datasets are taken for a 15-year
   Further, we investigate whether the proposed 90th per-          time span (as AOD data are absent before 2000) and are then
centile of radiance also agrees well with the distribution of      sorted into three clusters based on magnitude. The mean and
mean radiances over every Indian region; hence, the corre-         deviation of these clusters are depicted in Figs. S4 and S5
sponding values of both the quantities for a total span of 68      with respect to the corresponding values of TCWV, CAPE
seasons in 17 years are shown in Fig. S3. The figure depicts       and AOD. Factors with a dominant influence are identified
that the southern Indian regions, namely the BoB, Coasts, PI       as those whose parameter mean increases sharply with the
and AS (with stronger maritime influence), exhibit prominent       clusters with minimal mutual overlapping.
correlation values between the two groups, the average ratio          The analysis revealed that CAPE and AOD depict good
between the two is ∼ 1.2, and there is also a minimal amount       clustering for occurrences, whereas TCWV shows the best
of spreading, which indicates that there are no external fac-      results for radiances over the Coasts and BoB. The AS also
tors affecting the average radiance distribution. However, the     behaves similarly, but in the case of occurrences, AOD fares
northern inland zones depict a prominent scattering between        slightly better than the others, implying a dominant contri-
the groups (especially in IGP), and the ratio between them is      bution from CCN-forming marine aerosol transport in this
also much higher (∼ 1.4), which indicates that some external       region. PI experiences less moisture ingress (due to its in-
factors such as aerosols may also exert an additional impact       land location); hence, it relies more on dry convection which
in intensifying the radiance values well above the average         makes CAPE the major governing element for both of the
radiance distributions. Nevertheless, good overall agreement       lightning properties. No single factor is observed to be dom-
is seen between the lightning radiance groups, thereby sup-        inant for lightning frequency in HIM, as it mainly relies on
                                                                   orographic convection processes, as already explained in pre-

Atmos. Chem. Phys., 21, 11161–11177, 2021                                          https://doi.org/10.5194/acp-21-11161-2021
R. Chakraborty et al.: Lightning occurrences and intensity over the Indian region                                                    11167

Figure 2. (a) Yearly trends (in percent) in lightning flash rate (Lfr), average radiance (Rad) and 90th percentile of radiance (Radp90) with
TCWV, CAPE and AOD over seven regions and over the entire Indian region; (b) correlation coefficients corresponding to these trend values.

ceding sections. However, for radiance, TCWV still remains              two equations are hypothesized where lightning frequency
a dominant factor (Fig. S5). For the IGP, CAPE exhibits fair            and radiance are expressed separately as a multilinear addi-
linear clustering in occurrence, whereas TCWV remains de-               tion of all three controlling factors. The proposed equations
pendable for intensity. WCI behaves similarly to PI, but a              can be expressed as follows:
secondary influence of AOD is also observed in this region,
                                                                        lightning frequency = a1 · TCWV + b1 · CAPE
indicating the possible impact of transported dust (acting as
ICN) which catalyzes the formation of ice-phase hydromete-                                     + c1 · AOD;                              (1)
ors, leading to more frequent and stronger lightning events.            lightning intensity = a2 · TCWV + b2 · CAPE
   The clustering analysis is then performed over the en-
                                                                                             + c2 · AOD.                                (2)
tire Indian region and is shown in Fig. 3. Based on cluster-
ing and correlation analysis for lightning frequencies, CAPE            Here, a, b and c represent the corresponding multiple linear
emerges as the dominant factor, followed by AOD. This                   regression (MLR) coefficients for the three factors, and the
can be supported theoretically, as the generation of light-             numbers 1 and 2 stand for lightning frequency and radiance,
ning events only requires the availability of ice-phase hy-             respectively. The corresponding variation in these MLR co-
drometeors above the freezing level which is achieved mainly            efficients is shown in Fig. 4. CAPE is the most dominant fac-
by the lifting mechanism due to CAPE followed by the                    tor in all of the regions except over the AS where the AOD
aerosol CNN effect. On the other hand, in the case of p90               influence is very high. AOD is the second most dominant pa-
radiance, based on clustering and correlation coefficients,             rameter with respect to lighting frequency (except over the
TCWV emerges as the single dominant feature behind the                  BOB and HIM). For radiances, the TCWV is the dominant
strong rise in lighting radiances all over India. This result can       factor in most regions (except over PI and WCI). The reasons
also be explained theoretically, as the inductive/noninductive          for this were discussed in the previous section. Again, similar
charging density responsible for lightning radiance is far              to the AS, AOD plays the most significant role in modulating
more dependent on the local hydrometeor concentrations                  both of the lightning properties over IGP due to the role of
(arising from moisture abundance) than on their relative ver-           complex aerosol–cloud interactions.
tical velocities (controlled by CAPE). Interestingly, AOD has              Finally, over the India-wide region, TCWV arises as the
consistently maintained a complex secondary impact on both              dominant parameter controlling the climatic trends in ra-
the lightning properties with respect to its tendency to either         diances; however, for occurrence it is not that simple. Al-
favor lightning (by creating more ICN/CCN formation due                 though CAPE is the principal factor with respect to occur-
to dust or sulfate aerosols) or disfavor lightning (by inducing         rence, the relative contributions of AOD and TCWV cannot
a cloud burn-off effect due to black carbon aerosols), as al-           be neglected. Next, the applicability of the proposed MLR
ready discussed in preceding sections. Thus, a detailed study           equations for long-term studies are validated by showing the
needs to be undertaken to untangle the AOD effect in aerosol-           ratio between the regressed and observed lightning proper-
sensitive zones like the IGP and WCI.                                   ties (Fig. 4i, j). For occurrences, the ratio between the two
   The temporal dominance analysis is then repeated quanti-             is not perfect, and a small overestimation of ∼ 5 % is ob-
tatively using a multilinear regression analysis. In this step,         served; hence, this bias has been corrected before using the

https://doi.org/10.5194/acp-21-11161-2021                                               Atmos. Chem. Phys., 21, 11161–11177, 2021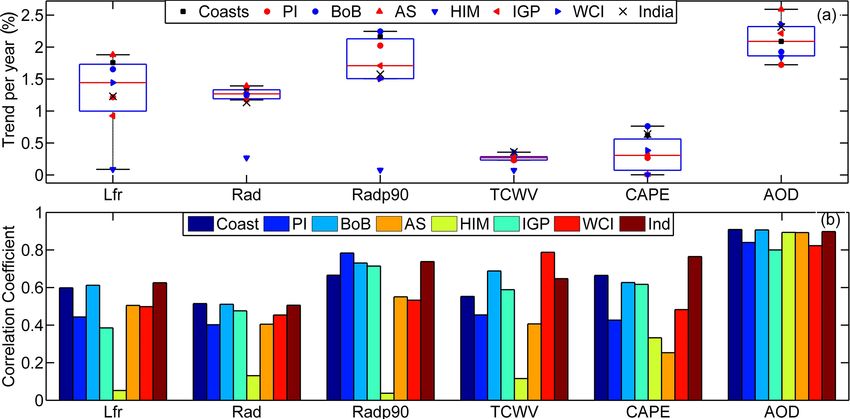
11168                                       R. Chakraborty et al.: Lightning occurrences and intensity over the Indian region

Figure 3. Temporal dominance cluster analysis results of lightning frequency and extreme radiances with respect to (a, e) TCWV, (b, f) CAPE
and (c, g) AOD over the entire Indian region; (d, h) the distribution of the correlation coefficient due to zonal clustering for both lightning
parameters.

Figure 4. Temporal dominance analysis MLR coefficients of TCWV, CAPE and AOD for lightning frequency and radiance over the
(a) Coasts, (b) PI, (c) BoB, (d) AS, (e) HIM, (f) IGP, (g) WCI and (h) India-wide regions. (i, j) The zonal distribution of ratios between the
regressed and observed lightning frequency (Lfr) and the 90th percentile of radiance (Radp90) over seven Indian regions.

Atmos. Chem. Phys., 21, 11161–11177, 2021                                                   https://doi.org/10.5194/acp-21-11161-2021
R. Chakraborty et al.: Lightning occurrences and intensity over the Indian region                                       11169

data in the coming sections. The regressed values of radi-       olet radiation (Mohanakumar, 2008). The multi-station ra-
ance, in contrast, match perfectly with observations. Hence-     diosonde observations from Chakraborty et al. (2019) de-
forth, these MLR equations have been utilized for deriving       picted a clear rise in specific humidity and a decrease in
the long-term projections of lightning properties in the sub-    ozone mixing ratios within the same height range. These
sequent sections.                                                results were analogous with the findings from Forster et
                                                                 al. (2007), who reported that the recent decades have ex-
3.3   Physical mechanisms driving the increasing trends          perienced an upper-tropospheric cooling due to a decrease
      in lightning properties                                    in ozone concentration. Thus, a cooling trend at this height
                                                                 level can be explained by the theory that excess moisture
In this section, the physical processes responsible for the      pumped to this height by intense convection becomes pho-
increase in lightning occurrences and intensity over the In-     tolytically disassociated by reactive oxygen atoms to pro-
dian region will be discussed. Recent studies have shown a       duce two OH radicals, which further decompose ozone to an
prominent increase in aerosols and greenhouse gas (GHG)          oxygen molecule, and a reactive oxygen atom in the UTLS
emissions over the Coasts, IGP and WCI, as evidenced by          region (Guha et al., 2017), thereby continuing the process.
the very strong increase in AOD in the recent years. This        Consequently, this feedback process would lead to a further
phenomenon resulted in widespread surface and atmospheric        ascent in EL and increase in CAPE; however, the magnitudes
warming (Basha et al., 2017) and, consequently, stronger sur-    of the resultant CAPE intensification will be highest over the
face evaporation and moisture production. In addition, many      coasts and surrounding seas due to stronger moisture advec-
recent research attempts have reported a net increase in the     tion in those regions.
Hadley cell and Brewer–Dobson circulation strength (Liu             Thus, according to this hypothesis, the Coastal regions and
et al., 2012; Fu et al., 2015), which also provide additional    seas experience more growth in TCWV and CAPE, lead-
moisture supply. Consequently, the increased moisture in the     ing to the formation of more ice-phase hydrometeors and,
atmosphere has further accelerated the warming effect and        in turn, promoting an accelerated rise in lightning radiance.
TCWV growth in the form of a positive feedback (IPCC             On the other hand, larger CAPE values favor higher updraft
TAR-07, 2001), primarily in the Coasts and neighboring sea       velocities in the ascending particles which further increase
regions like the BoB and AS. However, the increased mois-        the probability of hydrometeor collisions, leading to an in-
ture supply in IGP or PI is mainly due to the enhanced land–     creased lightning frequency. However, an additional effect
sea thermal contrast effect (due to GHG and aerosol emis-        can also be cast by AOD via the facilitation of more CNN
sions) which intensifies the moisture converges in these re-     formation (from dust, sulfate or sea salt aerosols) which will
gions.                                                           strengthen the abovementioned physical mechanism, thereby
   To explain how thermodynamic instability or CAPE has          leading to a stronger increase in both of the lightning prop-
been increasing recently, the reader is referred to a previous   erties over the aerosol-sensitive inland regions such as IGP,
study by Chakraborty et al. (2019) in which long-term multi-     WCI and PI.
station radiosonde observations depicted strong increasing
trends in CAPE and TCWV over the entire Indian region with       3.4     Generation of reliable future projections of
the maximum values along the coasts and surrounding inland               lightning frequency and intensity
regions. However, out of the total column, the percentage
trends in both instability and moisture integrals (CAPE or       3.4.1    Selection of GCMs for future projection analysis
TCWV) are found to be particularly high above the 300 hPa
pressure levels which can be associated with a gradually as-     In this section, the MLR coefficients from the previous sec-
cending level of neutral buoyancy (LNB/EL – level of neutral     tions are employed to provide reliable projections of future
buoyancy/equilibrium level) during this period. As the EL        lightning activity over the Indian region. Accordingly, the
comes very close to the 100 hPa level during intense convec-     datasets of CAPE, AOD and TCWV are utilized over a period
tive events, an observed cooling in its immediate surround-      of 150 years: the first 55 years (1950–2005) from historical
ings (135–95 hPa) is thought to be the main factor respon-       datasets and the rest (2006–2100) from two extreme future
sible for the EL ascent and CAPE increase in these regions.      scenarios, namely RCP2.6 and RCP8.5. A set of eight global
The main reason for considering this hypothesis is based on a    climate models (GCMs) from CMIP5 (depicted in Supple-
study by Dhaka et al. (2010) in which a very prominent anti-     ment Table S1) are selected for analysis, as all of them com-
correlation was observed between the yearly average values       monly provide the monthly mean estimates of TCWV and
of CAPE and their corresponding upper-tropospheric tem-          AOD with daily profiles of temperature, humidity and ozone.
peratures at 100 hPa.                                            The monthly average values of CAPE are then calculated
   It has been well documented in past studies that ozone        from daily T and RH profiles using the parcel approximation
molecules act as the primary heat source component at            technique, as described in past studies (Chakraborty el al.,
the 100 hPa level (corresponding to the upper-troposphere–       2018; Narendra Reddy et al., 2018). It may be noted that the
lower-stratosphere – UTLS – region) by absorbing ultravi-        surface-based CAPE (SB-CAPE) calculation technique has

https://doi.org/10.5194/acp-21-11161-2021                                       Atmos. Chem. Phys., 21, 11161–11177, 2021
11170 R. Chakraborty et al.: Lightning occurrences and intensity over the Indian region
been used to obtain the current CAPE values in this study, served (∼ 0.5 % per decade) which represents a total India-
as they measure the total buoyancy experienced by the par- wide warming of ∼ 1.6 ◦ C, whereas the RCP8.5 scenario ex-
cel raised directly from the surface to any height in the at- hibits an extremely severe warming of ∼ 5 ◦ C in the Coasts,
mosphere irrespective of the prevailing atmospheric condi- WCI, BoB and IGP regions which is also expected to cause
tions, seasonality or the region where it is being derived. The a parallel increase in TCWV and CAPE in the future. In a
datasets from each of these models are interpolated to a uni- similar fashion to surface warming trends, TCWV exhibits a
form 1◦ × 1◦ resolution after which their performances are moderate increase in the RCP2.6 scenario, but an alarming
tested by comparing the simulated CAPE, TCWV and AOD growth of ∼ 40 % is observed across India in RCP8.5 (with
values against the NCEP/NCAR Reanalysis datasets. The re- the largest increase noted in the Coasts, the BoB and the AS
sults of this test are represented using a Taylor diagram in regions) that will definitely lead to a parallel huge change in
Fig. 5. extreme lightning radiances over the total span of 150 years.
The Taylor diagram results for TCWV, CAPE and AOD In the case of AOD, contrary to the extremely large
unanimously reveal that the ACCESS1.3, CSIRO MK3.6, increase of ∼ 30 %–40 % between 2000 and 2014 from
MIROC5 and NOESM 1ME models (represented as A, B, MODIS, a much smaller rise of only 20 % is seen during a
F and H in Fig. 5) depict good correlations over the Indian much larger time span of 150 years. To understand the source
region along with lower SD and rms values. In addition, of this discrepancy, the 150-year time series of AOD is ob-
the model-derived monthly inputs are also validated against served. This time series reveals that the initially increasing
NCEP data for all seven regions in Fig. S6. The correla- trend in aerosols reverses to a strong negative trend after
tion coefficients for all regions commonly show that the AC- 2020, which results in an overall weak positive trend. The
CESS1.3, CSIRO MK3.6, MIROC5 and NOESM 1ME mod- sudden decline in AOD can be explained by the fact that
els again display much better agreement with NCEP data. RCP2.6 scenarios are characterized by a stringent control on
Hence, these four models are considered further for light- GHG emissions and aerosols after 2020. However, RCP8.5
ning projection analysis. The India-wide averaged regressed scenarios exhibit a higher overall increasing trend amount-
lightning occurrences and intensity values obtained from the ing to 60 %. This improvement in the AOD trend from the
models during the 2000–2014 period are then plotted against latter case is due to the fact that the AOD value saturates after
their corresponding observations to check the reliability of 2020 and then shows a weak negative trend, implying minor
the MLR analysis on the modeled data. The results depict aerosol emission restrictions in the future; hence, the net can-
a fair agreement between the two sets (r = of 0.76 in occur- cellation of trends does not happen here. Moreover, the net
rences and 0.7 in radiance) in both the cases. However, a very increase in AOD is moderate in the Coasts but is much higher
prominent underestimation bias has been observed (∼ 24 % in aerosol-sensitive regions like IGP and WCI, even imply-
in occurrences and ∼ 18 % in radiances) which is probably ing a doubling of AOD in these regions, which may again
because the modeled datasets are of much coarser resolu- cast some vital influence on the lightning frequency trends in
tion than the actual observations; hence, they will always de- these regions in the future.
pict a much lower average or less variability compared with In accordance with the TCWV and temperature trends,
the former. However, the intercomparisons between the mod- CAPE and MLCAPE (mixed-layer CAPE) depict a respec-
eled and observed lightning properties over all of the regions tive 15 % and 8 % increase in total from RCP2.6 scenarios.
commonly depict quite high correlation values with an over- Furthermore, the CAPE trends are much higher than in ML-
all underestimation bias of 17 %–25 %, thereby supporting CAPE, indicating the validity of the upper-tropospheric in-
the reliability of the MLR analysis. Nevertheless, the under- tensification theory as explained earlier. Again, the trends
estimation biases obtained from intercomparison tests must in CAPE and MLCAPE are the highest over the Coasts and
be added to the regressed climatic projections for both the surrounding regions due to maximized moisture availability,
zonal and India-wide cases to get the actual lightning trends as also shown in the previous studies. However, the RCP8.5
in forthcoming sections. scenario shows alarmingly high total trends of ∼ 50 % and
20 % in CAPE and MLCAPE, respectively, due to intensified
3.4.2 Examination of the 150-year trends in various global warming and moisture availability, with the highest
factors controlling lightning rise of ∼ 60 % over the Coasts and seas, implying the possi-
bility of accelerated growth in lightning occurrence in these
The 150-year trends in various controlling factors associ- zones. However, inland regions (IGP and WCI) still show
ated with the climatic trends in lightning occurrences and moderately high CAPE trends (due to strong surface heating
intensity are shown in form of the normalized percentage and aerosol trends) which may also lead to stronger lightning
change per decade for all seven Indian regions in Fig. S7. frequencies there.
The surface temperature trends are first considered, as this The trends in the EL pressure level show an expected de-
parameter is closely associated with urbanization and GHG pletion (implying an ascent in the EL) from the RCP2.6 sce-
emissions, and it also acts as the primary driver behind the nario, with values between 0.5 % and 1 % per decade. How-
CAPE and TCWV trends. A moderate rise in RCP2.6 is ob- ever, in the RCP8.5 scenario, the trends are further enhanced
Atmos. Chem. Phys., 21, 11161–11177, 2021 https://doi.org/10.5194/acp-21-11161-2021R. Chakraborty et al.: Lightning occurrences and intensity over the Indian region 11171
Figure 5. Taylor diagram representing the performance of the eight GCMs used in this study with respect to (a) TCWV, (b) CAPE and
(c) AOD. (d, e) Covariation between regressed lightning properties from the model mean with respect to observations for average flash rate
(km2 per month) and the 90th percentile of radiance (J m−2 steradian−1 s1 ).
with a range of 1 %–2 % per decade, with the largest changes its drastic increase in the latter case after 2050, which is again
occurring in the Coasts and BoB regions followed by IGP attributed to the accelerated global warming conditions ex-
and WCI due to a stronger increase in CAPE and TCWV. perienced using RCP8.5 scenarios during those decades. The
Similarly, the temperature at 100 hPa (T100) cooling trends AOD follows a dampened increasing trend in both scenar-
experience very similar behavior to the EL with ∼ 1◦ cool- ios with the increase in latter being slightly more prominent
ing in Coastal regions from the RCP2.6 scenario, whereas than the former. These dampened AOD trends are expected
a drastic total cooling of up to ∼ 2 ◦ C is observed in the to reduce the net growth in lightning occurrences (owing to
RCP8.5 scenario that can highly invigorate the convective the prominent AOD contribution in the lightning frequency
strength, leading to much stronger lightning events in the fu- MLR coefficients), but such effects will not be discernible
ture. In the RCP2.6 scenario, the specific humidity (SHUM) in the radiance trends as they primarily depend on TCWV.
at 100 hPa undergoes a ∼ 0.3 % increase per decade associ- Now, due to the CAPE and TCWV trends, the EL has shown
ated with a 1 % decrease in ozone. Here, it may be noted a prominent ascent coupled with strong UTLS cooling and
that the ozone depletion trends are only much higher than in increased moistening and ozone depletion trends in both ur-
SHUM because the photolytic disassociation of a single wa- banization scenarios. However, the trends in the RCP8.5 sce-
ter vapor molecule with reactive oxygen atom produces two nario are consistently much stronger than in the RCP2.6 case
OH radicals which help in the decomposition of two ozone due to much stronger GHG-induced UTLS dynamics and the
molecules. However, using the RCP8.5 scenario, this phe- CAPE intensification feedback effect. In addition, the main
nomena is further amplified where a −0.6 % per decade in- difference between the trends from both scenarios is mostly
crease in SHUM and a (−2 %) depletion in ozone are ob- prominent towards the end of 21st century, as explained pre-
served, with the highest magnitudes noted in the Coasts. viously.
Hence, the results suggest that CAPE and TCWV will both
increase under higher surface warming (RCP8.5) scenarios, 3.4.3 Expected overall trends in lightning frequency
as shown in Sect. 3.3, which ultimately results in a very and intensity
strong increase in lightning properties over India.
Coexistent with the zonal decadal trends, the India-wide
The 150-year trends in lightning properties for all seven In-
time series of all parameters are shown in Fig. 6. The sur-
dian zones are observed in Fig. S7. The lightning occurrences
face temperatures depict an increase of 2 and 4 ◦ C, while
depict an overall increasing trend of ∼ 15 %–25 % for the
the TCWV and CAPE also rise by 10 % and 50 % and by
total 150-year span which, after adjustment for underesti-
20 % and 40 %, respectively, for the two pathways. However,
mation bias (20 %–27 % as in Fig. S6), provides an actual
it may be noted that the main difference in TCWV trends be-
trend of 19 %–31 %. However, this increase in lightning oc-
tween the RCP2.6 and RCP8.5 scenarios mainly arises from
currence is rather low compared with the 17-year trends from
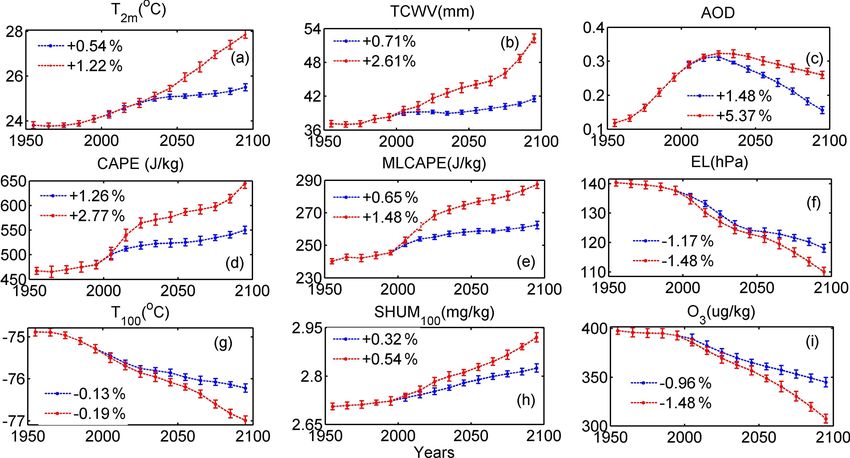
https://doi.org/10.5194/acp-21-11161-2021 Atmos. Chem. Phys., 21, 11161–11177, 202111172 R. Chakraborty et al.: Lightning occurrences and intensity over the Indian region Figure 6. The 150-year multi-model India-wide average projections of various parameters using the RCP2.6 (blue) and RCP8.5 (red) sce- narios for (a) the 2 m temperature, (b) TCWV, (c) AOD, (d) CAPE, (e) MLCAPE, (f) EL, (g) the temperature at 100 hPa, (h) the specific humidity and (i) the ozone mixing ratio at the same level. Legends indicate the 5-yearly linear significant trends in these parameters. observations. Hence, the lightning frequency time series for throughout the 150 years, coupled with a weaker decline in each zone is investigated separately. This investigation re- AOD. In addition, the lightning radiance trends are found veals that the lightning frequency increased until 2020 af- to be the strongest in the Coasts and BoB regions, due to ter which it became saturated; nevertheless, after 2050, it the accelerated rise in TCWV and CAPE, whereas a slightly again started to increase up until 2100, thereby leading to weaker trend is observed over IGP and WCI, due to the com- much lower trend values (Fig. 6). This type of variation can pensating influence of AOD in addition to the TCWV and be explained by the secondary influence of AOD on light- CAPE trends. ning occurrences which also shows a dampened increase, In a similar fashion to the zonal decadal lightning trends, thereby compensating for the impact of increasing CAPE. the India-wide averaged time series of lightning occurrences In addition, among all of the areas, the strongest increase in and intensity are depicted in Fig. 7. The lightning occur- lightning frequency is mainly observed in the Coasts, BoB, rences from the RCP2.6 scenarios depict a weak increasing PI, IGP and WCI regions; this is primarily due to the influ- trend amounting to 26 % (after bias correction of 24 %) over ence of CAPE and the moisture supply in the first two ar- the 150-year time span. As already explained, the weak trend eas and due to dry surface heating and the aerosol effect in observed is due to the cancellation effect between increas- the other regions. However, in the RCP8.5 scenarios, much ing trends of CAPE and TCWV against a declining trend larger trend values of 29 %–41 % are observed (after bias cor- in AOD. However, in the RCP8.5 scenario, a considerable rection), which are mainly attributed to the stronger increase increase in lightning frequency amounting to 35 % is ob- in CAPE and TCWV and the weaker decline in AOD in this served, which is mainly due to a strong rise in CAPE and case. However, the spatial distribution of the trends remains TCWV along with a weaker decline in AOD. For extreme similar to the RCP2.6 case. radiances, the RCP2.6 scenario shows a moderate rise of The 150-year zonal trends in lightning radiance from the ∼ 45 % throughout India (after a bias correction of 18 %). RCP2.6 scenarios depict a prominent overall increasing trend However, the RCP8.5 scenario depicts a much higher in- of 35 %–54 % after zone-specific bias corrections. Here, the crease of ∼ 73 % due to the much stronger rise in TCWV radiance trends are found to be much higher than those for and CAPE, followed by a minimal contribution from AOD. occurrences, as the lightning radiance trends primarily de- In addition, an exponential rise in both TCWV and CAPE pend on TCWV which also shows a prominent increase are observed after 2060 because of excessive GHG-emission- across the 150-year time span. However, the net radiances are induced global warming, thereby leading to the highest in- still a bit lower than the expected trends from observations crease in lightning radiance over India after 2060. due to the small declining trend contribution from aerosols. Finally, an attempt is made to estimate the net percent- Nevertheless, the RCP8.5 scenario depicts a very alarming age increase in lightning properties starting from the present increase of 56 %–97 % (after bias correction) that can be at- (2010–2020) in order to describe the probable difference in tributed to the stronger increase in both TCWV and CAPE, lightning trends if two extreme GHG emission policies are Atmos. Chem. Phys., 21, 11161–11177, 2021 https://doi.org/10.5194/acp-21-11161-2021
You can also read