Does Semantic Context Benefit Speech Understanding through "Top-Down" Processes? Evidence from Time-resolved Sparse fMRI
←
→
Page content transcription
If your browser does not render page correctly, please read the page content below
Does Semantic Context Benefit Speech Understanding
                         through “Top–Down” Processes? Evidence from
                                   Time-resolved Sparse fMRI

                                                                 Matthew H. Davis1, Michael A. Ford1,2,
                                                                Ferath Kherif 3, and Ingrid S. Johnsrude4

                                                                                                                                                                                 Downloaded from http://mitprc.silverchair.com/jocn/article-pdf/23/12/3914/1776985/jocn_a_00084.pdf by guest on 18 May 2021
                 Abstract
                 ■ When speech is degraded, word report is higher for semanti-                             provides evidence of hierarchical organization, with earlier re-
                 cally coherent sentences (e.g., her new skirt was made of denim)                          sponses in peri-auditory regions of the posterior superior temporal
                 than for anomalous sentences (e.g., her good slope was done in                            gyrus than in more distant temporal and frontal regions. Despite
                 carrot). Such increased intelligibility is often described as result-                     Sentence content × SNR interactions in the superior temporal gy-
                 ing from “top–down” processes, reflecting an assumption that                              rus, prefrontal regions respond after auditory/perceptual regions.
                 higher-level (semantic) neural processes support lower-level (per-                        Although we cannot rule out top–down effects, this pattern is more
                 ceptual) mechanisms. We used time-resolved sparse fMRI to test                            compatible with a purely feedforward or bottom–up account, in
                 for top–down neural mechanisms, measuring activity while par-                             which the results of lower-level perceptual processing are passed
                 ticipants heard coherent and anomalous sentences presented in                             to inferior frontal regions. Behavioral and neural evidence that
                 speech envelope/spectrum noise at varying signal-to-noise ratios                          sentence content influences perception of degraded speech does
                 (SNR). The timing of BOLD responses to more intelligible speech                           not necessarily imply “top–down” neural processes. ■

                 INTRODUCTION
                                                                                                           and syntactic integration processes are associated with
                 Comprehending spoken language requires a complex se-                                      activation of temporal and frontal regions that are more
                 quence of perceptual and cognitive processes to convert                                   distant from primary auditory cortex (Peelle, Johnsrude, &
                 the acoustic signal into a representation of the intended                                 Davis, 2010; Price, 2010; Saur et al., 2008; Hagoort, 2005;
                 meaning. Spectrally complex, rapidly changing speech                                      Rodd, Davis, & Johnsrude, 2005; Friederici, Ruschemeyer,
                 sounds are analyzed by peripheral and cortical auditory                                   Hahne, & Fiebach, 2003; Humphries, Willard, Buchsbaum,
                 perceptual processes before being mapped onto higher-                                     & Hickok, 2001; Mazoyer et al., 1993). Here, we explore
                 level linguistic representations, which are combined to                                   the functional organization of human speech processing,
                 derive the meaning of the utterance. This hierarchical de-                                asking whether information flow is strictly feedforward
                 scription accords with anatomical studies of the macaque                                  (“bottom–up”) or whether higher-level semantic and
                 auditory system (Hackett, 2008; Scott & Johnsrude, 2003;                                  syntactic computations interact directly with perceptual re-
                 Rauschecker, 1998), with which we share a number of                                       gions to change their activity, guiding lower-level percep-
                 neuroanatomical homologies (Petrides & Pandya, 1999,                                      tual processing “top–down.”
                 2009). At least four cortical processing levels radiate out-                                 One possible indication of top–down influences is that
                 ward from primary auditory cortex (Kaas & Hackett, 2000;                                  successful comprehension of degraded speech depends
                 Kaas, Hackett, & Tramo, 1999; Hackett, Stepniewska, &                                     on speech content as well as perceptual clarity (Miller &
                 Kaas, 1998; Rauschecker, 1998; Pandya, 1995) around                                       Isard, 1963; Miller, Heise, & Lichten, 1951). For exam-
                 the transverse temporal Heschlʼs gyrus (HG; Rademacher                                    ple, word report for speech in noise is more accurate
                 et al., 2001). A cortical hierarchy for speech processing                                 for normal sentences than for syntactically malformed
                 has also been supported by human neuroimaging: Re-                                        sentences (Miller & Isard, 1963), word lists (Miller et al.,
                 sponses in the vicinity of primary auditory cortex are sen-                               1951), or syntactically correct sentences without coherent
                 sitive to the acoustic form of speech (Okada et al., 2010;                                meaning (Boothroyd & Nittrouer, 1988; Kalikow, Stevens,
                 Davis & Johnsrude, 2003), whereas higher-level semantic                                   & Elliott, 1977; Miller & Isard, 1963). Despite elegant
                                                                                                           mathematical methods for quantifying contextual benefit
                 1
                   Medical Research Council Cognition and Brain Sciences Unit,                             (Boothroyd & Nittrouer, 1988), disagreements remain
                 Cambridge, UK, 2University of East Anglia, 3University of Lausanne,                       concerning the neurocomputational mechanisms that are
                 4
                  Queenʼs University, Kingston, Canada                                                     responsible. In short, this effect is often colloquially termed

                 © 2011 Massachusetts Institute of Technology                                                   Journal of Cognitive Neuroscience 23:12, pp. 3914–3932
Downloaded from http://www.mitpressjournals.org/doi/pdf/10.1162/jocn_a_00084 by guest on 18 October 2021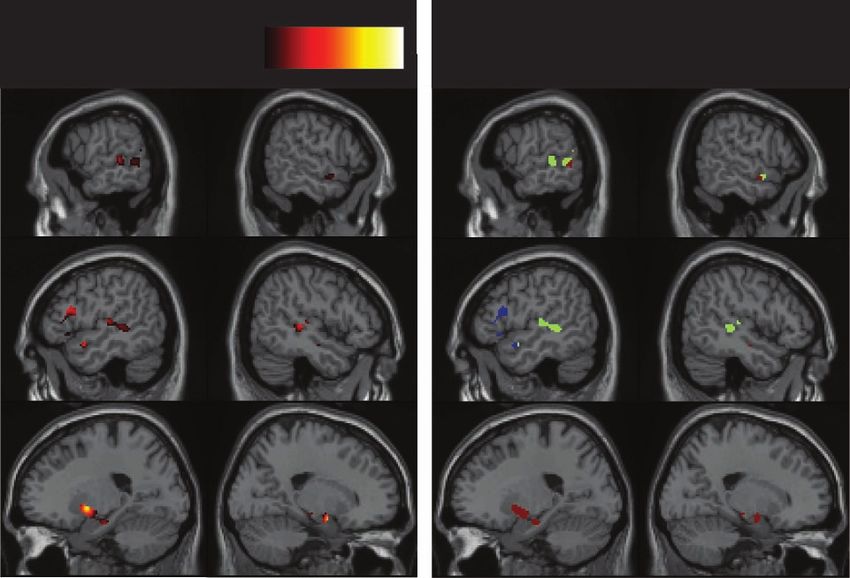
“top–down” without in fact requiring the direct interaction                            lower-level lexical and perceptual processes. We will as-
                    between regions supporting semantic processing (the                                    sess this in the present study by testing for interactions
                    “top”) and those supporting perceptual processing (the                                 between sentence content and signal quality during the
                    “down”). There are in fact two distinct classes of account.                            perception of coherent sentences (e.g., “the recipe for
                    One proposes that, indeed, contextual benefit arises                                   the cake was easy to follow”) and anomalous sentences
                    through top–down processes that allow higher-level con-                                created by substitution of matched content words (“the
                    tent to influence peripheral perceptual mechanisms for                                 idea for the soap was easy to listen”). Sentences of this
                    word or phoneme identification (McClelland & Elman,                                    sort were presented without repetition in speech enve-
                    1986; Marslen-Wilson & Tyler, 1980). The other class of ac-                            lope and spectrum noise at varying signal-to-noise ratios
                    count is not top–down. In feedforward accounts, pro-                                   (SNRs) including clear speech (Figure 2A–C), ensuring that

                                                                                                                                                                           Downloaded from http://mitprc.silverchair.com/jocn/article-pdf/23/12/3914/1776985/jocn_a_00084.pdf by guest on 18 May 2021
                    cessing is exclusively bottom–up, and context influences                               all parts of the sentence are equally masked (Schroeder,
                    integration of perceptual hypotheses in higher-level lexical                           1968). Top–down mechanisms can thus only improve intel-
                    or semantic regions without need for interaction between                               ligibility through contextual support for word identification
                    regions supporting higher cognitive and lower perceptual                               rather than through glimpsing (Cooke, 2006) or other mech-
                    processes (e.g., Norris, McQueen, & Cutler, 2000; Massaro,                             anisms (e.g., perceptual learning; Samuel & Kraljic, 2009).
                    1989).                                                                                    A second test for top–down neural mechanisms con-
                       On the basis of behavioral evidence that higher-level                               cerns the relative timing of higher-level (contextual) and
                    content influences perception, we predict that critical                                lower-level (perceptual) processes. In top–down accounts,
                    neural mechanisms will be revealed when demands on                                     activity for anomalous compared with coherent materi-
                    contextual integration are high. This occurs both during                               als will diverge at an earlier time point in brain regions
                    perception of coherent yet degraded sentences and when                                 supporting higher-level processes (the source of top–
                    the semantic context of a sentence is weak or anomalous                                down feedback) than in regions subserving lower-level
                    (see Figure 1A). Neuroimaging findings from participants                               processes (the recipients of top–down feedback). Accord-
                    listening to degraded coherent sentences have sometimes                                ing to bottom–up accounts when speech is degraded, in-
                    been interpreted as providing evidence for top–down                                    creased activity in higher-level integrative processes can
                    mechanisms (e.g., Obleser, Wise, Dresner, & Scott, 2007;                               only follow, rather than lead, changes in regions support-
                    Zekveld, Heslenfeld, Festen, & Schoonhoven, 2006), but                                 ing lower-level perceptual processing. Thus, the timing
                    the existing data cannot distinguish between the top–                                  of neural interactions between sentence content and intel-
                    down and bottom–up explanations discussed above. Here,                                 ligibility may provide a second test of top–down accounts.
                    we assess the magnitude and timing of fMRI responses to                                Although previous fMRI studies have assessed the timing
                    spoken sentences that vary in semantic content and signal                              of neural responses to manipulations of sentence con-
                    quality to assess these two contrasting neural accounts by                             tent (Humphries, Binder, Medler, & Liebenthal, 2007;
                    testing the predictions illustrated in Figure 1B and C and                             Dehaene-Lambertz et al., 2006), these studies presented
                    explained below.                                                                       speech against a background of continuous scanner noise
                       A first test for top–down effects is to assess whether                              preventing comparison of activity during natural, effort-
                    lower-level perceptual or lexical processes are influenced                             less comprehension of connected speech (Peelle, Eason,
                    not only by speech clarity (reflecting the acoustics of the                            Schmitter, Schwarzbauer, & Davis, 2010). Here, we com-
                    signal and thus compatible with lower-level processing)                                bine the quiet listening conditions provided by sparse
                    but also by semantic content, which is presumed to de-                                 imaging (Hall et al., 1999) with rapid acquisition of multi-
                    pend on the involvement of higher-level, cognitive re-                                 ple images by using a hybrid sparse-continuous scanning
                    gions. Previous studies have shown that sentence content                               protocol: interleaved silent steady-state (ISSS) imaging
                    modulates neural responses to clear speech (Friederici                                 (Schwarzbauer, Davis, Rodd, & Johnsrude, 2006; see Fig-
                    et al., 2003; Kuperberg et al., 2000) and degraded speech                              ure 2D). In this way, we can measure both the magnitude
                    (Obleser et al., 2007) in the superior temporal gyrus (STG).                           and timing of BOLD responses to sentences varying in
                    This same lower-level area also shows effects of speech                                speech content and signal clarity.
                    clarity (Zekveld et al., 2006; Davis & Johnsrude, 2003).
                    However, simple effects of sentence content or speech
                    clarity need not imply involvement in compensation for dis-                            METHODS
                    tortion rather than more general processes (e.g., changes
                    in attention). Those previous studies that have simul-                                 Participants
                    taneously manipulated speech content and intelligibility                               Twenty volunteers participated in the sentence report
                    (e.g., Obleser et al., 2007) did not localize the critical inter-                      test, and thirteen right-handed volunteers participated in
                    action between these two factors, hence, cannot rule out                               an fMRI study approved by the Cambridgeshire Regional
                    purely bottom–up accounts. As shown in the center panel                                Research Ethics Committee. All were aged between 18
                    of Figure 1B and C, the critical difference between top–                               and 45 years (mean age of fMRI volunteers = 26 years,
                    down and bottom–up accounts is whether the interaction                                 10 women), native speakers of English, without neurologi-
                    between sentence content and speech clarity extends to                                 cal illness, head injury, or hearing impairment.

                                                                                                                                                   Davis et al.    3915
Downloaded from http://www.mitpressjournals.org/doi/pdf/10.1162/jocn_a_00084 by guest on 18 October 2021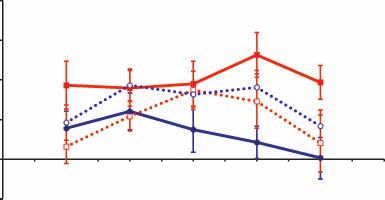
Downloaded from http://mitprc.silverchair.com/jocn/article-pdf/23/12/3914/1776985/jocn_a_00084.pdf by guest on 18 May 2021
                 Figure 1. Behavioral and neural predictions for the influence of meaningful semantic context and SNR on perception of degraded speech. (A) Word
                 report scores are higher for coherent than anomalous sentences at intermediate SNRs, reflecting an influence of semantic context on speech
                 perception. Additional demands are placed on meaning-based integration processes when speech is coherent and moderately degraded or when
                 speech is comprehensible and anomalous (thicker lines). However, two different neural explanations are possible depending on whether lower-level
                 processes are modulated by changes to sentence content (top–down accounts (B) or whether lower-level perceptual processing is unaffected
                 by sentence content (bottom–up accounts; C). These accounts can be distinguished by the location and timing of neural interactions between
                 sentence type and signal clarity. Note that other interaction profiles may also occur in brain regions that reflect the outcome of speech
                 comprehension—for instance, systems involved in rehearsal-based STM will show a response profile that is correlated with word report, hence
                 elevated for coherent sentences in intermediate SNR conditions. (B) Neural predictions for top–down accounts of speech comprehension.
                 When speech is coherent and clearly perceived, semantically compatible lexical candidates receive additional activation through top–down
                 mechanisms and are more easily recognized. This leads to differential lexical activation for more clearly recognized coherent sentences compared
                 with degraded speech (for which recognition is challenged by distorted bottom–up input) and compared with clearly recognizable anomalous
                 sentences (for which recognition is challenged by the lack of top–down support). This top–down account, therefore, predicts an interaction between
                 speech intelligibility (i.e., SNR) and sentence type (anomalous vs. coherent) at both semantic and lexical levels (center graphs) that should arise
                 earlier in higher-level semantic regions than in lower-level lexical or perceptual processes (rightmost graphs). (C) Neural predictions of bottom–up
                 accounts in which lexical activation is based only on the perceptual input. Only later, integration processes are differentially engaged for anomalous
                 or degraded sentences. For intelligible coherent sentences, constraints from previous words can be used to guide interpretation of upcoming
                 material and semantic integration is therefore easier. Recognition of degraded sentences can produce additional uncertainty, hence increase
                 processing load in higher-level semantic integration processes that are also challenged by anomalous sentences. However, changes in higher-level
                 semantic integration are independent of lower-level lexical and perceptual processes. These lower levels are therefore only modulated by
                 acoustic distortion and not by sentence type.

                 3916         Journal of Cognitive Neuroscience                                                                            Volume 23, Number 12
Downloaded from http://www.mitpressjournals.org/doi/pdf/10.1162/jocn_a_00084 by guest on 18 October 2021
Stimulus Preparation and Pilot of the anomalous sentences (74%) were judged as anom-
Behavioral Experiments alous before sentence offset (average response latency
was at 90.8% of the sentence duration, range = 57.7–
One hundred declarative sentences between 6 and 13 144.9%). Thus, our sentences are established as coherent
words in length were selected from sentences generated or anomalous on the basis of multiple, mutually constrain-
for the “low ambiguity condition” of a previous study (Rodd ing content words, not just the final word.
et al., 2005). For each “coherent” sentence, a matched These sentences were degraded by adding speech spec-
anomalous sentence was created by randomly substituting trum, signal-correlated noise (SCN; cf. Schroeder, 1968)
content words matched for syntactic class, frequency of at a range of SNRs using a custom script and Praat software
occurrence and length in syllables (cf. Marslen-Wilson & (www.praat.org). This preserves the duration, amplitude,
Downloaded from http://mitprc.silverchair.com/jocn/article-pdf/23/12/3914/1776985/jocn_a_00084.pdf by guest on 18 May 2021
Tyler, 1980). The anomalous sentences thus have identi- and average spectral composition of the original sentences
cal phonological, lexical, and syntactic properties but lack at all SNRs, although fine structure becomes progressively
coherent meaning. Five pairs of sample sentences are listed more degraded at low SNRs. As intended, the perceptual
in Appendix A. clarity, hence intelligibility, of the sentences changes dra-
The resulting 200 sentences (1.2–3.5 sec in duration, matically with increasing noise. At extreme SNRs (−10 dB),
speech rate = 238 words/min) were recorded by a male the stimulus is indistinguishable from pure SCN, a rhythmi-
speaker of British English and digitized at a sampling cally modulated noise stimulus that provides an acousti-
rate of 44.1 KHz. To assess the timing of anomalous con- cally matched nonspeech baseline (Rodd et al., 2005). At
tent in these sentences, a group of 27 participants were positive SNRs, sentences are highly intelligible, although
presented with clearly spoken coherent and anomalous still somewhat masked. Spectrograms illustrating the
sentences over headphones (Sennheiser HD250) and re- acoustic properties of clear speech, SCN, and speech de-
quired to press one of two buttons to indicate as quickly graded by the addition of SCN are shown in Figure 2A–C.
and as accurately as possible whether each sentence A pilot study outside the scanner was conducted in a sep-
made sense or not. Responses showed that the majority arate group of participants to assess: (a) the intelligibility of
Figure 2. (A–C) Spectrogram (center), amplitude envelope (top), and mean spectrum (right) for (A) a single sentence of clear speech, (B) speech
mixed with SCN at a SNR of −1 dB, and (C) SCN matched for amplitude envelope and long-term spectrum. (D) Timeline of stimulus presentation
and EPI acquisition using the ISSS sequence (Schwarzbauer et al., 2006). Scans are timed to capture the peak of the hemodynamic response to
early, intermediate, and late events during the preceding sentence. Following 50% of sentences a probe word was visually presented for a
present/absent decision.
Davis et al. 3917
Downloaded from http://www.mitpressjournals.org/doi/pdf/10.1162/jocn_a_00084 by guest on 18 October 2021Figure 3. Measured
intelligibility of coherent
and anomalous sentences
at different SNR values.
(A) Percentage correct word
report data from 20 pilot
participants. Increased report
scores for coherent sentences:
*p < .1, *p < .05, **p < .01,
***p < .001. (B) Probe
identification decisions for
fMRI participants compared
Downloaded from http://mitprc.silverchair.com/jocn/article-pdf/23/12/3914/1776985/jocn_a_00084.pdf by guest on 18 May 2021
with chance performance
(50% correct).
sentences degraded through the addition of SCN at varying tences), pure SCN, and a silent resting baseline. This
SNRs and (b) the impact of sentential content on intelli- made a total of 16 conditions from which 14 conditions
gibility. Participants heard single sentences over head- formed a factorial crossing of 7 SNR conditions (including
phones and were required to type as many words as clear speech) × 2 Sentence types. Participants were told
they could understand immediately after a single presenta- that they would be listening to sentences, distorted with
tion of each sentence. Ten coherent and 10 anomalous different amounts of background noise, and instructed to
sentences were presented at each of nine SNRs (in 1 dB listen attentively to each sentence. To ensure attention,
steps from −7 to +1 dB) and as clear speech. Sentences after 50% of sentences, a word was visually presented and
were pseudorandomly assigned to a level of degradation participants responded with a button press to indicate if
for each subject and counterbalanced such that each this word was present in (right index figure) or absent from
sentence was heard only once by each participant but (left index figure) the preceding sentence. Following 50%
was presented at each of the 10 SNRs across subjects. of silent intervals or SCN presentations (neither of which
ANOVA on mean word report scores for coherent and contained intelligible speech), the words “right” or “left”
anomalous sentences at 10 SNRs (including clear speech, appeared on the screen and participants were instructed
shown in Figure 3A) showed significant main effects of sen- to press the corresponding button on the response box.
tence type (F(1, 19) = 185.05, p < .001) and SNR (F(9, We acquired imaging data with a 3-T MR system (Bruker
171) = 1135.84, p < .001) and the expected interaction Biospin GmbH, Ettlingen, Germany), using a head-gradient
between these two factors (F(9, 171) = 16.659, p < insert and a quadrature birdcage head coil. We used an
.001) because of greatest contextual facilitation at inter- ISSS sequence (Schwarzbauer et al., 2006) in which a
mediate SNRs. 6-sec silent period was followed by a train of five 1-sec
EPI acquisitions. To avoid T1-related signal delay, the ISSS
sequence maintains steady-state longitudinal magnetiza-
fMRI Procedure
tion with a train of silent slice-selective excitation pulses be-
Coherent and anomalous spoken sentences were pre- tween acquisitions. This sequence provides an optimal
sented to participants at six SNRs between −5 and 0 dB compromise between the need to present auditory stimuli
in 1-dB steps; these values were chosen as showing a ro- during silence and the desire to collect multiple, rapid EPI
bust report score benefit for coherent compared with acquisitions to track the time course of the BOLD response
anomalous sentences. In addition, we included trials con- to spoken sentences. A schematic of the experimental pro-
taining clear speech (both coherent and anomalous sen- cedure is shown in Figure 2D.
3918 Journal of Cognitive Neuroscience Volume 23, Number 12
Downloaded from http://www.mitpressjournals.org/doi/pdf/10.1162/jocn_a_00084 by guest on 18 October 2021We used rapid, near-whole-brain EPI acquisitions with participants reported that the scanner noise was unobtru-
a repetition time of 1 sec during which time 18 × 4 mm sive and sentences were presented at a comfortable listen-
thick slices were acquired with a 1-mm interslice gap. ing level. Visual stimuli were back-projected using an LCD
Slices were acquired in ascending interleaved order with projector and viewed using an angled mirror inside the
a 20 × 20 cm field of view, 64 × 64 matrix size, and in- scanner head coil. Stimulus presentation and response mea-
plane spatial resolution of 3.1 × 3.1 mm; acquisition surement were controlled using DMDX software (Forster
bandwidth was 101 kHz, and echo time was 27.5 msec. & Forster, 2003) running on a Windows PC.
Acquisition was transverse-oblique, angled away from the
eyes, and covered most of the brain except the top of
Preprocessing and Analysis of fMRI Data
the superior parietal lobule. In addition to EPI acquisi-
Downloaded from http://mitprc.silverchair.com/jocn/article-pdf/23/12/3914/1776985/jocn_a_00084.pdf by guest on 18 May 2021
tions, field maps to facilitate geometric undistortion during Data processing and analysis were accomplished using
preprocessing were acquired (Cusack, Brett, & Osswald, SPM2 ( Wellcome Department of Cognitive Neurology,
2003), and a high-resolution spoiled gradient echo T1- London, UK). Preprocessing steps included realignment
weighted structural image was acquired for spatial nor- and unwarping to correct for subject motion and inter-
malization (1-mm isotropic resolution). actions between movement and field inhomogeneities
Imaging data were acquired in four runs of 10.5 min, (Andersson, Hutton, Ashburner, Turner, & Friston, 2001).
each run consisting of 285 acquisitions (57 sets of five The phase and magnitude of the field maps was un-
EPI volumes, with five initial volumes discarded in each wrapped, scaled, and used to remove geometric distortions
run). Each run included three or four trials of each of the from the EPI data (Cusack et al., 2003). Individual structural
16 conditions; over four runs, each condition was tested images were coregistered to the functional data and then
14 times. Because of problems with stimulus presenta- normalized to the ICBM152 template. These normalization
tion equipment, data from seven scanning runs were dis- parameters were then applied to preprocessed EPI data,
carded (eight participants supplied four scanning runs, followed by smoothing with a 10-mm FWHM Gaussian
three participants supplied three scanning runs, and filter.
two participants supplied two scanning runs for analy- Statistical analysis was conducted using the general
sis). A single sentence was presented during the 6 sec linear model in SPM2 (www.fil.ion.ucl.ac.uk/spm/ ) sup-
of silence before each set of five EPI acquisitions. Sen- plemented by custom Matlab scripts. We used an finite
tence onset was timed so that sentence midpoint coin- impulse response basis set such that the five scans after
cided with the midpoint of the silent period and EPI sentences in each condition were separately averaged.
acquisitions occurred between 3 and 8 sec after the mid- Head movement parameters and dummy variables coding
dle of each sentence, capturing the peak of the evoked the scanning sessions were included as covariates of no
hemodynamic response (Hall et al., 1999). After 50% of interest. No high-pass filter or correction for serial auto-
sentence trials, a probe word was visually presented, 2 sec correlation was used in estimating the least-mean-squares
into the 5-sec acquisition period. Participants were in- fit because of the discontinuous nature of ISSS data. The
structed to respond to the written word with a button mean activity level in each condition over time can none-
press to indicate if it was present or absent from the pre- theless be computed because unmodeled temporal cor-
ceding sentence. On 50% of SCN or rest trials, the words relation has no impact on estimates of the mean effect,
“left” or “right” were presented to cue a button press re- only on estimates of scan-to-scan variation (Schwarzbauer
sponse. Presentation of sentences, probe words, and scans et al., 2006). Our analysis procedure focuses on the sig-
were timed to ensure our fMRI data were optimally sensi- nificance of activation estimates across the group of par-
tive to sentence presentation and insensitive to the probe ticipants with intersubject variation as a random effect.
word task (see Figure 2D). Hence, within-subject temporal autocorrelation is irrel-
Coherent and anomalous stimulus items were pseudo- evant for our statistical analysis.
randomly assigned to different SNR conditions (including To identify brain areas in which BOLD signal was
clear speech) for each participant with 14 sentences pre- correlated with intelligibility, irrespective of sentence
sented in each condition. This ensures that all sentences content and time, we used word report scores from pilot
occurred equally in all SNR conditions over the group of testing as the predictor of the BOLD response averaged
participants tested. Sentences presented as SCN were cho- over all five scans after each sentence. We used pilot be-
sen equally from coherent and anomalous stimuli. Aside havioral data (Figure 3A) rather than data collected in the
from these unintelligible SCN presentations, no sentence scanner because (a) word report scores are a more direct
was presented more than once to each participant. Audi- measure of intelligibility, (b) ceiling effects in forced-
tory stimuli were presented diotically over high-quality choice identification reduce sensitivity at high SNRs, and
headphones (Resonance Technology, Commander XG Sys- (c) good correspondence between word report and in-
tem, Northride, CA). To further attenuate scanner noise, scanner behavioral data has been shown in previous sparse
participants wore insert earplugs (E.A.R. Supersoft, Aearo imaging studies (Davis & Johnsrude, 2003). To assess
Company, www.aearo.com), rated to attenuate by approxi- the effect of intelligibility on activation, we computed the
mately 30 dB. When wearing earplugs and ear defenders, average report score over both sentence types for each
Davis et al. 3919
Downloaded from http://www.mitpressjournals.org/doi/pdf/10.1162/jocn_a_00084 by guest on 18 October 2021SNR (including clear speech). These values were zero-mean conditions within brain regions showing significant sen-
corrected and used as contrast weights for neural responses tence type by SNR interactions. We used a k-means cluster-
measured at different SNRs. Thus, we compute in each ing algorithm implemented in Matlab v6.5 (MathWorks,
voxel the slope of the line relating BOLD signal magnitude Natick, MA) to identify a number of mutually exclusive sub-
and speech intelligibility. Group analysis with a one-sample sets of voxels that show consistently different interaction
t test assesses whether this slope estimate is consistently profiles (see Simon et al., 2004). This method starts by ran-
greater than zero (i.e., a positive correlation between BOLD domly setting seven values for each of a number (k) of clus-
signal and report score). Intelligibility-responsive regions ter centroids. These sets of seven values reflect the average
identified in this analysis were then used as a search volume effect of sentence type at each of the seven SNR values in
for analyses to assess the main effect of sentence type and the interaction analysis for each of k clusters. Voxels are as-
Downloaded from http://mitprc.silverchair.com/jocn/article-pdf/23/12/3914/1776985/jocn_a_00084.pdf by guest on 18 May 2021
the sentence type by SNR interaction. Because intelligibility- signed to the most similar centroid, and once assigned, the
responsive regions were determined on the basis of re- centroids are updated to be the mean of the assigned vox-
sponses averaged over the two sentence types (main effect els. These phases are iterated until no voxels are assigned
of intelligibility), these follow-up analyses contrasting the to different clusters in consecutive runs. Because this pro-
two sentence types (main effect of sentence type) are cedure is sensitive to starting conditions, it was repeated 50
orthogonal to the contrast used to define the search vol- times using different random seeds and the solution that
ume (Friston, Rotshtein, Geng, Sterzer, & Henson, 2006). maximized the between-cluster (explained) variance di-
Hence, the search volume and follow-up contrasts are inde- vided by the within-cluster (unexplained) variance was
pendent under the null hypothesis (as recommended by selected.
Kriegeskorte, Simmons, Bellgowan, & Baker, 2009). We used two iterative procedures: first, to determine
The main effect of sentence type was assessed using a the number of clusters (k) that best explains the observed
one-sample t test with both positive and negative contrasts data without redundancy and, second, to assess the statis-
testing for additional activity in response to coherent com- tical reliability of response differences between clusters.
pared with anomalous sentences (and vice versa), averaged First, we ran cluster analyses with increasing values of k
over all SNR conditions. To assess sentence type by SNR at each step. We tested for statistically significant differ-
interactions, we computed seven contrast images (coher- ences among the response profiles of different clusters
ent vs. anomalous) at each SNR (six degraded and one clear by extracting the mean response profile for each cluster
speech condition) in each subject averaged over time. and subject using MarsBar (Brett, Anton, Valabregue, &
These images were entered into a one-way repeated mea- Jean-Baptiste, 2002) and comparing these profiles using
sures ANOVA in SPM2 and the “effects of interest” F test repeated measures ANOVAs. The absence of a significant
used to test the sentence type by SNR interaction (Penny Cluster × Condition interaction provides evidence that
& Henson, 2006). This method tests for a differential re- two redundant clusters have been discovered by the clus-
sponse to the sentence type manipulation at different tering routine and the previous value of k is assumed to be
SNRs, including both the interaction shown in behavioral the best description of the response profiles established
report scores and that predicted in Figure 1B-C. For all by k-means clustering. If all pairwise comparisons between
these analyses, we report results after correction for multi- different clusters are statistically reliable, the number of
ple comparisons using the false discovery rate procedure clusters (k) is increased by one and the clustering pro-
(Genovese, Lazar, & Nichols, 2002). We applied a voxel cedure is repeated. This allows us to determine the maxi-
threshold of p < .05 corrected for the whole brain or search mum number of different response profiles within the
volumes derived from orthogonal contrasts. observed activation map. However, assessment of cluster
differences might be biased by the use of the same data
in generating the clusters and in subsequent statistical
Clustering Analysis
analysis. We therefore use a second iterative procedure (a
Because a number of different response profiles can give leave-one-out analysis) to ensure that statistical analysis of
rise to a sentence type by SNR interaction, we used a data- cluster response profiles could be conducted on data that
driven approach to characterize the activation profiles over were independent of the original clustering procedure.
Figure 4. Spatial and temporal profile of brain responses to speech intelligibility for coherent and anomalous sentences combined. (A) Brain
regions in which the magnitude of the BOLD signal at each SNR (averaged over scans and over the two sentence types) is correlated with
intelligibility (word report). Statistical maps displayed at p < .05 FDR corrected on sagittal slices of the Montreal Neurological Institute (MNI)
canonical brain. (B) Intelligibility-responsive regions divided into clusters with three distinct temporal profiles discovered by k-means analysis.
(C) Time course of correlation between BOLD signal and intelligibility between 3 and 8 sec after the middle of each sentence. Results show the
ratio of slope estimates for each time point relative to the mean slope averaged over scans (dotted line) for each of three clusters depicted in B.
(D) Estimated peak latency for BOLD responses from a leave-one-out clustering procedure that provides independent estimates of the temporal
profile suitable for group analysis. Error bars show the standard error after between-subjects variance has been removed, suitable for repeated
measures comparison (cf. Loftus & Masson, 1994).
3920 Journal of Cognitive Neuroscience Volume 23, Number 12
Downloaded from http://www.mitpressjournals.org/doi/pdf/10.1162/jocn_a_00084 by guest on 18 October 2021Downloaded from http://mitprc.silverchair.com/jocn/article-pdf/23/12/3914/1776985/jocn_a_00084.pdf by guest on 18 May 2021
3921
Davis et al.
Downloaded from http://www.mitpressjournals.org/doi/pdf/10.1162/jocn_a_00084 by guest on 18 October 2021Clustering is performed on mean data generated from to our decision to assess intelligibility effects in the imaging
12 participants, resulting in a set of clusters with good data using word report scores from the pilot study.
spatial correspondence to the clusters determined from
the mean of all participants. Critically, however, cluster
Effects of SNR, Type of Sentence, and
locations determined in this way are independent of the
Their Interaction
data from the thirteenth, left-out participant. Hence, data
can be extracted from the remaining (left-out) participant Analysis of the magnitude of activity, averaged over all five
from clusters that correspond with the clusters generated scans following each sentence, shows a network of frontal
from analysis of the entire group but generated without and temporal lobe regions in which BOLD signal corre-
bias or circularity. This “leave-one-out” procedure is re- lated with the intelligibility of speech as quantified by mean
Downloaded from http://mitprc.silverchair.com/jocn/article-pdf/23/12/3914/1776985/jocn_a_00084.pdf by guest on 18 May 2021
peated until we have independent cluster data from all word report (from the pilot study) across sentence types
13 participants. These data can then be entered into group (see Figure 4A and Table 1). These included extensive,
statistical analyses to assess the significance of Cluster × bilateral, temporal lobe regions extending from posterior
Condition interactions indicative of statistically distinct re- middle temporal gyrus (MTG) and STG to the temporal
sponse profiles for the group of participants tested (Henson, pole. In the left hemisphere, this activation extends into
2006). the left inferior frontal gyrus (LIFG), including peaks in
partes opercularis, triangularis, and orbitalis. Correlations
between intelligibility and BOLD signal were also observed
fMRI Timing Analysis in bilateral medial-temporal regions, the left putamen,
and left inferior temporal and fusiform gyri. This exten-
To test for differences in the timing of neural responses sive fronto-temporal and subcortical system of speech-
in intelligibility responsive brain regions, we again used responsive regions provides a search volume within which
k-means clustering to separate regions sensitive to intelligi- to assess the magnitude and timing of neural responses
bility or Sentence type × SNR interactions with different reflecting type of sentence (coherent vs. anomalous). How-
temporal profiles. To ensure clusters were only distin- ever, the contrast between coherent and anomalous sen-
guished by the timing of the BOLD signal, response mag- tences (averaged over intelligibility and SNR levels) failed
nitude at each time point was normalized by divided by to reach FDR-corrected significance (in either direction) within
the average response magnitude for that contrast in all five intelligibility-responsive regions or elsewhere in the brain.
scans. As before, the number of distinct clusters and statis- Several regions exhibited robust interactions between sen-
tical significance in group analysis was decided using the tence type and SNR, and this may have eliminated a main
group clustering procedure, followed by a leave-one-out effect of sentence type.
clustering procedure. However, given the nonsphericity We assessed the Sentence type × SNR interaction us-
that is expected of time-course data, we used multivariate ing a repeated measures ANOVA in a search volume of
ANOVAs to confirm the presence of statistically significant intelligibility-responsive regions as before. As shown in Fig-
differences among the temporal profiles of different clus- ure 5A and Table 2, this analysis revealed a number of corti-
ters. In a complementary analysis, we measured the scan cal and subcortical regions in which the differential response
at which the peak of the BOLD response was observed in to coherent and anomalous sentences depended on SNR,
each cluster (Bellgowan, Saad, & Bandettini, 2003). These including several regions of the STG and MTG. A large
latency (i.e., time to peak) values were compared among cluster crossing all three anatomical divisions of the LIFG
clusters using repeated measures ANOVAs. (partes opercularis, triangularis, and orbitalis) was also ob-
served. In addition to these cortical regions, bilateral clus-
ters were evident in medial-temporal regions and in the
RESULTS left lentiform nucleus. We conducted a whole-brain analy-
sis to determine whether significant interactions were ob-
Probe Word Detection served outside the brain regions that respond to speech
Because of the small number of observations in each con- intelligibility, but this did not reveal any effects at a corrected
dition, signal detection analysis was inappropriately skewed level of significance. Because our effects of interest were
by responses that were 0 or 100% correct in specific condi- predicted to occur within regions contributing to speech
tions. We, therefore, conducted analysis on the proportion comprehension (see Figure 1B and C), we focused on find-
of correct responses (hits and correct rejections). This re- ings in this intelligibility-responsive search volume in sub-
vealed a significant main effect of SNR (F(6, 72) = 33.551, sequent statistical analyses.
p < .001), although the effect of Sentence Type (F(1, 12) = Several different response profiles give rise to an interac-
1.192, p > .05) and the Sentence Type × SNR interaction tion between SNR and sentence type. We used a k-means
(F(6, 72) = 1.109, p > .05) did not reach significance (Fig- clustering procedure to identify subregions showing statis-
ure 3B). These data are much less fine-grained than the tically distinct response profiles as confirmed by three-
word report data from the pilot study (see Figure 3A), way Brain region × Sentence type × SNR interactions. We
yet results are largely consistent, lending further support obtained evidence for three regionally specific response
3922 Journal of Cognitive Neuroscience Volume 23, Number 12
Downloaded from http://www.mitpressjournals.org/doi/pdf/10.1162/jocn_a_00084 by guest on 18 October 2021Table 1. Intelligibility Correlation for Coherent and Anomalous Prose Combined
MNI Coordinates
Location Voxels (n) p (FDR) Z x y z
L lateral temporal/frontal lobe 3658
Posterior MTGB .001 5.49 −60 −42 0
Anterior MTG B
.001 5.15 −58 −10 −8
Mid STG C
.002 4.55 −62 −18 4
Downloaded from http://mitprc.silverchair.com/jocn/article-pdf/23/12/3914/1776985/jocn_a_00084.pdf by guest on 18 May 2021
Temporal pole (middle) C
.002 4.41 −46 18 −26
Posterior MTG B
.004 4.12 −54 −56 14
IFG (orbitalis) B
.004 4.06 −46 26 −6
IFG (triangularis/opercularis) B
.007 3.74 −48 18 16
Anterior MTG B
.007 3.74 −50 0 −24
R lateral temporal lobe 1294
Temporal pole (superior) B
.001 5.09 58 10 −14
Anterior MTG B
.002 4.38 54 −2 −22
Temporal pole (superior) B
.002 4.33 50 16 −20
Posterior MTG B
.003 4.18 54 −34 −2
Mid STG/MTG B
.003 4.16 66 −18 −8
Mid STG B
.004 4.06 60 −8 0
Heschlʼs gyrus a
.007 3.79 46 −22 10
Post STGB .007 3.73 66 −32 −4
Mid MTG B
.009 3.63 58 −22 −16
L medial temporal/lentiform nucleus 439
Putamen C
.004 4.10 −24 4 −6
Hippocampus (head) B
.009 3.63 −20 −10 −14
R medial temporal 286
Hippocampus (head) C
.006 3.85 20 −14 −16
Amygdala .010 3.56 26 0 −12
L inferior colliculusB 19 .014 3.36 −8 −30 −2
L inferior temporal lobe 26
Fusiform gyrus b
.015 3.35 −38 −38 −22
Inferior Temporal Gyrus C
.017 3.30 −44 −48 −20
L anterior fusiform B
13 .017 3.27 −32 −10 −24
L hippocampus (body) B
6 .021 3.18 −22 −26 −6
Thresholded at p < .001 uncorrected (equivalent to p < .05 whole-brain FDR corrected). The table shows MNI coordinates and anatomical location
of all peak voxels separated by more than 8 mm in clusters larger than five voxels. Superscripts A, B, and C indicate which of three temporal profiles
illustrated in Figure 4B–D is shown by the voxels at each peak. L = left; R = right; FDR = false discovery rate.
profiles, shown in Figure 5B–E. Profile A (blue in Figure 5B) lous sentences continues to increase whereas it declines
is observed in inferior frontal regions and in the left anterior for coherent sentences (Figure 5C). The second response
STG. In these regions, the two sentence types yield similar profile (B, red in Figure 5B and D) is reminiscent of the
activity at low SNRs. However, at high SNRs (when both behavioral advantage seen for reporting words in coher-
sentence types are highly intelligible), activity for anoma- ent compared with anomalous sentences and is seen in
Davis et al. 3923
Downloaded from http://www.mitpressjournals.org/doi/pdf/10.1162/jocn_a_00084 by guest on 18 October 2021medial-temporal regions (hippocampus, parahippocampus, profile differs from Profile A (F(6, 72) = 7.125, p < .001
and amygdala) and in left BG and inferior colliculus. BOLD for the three-way interaction among clusters, sentence
responses for coherent sentences are maximal even in inter- type, and SNR). The third response profile was exhibited
mediate SNR conditions (−2 and −1 dB SNR), whereas for in bilateral regions of the posterior STG and MTG and
anomalous sentences, BOLD responses gradually increase in right anterior STG (C, green in Figure 5B and E). This
as SNR goes up. Statistical comparisons on the basis of data profile resembles a combination of the other two profiles,
from leave-one-out clustering confirmed that this response with both an increased response to coherent sentences at
Downloaded from http://mitprc.silverchair.com/jocn/article-pdf/23/12/3914/1776985/jocn_a_00084.pdf by guest on 18 May 2021
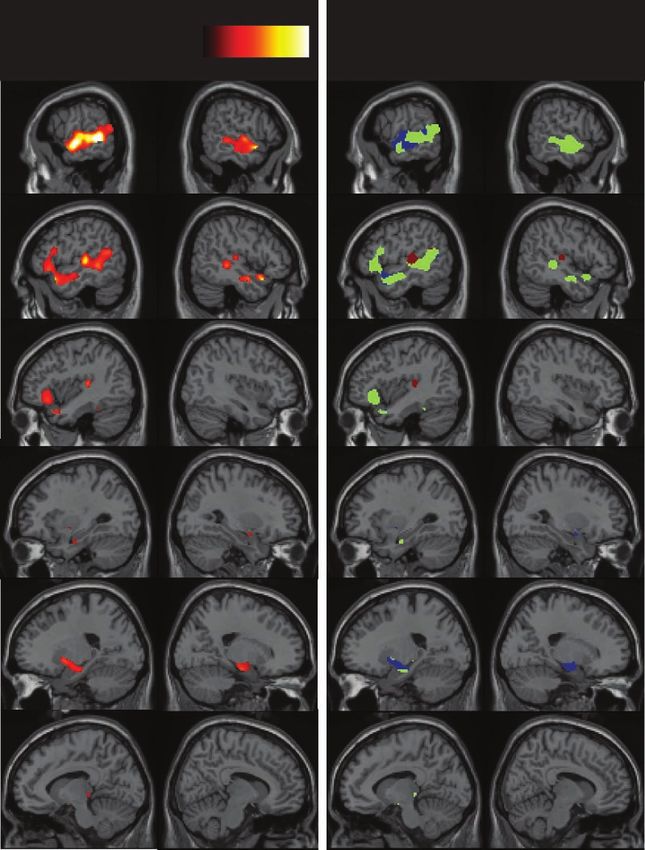
Figure 5. Brain regions that show an interaction between sentence condition (coherent/anomalous) and SNR (−5 to 0 dB, clear speech).
(A) Interaction map displayed at a threshold of p < .05 FDR corrected within a search volume of intelligibility-responsive regions (see Figure 3A).
(B) The interaction map divided into three clusters that show differential response profiles determined by k-means analysis. (C) BOLD responses
compared with SCN baseline for all sentence conditions/SNRs for a voxel in the inferior frontal gyrus cluster (Cluster A, blue in Figure 4B). Error
bars show standard error without between-subjects variance (Loftus & Masson, 1994). (D) BOLD response of a voxel in the left hippocampus
(Cluster B, red in Figure 4B). (E) BOLD response of left posterior MTG (Cluster C, green in Figure 4B).
3924 Journal of Cognitive Neuroscience Volume 23, Number 12
Downloaded from http://www.mitpressjournals.org/doi/pdf/10.1162/jocn_a_00084 by guest on 18 October 2021Table 2. Sentence Type × SNR Interaction
MNI Coordinates
Location Voxels (n) p (FDR) Z x y z
B
L medial temporal/basal ganglia
Lentiform nucleus 269 .006 4.35 −18 2 −6
Hippocampus .009 3.58 −14 −2 −14
Hippocampus/Parahippocampus .013 3.28 −16 −16 −18
Downloaded from http://mitprc.silverchair.com/jocn/article-pdf/23/12/3914/1776985/jocn_a_00084.pdf by guest on 18 May 2021
B
R medial temporal
Amygdala/Hippocampus 111 .006 4.28 24 0 −14
R parahippocampal gyrus B
25 .006 4.14 14 −22 −12
*L anterior STG A
37 .006 4.1 −48 4 −16
L Inferior colliculus B
19 .007 3.88 −8 −30 −4
*L inferior frontal gyrusA
IFG (opercularis) 135 .009 3.68 −46 14 18
IFG (triangularis) .031 2.76 −46 28 2
IFG (orbitalis) .046 2.44 −50 22 −6
C
L superior/middle temporal
L posterior STG 319 .009 3.54 −46 −22 8
L posterior MTG .016 3.19 −56 −34 4
L posterior MTG .02 3.05 −64 −48 4
R STGC 64 .012 3.37 52 −28 2
R STG B
31 .024 2.94 54 −10 −14
R STG C
16 .031 2.77 62 0 −10
L STG C
6 .044 2.49 −66 −20 4
Thresholded at p < .05 FDR corrected within region that respond to intelligibility (see Figure 5A). The table shows MNI coordinates and anatomi-
cal location of all peak voxels separated by more than 8 mm in clusters larger than five voxels. Superscripts A, B, and C indicate which of three Prose
type × SNR interaction profiles illustrated in Figure 5B–E is shown by the majority of voxels in each cluster. The temporal profile of the clusters
marked * are plotted in Figure 6.
intermediate SNRs and to anomalous clear sentences. Sta- intelligibility is observed in bilateral regions of posterior
tistical comparison confirmed that this profile significantly Heschlʼs gyrus and planum temporale (red in Figure 4B
differed from the response of Profile A (Clusters × Sentence and C). This response, close to primary auditory regions,
type × SNR interaction, F(6, 72) = 5.678, p < .001) and peaks less than 5 sec after the middle of the sentence
from Profile B (F(6, 72) = 3.019, p < .05). (Figure 4D). Consistent with hierarchical organization,
intelligibility-sensitive anterior and posterior portions of
the MTG and IFG (Cluster B) and medial-temporal regions
The Timing of Neural Responses to Intelligibility
(Cluster C) both show a later response that peaks over
and Sentence Type
5 sec after the middle of the preceding sentence. Pairwise
We applied the k-means procedure to segregate clusters comparison of Clusters A and B showed a significant multi-
that exhibit differential timing of BOLD responses to in- variate Cluster × Time interaction F(4, 9) = 3.914, p <
telligibility (i.e., showing an interaction between intel- .05 and a significant difference in the time of the maxi-
ligibility and time). Incremental clustering of the mean mum response (t(12) = 2.52, p < .05), these differences
response profile suggested three distinct temporal profiles were also reliable for comparison of Clusters A and C
(Figure 4B–D and Table 1), although timing differences (F(4, 9) = 3.860, p < .05, t(12) = 2.50, p < .05). How-
between clusters were only confirmed by significant Clus- ever, comparison of Clusters B and C in leave-one-out
ter × Time interactions in leave-one-out analysis for two analysis shows no significant Cluster × Time interaction,
of the three clusters. The earliest response correlated with (F(4, 9) = 1.239, ns) nor any significant difference in peak
Davis et al. 3925
Downloaded from http://www.mitpressjournals.org/doi/pdf/10.1162/jocn_a_00084 by guest on 18 October 2021latency (t(12) = 0.959, ns), suggesting that the timing
differences apparent in Figure 4C may be artifacts of the
clustering procedure. Although we must necessarily be
cautious in drawing conclusions from differences in timing
between regions, we note that equivalent differences in
temporal profile are absent when we assess a low-level
baseline contrast (SCN versus rest), despite all three clus-
ters showing a reliable response (the average response
over time and voxels is significant at p < .001 in all three
clusters). Hence, differences in the temporal profile of the
Downloaded from http://mitprc.silverchair.com/jocn/article-pdf/23/12/3914/1776985/jocn_a_00084.pdf by guest on 18 May 2021
three clusters in response to intelligible speech seem un-
likely to be explained by hemodynamic variables and rather
by changes in the timing of neural activity over the course
of sentences lasting approximately 3 sec.
Fronto-temporal regions that show an interaction be-
tween Sentence type × SNR (Figure 5A) show some over-
lap with regions that show different temporal profiles in
responding to speech intelligibility (Figure 4B). To assess
differential timing of the Sentence type × SNR interac-
tion, we condensed the three interaction profiles in Fig-
ure 5 into a single contrast that tests for additional activity
evoked by anomalous versus coherent sentences at high
SNRs (clear speech and 0 dB SNR, cluster A in Figure 4B),
and the reverse difference for coherent versus anomalous
sentences at moderate SNRs (−1 and −2 dB, cluster B1).
This contrast captures most of the critical interactions be-
tween SNR and sentence type shown in Figure 5. k-means
analysis of the time-course of this Sentence type × SNR
interaction was then applied to each of the interaction
clusters shown in Figure 5B. However, leave-one-out analy-
sis failed to confirm significant differences in timing, as
shown either by Cluster × Time interactions (Cluster A:
F(4, 9) = 1.042, ns, Cluster B: F < 1, Cluster C, F(4, 9) =
2.062, ns) or by differences in the timing of peak responses
(A: t(12) = 1.379, ns, B: t(12) = 1.032, ns, C: t(12) = 1.620,
ns). Given the importance of the relative timing of frontal
and temporal lobe activity in distinguishing top–down and
bottom–up accounts of speech comprehension, we aver-
aged the response of the inferior frontal regions that show
the predicted interaction between sentence type and speech
clarity, and did the same for anterior temporal regions
(both parts of cluster A in Figure 5B, two regions marked *
in Table 2). The interaction in these two regions averaged
over time (Figure 6A) is essentially equivalent, whereas the
temporal evolution shown in Figure 6B-D suggests some dif-
ferentiation because the peak of the interaction in the ante-
rior STG occurs earlier than in the IFG (Figure 6B, t(12) = Figure 6. Interaction profiles indicative of additional load on semantic
processing during degraded and clear speech comprehension. (A) The
2.347, p < .05), reflecting an interaction that is present at interaction between sentence type and speech clarity averaged over
all time-bins in the anterior STG (Figure 6C) but builds up scans in left anterior STG (cluster peak: −48, +4, −16) and LIFG
over time in the IFG (Figure 6D). Whilst we hesitate to draw (−46, +14, +18) marked * in Table 2. (B) Time of peak interaction
strong conclusions from small differences in the timing of in seconds, measured from the midpoint of the preceding sentence
the hemodynamic response that were insufficiently consis- in these two clusters. Time course of interaction in (C) left anterior
STG and (D) LIFG.
tent to appear in the leave-one-out analysis, we note that this
is the reverse of the temporal profile predicted for the top–
down account in Figure 1B. To the extent that these timing
differences are reliable they are opposite to the predictions
of a top–down account.
3926 Journal of Cognitive Neuroscience Volume 23, Number 12
Downloaded from http://www.mitpressjournals.org/doi/pdf/10.1162/jocn_a_00084 by guest on 18 October 2021DISCUSSION activity during sentence comprehension. Interregional var-
iation in the timing of the hemodynamic response (e.g.,
Semantic content is a ubiquitous and powerful aid to speech
because of differences in vasculature) will confound at-
comprehension in noisy environments. However, the neu-
tempts to compare the timing of responses to the same
ral mechanisms responsible remain underspecified. Here,
contrast in different regions. However, between-condition
we test the proposal that top–down neural processes,
comparisons in the same region are interpretable (Miezin,
driven by coherent sentence-level meaning, contribute to
Maccotta, Ollinger, Petersen, & Buckner, 2000; Menon &
the perception of speech under challenging listening sit-
Kim, 1999). With appropriate comparison conditions, then,
uations. Specifically, we examine (a) whether Sentence
it is possible to make some, tentative spatio-temporal in-
type × SNR interactions because of increased difficulty of
ferences concerning the neural systems involved in sen-
Downloaded from http://mitprc.silverchair.com/jocn/article-pdf/23/12/3914/1776985/jocn_a_00084.pdf by guest on 18 May 2021
contextual integration are observed in low-level, perceptual
tence comprehension (cf. Sabatinelli, Lang, Bradley, Costa,
areas as well as in higher-level semantic areas, and (b)
& Keil, 2009, for faces). One reliable finding from our
whether the BOLD signal in areas supporting higher-level,
temporal clustering analysis was that neural responses that
linguistic processes is modulated by sentence content be-
correlate with sentence intelligibility peak earlier in pos-
fore areas supporting lower-level perceptual processes. Be-
terior regions of the STG than in more inferior and anterior
fore discussing these two findings, we first discuss results
temporal regions or in more distant frontal and medial-
concerning the location and timing of BOLD responses
temporal regions. This finding seems unlikely to be ex-
correlated with speech intelligibility. These findings pro-
plained on purely hemodynamic grounds because we see
vide methodological validation for our use of the location
differences in the timing of the response to intelligibility
and timing of interactions between sentence type and
in spatially contiguous regions (e.g., left posterior STG/
speech clarity as evidence for top–down neural processes
MTG) that share the same blood supply and vasculature.
in the comprehension of degraded speech.
Furthermore, the clusters identified in temporal clustering
of intelligibility responses do not show similar hemody-
namic timing differences in their response to nonspeech
Timing of Responses to Intelligible Speech
stimuli (such as for SCN vs. silence).
Consistent with previous studies (Okada et al., 2010; Awad, Our observation of earlier responses to intelligible
Warren, Scott, Turkheimer, & Wise, 2007; Obleser et al., speech in regions close to auditory cortex is also consis-
2007; Davis & Johnsrude, 2003; Scott, Blank, Rosen, & tent with the results of magnetoencephalography studies
Wise, 2000), activity in a fronto-temporal network (includ- of single-word perception (see Pulvermuller, Shtyrov, &
ing left frontal cortex, bilateral temporal cortex, hippo- Hauk, 2009; Marinkovic et al., 2003) and of EEG studies
campus, and subcortical structures) correlated with the that compare the timing of mismatch responses for un-
intelligibility of spoken sentences (Figure 4A). Going be- expected phonetic and semantic elements (Uusvuori,
yond previous studies, two different clusters of activity Parviainen, Inkinen, & Salmelin, 2008; van den Brink,
can be identified on the basis of their different temporal Brown, & Hagoort, 2001; Connolly & Phillips, 1994). These
profiles (Figure 4B–D). The cluster with the shortest peak electrophysiological measures have many advantages in
latency, included regions posterior to Heschlʼs gyrus in the determining the timing of neural responses on the msec
STG bilaterally. The rest of the intelligibility-responsive scale. However, combined analyses of responses to speech
regions showed a significantly longer latency response, in- content and auditory form in source space are required to
cluding anterior STG/MTG and posterior MTG regions, infer the direction of information flow in neural systems
the left lentiform nucleus and hippocampal formation, as (see Gow, Segawa, Ahlfors, & Lin, 2008, for illustrative data
well as the LIFG. Previous work has shown longer tempo- from phoneme and word perception). In the absence of
ral receptive fields for speech responsive regions further similar data for effects of sentence type on responses to
from auditory cortex (Lerner, Honey, Silbert, & Hasson, degraded speech, our results from time-resolved fMRI pro-
2011), differences in the phase lag of the BOLD signal vide a novel source of evidence concerning top–down and
(Dehaene-Lambertz et al., 2006), and directional influences bottom–up neural mechanisms responsible for behavioral
using dynamic causal modeling (Leff et al., 2008), all of effects of semantically constraining context on the com-
which are consistent with the earlier responses to speech prehension of degraded speech.
intelligibility we observed in the posterior STG. These tem-
poral profiles are also consistent with hierarchical models
Interactions between Sentence Content and
of the auditory system (Price, 2010; Hackett, 2008; Davis
Speech Clarity
& Johnsrude, 2007; Kaas et al., 1999), with lower-level per-
ceptual processes occurring in or near Heschlʼs gyrus (HG) The data presented here highlight neural systems that con-
and higher-level, linguistic processes supported by more tribute to the perception and comprehension of spoken
distant regions along the lateral temporal STG, STS, and sentences in suboptimal listening conditions similar to
MTG, anterior and posterior to HG, and LIFG. those found in everyday life. A network of frontal and tem-
It could be argued that BOLD fMRI is ill-suited to detect- poral lobe regions (Saur et al., 2008) respond to these chal-
ing what may be subtle differences in the timing of neural lenging listening situations with computations that appear
Davis et al. 3927
Downloaded from http://www.mitpressjournals.org/doi/pdf/10.1162/jocn_a_00084 by guest on 18 October 2021You can also read