TONS FOR THE TRASH - 2012 STUDY - WWF DEUTSCHLAND
←
→
Page content transcription
If your browser does not render page correctly, please read the page content below
STUDY

 2012

Nutrition Food losses Land consumption

 Tons for the trash
Imprint

Published by    WWF Germany, Berlin
                September 2012
Authors         Steffen Noleppa, Harald von Witzke
Coordination    Tanja Dräger de Teran/WWF
Editors          Tanja Dräger de Teran/WWF, Thomas Köberich/WWF, Andreas Müller-Seedorff
Contact         tanja.draeger-deteran@wwf.de
Design/Layout   Thomas Schlembach/WWF Germany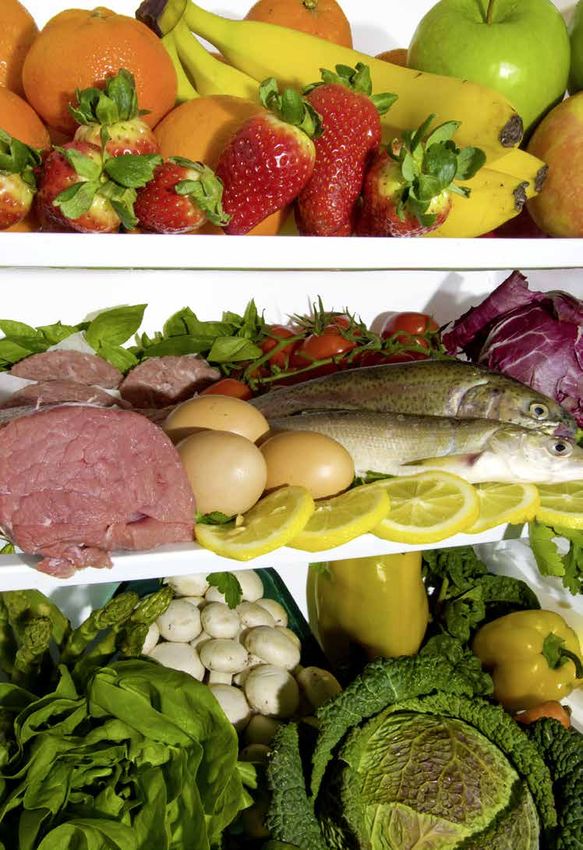
Summary                                                                                    5

1     Problem definition and objectives                                                     8

2	Eating habits and dietary intake recommendations                                        10

3	Sources, causes and the extent of food losses                                           20

4     Definition of scenarios for further analysis                                        26

5	Impacts of a healthier diet on Germany’s land footprint                                30

6     Impacts of a reduction of food waste on Germany’s land footprint                    38

7     Conclusions and Outlook                                                             44

      WWF recommendations                                                                 47

      WWF recommendations with respect to food losses                                     48

      WWF agricultural policy demands                                                     49

	References                                                                               50

                                                                         Tons for the trash | 3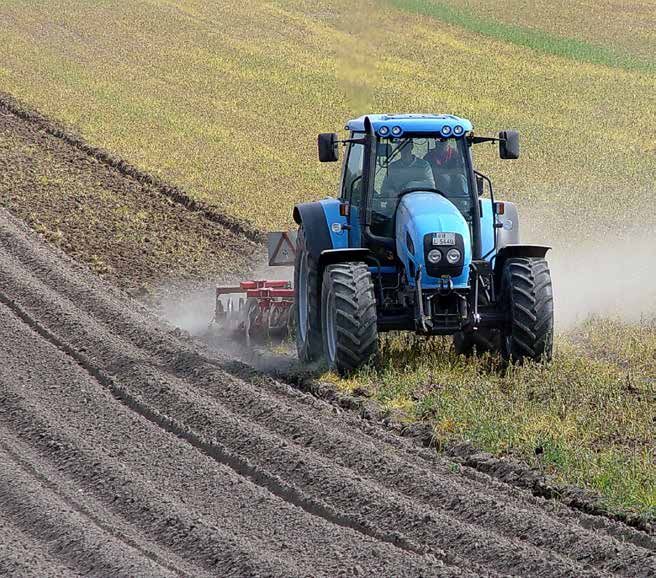
Summary
Agricultural land use occupies approximately 5 billion hectares worldwide. Of
those, 3.9 billion ha (80 %) are used for livestock, i.e. ultimately for the production
of livestock-based foods. Already, one third of the global land surface is utilized for
livestock production. And as global demand for meat continues to grow, so does the
area of land needed for its production. Demographic forecasts predict that by 2050 we
will need to feed 9 billion people. Based on this scenario, we can therefore expect that
the competition for land will accelerate. But agricultural expansion is already causing
drastic losses of natural ecosystems which in turn is leading to a dramatic decline in
biodiversity.
But what can we do here in Germany? To what extent does our own lifestyle here,
which includes our dietary preferences, contribute to global land consumption? The
present study addresses this question and looks at how we can reduce land consump-
tion by adopting a healthier diet and a more prudent attitude to dealing with food.
There is considerable potential.
»»At present, German annual per capita land consumption stands at 2,900 m².
»»Due to its excessive requirement for land needed to satisfy domestic demand,
Germany utilizes an additional 6.8 million ha of agricultural land outside of
its territory.
»»Feedstuffs are primarily responsible for this situation. Germany’s imports of soya
beans and soya bean products alone require approximately 2.5 million ha of virtual
net land areas outside of the EU, primarily in Brazil and Argentina.
»»The reason is this: Compared to other countries, people in Germany eat too much
meat. Not only does this impact on their health but their big appetite for meat is
also detrimental to land resources.
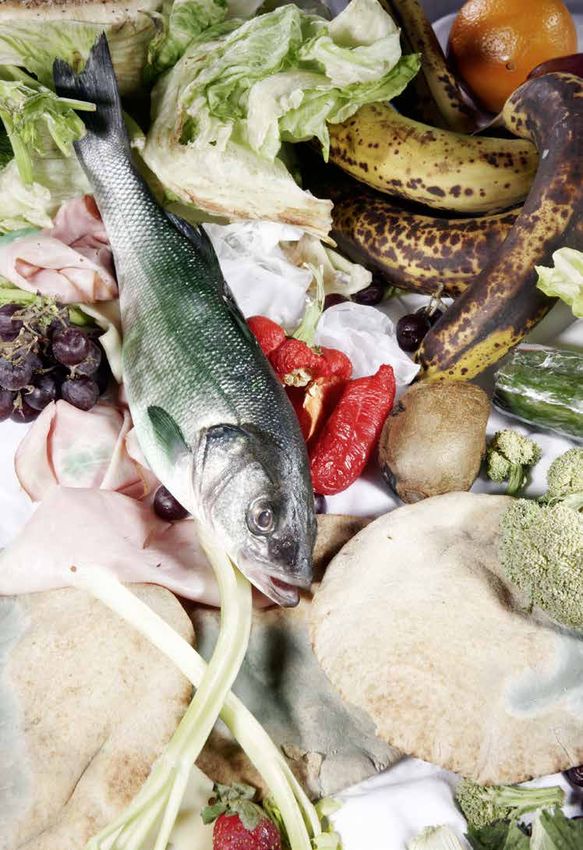
»»A further environmentally detrimental aspect of the way we eat are food losses. On
average about 25 % of all purchased foods in Germany end up in the waste bin.
»»It is estimated that end consumers in Germany throw away 6.6 million tonnes of
food per year or 80 kg per head of population. In financial terms this equates to an
estimated loss of EUR 25 billion.
»»Some of the reasons for these food losses include: poor pre-shop planning, incorrect
storage, not understanding the meaning of ‘best before’ dates, and often oversized
portions in the catering industry.
Against this background, this study addresses the following questions:
»»What is the current typical average German diet?
»»What kind of diet would be advisable from a health point of view?
»»What types of food are most often thrown out by consumers?
»»What is the estimated extent of avoidable losses?
Tons for the trash | 5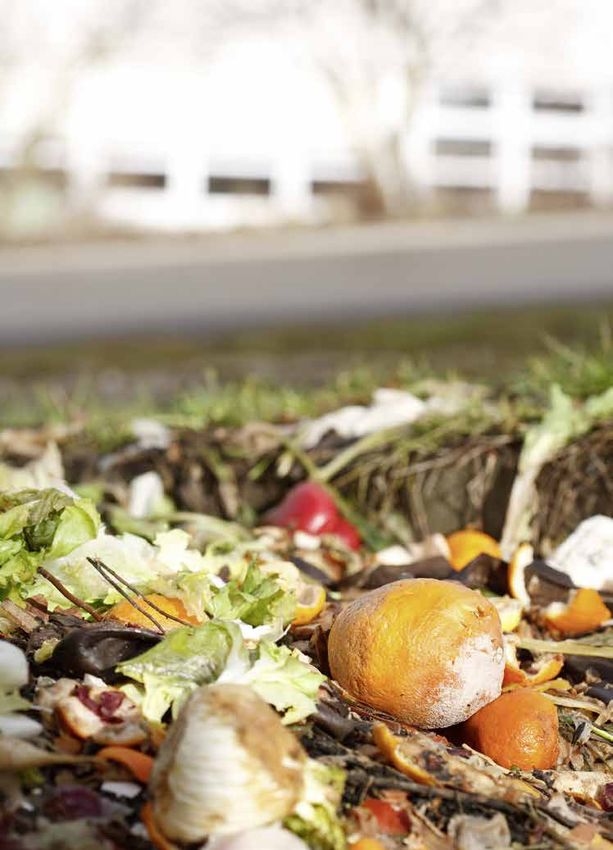
Based on scenarios, this study outlines in how far a healthier diet and a more prudent
attitude to dealing with our food can impact on the Germans’ “land footprint”. The
scenarios for both a healthier diet and improved handling of purchased foods respec-
tively very clearly show that enormous “savings” can be made in terms of land consump-
tion, thus freeing up land for other land uses.

»»If, for example, the Germans refrained from meat consumption once a week,
    595.000 ha of land could be available for other uses. This equates to twice the
    territory of the federal state of Saarland.

»»A much greater effect could be achieved if the Germans followed the dieticians’
    advice: 1.8 million ha of land could be ‘released’, an area the size of the federal state
    of Saxony. For soya production alone 826.000 ha of cropland would no longer be
    needed.

These examples demonstrate that a healthy diet reduces the pressure on land
resources, especially in Argentina, Brazil and in other South American countries.

To eat a healthy diet also means to consume less of some foods and more of others,
if they are beneficial to one’s health. This has been considered in the scenarios. For
example, the increased demand for bread grains would necessitate an extra 800.000
ha of cereal cropland. Solely considering lowered meat consumption, the area of land
needed would be reduced by 3.7 million ha. This means that if the entire German
population followed the dieticians’ recommendations, the per capita land footprint of
our meat consumption alone could almost be halved from 1,000 m² to a mere 577 m².

A more prudent attitude to dealing with food would also provide “savings” in terms
of land area. 1.2 million ha could be “gained” if avoidable losses were even just halved
and more than 2.4 million ha if avoidable losses were eliminated completely. The
German per capita land footprint for food could be reduced by more than 13 % from
approximately 2.300 m² to 2.000 m². Despite the relatively small quantities of meat
that are thrown away, meat is significant in this context due to its specific land foot-
print. The production of all the livestock-based foods that are being thrown out – be
they yoghurt, egg products, sausage or other meat products – required 1.4 million ha
of agricultural land of which 730.000 ha was needed for meat production alone.

The results make it very clear that a healthier diet and a more prudent way of dealing
with food is not only badly needed but it is possible too and has the potential to subs-
tantially reduce the area of land needed for food production. The areas thus released
from production could be devoted to other land uses and contribute to meeting global
challenges such as the protection of resources and ecosystems and the security of
world food supplies.

If it was possible to motivate the Germans to tackle both issues, i.e. to change their
eating habits and to waste less food, significantly less arable land and grassland
would be needed. It would be possible to reduce the German per capita land footprint
resulting from the consumption of agricultural commodities by at least 500 m² down
to approximately 2.900 m².

                                                              Tanja Dräger de Teran, WWF

6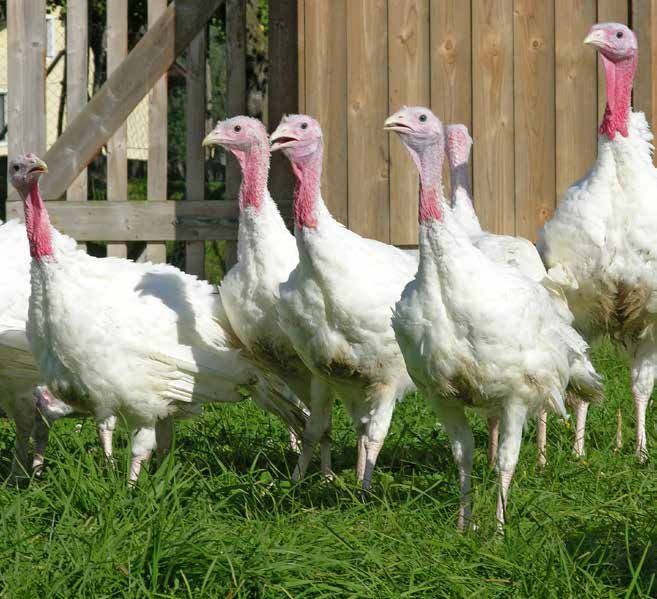
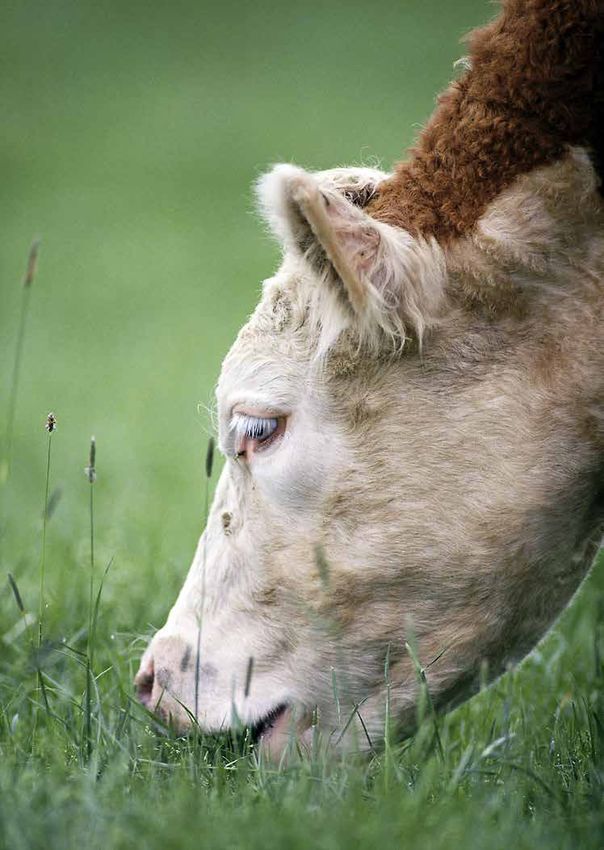
Globally, livestock production is the largest land use by far in terms of area. Already about a third of the land area world-
wide is used to produce livestock. It is used either for grazing or as arable land to produce livestock feed.

1 Problem definition and objectives
                  Meat determines the type of land use
                  Around the globe, people are consuming more and more meat. In response to the
                  rising demand for meat and other agricultural commodities, significant land use
                  change for agricultural purposes is underway all over the world such as the cutting
                  down of tropical rainforests and ploughing up of grasslands, with serious repercus-
                  sions for the climate, the global water regime and regional species diversity.

                  In how far does Germany contribute to this problem? How much land area do
                  Germany’s inhabitants “use” as a result of their eating habits? What is the size of their
                  meat consumption’s land footprint?

                  In light of the problems outlined above, these and other questions are at the core of
                  the first part of a larger WWF project: a study entitled “Meat eats Land” (hereinafter
                  cited as von Witzke et al., 2011). In brief, the study shows that our strongly meat-
                  based diet is a key driver of land use – in Europe and beyond. A more conscious
                  approach to food would appear to be not only appropriate but necessary.

                  Meat consumption is particularly high in Germany
                  By international comparison, meat consumption is particularly high in Germany.
                  Germany’s 16.9 million ha of domestic agricultural area are not sufficient to fully meet
                  domestic demand for agricultural commodities. Germany “occupies” more than 6.8
                  million ha outside of its territory over and above its own agricultural land base (von
                  Witzke et al., 2011). The bulk of that acreage is devoted to the production of livestock
                  feed. The importation of soya and soya products alone results in virtual net land
                  imports from outside of the EU in the order of 2.5 million ha, mostly from Brazil and
                  Argentina.

                  To satisfy the demand for soya required to produce the meat products consumed
                  within Germany, the entire territory of the Free State of Saxony would need to be
                  devoted to soya cropping. If other feedstuffs are included in the calculation, more
                  than 1.000 m² per inhabitant are currently required to meet the annual demand for
                  meat in Germany. For comparison, the per capita demand for potatoes equates to
                  15 m², the demand for wheat to 100 m² of agricultural land.

                  The impact of changing eating habits and
                  the way we deal with food
                  Lower meat consumption would presumably have a significant impact on resource
                  management and in particular on the amount of land used for agricultural produc-
                  tion. Further research is needed on eating habits and their successive modification
                  in order to verify this assumption. Many questions arise in this context: How can
                  changes in dietary patterns be instigated and what would be the impact on Germany’s
                  land consumption? How would changing eating habits impact on demand for feed-
                  stuffs such as soya and other agricultural commodities? The following analysis will
                  focus on these and other questions.

                  8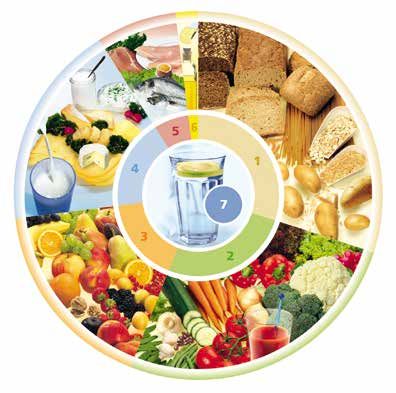
Aims of the study
A reduction in land consumption by Germany’s inhabitants can be studied from two
different perspectives:

»»From a nutritional standpoint, Germans eat too much meat (von Witzke et al.,
  2011). The German Nutrition Society (DGE) recommends a level of meat consump-
  tion at about half of what is currently being consumed in Germany (DGE, 2009;
  MRI, 2008). The question remains as to the impact eating habits based on scientific
  recommendations would have on meat consumption and on the consumption of
  land resources.

»»A second perspective is that of resource utilization and protection. Eating habits are
  not only reflected in consumption per se but also in a general approach to dealing
  with food. The high food losses in particular are a much discussed topic in both the
  general public and scientific circles (see i.a. Gustavsson et al., 2011; Stuart, 2011;
  WRAP, 2011). There are great overall food losses between initial production and
  final consumption. The question we ask here is about the expected impacts on food
  consumption and thus also on land consumption of a more conscious way of dealing
  with food and of efforts to minimize losses on the part of the consumers.

Report structure
With a view to answering the above questions, this report, which also documents the
results of the WWF study’s second part, is structured as follows:

»»Chapter 2 describes today’s eating habits of Germany’s inhabitants and outlines
  how they could eat more healthily, with reference to DGE recommendations and
  additional scientific findings.

»»Chapter 3 looks at food losses. It highlights the fact that not all the foodstuffs that
  are available are actually consumed and that the wastage of resources is a particu-
  lar burden resulting from our current eating habits.

»»Chapter 4 presents possible scenarios of changes in dietary patterns. These pat-
  terns are based on the findings derived in Chapters 2 and 3 and serve as a basis for
  further analysis.

»»Chapters 5 and 6 discuss specific results of the analysis. Chapter 5 discusses the
  impact of a diet guided by scientific recommendations. Chapter 6 describes the
  impacts of reductions in food waste. In particular, in this Chapter, a land footprint
  is calculated for Germany with a view to individual food groups or agricultural
  primary products.

Chapter 7 finally presents new interim conclusions and an outlook towards the third
and final part of the WWF project which focuses on the impacts of meat consumption
and land consumption on climate change.

                                                                          Tons for the trash | 9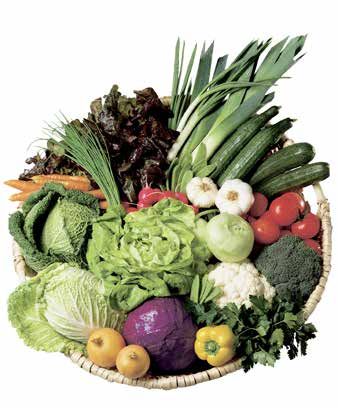
2 Eating habits and dietary intake recommendations
                       Preferences v. recommendations –
                       Meat consumption in Germany

      Germans eat      Nowadays, Germany’s inhabitants eat too much meat. In short, this is the key result
                       of the study on eating habits (von Witzke et al., 2011). With an annual per capita meat
   100 times more      consumption of more than 88 kg, Germany ranks almost 10 % above the EU average.

   meat than beans     Global average meat consumption stands at less than 40 kg per person (Weick, 2010).
                       More than 56 kg of the 88 kg of meat consumed are pork, followed by almost 19 kg
       and pulses.     of poultrymeat and approximately 13 kg of beef. Since 1950, meat consumption in
                       Germany has more than doubled.

                       Meat consumption is not a bad thing in principle. Amongst other constituents,
                       meat proteins are a valuable addition to the human diet. However, there are also
                       other foods that contain proteins. It is therefore all the more surprising that over
                       the past decades other protein sources, primarily legumes (beans and pulses), have
                       increasingly been dropped from the average diet. Until the mid-19th century, roughly
                       equal quantities of meat and legumes were consumed. Nowadays, meat consumption
                       outranks the consumption of peas, lentils and beans by a factor of more than 100:1.
                       If one compares current meat consumption levels with available recommendations for
                       healthy eating it is very evident that the Germans eat far too much meat. The DGE’s
                       scientifically based recommendations for a “correct” diet clearly favour a more diverse
                       diet with less meat and a greater focus on plant foods such as fruit, vegetables and
                       cereals (DGE, 2008). Meyer and Sauter (2002) similarly advocate greater substitution
                       of fruit and vegetables as well as dairy and cereal products for meat and animal fats.
                       It seems reasonable therefore to use scientific findings such as those publicized by
                       DGE as a basis for a comparison of actual eating habits with guidelines for recom-
                       mended intakes.

                       A comparison of dietary intake recommendations and food
                       consumption surveys

            To eat a   How can we make such a comparison? The DGE recommendations refer to net food
                       consumption and thus consider losses during transport and at the consumer level.
      “correct” diet   They are calculated based on dietary reference intakes (see DGE, 2008) and refer to

 means to eat much     individual food items such as sausage, cheese, yoghurt, bread or pasta. In contrast,
                       gross and net food consumption data in sector-specific statistics (cf. BMELV, 2011;
 less meat and a lot   BVDF, 2010) are compiled on a completely different basis:

   more vegetables,    »»Gross consumption figures are usually taken from agricultural statistics and can be
   rice and cereals.        directly (for wheat, pork etc.) or indirectly (butter from milk, sugar from sugarbeet)
                            assigned to agricultural primary products.

                       »»Specific correction factors are applied to these figures to account for non-edible
                            product components and arrive at actual consumption figures (Dämon & Widhalm,
                            2003). For example, a 30 % deduction is made in the case of meat. However,
                            these consumption figures do not yet take account of losses due to spoilage and
                            household-level processing or of the fact that some food is simply discarded.

                       10
A solid comparison with the DGE recommendations would require realistic data on
actual food consumption. But such data can only be gathered using weighing proto-
cols, dietary recall surveys, diet histories and other types of food surveys (Dämon &
Widhalm, 2003; MRI, 2011). Moreover, comparisons must be undertaken at the level
of certain food groups and population segments to which the DGE recommendations
relate.
DGE recommendations for adults
As an example, Fig. 2 outlines a DGE recommendation, in this case the so-called basic
plan for adults. Considering the DGE data, it must be pointed out that figures are not
available for all age-classes and all sub-groups of the population. While the largest
sub-group, i.e. adults of 19 years and over, is well catered for (DGE, 2009), children
and adolescents are not. Moreover, while the DGE data contain recommendations
for certain sub-groups such as the senior population, these recommendations do not
significantly diverge from those for other adults. There is no comprehensive set of
DGE reference values for all sub-groups of the population. It is therefore not possible,
based on the DGE information alone, to arrive at a mean comparison between recom-
mended and actual consumption amongst all sub-groups of the German population.
Additional survey data will need to be obtained to this end.
Figure 2.1
DGE Basic plan Cereals, cereal products and potatoes
for adults as a guideline for »»Bread 200–300 g (4–6 slices) or bread 150–250 g (3–5 slices)
daily food intake
plus 50–60 g of cereal flakes
Source: Own illustration after
»»Potatoes 200–250 g (cooked) or pasta 200–250 g (cooked)
DGE (2004) or rice 150–180 g (cooked)
»»Give preference to wholemeal products
Vegetables and lettuce
»»
Vegetables: total of 400 g or more
»»
Vegetables 300 g cooked plus raw vegetables/lettuce 100 g
or vegetables 200 g cookedplus raw vegetables/lettuce 200 g
Fruit
»»
2–3 portions of fruit (250 g) or more
Milk and dairy products
»»
Milk/yoghurt 200–250 g
»»
Cheese 50–60 g
»»
Give preference to low-fat products
Meat, sausage, fish and eggs (per week)
»»
Meat and sausage: max. 300–600 g in total
»»
Give preference to low-fat products
»»Fish: Marine whitefish 80–150 g plus marine oily fish 70 g
»»Eggs: up to 3 eggs (including eggs used in other dishes)
Fats and oils
»»
Butter, margarine: 15–30 g
»»
Oil (e.g. rapeseed, soya, walnut oil): 10–15 g
Beverages
»»
1.5 litres, preferably low-calorie drinks
Tons for the trash | 11FKE recommendations for young children and adolescents
Similar to the DGE providing recommendations for adults, the Forschungsinstitut für
Kinderernährung (Research Institute for Childhood Nutrition, FKE) issues dietary
intake recommendations for young children and adolescents. These are based on the
so-called optimised mixed diet (Alexy et al., 2008). It is tailored to seven individual
age groups from weaned infants to 18 year-olds. Similar to the approach taken by the
DGE, recommended daily amounts of certain food groups are given as appropriate to
the children’s age.
Figure 2.2 gives an overview of available recommendations issued by DGE and FKE
for age groups ranging from childhood to old age. Technically, the guidelines issued by
DGE and FKE respectively can easily be combined. However, in contrast to DGE, the
FKE datasets do not break down the ‘dairy products’ and ‘fats and oils’ categories.
Figure 2.2
DGE FKE
Available recommendations
issued by DGE and FKE Cereals, cereal products and potatoes
for the intake of certain of which
food groups
potatoes P P
Source: Own illustration
Bread/cereals P P
Vegetables and lettuce P P
Fruit P P
Milk and dairy products P
of which
Milk P
Dairy products P
Meat, sausage, fish and eggs
of which
Meat and sausage P P
Fish P P
Eggs P P
Fats and oils P
of which
Butter P
Vegetable oils P
Beverages P P
12Consumption data for adolescents and adults: the National
Nutrition Survey
Real data are used for comparisons with recommendations. These are survey data
obtained by the Max Rubner Institut (MRI) as part of the most recent large-scale
German National Nutrition Survey (Nationale Verzehrstudie, NVS) (MRI, 2008).
The study provides net consumption data for individual foods or food groups by age
group, which were obtained using standard methods as outlined above (see Dämon
& Widhalm, 2003; MRI, 2011). The NVS provides up to date gender-specific food
consumption information for the following age groups:
»»14–18 Years
»»19–24 Years
»»25–34 Years
»»35–50 Years
»»51–64 Years
»»65–80 Years
Consumption data by age group are broken down into i.a. the following food groups:
»»Bread and cereal products
»»Vegetables, mushrooms and beans/pulses
»»Potatoes
»»Fruit and fruit products
»»Fats
»»Meat, sausage and other meat products
»»Fish
»»Beverages
Many of the food categories used for the purposes of the NVS therefore correspond to
those used by DGE and FKE.
Consumption data for children and senior citizens:
EsKiMo and ErnSTES data
The NVS does not provide data for young persons below the age of 14 or for senior
citizens above the age of 80. However, gaps in the data set can be filled in other ways:
»»Data for young children aged six months to five years are available from the VELS
survey on food intake by infants and young children (Verzehrstudie zur Ermittlung
der Lebensmittelaufnahme von Säuglingen und Kleinkindern) (see Vohman et al.,
2011). Data for 6 to 17 year olds were collected by the EsKiMo study (Ernährungs-
studie als KiGGS-Modul), a nutrition survey carried out as part of the KiGGS
(Kinder- und Jugendgesundheitssurvey), a study assessing the health of children
and adolescents in Germany (see Mensink et al., 2007). The nutritional status of
children and adolescents is thus well documented and the data are well suited to
comparisons with the FKE recommendations since the studies use comparable food
group classifications. The exception are carbohydrate foods such as potatoes and
cereal products which are aggregated in the VELS and EsKiMo studies.
»»Similar survey data are available for senior citizens aged 80 to about 95 from the
2008 ErnSTES study on nutrition of older people in elderly care facilities (Studie
zur Ernährung älterer Menschen in stationären Einrichtungen) (cf. DGE, 2008).
Tons for the trash | 13Good quality real data are thus available as a basis for comprehensive comparisons
with the DGE and FKE recommendations. They cover a variety of food groups and
almost the entire age spectrum of the population. The only exception are infants less
than six months of age; no comparison can be drawn for this age group.
Summary: Data sources for consumption data and
recommended intakes
Figure 2.3 gives a summary list of the data basis for different age groups utilized for
the investigations to follow below.
Figure 2.3
Consumption data Recommended intakes
Comparable datasets on
eating habits and dietary up to 1 Year VELS FKE
intake recommendations up to 4 Years VELS FKE
in Germany for a range
of age groups up to 5 Years VELS FKE
up to 7 Years EsKiMo FKE
Source: Own illustration
up to 10 Years EsKiMo FKE
up to 12 Years EsKiMo FKE
up to 15 Years EsKiMo FKE
up to 19 Years EsKiMo FKE
up to 24 Years NVS DGE
up to 34 Years NVS DGE
up to 50 Years NVS DGE
up to 64 Years NVS DGE
up to 80 Years NVS DGE
over 80 Years ErnSTES DGE
Figure 2.4
The DGE uses this food circle
to visualize its
recommendations.
A wholesome diet should
include the food groups
shown and symbolized by
selected representative foods
in the relative
quantities as depicted.
1:Cereals,
cereal products
potatoes
2: Vegetables, lettuce
3: Fruit
4: Milk, dairy products
5: Meat, Sausage, Fish, Eggs
6: Fats, oils
7: Beverages
Copyright: Deutsche Gesell-
schaft für Ernährung
e. V., Bonn
14Required differentiation by age, gender, and food groups
Whenever either the consumption data or the dietary intake recommendations
changed from a given age onwards, a separate age group was defined for the purposes
of this study. Exactly which of the data were juxtaposed is shown in Figure 2.5 by way
of example for boys and girls aged 13-15 and for men and women aged 35-50.
It should be noted that in cases where DGE or FKE recommendations were not gender-
specific but were given as a range, the higher value was assigned to males and the lower
value to females. This might appear arbitrary but where gender-specific values are not
given there is not really an alternative to this approach. Moreover, any potential impact
this may have on the final result will be more or less cancelled out by the fact that at
50.9 % females and 49.1 % males, gender ratio in Germany’s population is almost even.
Males Females
Age group 13-15 years EsKiMo EsKiMo
FKE recom- FKE recom-
Figure 2.5 consumption consumption
mendations mendations
Actual consumption figures figures figures
and dietary intake Meat, meat products 148 75 98 65
recommendations in
Fish, fish products 9 14 8 14
Germany for the
“13-15 years” and Eggs 27 20.7 21 20.7
“35-50 years” age groups Milk, dairy products 401 450 314 425
(in g or ml per day)
Fats 36 40 30 35
Source: own compilation Bread, rolls, pastry, cake 197 300 165 250
Carbohydrate foods (pasta,etc.) 160 124
330 270
Potatoes, potato products 99 87
Vegetables, vegetable products 204 300 218 260
Fruit, fruit products 185 300 187 260
Jam, marmalade 9 n.a. 4 n.a.
Sugar, sweets 75 n.a. 67 n.a.
Alcohol-free beverages 1.716 1.300 1.615 1.200
Males Females
Age group 35-50 years NVS NVS
DGE recom- DGE recom-
consumption consumption
mendations mendations
figures figures
Meat, meat products 167 86 88 43
Fish, fish products 30 31 22 20
Eggs 21 25 17 17
Milk, dairy products 261 310 236 260
Fats 30 45 20 25
Bread, rolls, pastry, cake 300 200
Carbohydrate foods (pasta) 327 250
250 200
Rice or 180 or 150
or 250 or 200
Potatoes, potato products 170 68
Vegetables, vegetable products 230 400 260 400
Fruit, fruit products 217 250 259 250
Jam, marmalade 17 n.a. 15 n.a.
Sugar, sweets 41 n.a. 35 n.a.
Alcohol-free beverages 1.806 n.a. 1.844 n.a.
Tons for the trash | 15Judging from the data in Fig. 2.5 and analogous information for the other age groups,
which can be made available on request, it indeed appears that in Germany people
across all ages consume too much meat and insufficient amounts of other food groups
such as fruit and vegetables or carbohydrate foods.
Changes in consumption data if dietary intake
recommendations were adopted
How would the consumption data change and what specific changes would there be
in the food groups given above if every person living in Germany, from infants to the
oldest senior citizens, fully adopted the dietary intake recommendations? This is the
question we will address below.
To answer this question, the individual discrepancies between actual consumption
(based on VELS, EsKiMo, NVS and ErnSTES) and the corresponding recommenda-
tions (after FKE and DGE) were weighted appropriately for the proportion of each age
group in the overall population (see Destatis, 2011). The result is given in Fig. 2.6.
Figure 2.6 Meat, meat products 56.0 %
Ratio of dietary guidelines Fish, fish products 98.6 %
to current consumption
Eggs 117.0 %
habits in Germany
(current consumption Milk, dairy products 115.6 %
= 100 %) Fats 137.5 %
Cereals, cereal products 144.0 %
Source: own calculations
Rice 157.6 %
Potatoes, potato products 67.6 %
Vegetables, vegetable products 175.4 %
Fruit, fruit products 106.4 %
Sugar, sweets 65.9 %
However, the food groups listed in Fig. 2.6 slightly diverge from those given in Fig.
2.5, which calls for some discussion:
»»To recap: It is the aim of the study to determine the land footprint of altered dietary
patterns in Germany. To this end it is important to closely correlate dietary styles
with the agricultural primary products consumed. The definition of food groups as
given in Fig. 2.6 has already achieved this in part.
»»It is not always easy to assign certain foods to food groups, especially the carbohy-
drate foods identified in Fig. 2.5. This is because different sources deal with them
at different levels of aggregation, resulting in differences in the composition of food
groups. Some of the consumption surveys refer to them as components of other
foods (high level of aggregation) while others list them as discrete items (potatoes,
rice, cereal products), making it more difficult to arrive at generalized conclusions
across all sub-sections of the population. However, it has been possible in many
cases to disaggregate existing aggregations into discrete items, for example by
referring to DGE menu recommendations and the ratios of individual carbohydrate
foods contained therein. This approach allowed for the separation of cereals, rice,
and potatoes respectively and rendered later analysis considerably more product-
specific.
16»»A note on sugar: DGE recommends to refrain from any additional consumption of
sugar as the daily food already contains large quantities of monosaccharides and
disaccharides, e.g. in baked goods (DGE, 2009). According to the food consumption
surveys, every person in Germany consumes almost 13 kg of sugar per year in the
form of sweeteners and with beverages. People could do completely without this
excess consumption (DGE, 2009) which represents almost a third of the total per
capita sugar consumption of 38 kg (DGE, 2008; Südzucker, 2011), a fact that has
been considered in Fig. 2.6.
Too much meat and sugar – not enough vegetables and cereals
The results reveal some major discrepancies between actual and recommended
consumption in the different food groups:
»»All food groups, except for fish and fish products, are consumed in quantities
diverging from the recommended amounts.
»»The meat consumption figure postulated by Witzke et al. (2011) at being approxi-
mately twice as high as necessary has roughly been verified by the calculations.
Incredibly sweet: »»In contrast, consumption figures for other livestock-based foods (milk, eggs) are
Germans consume slightly below the recommended levels.
38 kg sugar »»With the exception of potatoes and sugar, consumption of plant-based products
per person is below, and in part well below, recommended levels. This is particularly true for
vegetables as well as for rice and other cereals.
per year.
Fruit consumption is also somewhat below recommended levels.
Tons for the trash | 17A note on the further treatment of the different bases
of consumption data
We conclude this chapter with a special note on data acquisition. The various possible
survey methods used to establish food intake were given earlier in this text. As every
method is flawed in one way or another (Dämon & Widhalm, 2003; MRI, 2011) the
results are associated with a degree of uncertainty. The example of meat consumption
demonstrates the impact of methodological discrepancies which may result in misin-
terpretations. At the time the NVS survey data were collected, the statistics showed
a per capita meat consumption of just under 60 kg in Germany (BVDF, 2010; MRI,
2008). The NVS data however indicated a per capita meat consumption of only just
under 45 kg. How can this 25 % discrepancy be explained? In addition to the inherent
methodological errors there are two reasons in particular that must be considered in
any further analysis:
»»The NVS ‘meat and meat products’ food group does not include all items consumed,
as meat or animal fats are also eaten as part of other food groups. These include,
for example, German-style open sandwiches and other sandwiches (breads), pizza
(savoury baked goods), lard (fats), soups, stews and a variety of meat extracts
(others). But even though the meat content of such composite dishes can be
quite high, such imprecise allocations in the NVS can by no means explain the
25 % discrepancy.
»»Rather, these discrepancies can be explained by consumer food losses (spoilage,
food that is discarded etc.) which are not considered as part of the 30 % statistical
correction factor used to calculate net food consumption from gross food con-
sumption figures (see the reasoning earlier in the text). Dämon & Widhalm (2003)
therefore propose a second correction of approximately 15 %.
In total, the additional correction in conjunction with the difficulties of allocation and
the methodological differences may roughly explain the 25 % discrepancy between
NVS intake data and statistical consumption data. But this cannot be said with cer-
tainty. A more detailed analyses of food losses caused by the consumers sheds more
light on the matter. The following chapter is devoted to precisely this issue.
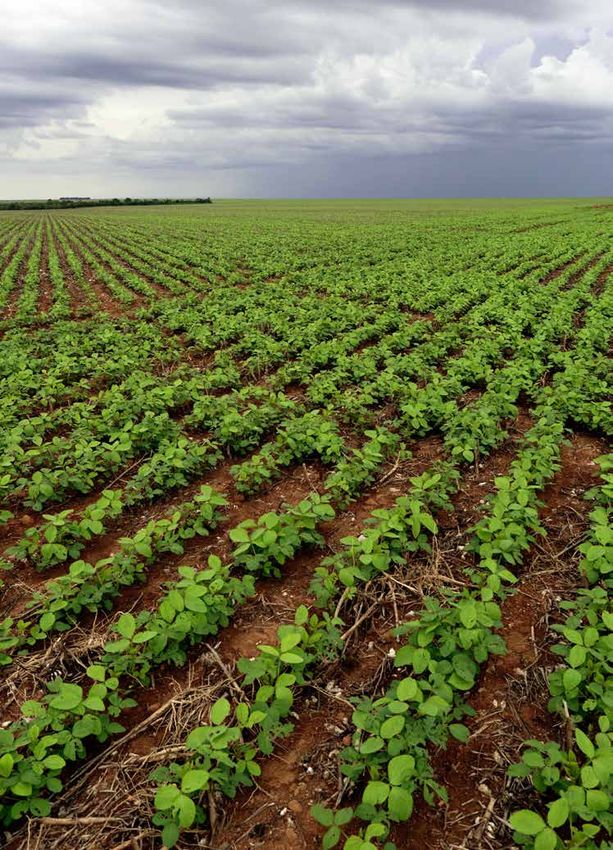
18End consumers in Germany throw out approximately 6.6 million tons of food every year. That is more than 80 kg per person. The bulk of this food “waste” is avoidable. And that’s not all: A family of four could save around 1200 Euro per year.
3 Sources, causes and the extent of food losses
                          Food losses take many forms and generally any initial categorization distinguishes by
                          source. Considering the entire food supply chain from the producer to the consumer,
                          a distinction is generally made between food losses and food waste (see i. a. Foresight,
                          2011; GIZ & SIWI, 2011; Glanz, 2008; Grethe et al., 2011; Gustavsson et al., 2011;
                          Parfitt et al., 2010):

                          »»“Food losses” include all losses of food occurring at farm level, between farmer and
                               processor and further along the supply chain up to and including the wholesale
                               level. These include weather-related losses, harvest and post-harvest losses resul-
                               ting for example from poor harvesting and transport techniques. Additional losses
                               result from poor or overly long storage at the processing and sales levels, from
                               compliance with required quality and packaging standards, at the slaughter and
                               butchering of livestock, as well as from dehydration, cooling etc.

                          »»In contrast, “food waste” is defined at the retail and consumer stages and comprises
                               all losses of food for direct consumption occurring at the retail level, in the catering
                               industry and above all at the level of private households. Food waste includes for
                               example food that is discarded due to expired shelf life dates and confusion over
                               ‘best before’ and ‘use by’ dates. Additionally there is spoilage of food prepared in
                               excess of requirements in private households, canteens and restaurants. It would
                               be wrong to label all these losses as ‘wasted food’ as this category also includes fruit
                               and vegetable peelings, nut shells, bones in meat chops or chicken bones and so on.
                               However, a significant proportion of these losses could be avoided by the consu-
                               mers, as will be outlined further below.

                          It is quite clear from the definitions that any attempt at accurately quantifying food

   It is very difficult   losses is fraught with difficulty, as major uncertainties are associated with their
                          documentation and estimation (Grethe et al., 2011). These uncertainties are particu-
        to accurately     larly significant with respect to food losses as defined above, but they are not without

             quantify     significance either, when it comes to food waste. As a result, estimates covering both
                          types of losses vary significantly. Parfitt et al. (2010) found that ranges between 10
         food losses.     and 50 percent of total global food production
                          are quoted in the literature.

                          Focus on consumer food waste
   More food is lost      As it is the aim of this study to examine dietary patterns and changes in eating
 in the hands of end      habits of end consumers, the remainder of the study will deal solely with food waste,

          consumers       i.e. those losses that are due to or caused by consumers. While an analysis of pre-
                          consumer food losses, i.e. losses at the production and trading levels, would certainly
          than at the     be useful, consumer food waste is generally held to be of much greater significance,

          production      at least in industrialized countries. Monier et al. (2010) estimate that in the EU
                          more than 56 % of overall food losses and waste are generated at household level.
    and trade levels.     The corresponding figure for Germany is as high as 74 %. In developing countries
                          the situation is very different (Grethe et al., 2011; Gustavsson et al., 2011).

                          20
So, what is the scale of food losses at the consumer level? It is estimated that in
Britain 31 % of all foods ready for consumption are lost immediately prior to being
purchased or after having been purchased by consumers (WRAP, 2008). Initially this
proportion appears to be greater than the 27 % estimated for the US (Kantor et al.,
1997), 25 % estimated for Australia (Morgan, 2009), or the estimates for Germany of
It is estimated at least 21 % (Cofresco, 2011) or at least 25 % (Schneider, 2009), with the latter figure
equating to the estimate for Switzerland. However, Hall et al. (2009) now consider
that in private consumer-level food losses in the US to be as high as 40 %, i.e. significantly higher
households in than the estimate given by Kantor et al. (1997).
Germany roughly Due to the lack of comparable methodological standards it is difficult to assess these
a quarter of all food and other figures (see Parfitt et al., 2010), a problem that once again highlights the
evident uncertainties which must be considered in the further analysis of the data.
is discarded. Given these uncertainties, Grethe et al. (2011) conservatively assume a wastage rate by
consumers in industrialized countries of about 25 % of all available foods.
In light of the range of figures cited in the literature it would appear appropriate
therefore to assume a rate of 25 % consumer food losses as an initial rough appro-
ximation for the purpose of further analysis. For Germany, more detailed estimates
are not yet available but a study has been commissioned (Aigner, 2011). However, this
study aspires to not only discuss the general issue of food waste but to also look at
specific products. We must therefore look at losses in the individual food groups.
Considerable differences in levels of wastage
between different food groups
In recent years a number of authors have analysed the scale of food losses, and in
particular household food waste, in various industrialized countries around the
world. These studies include the work of Gustavsson et al. (2011) which covers all of
Europe and North America, Muth et al. (2011) for the United States, Selzer (2010) for
Austria and WRAP (2008) for Great Britain. Taken together, the data contained
in these studies give an indication of the relative differences in food losses by food
groups. Figure 3.1 provides an overview of these data which have been adapted to the
food group classification used in Chapter 2 for reasons of comparability.
It is still not possible to paint a clear picture or derive a clear message from the
data. The differences between the individual studies in terms of their definitions
of food groups and target regions are simply too large. Moreover, the ranges cited
for individual food groups are quite considerable, although they are mostly a result
of differences in terms of freshness and the degree of processing of the products
concerned. Losses in fresh vegetables for example tend to be considerably higher than
for preserved vegetables.
Tons for the trash | 21Figure 3.1 Gustavsson et al. (2011) Muth et al. Selzer WRAP
Food group
Levels of consumer food (2011) (2010) (2008)
waste for individual food
Target region/ North
groups (in %) Europe USA Austria Great Britain
country America
Source: Own illustration after
Meat, meat
Gustavsson et al. (2011), 15 15 15–29 9 13
products
Muth et al. (2011), Selzer
(2010) and WRAP (2008)
Fish, fish
20 42 17–40 13
products
Eggs, egg
23 8
products
Milk, dairy
8 15 8–42 8 3
products
Oils, fats 5 5 15–35
Cereals,
cereal 27 29 14–33 16–19 15–31
products
Potatoes,
potato 24 37 16–28
products
Vegetables,
vegetable 29 40 7–47 19 19–45
products
Fruit, fruit
29 40 8–54 19 26
products
Sugar,
15–34 15 11–17
sweets
However, given the estimated average 25 % food waste discussed above, some general
trends may be deduced:
»»This 25 % average does indeed roughly represent the mean of the range of data
given in Fig. 3.1 and is therefore useful as a rough estimate.
»»Consumer food waste in the “meat and meat products” food group would appear to
be below this value across all the studies identified.
»»Values for wastage of the main carbohydrate foods, and in particular of cereals and
cereal products, are close to this mean.
»»Wastage of fresh fruit and vegetables as well as fruit and vegetable products would
appear to be, at least in part, considerably higher.
22Causes of food wastage at the consumer level
Why is overall food wastage so high? And why is it apparently higher in some food
groups and lower in others? Food waste is attributable to a range of causes (see i.a.
Cofresco, 2011; Kantor et al., 1997; Monier et al., 2010; Parfill et al., 2010; Schneider,
2009; Selzer, 2010; WRAP, 2008). Some of the primary reasons are as follows:
»»Poor pre-shop planning by householders is an important factor. Often too much
food is bought and not eaten in time. Shopping strategies are often poor, especially
if stocks at home are not checked prior to shopping. Additionally shoppers may
respond to offers which tempt them to purchase foods which will not necessarily be
consumed.
»»Foods are often not consumed in time because they are stored incorrectly at home.
Improper storage impacts adversely on taste, freshness and appearance which leads
to food being discarded prematurely.
»»Special preparation techniques such as the peeling, coring and trimming of fruit
and vegetables results in waste, some of which is unavoidable.
Much food »»A further factor are misinterpretations of food date labels. Many products are
discarded prematurely as shelf life dates are unclear, inconsistent or misleading or
is discarded because they are misinterpreted. For example, many consumers do not know that
because the ‘best before’ date merely implies that the product will retain its expected quality
until that date, not that it must be used by that date.
the “best before”
date is »»This latter factor is, for example, an important determinant of the fact that potential
wastage is closely linked to both food date labels and the general shelf-life of food
misinterpreted. products. It explains why fruit and vegetables as well as other fresh products are
more often thrown away unnecessarily than others.
»»Leftovers in catering establishments are a significant factor. More often than not,
portions served at buffets and in the catering sector are too large. Food is often
prepared ahead of demand and must, for reasons of food hygiene, be used promptly
or discarded if it is not requested.
»»Householders also often prepare meals in quantities that are too large to be fully
eaten and which are then discarded, despite the fact that most households have
refrigeration.
The overall picture that emerges in terms of food waste at the consumer level may
End consumers be somewhat vague but is nonetheless remarkable. The amount of food loss at the
throw away household level in Germany was estimated by Cofresco (2011) to cost approximately
6.6 million
EUR 25 billion; according to the same author 6.6 million tons of food are thrown out
annually by German end consumers. This is more than 80 kg per head of population.
It fits with the figure given by Monier et al. (2010) for the EU of 76 kg food waste per
tons of food every person and year at household level. WRAP (2008) give a figure of 70 kg for Britain.
Gustavsson et al. (2011) have however arrived at a higher figure of 95-115 kg per
year. person for Europe and the US together which may be due to the much higher relative
losses in the US (see also Hall et al., 2009).
Tons for the trash | 23These figures refer solely to edible food and must not be confused with kitchen waste,
15 million tons of which are generated annually in Germany (Adhikari et al., 2006).
Such waste generally also includes packaging and inedible components such as fruit
and vegetables peelings or bones (also see WRAP, 2008; 2010).
What are avoidable losses and what is the scale
of avoidable losses?
The majority Realizing the scale of the losses one must inevitably ask how much of the wastage
of food waste listed in Fig. 3.1 is avoidable and also what the term ‘avoidable’ is taken to mean in
this context.
is avoidable.
Many of the issues touched on in the definition of ‘food waste’ given earlier already
hint at wastage that can generally be avoided. The main options are as follows:
»»Portions served in canteens and catering establishments could be more closely
adapted to actual requirements.
»»Food purchases could be more closely tailored to actual need by checking stocks
beforehand.
»»If an item is past its ‘best before’ date, this does not necessarily mean that it must
be thrown out. Consumers should check the food’s quality as there may be no need
to discard it.
»»Leftovers may be frozen or used to make other meals.
Firm data on avoidable consumer food waste are scarce too and major uncertainties
remain. However, two rather similar figures, based on surveys and calculations, are
available in the literature. These help to give an idea of the scale:
»»Cofresco (2011) estimates that 59 % of consumer food waste in Germany
is avoidable.
»»British studies support this figure (WRAP, 2008). According to the WRAP study,
4.1 million tons or 61 % of the 6.7 million tons of food waste in Britain are avoida-
ble. This figure is almost identical to the figure determined by Cofresco (2011) for
Germany. In an update to their earlier study, WRAP (2011) recently confirmed the
figure of 61 %.
Similar to food waste in general, the proportion of avoidable food waste does however
vary between food groups, as other studies mentioned earlier have shown. In view
of the above, we summarize this chapter with the data in Fig. 3.2. Due to the lack
of more detailed data for Germany, Fig. 3.2 only indicates relative food waste in the
first column, averaged from the data listed in Fig. 3.1. As was highlighted above, the
derived figures are in the order of 25 %.
24Figure 3.2 Average relative Avoidable
Average relative food waste food waste food waste
Food group
and avoidable food waste at (as a proportion of (as a proportion of relative
consumer level in Germany reported consumption) food waste)
(in %)
Meat, meat products 16 48
Source: own calculations and Fish, fish products 26 48
representation after Gustavs-
Eggs, egg products 16 91
son et al. (2011), Muth et al.
(2011), Selzer 82010) and Milk, dairy products 14 91
WRAP (2008; 2010) Oils, fats 15 67
Cereals,
23 88
cereal products
Potatoes,
26 67
potato products
Vegetables,
29 45
vegetable products
Fruit, fruit products 29 46
Sugar, sweets 15 87
What is interesting in this context is the figure of 16 % waste determined for meat and
meat products, as this is almost identical to the 15 % correction factor mentioned in
the previous chapter for losses in this product category at consumer level as proposed
by Dämon & Widhalm (2003).
The second column of Fig. 3.2 gives the proportion of avoidable waste, based on
the figures in WRAP (2008; 2010) for Britain. In the context of this study it would
appear reasonable to use these figures as an approximation to the German situation,
given that both per capita losses and overall avoidable losses are strongly congruent
between the two countries, as described earlier.
In conclusion we can say that the majority of consumer food waste is principally
avoidable. This is somewhat less true for perishable agricultural primary products
such as meat and meat products, fish and fish products as well as fruit and vegetables.
But even in these food groups approximately half of all wastage can be avoided by way
of better pre-shop planning, proper use and preparation of foods as well as by making
use of leftovers. For the other food groups analysed, the proportion of avoidable food
waste is higher accordingly.
Tons for the trash | 254 Definition of scenarios for further analysis
The primary aim of this study is the analysis of land footprints resulting from a com-
parison of dietary recommendations with eating habits and food losses respectively.
The findings of the investigations so far, as given in Chapters 2 and 3, already allow us
to sketch scenarios on potentially changed dietary patterns and eating habits. These
scenarios are fundamental to the further analysis. A detailed rationale and definition
of the scenarios will be given below.
What happens if actual eating habits more closely
follow dietary recommendations?
Let us recall the analysis of actual food consumption in Germany and recommended
dietary guidelines. The differences between the two “dietary styles” are summarized
in Fig. 2.6. The core message here was that the average person eats too much meat
and not enough cereals, especially wholegrain products (also see DGE, 2008). Fish
is the only food group where dietary guidelines are met, but fish consumption is not
relevant to the further analysis as part of this project (cf. von Witzke et al., 2011).
The first scenario is based on the information given in Fig. 2.6 and can be defined as
follows. Net consumption and the corresponding gross consumption for the purposes
of human nutrition would
»»decrease by 44.0 % for meat and meat products,
»»decrease by 32.4 % for potatoes and potato products,
»»decrease by 34.1 % for sugar and sweets,
»»increase by 17.0 % for eggs,
»»increase by 15.6 % for milk and dairy products,
»»increase by 37.5 % for (vegetable) fats,
»»increase by 44.0 % for cereals and cereal products (incl. all types of flour),
Comprehensive
change in »»increase by 57.6 % for rice,
diet means: »»increase by 6.4 % for fruit and fruit products,
75 % »»increase by 75.4 % for vegetables and vegetable products.
more vegetables, Hereinafter this scenario will be referred to as “Scenario Ia: Comprehensive
44 %
change in diet”. However, these changes would in part be rather drastic, so much so
that without doubt they would be quite difficult to implement. For this reason,
and also in order to demonstrate the considerable impact even small changes in
less meat eating habits can have, a second scenario will be defined below. It refers to dietary
changes and is based on the following premise: at least one day a week without meat.
26Meat consumption would thus drop by 14.3 % , representing almost precisely a third
(32.5 % exactly) of the reduction seen under Scenario Ia. In order to ensure a balan-
ced diet in this second scenario all changes are calculated as 32.5 % of the reductions
or increases respectively of those in Scenario Ia. Hereinafter this second scenario will
be referred to as “Scenario Ib: Gradual change in diet”.
Under Scenario Ib, net consumption and the corresponding gross consumption for the
purposes of human nutrition would:
»»decrease by 14.3 % for meat and meat products,
»»decrease by 10.5 % for potatoes and potato products,
»»decrease by 11.1 % for sugar and sweets,
»»increase by 5.5 % for eggs,
»»increase by 5.1 % for milk and dairy products,
Gradual change »»increase by 12.2 % for (primarily vegetable) fats,
in diet »»increase by 14.3 % for cereals and cereal products (incl. all types of flour),
means:
24,5 %
»»increase by 18.7 % for rice,
»»increase by 2.1 % for fruit and fruit products,
more vegetables,
14,3 %
»»increase by 24.5 % for vegetables and vegetable products.
less meat
In order to arrive at comparable land footprints of human food consumption in
Germany, these rates of change are confronted with the analysis by von Witzke et
al. (2011). This approach is referred to as “shocking the model”.
For reasons of methodology the analysis by von Witzke et al. (2011) is based on FAO
data (FAO, 2011), i.e. the freely accessible “food balance sheets” for Germany. These
balance sheets show the proportion of agricultural primary products available for
human consumption after deductions for losses incurred on the way to the
consumer. For the purposes of further analysis, the previous three years’ values for
this “net food consumption” are averaged and the mean values used as a baseline.
The baseline values are then “shocked” with the percentage changes according to the
two scenarios.
The following two examples may help to illustrate the approach taken: The quantity
of meat for human consumption in Germany reported in FAO (2011) is reduced by
44.0 % (Scenario Ia) and 14.3 % (Scenario Ib) respectively while the quantity of
oranges is increased by 6.4 % (Scenario Ia) and 2.1 % (Scenario Ib) respectively. The
changes in consumption thus triggered – assuming that all other parameters remain
unchanged – would result in corresponding changes in terms of land consumption
both inside and outside of the EU. In analogy to Witzke et al. (2011), these changes
can be determined for individual agricultural primary products.
Tons for the trash | 27The potential impact of reducing food waste
While the FAO (2011) data consider some of the food losses incurred on the way to
the consumers, they do not take account of food losses at the level of the end consu-
mers as described in Chapter 3. Therefore it is useful to compare these data to their
corresponding reduction potential and to analyse their impact on the land footprint
of human nutrition in Germany.
To this end we must again go back to the already completed analysis, or more speci-
fically to the results given in Figure 3.2 for the average avoidable food waste by food
group. Similar to the two scenarios for aligning actual eating habits with dietary
recommendations, it is useful here to define two scenarios for the reduction of food
waste:
»»The first scenario examines the impact of a complete reduction of avoidable food
waste at the consumer level in Germany on the net consumption and the
corresponding gross consumption for human nutrition. This is “Scenario IIa:
Complete reduction of avoidable food waste”.
»»In contrast, “Scenario IIb: Partial reduction of avoidable food waste”
assumes “only” a 50 % reduction of avoidable food waste. Similar to Scenario Ib
this is based on the assumption that a complete change in consumer behaviour
appears unrealistic for the time being. But even a partial change in the way
consumers deal with food would have significant impacts which are
worth analysing.
28Figure 4.1 below shows the rates of change which are to be used to “shock” the data
by von Witzke et al. (2011), as described above. Again, the following two examples
help to understand the approach: Currently, approximately 16 % of the beef that
reaches the consumer is lost as a result of preparation, spoilage, passing the ‚best
before‘ date and so on. In Scenario IIa about half of these losses, i.e. 8 %, are taken to
be avoidable; the corresponding figure for Scenario IIb is 4 %. On average, 23 %
of wheat products are lost at the consumer level. Of these, 90 % are considered avoi-
dable in Scenario IIa, equating to a reduction of approximately 20 percentage points.
In Scenario IIb, 45 % of the losses are considered avoidable, equating to a reduction
of about 10 percentage points.
Figure 4.1 Szenario IIa: Szenario IIb:
Reduction in net Food group Complete reduction of Partial reduction of
consumption and avoidable food waste avoidable food waste
corresponding gross
Meat, meat products 8% 4%
consumption for human
nutrition resulting from Fish, fish products 12 % 6%
a reduction in Eggs, egg products 14 % 7%
avoidable food waste
Milk, dairy products 12 % 6%
Source: own calculations
Oils, fats 10 % 5%
based on Figure 3.2
Cereals,
20 % 10 %
cereal products
Potatoes,
18 % 9%
potato products
Vegetables,
14 % 7%
vegetable products
Fruit, fruit products 14 % 7%
Sugar, sweets 14 % 7%
Scenarios Ia and Ib as well as IIa and IIb provide the framework for further analysis.
As this framework is based on a common set of data it allows for (a) dietary styles and
(b) the German population’s “throw-away” mentality to be discussed independently of
each other but also allows for comparisons.
Tons for the trash | 29You can also read