By Bevan Griffiths-Sattenspiel and Wendy Wilson - A River Network Report
←
→
Page content transcription
If your browser does not render page correctly, please read the page content below
The Carbon Footprint
     of Water
                                     by
             Bevan Griffiths-Sattenspiel
                                    and
                         Wendy Wilson

               A River Network Report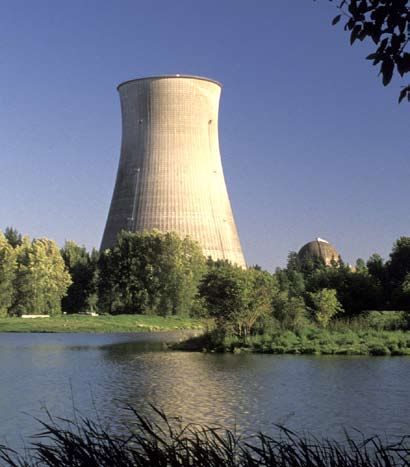
The Carbon Footprint of Water
by Bevan Griffiths-Sattenspiel and Wendy Wilson
www.rivernetwork.org
This report was funded by The Energy Foundation.
Copyright information
River Network grants readers the right to make copies of this report for sharing and easier reading.
However, if you wish to reproduce it elsewhere for any reason, River Network holds all rights
and permission must be requested for it to be reproduced in any form by any means electronic
or mechanical, including information storage and retrieval systems, except by reviewer who may
quote brief passage in review. Contact River Network at info@rivernetwork.org for permission to
reproduce.
Published by © River Network, May, 2009
River Network would like to thank the following individuals for providing invaluable support
and advice: Marilu Hastings, The Energy Foundation; Michael Webber, University of Texas; Bob
Wilkinson, University of California Santa Barbara; Heather Cooley, Pacific Institute; Mary Ann
Dickinson, Alliance for Water Efficiency; Jenny Hoffner, American Rivers; Susan Kaderka, National
Wildlife Federation; Michelle Mehta, Natural Resources Defense Council; Lorraine White, California
Energy Commission; Gary Klein, Affiliated International Management, LLC ; Bruce Applebaum, ICF
International; Portland Water Bureau.
River Network
National Office
520 SW 6th Avenue, Suite 1130
Portland, OR 97204
Phone: 503-241-3506
Fax: 503-241-9256
info@rivernetwork.org
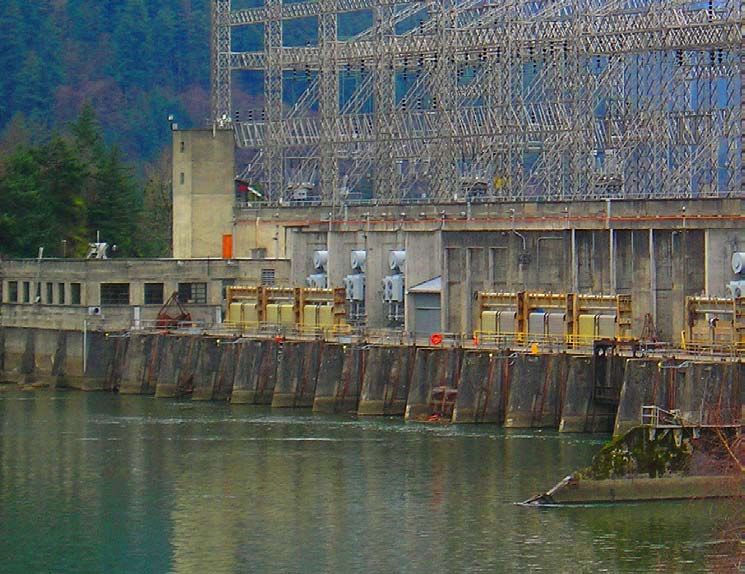
Photo credits: front cover: Bonneville Dam © Jean A. Hamilla; factory stacks and nuclear cooling
tower © Jupiter Images.
ii
Contents
  The Carbon Footprint of Water: Executive Summary . . . . . . . . . . . . . . . . 1

  Introduction . . . . . . . . . . . . . . . . . . . . . . . . . . . . . . . . . . . . . . . . . . . . . . . . . . . . 5

  Section One: Evaluating Water Withdrawals by Sector . . . . . . . . . . . . . . . 7

  Section Two: The Energy Intensity of Water . . . . . . . . . . . . . . . . . . . . . . . . 11

  Section Three: Estimating Energy in Water End-Uses . . . . . . . . . . . . . . . . 17

  Section Four: A New Estimate of National Water-Related Energy Use                                                      21

  Section Five: Saving Energy by Saving Water . . . . . . . . . . . . . . . . . . . . . . . 25

  Conclusions . . . . . . . . . . . . . . . . . . . . . . . . . . . . . . . . . . . . . . . . . . . . . . . . . . . . 35

  Notes . . . . . . . . . . . . . . . . . . . . . . . . . . . . . . . . . . . . . . . . . . . . . . . . . . . . . . . . . . 37

  Appendix . . . . . . . . . . . . . . . . . . . . . . . . . . . . . . . . . . . . . . . . . . . . . . . . . . . . . . . 43

  Appendix Notes . . . . . . . . . . . . . . . . . . . . . . . . . . . . . . . . . . . . . . . . . . . . . . . . . 48

  Acronyms & Abbreviations . . . . . . . . . . . . . . . . . . . . . . . . . . . . . . . . . . . . . . . 49

                                                                     iii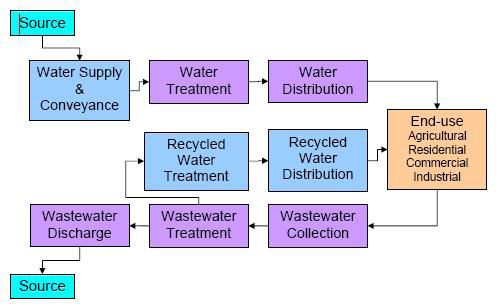
iv
The Carbon Footprint of Water
Executive Summary
The decisions being made today regarding the management of water and energy resources will
profoundly affect our economic and environmental future. Climate change and other stresses are
limiting the availability of clean water and cheap energy. A large amount of energy is expended to
supply, treat and use water, meaning that water-oriented strategies can result in significant reductions
in energy use and greenhouse gas emissions. This report explores the energy and carbon emissions
embedded in the nation’s water supplies. We have developed a baseline estimate of water-related
energy use in the United States, as well as a comparative overview of the energy embedded in different
water supplies and end-uses. We include numerous examples of how water management strategies
can protect our freshwater resources while reducing energy and carbon emissions. This information
is intended to help river and watershed groups, policy makers and water managers understand the
magnitude of water related energy use and evaluate the potential to reduce carbon emissions through
water conservation, efficiency, reuse and low impact development strategies.

Through our analysis of primary and secondary research, we estimate that U.S.             “We estimate that U.S.
water-related energy use is at least 521 million MWh a year—equivalent to 13% of          water-related energy
the nation’s electricity consumption. While this appears to be a conservative estimate    use is atleast 521
of water-related energy use, our findings suggest that the carbon footprint currently     million MWh a year—
associated with moving, treating and heating water in the U.S. is at least 290 million    equivalent to 13% of
                                                                                          the nation’s electricity
metric tons a year. The CO2 embedded in the nation’s water represents 5% of all
                                                                                          consumption.”
U.S. carbon emissions and is equivalent to the emissions of over 62 coal fired power
plants.

Most significantly, the carbon footprint of our water use is likely growing for several reasons. Climate
change is predicted to have numerous adverse affects on freshwater resources, rendering many
available water supplies far less reliable. With water demand growing and many local, low-energy
supplies already tapped, water providers are increasingly looking to more remote or alternative water
sources that often carry a far greater energy and carbon cost than existing supplies. Furthermore, the
                                                                          The Carbon Footprint of Water         1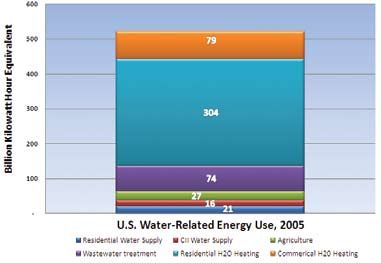
Executive Summary

    adoption of higher water treatment standards at the state and federal levels will increase the energy
    and carbon costs of treating our water and wastewater.

    Water conservation, efficiency, reuse and Low Impact Development (LID) strategies should be targeted
    to achieve energy and greenhouse gas emissions reductions. Research from the California Energy
    Commission suggests that programs focusing on these kinds of water management strategies can
    achieve energy savings comparable to traditional energy conservation measures at almost half the
    cost. Water management policies that promote water conservation, efficiency, reuse and low impact
    development can reduce energy demand and substantially decrease carbon emissions. The total energy
    savings potential of these strategies has yet to be assessed. However, numerous case studies illustrate
    the effectiveness of saving energy with water-based approaches. A few examples of these savings
    include:
       •   Retrofitting water using fixtures and appliances reduces hot water use by approximately 20%.
           If every household in the United States installed efficient fixtures and appliances, residential
           hot water use could be reduced by approximately 4.4 billion gallons per year. Resultant direct
           energy savings are estimated to be 41 million MWh electricity and 240 billion cubic feet of
           natural gas, with associated CO2 reductions of about 38.3 million metric tons. Based on
           national averages, indirect energy savings from reduced water supply and treatment energy
           needs would be about 9.1 million MWh per year, with carbon emissions reductions of 5.6
           million metric tons.

       •   Outdoor water use often drives peak water demands and requires the utilization of marginal
           water sources with greater energy intensities. Reducing outdoor irrigation—especially during
           summer months—can result in substantial “upstream” energy savings by reducing water
           consumption from the most energy-intensive supplies and by avoiding the need to develop
           additional supplies.

       •   A 5% reduction in water distribution system leakage would save 270 MGD of water and
           313 million kWh of electricity annually, equal to the electricity use of over 31,000 homes. In
           addition, approximately 225,000 metric tons of CO2 emissions could be avoided.

       •   If groundwater levels across the United States were to drop an average of 10 feet due to
           unsustainable water withdrawals, energy demands for agricultural groundwater pumping
           would increase by approximately 1.1 million MWh per year. Assuming pumping energy
           is derived from the U.S. electrical grid, associated carbon dioxide emissions would be
           approximately 680,000 metric tons per year.

       •   An average sized 1,000 MWh power plant that installs a water reuse system for cooling tower
           blow-down recovery would reduce the energy demand to produce, distribute and treat water
           by a net 15%, or enough to power over 350 homes for a year.

2    The Carbon Footprint of Water
Executive Summary
• If LID techniques were applied in southern California and the San Francisco Bay area,
between 40,400 MG and 72,700 MG per year in additional water supplies would become
available by 2020. The creation of these local water supplies would result in electricity savings
of up to 637 million kWh per year and annual carbon emissions reductions would amount
to approximately 202,000 metric tons by offsetting the need for inter-basin transfers and
desalinated seawater.
The link between water and energy presents the climate change community “As the U.S. struggles to
with a valuable opportunity to better manage two of our most valuable reduce its carbon emissions
resources. As the U.S. struggles to reduce its carbon emissions in response to in response to global
global warming, investments in water conservation, efficiency, reuse and LID warming, investments in
are among the largest and most cost-effective energy and carbon reduction water conservation, efficiency,
strategies available. Furthermore, water is perhaps the most vital ecosystem reuse and LID are among the
largest and most cost-effective
service that our natural environment provides. As the inevitable impacts of
energy and carbon reduction
climate change become evident, our freshwater resources and the ecosystems
strategies available.”
they support will become respectively less reliable and resilient. Smart water
policies allow us to mitigate the worst aspects of global warming today, while
the consequent improvements in water quantity and river health will provide a
critical buffer as humanity and nature adapt to the climate of tomorrow.
The Carbon Footprint of Water 34 The Carbon Footprint of Water
Introduction
Climate change and growing demands already strain our energy and water supplies. It has been
projected that under a “business as usual” scenario, electricity demand in the United States (U.S.)
will increase by 53% between 2003 and 2030. Much of the country is currently experiencing water
shortages, with many of the fastest growing regions in the nation already withdrawing up to five times
more water than is naturally replenished through precipitation.1 Meanwhile, the Intergovernmental
Panel on Climate Change predicts that global warming will result in less reliable water supplies, while
the efforts to develop lower carbon energy sources could drive a shift toward a more water-intensive
energy portfolio.2 Given these trends, it is imperative that policies at all levels ensure the sustainable
management of both water and energy.

The “water-energy nexus” is a broad label for the set of interactions caused when humans develop
and use water and energy. The nexus manifests itself in many ways, revealing substantial tradeoffs and
opportunity costs associated with the ways we use water and energy. Producing thermoelectric power,
for example, requires large amounts of water for cooling, while nearly every stage of the water use
cycle involves energy inputs. A better understanding of the water-energy nexus will allow integrated
resource planning that optimizes the use of invaluable and increasingly scarce resources.

Energy production in the U.S. requires more water than any other sector. According to the U.S.
Geological Survey, 48% of water withdrawals in the United States are used for thermoelectric power
production. In addition, water is used for growing biofuels or in the extraction of coal, petroleum
and natural gas. To illustrate this connection, consider that a hundred-watt light bulb turned on in
drought-stricken Atlanta, Georgia for 10 hours results in the consumption of 1.65 gallons of water3
(with a carbon footprint of 1.4 pounds).4

On the other hand, water use in the U.S. requires significant amounts of energy. Water is heavy at 8.34
pounds to the gallon and energy is required whenever it is moved, treated, heated or pressurized. For
many communities, the energy required for supplying and treating water and wastewater constitutes
the largest municipal energy cost.4

                                                                          The Carbon Footprint of Water      5
Introduction
In California, for instance, water-related energy use in 2001 was estimated at 48 million MWh (or 48
thousand GWh) of electricity, plus 4.3 billion Therms of natural gas and 88 million gallons of diesel
fuel. This energy use results in approximately 38.8 million metric tons of carbon dioxide emissions
annually.6 Water-related electricity alone accounts for 19% of California’s electricity consumption,
while natural gas use—primarily for water heating—accounts for 30% of the state’s natural gas
demand. The carbon emissions embedded in California’s water as a result of these energy demands is
equivalent to the carbon emissions of 7.1 million passenger vehicles, and would require approximately
9 million acres of pine forest to offset California’s water-related carbon footprint.7
Unless our water supplies are properly managed, the carbon footprint of water use in the United States
will continue to grow at a time when climate change necessitates reducing carbon emissions. With
so many interconnections, what can we safely say is the “carbon footprint” of water use in the United
States today? Furthermore, what policies or techniques are available to reduce water-related carbon
emissions?
In order to answer these questions, River Network conducted a literature review of primary and
secondary research on water use and its associated energy requirements in the United States. This
report builds on River Network’s initial estimate of nationwide water-related energy demands by
utilizing updated sources and new considerations. To quantify water-related energy use in the U.S., we
explored three key research areas:
1. The extent of water-withdrawals across the country by sector,
2. The range of energy intensities for water supply & treatment, and
3. Current estimates of energy in end uses of water.
In Section Four of this report we propose a new base estimate of U.S. water-related energy use and
carbon emissions. After establishing the magnitude of water-related energy consumption, we conclude
the report by exploring the carbon-reducing potential of various water conservation, efficiency, reuse
and low-impact development programs.
6 The Carbon Footprint of WaterSection One
Evaluating Water Withdrawals by Sector
Every five years, the United States Geological Survey (USGS) collects data on the nation’s water
withdrawals and compiles it in an authoritative report titled Estimated Use of Water in the United
States. The most recent USGS report on water use contains data collected in the year 2000 and is used
for most of this report. (As of 3/31/09 the 2005 report has not be released.)
The USGS defines water withdrawals as “water removed from a ground- or surface-water source for
use.” This broad definition refers to all human uses of water, regardless of whether or not the water is
returned to the environment or available for later use. Water consumption—or consumptive uses of
water—refers to, “that part of water withdrawn that is evaporated, transpired by plants, incorporated
into products or crops, consumed by humans or livestock, or otherwise removed from the immediate
water environment.” Differentiating between water consumed and water withdrawn is critical to
understanding how much water is available for environmental and human uses, and hence necessary
for water supply planning.
It should be noted that definitions of terms relating to water use are not always clear and aggregating
water use figures from different reports can be misleading. Water may have been measured before
or after it was delivered to end users. In many instances it is not metered at all. Return flows may
be diverted by another user or returned to the environment to replenish groundwater. The terms
“diverted,” “withdrawn” or “consumed” may mean different things to different agencies. Even where
water rights are carefully managed under specific beneficial use statues, conveyance losses may not be
fully measured.
The way that water use is broken into sectors can also be confusing. Aside from public supplies,
nationwide water use data is frequently categorized by end-user. Private end-users are broken down by
economic sector (irrigation, industrial, thermoelectric power, mining, aquaculture and livestock) and
The Carbon Footprint of Water 7Section 1: Evaluating Water Withdrawals by Sector
“domestic use” (referring to self-supplied households). Therefore, to determine total national water
withdrawals by end-use, the public water supplies must also be broken down by end-user.
Many reports do not differentiate between public and private supplies. The Pacific Institute, a well-
known research institution focusing on water issues, typically categorizes water users as either
urban or agricultural. In this case, urban use refers to the residential, commercial, institutional and
industrial sectors, while agricultural uses include irrigating food, fodder and fiber crops.8 Both urban
and agricultural water use can be either public or private, although a large portion of agricultural
water is self-supplied. These complications become evident when compared to USGS findings.
While agriculture composes the vast majority of the irrigation sector referred to by USGS, uses likely
considered urban such as, “Irrigation of golf courses, parks, nurseries, turf farms, cemeteries, and other
self-supplied landscape-watering uses also are included.”9
The USGS estimates that water withdrawals in the entire United States amount to approximately
408 billion gallons of water per day (GPD) or 149 trillion gallons per year (see figure 1.1). The vast
majority of these water withdrawals come from freshwater and surface sources, representing 85% and
79% of total withdrawals, respectively. By sector, thermoelectric power generation accounts for 48%
of all water withdrawals and irrigation accounts for 34%—making them the two largest water using
sectors. Public water supplies rank third representing 11% of the total.10
Table 1.1 – Estimated Use of Water in the United States by Sector, 2000 (USGS)
Sector Daily Water Use (MGD) Annual Water Use (MG) % of Total
Public Supply 43,300 15,804,500 11.00%
Self-Supply Domestic 3,590 1,310,350Section 1: Evaluating Water Withdrawals by Sector
Because the vast majority of water users receive their supply through public systems, we are
particularly interested in where it comes from and how it is used. The USGS did not include data on
deliveries in public supply systems for 2000, so information had to be gleaned from the 1995 survey.
Approximately 56% of all water that made its way into public systems was delivered to domestic
users, with commercial use ranking a distant second, composing 17% of 1995 public demand. Public
use and losses accounted for 15%, industrial demand was 12% and thermoelectric power ranked
lowest, representing less than 1% of public water demand.12 Therefore, residential users account for
more water demand on public supplies than all other sectors receiving public water combined. Public
use and lost water is technically unaccounted for and represents 15% of all public water demands, a
staggering volume that should be better tracked in order to minimize lost water.
Conclusions
• Our nation withdraws an estimated 149 trillion gallons per year. Public water “Approximately 56%
systems withdraw 43 billion gallons of water each year and serve 242 million of all water that made
people, or eighty-five percent of the population. its way into public
systems was delivered
• Residential users acquire more water from public supplies than all other sec- to domestic users,
tors combined. with commercial use
• Public use and lost water is unaccounted for and represents 15% of all public ranking a distant
water demands, a staggering volume that should be better tracked in order to second,”
minimize lost water.
• Future research on the water-energy nexus would benefit from a national agreement on how
best to measure water withdrawals (water diverted, used, consumed and/or replenished) and
consistent definitions of the sectors being measured by end user and water source.
The Carbon Footprint of Water 910 The Carbon Footprint of Water
Section Two
The Energy Intensity of Water
The energy intensity of water use (also called virtual or embedded/embodied energy) is the total
amount of energy, calculated on a whole-system basis, required for the use of a given amount of water
in a specific location.13 This calculation can vary considerably based on a number of factors. Among
the most important aspects are the type and quality of source water, the pumping requirements to
deliver water to end-users, the efficiency of the water system and the energy embedded by specific
consumer end uses.14

Energy intensity values are typically expressed in kilowatt hours because electricity is the predominant
energy type for municipal water supply and wastewater treatment systems. While energy sources other
than electricity are occasionally used for water supply and treatment, 93% of water providers and
86% of wastewater treatment plants respectively receive 90% and 80% of their operating energy from
electricity.15

The energy inputs of a typical water-use cycle can be broken down into five basic stages (Figure 2.1):

Figure 2.1: From Wolff et al., 2

The 5 stages above can often be broken down into additional components. Figure 2.2 depicts
a schematic designed by the California Energy Commission and based on work by Dr. Robert
Wilkinson. This schematic provides a slightly more detailed look at the different energy inputs in a
typical water use cycle. (Turquoise blue represents sources of water, water supplies are shown in light blue,
water and wastewater treatment are shown in purple, and end use is shown in beige.)16 End-use energy is

                                                                          The Carbon Footprint of Water         11
Section 2: The Energy Intensity of Water
embedded by the consumer and is the only component not considered in the energy intensity of water
supply and treatment. The reuse of wastewater represents an additional component that is found in a
growing number of water systems.
Figure 2.2: From Klein, 7 and based on research by Robert Wilkinson
The energy intensity of each component of the water cycle can differ considerably, resulting in a wide
variability of embedded energy values between water systems. Including wastewater treatment but not
including end-use, the energy intensity of municipal water supplies on a whole system basis can range
from a low of 1,050 kWh/MG to a hypothetical high upwards of 36,200 kWh/MG (See Table 2.1). For
most utilities, energy use varies from 1250 kWh/MG to 6,500 kWh/MG.17
Table 2.1 – Range of Energy Intensities for Water Use Cycle Segments18
Water Use Cycle Segments Range of Energy Intensity
(kWh/MG)
Low High
Water Supply and Conveyance 0 14,000
Water Treatment 100 16,000
Water Distribution 250 1,200
Wastewater Collection and Treatment 700 4,600
Wastewater Discharge 0 400
Total: 1,050 36,200
Water Supply Factors
The type, quality and location of a water supply are the primary factors influencing the energy
embedded in a water supply system. Other important factors include water lost in the system due
to leaks, the efficiency of water pumps and the spatial and topographical characteristics of the
distribution system.
In general, the energy required by most utilities for treatment and distribution of potable water
differs from 250 kWh/MG to 3,500 kWh/MG.19 It often takes a great deal of energy to move water,
12 The Carbon Footprint of WaterSection 2: The Energy Intensity of Water
and pumping costs are directly related to the elevation water must be lifted. Depending on pumping
efficiency, between 40 and 80 kWh are required to lift one million gallons of water 10 feet.20 Energy
used for groundwater pumping is typically between 537 kWh and 2,270 kWh per million gallons,
depending on pumping depth.21 Although some gravity fed surface sources are located above the
service area and require no additional pumping, energy is often needed to pump surface water sources
as well. For instance, water delivered to Southern California from the Sacramento-San Joaquin Delta
passes 2000 feet over the Tehachapi Mountains and requires 9,200 kWh/MG.22
The vast majority of water supplies come from fresh groundwater or surface sources such as rivers, lakes
or streams.23 Other sources of water include desalinated seawater, brackish groundwater and recycled
wastewater. Table 2.2 provides some generic estimates of the energy intensity for water supplies.
Table 2.2 – Generic Energy Intensity of Water Supply Types24
Source Types Energy Intensity
(kWh/MG)
Surface Water (Gravity Fed) 0
Groundwater 2000
Brackish Groundwater 3200
Desalinated Seawater 13800
Recycled Water 1100
Many water utilities rely on multiple sources of water, much in the same way an electric utility might
get its power from multiple power plants. Different sources of water can be embedded with varying
degrees of energy depending on quality, location and type of source. This results in water systems that
supply units of water with different values of embedded energy throughout the year. Marginal units of
water are most likely to have a higher energy factor than the system as a whole, since the least energy-
intensive sources available are generally used to meet base load demands due to their lower costs to
supply.
In Portland, Oregon, for instance, the Portland Water Bureau relies on two sources to meet its water
demands. The primary source, the Bull Run, consists of gravity fed surface water from a protected
watershed and requires just 570 kWh per million gallons. The secondary, or marginal, source consists
of groundwater withdrawn at the bureau’s Columbia South Shore Well Field, which has to be pumped
4.5 miles south and 750 feet up for storage. Due primarily to these pumping demands, well field water
has an energy intensity of approximately 3,675 kWh per million gallons—about 6.5 times greater than
the Bull Run supply.
Despite successful water conservation efforts, peaking water demand and limited supplies in the
Bull Run during summer months often forces the bureau to use the well field supply, thus increasing
electricity costs. In 2006, for instance, the groundwater supply represented 43% of total electricity
requirements despite providing only 14% of that year’s water supply.25 Therefore, reducing the demand
of water from the well field will have a greater energy benefit than a similar reduction of Bull Run
water. This implies that the bureau could optimize energy savings by aggressively targeting summer
water use in its conservation programs.
The Carbon Footprint of Water 13Section 2: The Energy Intensity of Water
In many cases, the analogy between water and electric utilities continues into the preference for least
cost resources, which are always dispatched before more expensive resources if possible. This fact
influences the carbon impact of water because the least cost electric resources for most utilities in this
country are high carbon, fossil-based fuels such as coal. As major electricity users, utilities may receive
a larger-than-average share of their electricity from the cheaper, dirtier sources supplying power to the
local grid. Thus the more electricity embedded in water, the higher the carbon impact.
Wastewater Treatment Factors
The energy intensity of wastewater treatment depends on the pumping demands for wastewater
collection, as well as the level of treatment and size of facility. For most wastewater treatment plants,
energy use ranges between 1,000 kWh/MG and 3,000 kWh/MG, although outliers do exist. The largest
energy intensity values are as high as 6,000 kWh/MG, or double the high-end of the typical range.26
While wastewater treatment plants are often sited in order to utilize gravity fed wastewater collection,
not all plants are located downhill from consumers and many utilities incur pumping costs to move
wastewater to the treatment plant. Pumping wastewater is inherently more inefficient than pumping
freshwater because pumps are designed to accommodate solids in the wastewater stream.27
The energy intensity of treating wastewater increases with greater levels of treatment and decreases
with scale. Table 2.3 consists of average energy intensity values illustrating the relationship between
level of treatment, size of facility and energy intensity.
Table 2.3- Energy Intensity of Wastewater Treatment by Size and Level of Treatment28
Treatment Plant Unit Electricity Consumption (kWh/million gallons)
Size (million Trickling Activated Advanced Advanced Waste-
gallons/day) Filter Sludge Wastewater water Treatment w/
Treatment Nitrification
1 MGD 1,811 2,236 2,596 2,951
5MGD 978 1,369 1,573 1,926
10 MGD 852 1,203 1,408 1,791
20 MGD 750 1,114 1,303 1,676
50 MGD 687 1,051 1,216 1,588
100 MGD 673 1,028 1,188 1,558
Current Trends
While the current magnitude of the energy required to supply and treat water and wastewater is large,
a number of notable trends are likely to increase the energy intensity for water supply and treatment,
thus increasing its carbon footprint. The three major trends are 1) greater reliance on marginal water
supplies, 2) development of new energy-intensive supplies and 3) regulatory standards requiring
higher levels of drinking water and wastewater treatment.
14 The Carbon Footprint of WaterSection 2: The Energy Intensity of Water
Growing water demand and decreased reliability of many water resources suggests that more water
providers will be forced to rely on marginal water supplies with greater energy and carbon emissions
costs. As the example of Portland, OR illustrates, marginal water supplies often require significantly
more energy than primary supplies (In Portland’s case, 6.5 times more energy is required to pump
water from a marginal source compared to the primary supply). A study commissioned by the
Portland Water Bureau in 2002 found that global warming will likely decrease the water available from
Portland’s primary source (the Bull Run) during the summer, when water demand is highest. In total,
it was estimated that the Water Bureau will be required to supply an additional 1.3 billion gallons of
water per year from alternative sources, such as the more energy intensive well field supply.29 Assuming
the 1.3 billion gallons of additional water is provided by the well field supply at an energy intensity
of 3,675 kWh/MG, the energy required to supply Portland’s water will increase by approximately 4.8
million kWh per year.
Many water utilities already reach or exceed the capacity of their current water supplies and are
looking to develop new water sources. As local supplies become increasingly strained, water utilities
are forced to pump groundwater from deeper depths or consider inter-basin water transfers or
desalination. Seawater desalination is about seven times more energy intensive than groundwater,30
while groundwater supplies are about 30% more energy intensive than surface water.31 In California, a
state facing a long-term drought coupled with a growing population, about 20 different water agencies
are considering desalination.32 If all of the desalination facilities currently proposed in California were
built, desalination would represent 6% of California’s year 2000 urban water demand and significantly
increase the energy intensity of California’s water supplies.33
Santa Fe, New Mexico offers another example of how new water supplies will likely increase the energy
intensity of supplying water in the United States. In April 2009, five Eastern New Mexico farmers filed
applications to transfer 2 billion gallons of water per year from their farmlands near Fort Sumner to
consumers in Santa Fe. If approved, this water would be pumped nearly 150 miles and 4,000 feet in
elevation to reach consumers in Santa Fe.34 To put this lift in context, the State Water Project (SWP)
in California currently has the highest lift of any water system in the world, pumping water 2,000 feet
over the Tehachapi Mountains to convey water from northern to southern California.35 The Santa Fe
supply requires twice the elevation climb. Assuming a pumping efficiency of 70% (4.48 kWh/MG)
and no water lost due to system leaks, the energy intensity of Santa Fe’s proposed water supply would
be about 18,000 kWh/MG for pumping alone. If the proposed 2 billion gallons of water annually is
actually delivered through this supply, new energy costs would be about 36 million kWh annually with
associated CO2 emissions of about 32,400 metric tons per year.36
When drinking water and wastewater discharge standards are made more stringent, the energy
required for water and wastewater treatment generally goes up. For instance, in 2001 the U.S. EPA
began imposing tougher standards on water providers to control microbial contaminants, such
as cryptosporidium a parasite commonly found in lakes and rivers.37 Recently, pharmaceuticals,
endocrine disrupting compounds and personal care products have been detected in the drinking
supplies of at least 41 million Americans. Removing these contaminants is an energy-intensive process
and if water regulations and standards become more strict, the energy intensity of treating water in the
U.S could increase significantly.38
The Carbon Footprint of Water 15Section 2: The Energy Intensity of Water
Tougher standards are also being enforced for wastewater and stormwater treatment. The EPA has
recently implemented tougher rules requiring onsite stormwater treatment.39 As a result, millions
of gallons of water that previously entered waterways as polluted runoff will now require energy as
its treated to acceptable discharge levels. Table 2.3 shows how the energy intensity can more than
double when switching between trickling filter to advanced wastewater treatment with nitrification. If
tougher standards are adopted requiring more stringent wastewater treatment, the energy intensity of
wastewater treatment should increase accordingly.
Conclusions
• The energy intensity of municipal water supplies on a whole system basis can range from a low
of 1,050 kWh/MG to a hypothetical high upwards of 36,200 kWh/MG, while a more typical
range between 1,250 kWh/MG and 6,500 kWh/MG is found for most water systems. Thus, the
energy embedded in the water delivered by public utilities varies widely between systems and
within a single system. The wide range of energy intensities suggests that the energy intensity
should be determined for specific water systems in order to accurately assess the energy
embedded in a community’s water supply.
• The energy intensity of treating wastewater increases with greater levels of treatment and
decreases with scale. A typical range for wastewater treatment and collection varies from 1,000
kWh/MG and 3,000 kWh/MG, with some utilities reporting energy intensities as high as 6,000
kWh/MG.
• Current trends indicate that the energy intensity of water supply and treatment in the United
States will likely increase given shifts toward a greater reliance on marginal water supplies, the
development of new energy-intensive supplies and regulatory standards requiring higher levels
of drinking water and wastewater treatment.
16 The Carbon Footprint of WaterSection Three
Estimating Energy in Water End-Uses
Once a water supply reaches a consumer, additional energy is often used to heat, cool, pressurize or
purify the water in preparation for its intended use.40 Energy from sources other than electricity is
often embedded in water at end-use, most notably natural gas for water heating. Compared to the
other five stages of the water use cycle, end use has the greatest potential for water and energy savings
because it saves energy both “upstream,” and “downstream.” Upstream refers to all of the energy
required to bring the water to its point of use, while downstream refers to the energy expended to treat
and dispose of water.41
Energy associated with end-uses of water can be characterized by three typical types: heating,
additional pumping and energy used in conjunction with water use that is not directly embedded in
water (See Table 3.1).
Table 3.1- Types of Energy Embedded in Water at End-Use42
Heating Baths or showers, washing hands, dishes and clothes, industrial processes
Additional Pumping Cooling towers, recirculation hot water loops, car washes or high pressure spraying,
pressurization for high rise buildings, irrigation pressurization or lifts from canals on
farms
Indirect Energy used to run an air conditioning compressors that are water cooled
For this discussion, it is important to determine the energy intensity of different end-uses. The Pacific
Institute and the NRDC began developing energy intensities and their findings for commercial end-
uses can be found in Table 3.2. As shown, energy intensities range between 0 kWh/MG and 207,800
kWh/MG for the commercial end-uses analyzed. Industrial water uses for chilling, process water use,
and plant cleaning are also significant and should be explored. Due to the limited number of end-uses
analyzed, the range of energy intensities for commercial and industrial end-uses is likely greater than
the range shown in Table 3.2.
The Carbon Footprint of Water 17Section 3: Estimating Energy in Water End-Uses
Table 3.2 -Estimated Energy Intensity of Commercial End-Use43
Water Use Category Energy Intensity (kWh/MG)
Kitchen Dishwashers 83,500
Prerinse nozzles 21,000
Laundries 35,800
Water-cooled Chillers 207,800
Single Pass Cooling 0
Landscape Irrigation 0
Not every gallon of water conserved by a consumer has the same energy impact. River Network has
estimated that end-use energy for residential water use ranges between 0 kWh/MG (for outdoor
irrigation or toilet flushing) to 203,600 kWh/MG (for dishwashers). This considers only water heating
and might be higher if other energy inputs are considered. We first gathered data on the percentage of
hot water typically used for different residential end-uses. From there, we applied the percent of hot
water for each end-use to the energy required to heat a unit of water, which was assumed at 0.2036
L
kWh per gallon based on the energy required to heat water from 55 º to 130 º F ( 75 º F) with an
electric water heater. Table 3.3 shows the energy intensities for common residential end-uses.
Table 3.3- Estimated Hot Water Requirements and Energy Intensity of Residential End-Use
Water Use Category Hot Water44 Energy Intensity (kWh/MG)45
Bath 78.2% 159,215
Clothes Washers 27.8% 56,600
Dishwasher 100% 203,600
Faucet 72.7% 148,017
Leaks 26.8% 54,565
Shower 73.1% 148,832
Toilet 0% 0
Landscape Irrigation 0% 0
These energy intensities are important for understanding and comparing the energy required—and
potential savings through conservation—for common end-uses. However, it is difficult to extrapolate
this data without detailed information on how much water is used per end-use. In order to come up
with a national estimate of energy required for end-uses of water, we had to take a different approach.
We believe that of the three types of energy inputted at end-uses (heating, additional pumping,
indirect), water heating represents the largest share. Due to insufficient data on water use and end-
use energy inputs, we decided to look at estimates of total energy use for water heating rather than
extrapolate figures based on the energy intensities mentioned above.
Total U.S. Energy Use for Water Heating
Data from the Energy Information Administration (EIA), an agency within the U.S. Department
of Energy that collects statistics on energy use within the United States, was used to estimate the
18 The Carbon Footprint of WaterSection 3: Estimating Energy in Water End-Uses
energy embedded in residential and commercial water heating. The agency also collects energy use
information in the manufacturing and industrial sectors, but data on water heating in these sectors is
currently unavailable.
The residential sector consists of single family and multifamily housing units. Ninety-nine percent
(109.8 million) of the 111.1 households in the United States rely on four major fuels for water heating:
electricity, natural gas, fuel oil and liquefied petroleum gas (LPG).46 The two predominant sources of
energy for water heating are natural gas and electricity, accounting for 50% and 40% of the energy (in
kWh equivalent) used for residential water heating. Table 3.4 shows the energy use for water heating in
the residential sector by fuel source, as well as the kWhe for each source.
Table 3.4- Residential H2O Heating by Fuel Source, 2005
Fuel Source Annual Energy Use kWh Equivalent (billion Kwh)
Electricity (billion kWh) 122 122
Natural Gas (billion cf) 1,368 153
Fuel Oil (million gallons) 986 13.4
LPG (million gallons) 1,642 15.8
Total 304.2
According to the EIA, “Commercial buildings include all buildings in which at least half of the floor
space is used for a purpose that is not residential, industrial or agricultural.”47 Using this definition,
schools, correctional institutions, buildings used for religious worship and other building types not
traditionally considered “commercial” are included under this category. The most recent data available
on commercial water heating is from 2003; actual energy consumed for commercial water heating in
2005 is likely higher. Table 3.5 shows energy use for water heating in the commercial sector by fuel
source, as well as the kWh for each source.
Table 3.5: Commercial H2O Heating by Fuel Source, 2003
Fuel Source Annual Energy Use kWh Equivalent (billion Kwh)
Electricity (billion kWh) 26 26
Natural Gas (billion cf) 338 37.8
Fuel Oil (million gallons) 131 1.8
District Heating (Trillion btu) 46 13.5
Total 79.1
To display different energy sources (such as natural gas or fuel oil) in a consistent kWh unit of
measurement, it was assumed that the kWh equivalent equals the amount of electricity available for
use if the fuel were used in a thermoelectric power plant. The efficiencies of thermal power plants were
assumed to be 40% and 37% for natural gas and petroleum-fired power plants, respectively.48 Heating
fuel oil and LPG were assumed to have the same efficiency as petroleum. Line losses of 7.2% were also
taken into account.49 District heating as an energy source for commercial water heating is recorded in
Btu’s by the EIA. Because the specific fuel used for district heating was unspecified, a direct conversion
to kWh was conducted at a rate of 3,412 Btu/kWh.
The Carbon Footprint of Water 19Section 3: Estimating Energy in Water End-Uses
Energy embedded in water at end-uses typically represents the largest energy input in the water use
cycle. In California, for example, residential, industrial and commercial end-uses of water account
for an estimated 58% of the state’s water-related electricity consumption, not counting the additional
energy consumed through other fuels such as natural gas and diesel.50 Even in San Diego—where
water deliveries through the State Water Project and the Colorado River Aqueduct result in a relatively
high energy intensity of 6,260 kWh/MG for conveyance—end-use still makes up 57% of the city’s
water-related energy consumption.51 It is likely, given the sizeable energy requirements for California’s
unique system of moving water across the state, that end-use makes up an even larger share of water-
related energy consumption in the rest of the country.
While residential water use may be similar from house to house, commercial and industrial uses are
not. The mixture of business types and processes makes it hard to find accurate data on water-related
energy use in the CII sectors. Information exists in many forms, the most complete covers the State in
California, but has not been compiled nationally.
Conclusions
• The energy intensity of different end-uses of water varies drastically with some use requiring
no additional energy (e.g. irrigation, toilet flushing) and others requiring up to 203,600 kWh/
MG (e.g. dishwasher). Therefore, some water conservation measures will achieve significantly
greater end-use energy savings than others.
• While the prospects for reducing energy through water-saving end use strategies may be quite
high, national data is scarce.
• Energy embedded in end-uses includes 304 million MWhe for residential water heating, and
79.1 million Mwhe for commercial water heating. These numbers are what River Network will
use as base line estimates of national water-related end-use energy consumption.
20 The Carbon Footprint of WaterSection Four
A New Estimate of National
Water-Related Energy Use
In the spring of 2008, River Network estimated water-related energy use in the United States by
combining data from a 2002 Electric Power Research Institute (EPRI) report on water supply
and treatment with statistics on residential water heating in 2001 from the Energy Information
Administration (EIA). This calculation was intended to provide a conservative estimate that could
be used as for our efforts to raise awareness of the issue until more information became available. At
that time River Network concluded that water-related energy consumption in the United States was
equivalent to at least 360 million MWh, or 9% of total U.S. electricity demand. No quantification of
the carbon emissions associated with water-related energy use was attempted at that time.
To determine the energy required for water supply and treatment, we relied on the findings from Water
and Sustainability (Volume 4): U.S. Electricity Consumption for Water Supply & Treatment—The Next
Half Century, a report published by EPRI in 2002. This report sought to quantify the energy required
for water supply and treatment in the United States in 2000, and provided projections of energy use
for each water-using sector through 2050. The projections for 2005 were used in our analysis, however,
given the wide variability of energy intensities presented in Sections II and III, there is reason to believe
that the EPRI findings represent an unreliable, if not diminutive, estimate of the energy required to
supply and treat water in the United States. Despite its potential shortcomings, the EPRI report offers
the only available estimate of the aggregate electricity demands of water supply and treatment in the
U.S.
Because the source data gathered from the EPRI study was derived from projections based on statistics
compiled in 2000, we believe new research should be conducted to verify the precision of EPRI’s
findings. A new analysis that disaggregates energy use by source would also be useful, particularly for
The Carbon Footprint of Water 21Section 4: A New Estimate of National Water-Related Energy Use
understanding the air emissions resulting from water supply and treatment. An assessment of the
timing of peak energy use for water supplies on a national and regional basis could provide some
useful insight for policy makers and resource planners attempting to integrate water and energy
policies. An analysis of the methodology and assumptions used in the EPRI report is provided as Appendix
A.
Having conducted a broader review, it is now clear that our initial analysis significantly underestimated
the magnitude of water-related energy use in the U.S. By applying updated statistics from the EIA on
residential and commercial water heating to the same methodology used in 2008, River Network is
now proposing a more accurate baseline estimate 50% greater than our initial findings.
As of this date, a fully comprehensive national analysis of the energy demands associated with water
supply, treatment and end-uses has yet to be conducted. This is due to a variety of reasons, including a
general lack of awareness of the water-energy nexus, the difficulty obtaining detailed data from utilities
and a lack of coordination between researchers and agencies looking at water and energy issues.
River Network’s current estimate of 2005 water-related energy use and associated carbon emissions
by sector (derived from EIA and EPRI data) is available in Table 4.1. We believe our estimate provides
a baseline estimate of water-related energy use in the U.S. and shows what sectors are responsible for
the greatest energy demands. The intent of our analysis is to illustrate the magnitude of water-related
energy use by providing a minimum value until a more comprehensive analysis is conducted on the
energy embedded in water.
Table 4.1- U.S. Annual Water-Related Energy Use and Carbon Emissions, 2005
Sector (“P” = Private supply) Energy Consumption Carbon Emissions
(Million kWh) (Metric Tons)52
Water Supply and Treatment53
Public Water Supply 31,910 19,681,451
Public Wastewater Treatment 24,512 15,118,512
Domestic Supply (P) 930 573,605
Wastewater Treatment (P) 49,025 30,237,642
Commercial Supply (P) 499 307,773
Industrial Supply (P) 3,793 2,339,447
Mining Supply (P) 509 313,941
Irrigation Supply (P) 25,639 15,813,624
Livestock Supply (P) 1,047 645,769
Subtotal for supply and treatment: 137,864 85,031,764
End Use (Water Heating)
Residential54 304,200 169,140,000
Commercial/Institutional55
79,100 35,760,000
Subtotal for End Use: 383,300 204,900,000
U.S. Total: 521,164 289,931,764
22 The Carbon Footprint of WaterSection 4: A New Estimate of National Water-Related Energy Use
Our findings represent a baseline estimate—not an accurate quantification—of water-related
energy use in the United States. Although a much more detailed analysis is needed for a complete
understanding of the energy demands of our water use, this effort has yielded a number of
useful conclusions. We can now confidently say that nationwide water-related energy use is, at a
minimum, equivalent to at 521 million MWh per year, or about 13% of the country’s 2007 electricity
consumption.56
The proportion of water-related energy made up by end-uses in our national estimate is higher than
values indicated in previous studies such as NRDC’s analysis of San Diego, where energy embedded at
end-use accounted for 57% of total water-related energy use.57 The large amount of energy embedded
in water implies the potential exists for significant energy and carbon emission reductions through
water-oriented strategies.
Figure 4.1 - U.S. Water Related Energy Use (Chart design by River Network)
Figure 4.1 shows the annual U.S. water-
related energy use for 2005 by sector. To
determine the energy used for supplying
specific sectors with public water, we used
water-use data from USGS Estimated
Water Use in the United States in 1995
and allocated the energy to each sector
in proportion to their respective shares
of public water use. It was assumed that
public water was allocated to the following
sectors: 56% to domestic users, 17% to
commercial users, 15% to public use and
losses, 12% to industrial users.
Carbon Emissions
We determined the carbon dioxide emissions embedded in U.S. water supplies for each of the
categories used in our estimate of water-related energy use (Table 4.1 shows the mass of carbon
dioxide emissions for water use in 2005). See Figure 4.2 for a breakdown of carbon dioxide emissions
by water-use sector.
The Carbon Footprint of Water 23Section 4: A New Estimate of National Water-Related Energy Use
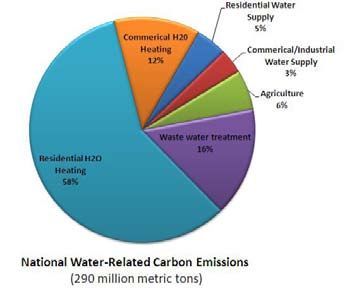
Figure 4.2 - U.S. Water-Related Carbon Emissions, by Sector (Chart design by River Network)
To calculate carbon emissions, the total amount
of energy used in each sector was multiplied by
a carbon intensity factor specific to the energy
source. It was assumed that all of the energy
demands for water supply and treatment were
met with electricity. U.S. EPA eGRID data from
2007 (version 1.1) provided the carbon intensity
factor for the national electric grid. The carbon
intensity assumed for each energy source is
shown in Table 4.2.
Table 4.3- Carbon Intensity of Energy Sources
Energy Source Carbon Intensity (in pounds)
U.S. Electric Grid (per kWh) 1.36
Natural Gas (per cubic foot) 0.12
Fuel Oil (per gallon) 22.384
Liquefied Petroleum Gas (per gallon) 12.669
In 2005 CO2 emissions were approximately 6 billion metric tons.58 We estimate the carbon emissions
related to water in 2005 were approximately 290 million metric tons, or 5% of all carbon emissions
in the U.S. Water-related CO2 emissions are equivalent to the annual greenhouse gas emissions of 53
million passenger vehicles, or the annual electricity use of over 40 million homes.59
Conclusions
• In 2005 the annual water-related energy use in the United States was equivalent to at least 521
million MWh or 13% of 2007 electricity consumption.
• Residential water heating comprises the largest share of water-related carbon emissions.
• Water-related energy consumption is responsible for approximately 290 million metric tons
of carbon dioxide emissions annually. This represents about 5% of the U.S. CO2 emissions in
2005.
• The energy embedded at end-use from water heating alone accounts for 74% of total water-
related energy use. Because water heating was the only energy input considered in our estimate,
end-use likely represents an even greater proportion of water-related energy use.
24 The Carbon Footprint of WaterSection Five
Saving Energy by Saving Water
This section will explore the potential of water efficiency, reuse and low impact development as energy
saving measures.
“Water is one of the few sectors in California’s economy where the same policies can serve both preventative
and adaptive global climate change goals. Making more efficient use of water will reduce our demands on
water resources and shrink the energy consumption associated with water conveyance, pumping, heating and
treatment. California water policies can therefore help the State to adapt to the effects of climate change while
also minimizing GHG emissions.”60 ~ California Air Resources Board
As noted by the California Air Resources Board in the quote above, water presents one of the few
opportunities to employ strategies that will allow us to simultaneously mitigate and adapt to global
warming. Per capita water withdrawals in the United States are among the highest in the world,
amounting to 1,430 gallons per day when all sectors are considered.61 River Network now estimates
that energy consumption related to this water use requires the equivalent of at least 521 million MWh
of electricity. This figure is likely to grow as communities use up local, low-energy water supplies
and are forced to supply water from greater distances or from nontraditional supplies. Unless water
demand is curtailed, the energy and carbon emissions embedded in water will continue to grow, at the
detriment of our climate and riparian resources.
In 2006, River Network proposed a national goal: that conservation, efficiency, reuse and low impact
development could reduce municipal water use on a per-capita basis by 40% over 20 years. We still
believe it possible to develop a concerted national program to accomplish that goal. The energy
and carbon saved would be highly dependent on the energy-intensity of new water sources being
developed which are almost always higher and at a greater environmental cost than those of existing
water supplies.
The Carbon Footprint of Water 25Section 5: Saving Energy by Saving Water
The following strategies would contribute to a national water-related energy reduction program:
1 Conservation and Efficiency
Every drop of water conserved reduces energy consumption and associated carbon emissions,
although the exact amount of savings varies. As discussed in Sections II and III, the energy embedded
in a given unit of water can vary drastically depending on the water system and the type of end-use. In
2005, the California Energy Commission found that investments in water conservation and efficiency
improvements could yield 95% of the energy savings as traditional energy-efficiency programs at 58%
of the cost.62
An analysis conducted by the Pacific Institute and the NRDC found that satisfying all growth in water
demand with conservation would reduce the energy intensity of the California’s water use by 13%.63
In a separate report on water efficiency in the state, the Pacific Institute concludes that with today’s
technology, California could reduce urban water use by about 34% across all sectors.64 As shown in
Table 5.1, demand for residential, commercial, institutional and industrial water in California could be
diminished by up to nearly 40% in each sector.65
Table 5.1: Urban Water Efficiency Potential in California
Urban Water Use by Sector Potential to
Reduce Use
Residential Indoor 39%
Residential Outdoor 25% - 40%
Commercial/Institutional 39%
Industrial 39%
Water System (unaccounted-for water)66 10%53
Total 34%
If we assume that similar water use reductions are achievable in each of these sectors nationwide, then
the potential for water efficiency to reduce water-related energy demands in the United States is large.
Where peak water use coincides with peak electric use, the water utility will pay higher costs for that
electricity. This gives water utilities financial incentives to reduce these coincident peaks—especially
for sources where significant energy is embedded.
A. Residential
Indoor
Indoor residential water use is relatively homogenous across the United States. Toilets, clothes washers,
showers and faucets account for more than 80% of indoor water use for a typical single family home.67
As such, the majority of indoor water conservation efforts rightfully focus on these end-uses. Overall,
per capita indoor water use can be reduced by at least 35% with more efficient water using fixtures and
appliances. This translates to annual savings of approximately 35,000 gallons of water for a family of
four.68
26 The Carbon Footprint of WaterYou can also read