Magnetoencephalography: Clinical and Research Practices - MDPI
←
→
Page content transcription
If your browser does not render page correctly, please read the page content below
brain
           sciences
Review
Magnetoencephalography: Clinical and
Research Practices
Jennifer R. Stapleton-Kotloski 1,2, *, Robert J. Kotloski 3,4   ID
                                                                     , Gautam Popli 1
and Dwayne W. Godwin 1,5
 1    Department of Neurology, Wake Forest School of Medicine, Winston-Salem, NC 27101, USA;
      gpopli@wakehealth.edu (G.P.); dgodwin@wakehealth.edu (D.W.G.)
 2    Research and Education, W. G. “Bill” Hefner Salisbury VAMC, Salisbury, NC 28144, USA
 3    Department of Neurology, William S Middleton Veterans Memorial Hospital, Madison, WI 53705, USA;
      kotloski@neurology.wisc.edu
 4    Department of Neurology, University of Wisconsin School of Medicine and Public Health,
      Madison, WI 53726, USA
 5    Department of Neurobiology and Anatomy, Wake Forest School of Medicine,
      Winston-Salem, NC 27101, USA
 *    Correspondence: jstaplet@wakehealth.edu; Tel.: +1-336-716-5243

 Received: 28 June 2018; Accepted: 11 August 2018; Published: 17 August 2018

 Abstract: Magnetoencephalography (MEG) is a neurophysiological technique that detects the
 magnetic fields associated with brain activity. Synthetic aperture magnetometry (SAM), a MEG
 magnetic source imaging technique, can be used to construct both detailed maps of global brain
 activity as well as virtual electrode signals, which provide information that is similar to invasive
 electrode recordings. This innovative approach has demonstrated utility in both clinical and research
 settings. For individuals with epilepsy, MEG provides valuable, nonredundant information.
 MEG accurately localizes the irritative zone associated with interictal spikes, often detecting
 epileptiform activity other methods cannot, and may give localizing information when other methods
 fail. These capabilities potentially greatly increase the population eligible for epilepsy surgery
 and improve planning for those undergoing surgery. MEG methods can be readily adapted to
 research settings, allowing noninvasive assessment of whole brain neurophysiological activity, with a
 theoretical spatial range down to submillimeter voxels, and in both humans and nonhuman primates.
 The combination of clinical and research activities with MEG offers a unique opportunity to advance
 translational research from bench to bedside and back.

 Keywords: magnetoencephalography; magnetic source imaging; synthetic aperture magnetometry;
 epilepsy

1. Introduction

1.1. What Is MEG?
     The fundamental activity of the brain, signaling between neurons, functions through the
movement of charged ions. The resultant fields generated from these charges, i.e., electrical
potentials, are often measured for clinical and research purposes, mostly commonly through
electroencephalography (EEG). Moreover, changing electric fields generate magnetic fields which also
are measured clinically through magnetoencephalography (MEG), and the latter has several advantages
over the measurements of electric fields, although MEG also requires greater technical infrastructure
(see [1] for review). While electric neurophysiologic activity has been measured since 1875 [2],
the technical advances required to enable the measurement of magnetic neurophysiologic activity

Brain Sci. 2018, 8, 157; doi:10.3390/brainsci8080157                            www.mdpi.com/journal/brainsci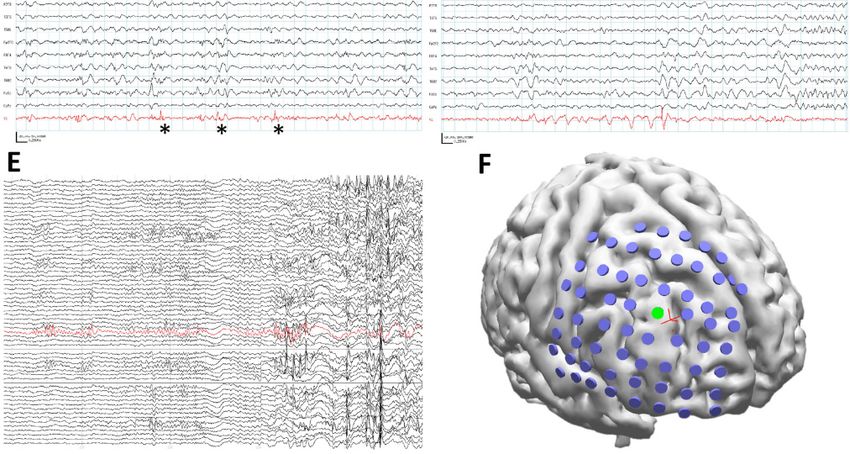
Brain Sci. 2018, 8, 157                                                                               2 of 22

were not available until nearly a century later [3]. While EEG measures the secondary extracellular
electrical potentials generated by brain activity, MEG detects the magnetic fields associated with the
primary, or intracellular activity. As the brain, skull, and scalp distort the EEG signals, EEG only has a
minimum spatial resolution of 2 to 3 cm [4]. In contrast, the head is magnetically transparent, so under
optimal conditions MEG activity maps have a sub-millimeter spatial accuracy [5,6]. MEG can also
be used to image subcortical brain activity in such areas as the hippocampus, amygdala, thalamus,
and brainstem [7–17], as well as cerebellum [9,18,19], although this ability is often not appreciated.
      MEG is a quantitative neurophysiological recording technique that can be used to perform
neuroimaging. The analytical process of localizing or mapping MEG signals within the brain is
referred to as magnetic source imaging (MSI). Typically, MSI is accomplished by dipole analysis,
in which a brief signal, such as an interictal spike, is modeled as a point source arising from a single
generator [1]. Dipole brain maps of interictal spikes look similar to clusters of pins embedded in a map
(e.g., see analysis for patient in Section 3.4). The synthetic aperture magnetometry (SAM) beamformer
is an alternative MSI technique to dipole analyses that does not make assumptions regarding the
durations, numbers, locations, or spatial extent of generators present [20–24]. Through the use of
SAM [20], MEG signals can be converted into statistical parametric maps of brain activity, an mapping
approach similar to those obtained by functional magnetic resonance imaging (fMRI) to map the blood
oxygen-level dependent (BOLD) signal [5], and which (in the case of MEG) provides much more
detailed spatial information than that obtained by dipole analyses.
      fMRI is an indirect measure of brain activity based on blood oxygen content, thus fMRI signals
are very slow, with a minimum temporal resolution of ≥2 s. In contrast, MEG signals are a direct
measure of the primary currents of brain activity [1], have a sub-millisecond temporal resolution [25],
and can have a frequency bandwidth of direct current (DC) to 3000 Hz (or greater), which is far
beyond what fMRI can detect and which has particular importance in the detection of high frequency
oscillations, or HFOs (see below). Finally, SAM can be used to construct virtual electrodes for
any point in the brain, providing a continuous, wide-band, submillisecond representation of brain
activity. Virtual electrodes essentially provide similar neurophysiological information as an invasive
intracranial electrode [21,26], with the obvious benefits of not causing tissue damage, the ability to
examine locations retrospectively, superior spatial resolution, and the ability to target deep structures
such as the thalamus [9], brainstem [27], or cerebellum [19], which are dangerous to access with
implantable electrodes.

1.2. Clinical Uses for MEG
      Epilepsy is a devastating disorder, defined by seizures emanating from a brain predisposed to
generate seizures, which be inherent (i.e., genetic) or acquired through a precipitating event, such as
a traumatic brain injury [28]. Epilepsy is the fourth most common neurological disorder in the
United States. Seizures are the result of abnormal, synchronous firing of populations of neurons that
lead to a behavioral change, including behavioral arrest, uncontrolled movement, and/or loss of
consciousness [29]. Approximately 1.8% of American adults have been diagnosed with epilepsy at
some point in their lives, about 1.0% of all American adults are classified as having active epilepsy [30],
and the prevalence of epilepsy in children is about 0.5–1% [31,32]. Of these individuals, only about
70–80% achieve adequate seizure control through the use of antiseizure drugs [33]. The remaining
20–30%, whose seizures are pharmaco-resistant, are responsible for ~80% of the estimated $12.5 billion
annual expenditure on epilepsy [34]. For this latter group, surgical resection of the seizure onset zone(s)
is offered as an effective means for ameliorating or alleviating epilepsy [35], although it is estimated
that only 2–3% of all possible surgical candidates actually receive surgery [36]. In both children and
adults, successful surgery is linked to improved psychiatric and social function, improved quality of
life, and especially in the case of children, improved development (see [37,38] for review).
      To better distinguish between individuals who are surgical candidates and those who are not,
and to increase the probability of successful surgery in the former group, it is necessary first to localize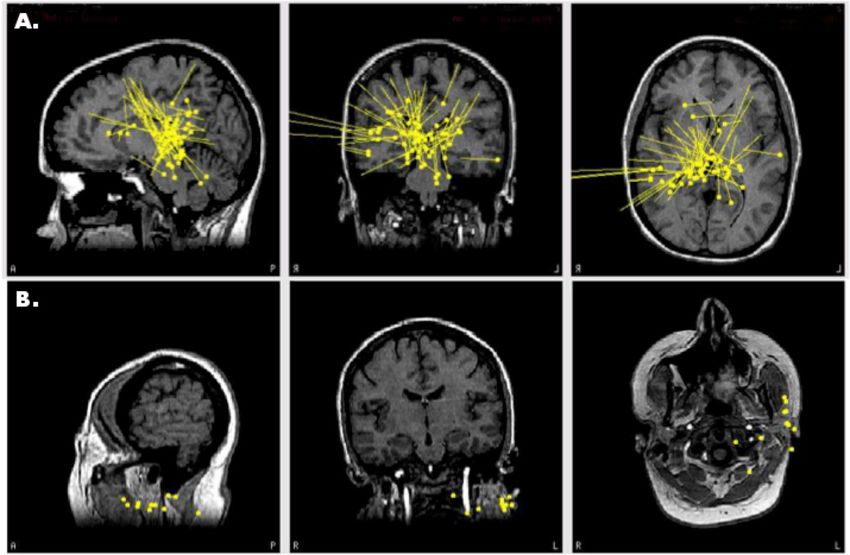
Brain Sci. 2018, 8, 157                                                                           3 of 22

the seizure generators. While the gold standard for localizing the seizure onset zone is the clinical
outcome following resection, during a presurgical evaluation intracranial EEG (ICEEG) is considered
to be the most reliable technique. However, ICEEG is limited as it can only identify the locations of
the ictal generator(s) if the electrode grids, strips, or depths are placed directly over or within the
seizure focus, and only a very limited portion of the brain can be monitored with ICEEG. Therefore,
accurate and precise data regarding the seizure onset zone are needed prior to the implantation for an
optimal investigation. Furthermore, ICEEG is an expensive and invasive procedure [39], requiring
lengthy inpatient monitoring over days or weeks, and carries the rare but serious risks of infection,
bleeding, and scarring. As such, a variety of supplemental, noninvasive techniques such as scalp EEG,
MRI, positron emission tomography (PET), single-photon emission computed tomography (SPECT),
and MEG/MSI are commonly used to localize the seizure onset zone or the related irritative zone,
and to direct the placement of ICEEG.
      For over thirty years [40–43], MEG and MSI have been used extensively to accurately localize the
irritative zone in individuals with epilepsy. The average sensitivity of MEG to detect epileptiform
activity is ~70–80%, versus about a 60% detection rate for simultaneously recorded EEG [44–46],
while in those who proceeded to surgery, MSI accurately identified the lobe to be treated with
89% accuracy [44]. In ~13% of all individuals, MEG-only spikes are detected, while in ~3% of all
individuals EEG-only spikes occur, suggesting that in one-third of all EEG-negative individuals,
MEG is expected to detect epileptiform signals [45]. Numerous clinical studies have demonstrated
an excellent agreement between foci delineated by MEG/MSI and ICEEG [26,47–52], and MEG foci
have been found to align with lesions such as tuberous sclerosis [53–58] and cortical dysplasia [50,51].
Similarly, retrospective studies have found that dipole maps of interictal spikes had clustered over
subsequent resection volumes [46,59,60], even when video EEG results were nonlocalizing. In addition
to spikes, HFOs (~100–500 Hz, and even up to or beyond 1000 Hz [53,61]) are also linked to the seizure
onset zone, can occur independently of spikes, and represent an additional biomarker of primary
epileptogenesis [62–65]. Complete resection of tissue related to ictal HFOs is also associated with good
surgical outcome [66–68]. While HFOs are typically recorded with ICEEG, they may also be detected
noninvasively by MEG [61,69–72]. Finally, MEG and MSI can also be used to map eloquent cortex
as a part of surgical planning, another task that is often performed invasively with ICEEG. MSI has
been used to map such functional regions as somatosensory [73–85], motor [86–89], visual [90] and
language networks [91–96].
      Several lines of evidence directly support the utility of MEG as a key, nonredundant part of the
surgical planning routine. In a prospective, blinded, crossover study, Sutherling and colleagues [97]
compared surgical planning decisions before and after MSI findings were revealed. They found
that MSI provided useful, nonredundant information in 33% of all patients, either by changing the
surgical decision or by adding ICEEG electrodes or by changing ICEEG coverage. MSI benefitted
21% of patients that proceeded to surgery and added useful information that changed treatment in
9% of patients, without increasing complications. These results have been corroborated by Mamelak
and colleagues, who found that MSI provided unique localizing information not revealed by other
methods, that MSI changed ICEEG placement, and that MSI strongly influenced surgical management,
particularly in patients with neocortical epilepsy [48]. In another series of landmark studies, Knowlton
and colleagues [98] found that MSI has a higher sensitivity (58–64%) and specificity (79–88%) than
PET (sensitivity, 22–40%; specificity, 53–63%) or ictal SPECT (sensitivity, 39–48%; specificity, 44–50%)
when compared to ICEEG-based localization; the authors note that these estimates may be low because
ICEEG itself has limitations in delineating foci. MSI can guide ICEEG placement and thereby increase
its diagnostic yield [39,48], or it might be able to reduce the use of ICEEG [52]. Positive MSI results
also have 72% sensitivity, 70% specificity, 78% positive predictive value, and 64% negative predictive
value with respect to a subsequent freedom from disabling seizures (Engel class I surgical outcome) in
patients who require ICEEG [99].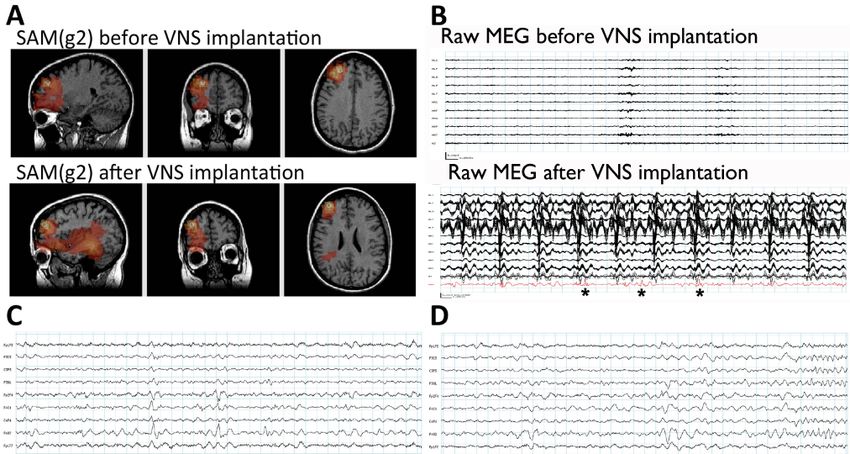
Brain Sci. 2018, 8, 157                                                                             4 of 22

     MEG is less commonly utilized in pediatric patients with epilepsy owing to their smaller head
sizes and the corresponding increased distance from the sensors as well as difficulties in cooperation,
but children have been successfully scanned in both adult, whole cortex systems [50,56,100] as well as
helmets and arrays specially designed for children [101–107]. Children may also be sleep deprived
prior to the scan, thus encouraging them to sleep (and remain motionless) in the MEG [53,102], or they
may be sedated [50,56]. As with adults, MEG is useful in both lesional and nonlesional cases [38,101],
with particular utility in mapping spikes associated with tuberous sclerosis [53,55–57,102], cortical
dysplasia [102,108] and other malformations [101,108]. HFOs have been successfully localized by MEG
in children [71] and functional mapping of eloquent cortex may also be performed [50,102].
     The American Clinical Magnetoencephalography Society (ACMEGS) is a clinical society
comprised of physicians and researchers with expertise in MEG/MSI, EEG, MRI, and CT. Based on the
past several decades of MEG research, in 2009 the ACMEGS group released their position statement
in which they support the routine use of MEG/MSI in the presurgical evaluation of epilepsy for the
following reasons: (1) It can safely and cost-effectively provide localizing information in comparison to
invasive procedures; (2) It can increase the yield of ICEEG by identifying or refining areas for coverage;
and (3) It may reduce costs and improve the accuracy of epilepsy evaluations, and thus make surgery
a more appealing option [25].

2. MEG at Wake Forest Baptist Health
      As an example of a MEG program that incorporates both active clinical and research programs,
we will describe our own work at Wake Forest Baptist Health (WFBH). WFBH is an academic medical
center located in Winston-Salem, NC, USA. WFBH possesses a whole helmet, 304-channel CTF
MEG International Services LP MEG scanner (Coquitlam, BC, Canada), which was installed in
early 2006. While there are about 30 clinical MEG sites located in the United States, regionally,
our installation is the only one in North Carolina, and the only clinical scanner between Birmingham,
AL, and the National Institutes of Health (NIH) campus (Bethesda, MD, USA) (an area with an
approximately 300 miles/480 km radius). As such, the service receives referrals from within state
as well as throughout the mid-Atlantic States and has even received patients from as far as New
York, Alabama, and Missouri. Unlike many other sites that utilize planar gradiometers, our CTF
MEG system is equipped with axial (also called radial) gradiometers, which have an excellent
depth profile [109,110] and can thus effectively detect subcortical signals [7,8,10–14]. The CTF MEG
system also employs synthetic gradiometry, which very effectively removes environmental noise from
the patient’s magnetoencephalogram while boosting the signal to noise ratio (SNR) and results in
remarkably clean, stable data [22,78,109–111].
      For MSI, we utilize synthetic aperture magnetometry (SAM) to identify the irritative zone and
to map eloquent brain functions. Unlike dipole analyses, SAM can easily map multiple interictal
generators [21,23,24], identify generators of large spatial extent [22], and properly estimate the depth
of signals [20]. As SAM is a spatial filter which automatically removes all signals that do not arise from
within the brain volume, potential artifacts from heartbeat, respiration, eye movements [87], very large
amplitude artifacts arising from dental hardware [80,112], deep brain stimulators [27], etc. are reliably
eliminated. One variant of this technique, SAM(g2), has been used successfully in the clinical setting to
map the kurtotic (sharp) signature of epileptiform signals arising from interictal foci and to reconstruct
the virtual electrodes associated with these generators [21,24,51,53,54,112–114]. Importantly, the virtual
electrodes can be inspected for the presence of epileptiform activity, and exhibit a strong agreement
with the activity recorded by ICEEG [21,26]. A second variant of the SAM method, dual-state SAM,
can be used to image trial-based tasks typically employed for functional mapping [87,91,93]. We have
recently extended the uses of SAM to successfully map patients with vagal nerve stimulators (VNS, [11];
see below for examples), cerebrospinal fluid (CSF) shunts, metal plates, and cardiac pacemakers.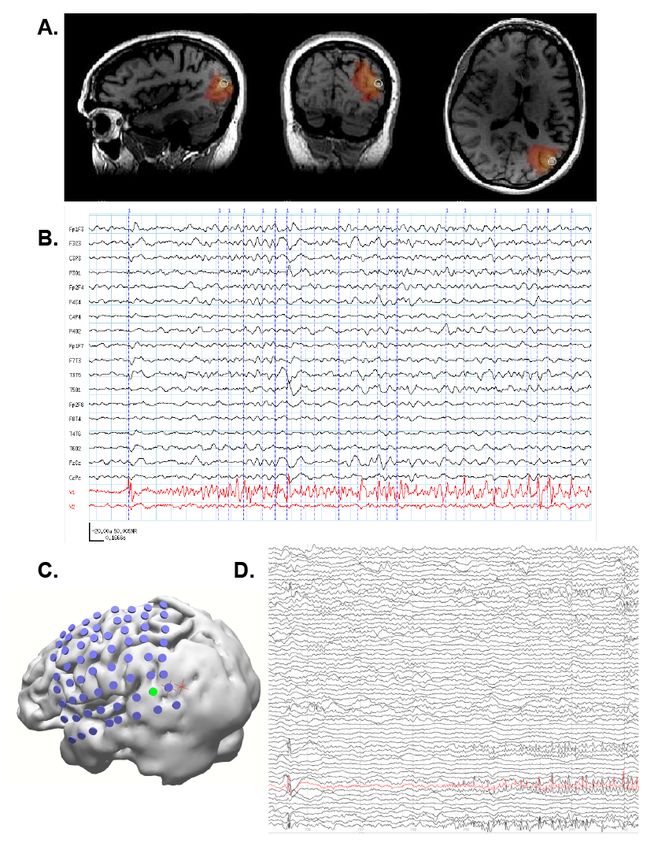
Brain Sci. 2018, 8, 157                                                                             5 of 22

General MEG Scanning Protocols
      MEG recordings can be obtained in either the awake state or in a sedated state. There are no age
or sex exclusions to receive a MEG scan at our facility, though individuals with a head circumference
>63 cm will not fit within the helmet and therefore cannot receive a MEG scan. Those with a cochlear
implant are excluded from scanning because CTF has informed us that signals from the implants may
damage our gradiometers. We do not have any other restrictions for obtaining a clinical MEG scan.
The CPT codes for MEG scans of epileptiform activity and cognitive function are 95965, 95966, 95967,
and the code for magnetic source imaging is S8035.
      Typically, a clinical MEG scan for epilepsy has a total duration of 40–60 min, and this period
is broken into five or ten minute epochs for better file size management on our acquisition system.
EEG is usually acquired simultaneously with the MEG scan if the individual’s head circumference
will permit the addition of EEG leads. Our system can perform continuous head localization to track
head position and movement in the scanner through the use of three small, energized fiducial leads
that are placed between the eyebrows and in front of each ear. The total time to prepare the individual
and to attach the fiducials and the EEG electrodes is about one hour. The MEG scanner operation
is silent, and the helmet reclines, so individuals can be scanned supine while sleeping. Adults are
usually sleep-deprived overnight, or for several hours for children, because interictal spikes may
occur more frequently during sleep [115]. Following the epilepsy scan portion, the EEG leads are
removed and the patients are given the option of a short break. Scanning recommences in the seated
position, and patients may undergo somatosensory, motor, or language testing for mapping purposes,
as per physician request. The functional testing portion typically requires a total of about an hour.
The total setup and scan time for a MEG is about 3–4 h. Following the MEG scan, individuals receive
a structural T1 magnetization-prepared rapid gradient-echo (MP-RAGE) MRI to subsequently align
with their MEG data, and from which a realistic three-spherical shell, multiple local-spheres head
model will be constructed [116]. Patients also receive additional imaging such as DTI (diffusion tensor
imaging), T2 FLAIRs (fluid-attenuated inversion recovery), SWI (susceptibility weighted imaging),
FS (fat saturation), and IR (inversion recovery) scans. The MP-RAGE and FLAIRs are conducted before
and after gadolinium contrast. The MRI scans usually occur in the same day. For the purposes of MEG
analysis, only the T1 MPRAGE is used. To prevent subtle magnetization effects, MRI scans are always
performed after MEG scans.
      MEG data are acquired with a sampling rate of 600–2400 Hz, and data are preprocessed offline
with synthetic 3rd order gradiometry, DC-offsetting, and powerline filtering [11,117–119]. The SAM(g2)
method is comprised of a sequence of steps in which the sensor data are filtered from 20–70 Hz and
then beamformed in single-state mode. Voxels with a pseudo-z score ≥ 5.0 are retained and virtual
electrodes of 20–70 Hz bandwidth are constructed for each voxel. The kurtosis (g2) of each virtual
electrode is calculated and then a map of g2 scores is created. Spikes are detected as outliers (kurtotic)
in this bandwidth. Voxels for which g2 ≥ 3.0 are retained, and the local maxima plus the full width,
half max (FWHM) volume of voxels surrounding the peaks in the map correspond to the location(s)
of interictal spikes, which are mapped in brain space. Virtual electrodes are constructed for all peak
voxels in a bandwidth of 3–70 Hz. Spikes are automatically marked in the virtual electrodes at the
earliest rising phase of all waveforms with a peak-to-rms ratio ≥ 6.0 [23,112], although spikes with
a lower ratio are often visible and may be considered. Spikes in the virtual electrodes may then be
compared to the simultaneous EEG by the physicians.

3. Illustrative Clinical Cases
      Since 2006, MEG and MSI have been part of the standard WFBH presurgical evaluation for patients
with epilepsy. We incorporated SAM into our analysis routines in 2010, and our unique combination
of axial gradiometers, synthetic gradiometry, and SAM provides an excellent level of accuracy and
resolution for epilepsy and functional mapping. We present a small number of representative cases to
illustrate the capability of MEG for patient care. When available, we will benchmark the MEG results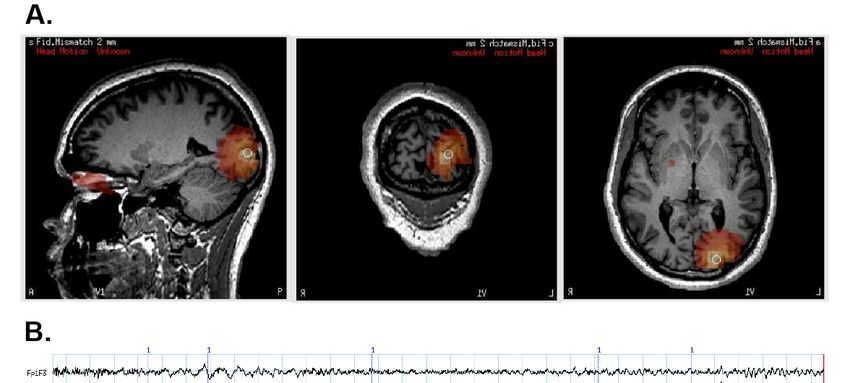
Brain Sci. 2018, 8, 157                                                                                                                       6 of 22

against the results obtained from other modalities such as scalp EEG, structural MRI, PET, SPECT, and
ICEEG. The patients presented in cases 1 and 5 were also presented previously [11].

3.1. Case 1: MEG Localization Is Concordant with Multiple Other Modalities
     A 37-year-old man with a VNS presented for further evaluation. The patient had focal seizures
with dyscognitive symptoms and occasionally evolution to bilateral convulsive seizures since he was
18 years old. Several events were captured during an epilepsy monitoring unit (EMU) admission, all
of which localized to the right temporal region. An MRI of his brain did not reveal any structural
abnormalities. SPECT (Figure 1F) and PET imaging (Figure 1G) suggested a right temporal seizure
focus. A MEG recording analyzed by SAM(g2) revealed a right mesial temporal focus centered on
the hippocampus       (Figure
                Brain Sci.            1B)PEER
                           2018, 8, x FOR    and     amygdala (Figure 1C), with some occasional right
                                                 REVIEW                                                                        6 of 22 ventral frontal,

right posterior,18and
                   years lateral
                            old. Several  temporal
                                             events were spread       fromanthis
                                                           captured during             zone,
                                                                                 epilepsy         and unit
                                                                                           monitoring    some(EMU)  additional
                                                                                                                      admission, allspread to right
insula. While the     rawlocalized
                of which       MEG to      sensor
                                              the rightdata    exhibited
                                                         temporal  region. Anartifacts
                                                                                 MRI of his due      thenot
                                                                                              brain did    VNS,
                                                                                                             revealtheany virtual
                                                                                                                          structural electrode data
                abnormalities. SPECT (Figure 1F) and PET imaging (Figure 1G) suggested a right temporal seizure
from hippocampus           and      amygdala           (Figure     1A)    displayed        no   evidence
                focus. A MEG recording analyzed by SAM(g2) revealed a right mesial temporal focus centered on
                                                                                                                of   VNS     artifact. While clear
spikes existed in
                the the     virtual(Figure
                     hippocampus           electrode
                                                   1B) anddata,    the(Figure
                                                            amygdala      EEG1C), datawithonly     occasionally
                                                                                            some occasional             exhibited
                                                                                                              right ventral  frontal, simultaneous
                right posterior, and lateral temporal spread from this zone, and some additional spread to right
interictal spikes.  Invasive monitoring was planned on the basis of the concordant findings between
                insula. While the raw MEG sensor data exhibited artifacts due the VNS, the virtual electrode data
MEG, SPECT, and        PET. Subdural
                from hippocampus                     grids (Figure
                                            and amygdala      were 1A)placed      over
                                                                           displayed   no the    lateral
                                                                                           evidence   of VNSand     mesial
                                                                                                               artifact. Whileaspects
                                                                                                                                clear     of the right
temporal lobe, spikes
                 and existed
                          depthinelectrodes
                                         the virtual electrode
                                                          weredata,    the EEG into
                                                                  inserted       data only
                                                                                        theoccasionally    exhibited simultaneous
                                                                                               right amygdala            and right anterior and
                interictal spikes. Invasive monitoring was planned on the basis of the concordant findings between
posterior hippocampus.
                MEG, SPECT, and      Frequent          interictal
                                           PET. Subdural             spikes
                                                            grids were   placed were
                                                                                 over theseen
                                                                                           lateral on
                                                                                                   and the
                                                                                                        mesialhippocampal
                                                                                                                aspects of the rightand amygdalar
electrode contacts (Figure 1D), and several seizures arose from the anterior hippocampal
                temporal     lobe,    and   depth   electrodes  were inserted   into the right  amygdala    and   right anterior and and amygdalar
                posterior hippocampus. Frequent interictal spikes were seen on the hippocampal and amygdalar
electrodes, an example        of which can be seen in Figure 1E. Following the invasive monitoring the patient
                electrode contacts (Figure 1D), and several seizures arose from the anterior hippocampal and
received a rightamygdalar
                 anterior electrodes,
                                 temporalanlobectomy               with can
                                                     example of which      amygdalohippocampectomy.
                                                                                be seen in Figure 1E. Following thePrior          to his surgery, the
                                                                                                                            invasive
                monitoring           the      patient     received    a     right    anterior      temporal      lobectomy      with
patient experienced ~2 seizures per month. Following surgery, the patient was seizure-free for several
                amygdalohippocampectomy. Prior to his surgery, the patient experienced ~2 seizures per month.
months, but experienced
                Following surgery,    a breakthrough             of twofor
                                           the patient was seizure‐free     seizures      following
                                                                               several months,             a dosea breakthrough
                                                                                                  but experienced      reduction in antiseizure
                of two    seizures     following   a  dose reduction  in antiseizure
medication, and another breakthrough of four seizures coincident with the onset of an medication,    and  another   breakthrough    of illness.
                      four seizures coincident with the onset of an illness.

                                                                 Figure 1. Cont.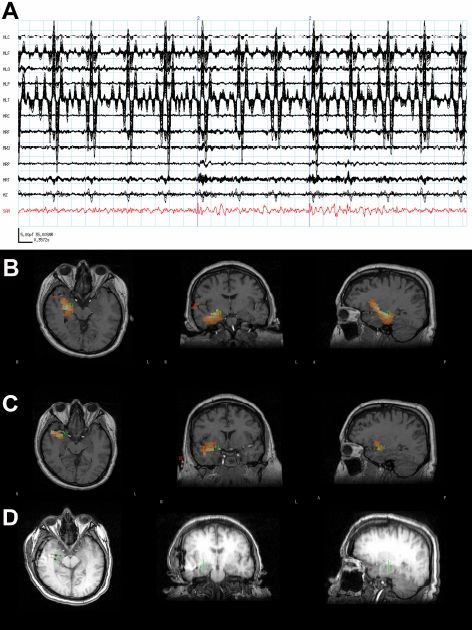
Brain Sci. 2018, 8, 157                                                                                                                          7 of 22

                     Brain Sci. 2018, 8, x FOR PEER REVIEW                                                                   7 of 22

                           Figure 1. (A) The raw magnetoencephalogram (MEG) sensor data (black traces) exhibited strong
      Figure 1. (A) The        raw
                         artifacts due magnetoencephalogram                 (MEG)
                                       the patient’s vagal nerve stimulator (VNS), but sensor
                                                                                       the virtual data     (black
                                                                                                    electrode          traces)
                                                                                                               signal (red)       exhibited strong
                                                                                                                            from the
                         amygdala displayed clear spikes. (B) The synthetic aperture magnetometry (SAM) (g2) statistical
      artifacts due the     patient’s vagal nerve stimulator (VNS), but the virtual electrode signal (red) from
                         parametric maps indicated a right hippocampal focus as well as (C) another focus in the amygdala.
      the amygdala displayed             clear tomography
                         (D) A computerized     spikes. (B)     The
                                                             (CT)  scansynthetic     aperture
                                                                       reveals the placement       magnetometry
                                                                                               of the                       (SAM) (g2) statistical
                                                                                                       hippocampal and amydalar
      parametric maps    depth   electrodes, a
                             indicated       as right
                                                 well ashippocampal
                                                         the location of thefocus
                                                                             hippocampal
                                                                                     as wellfocusas(green   cross) as identified
                                                                                                      (C) another        focus by in the amygdala.
                         SAM(g2). (E) An example of a seizure that arose from the anterior hippocampal and amygdalar
      (D) A computerized electrodes, (black asterisks). (F) A coronal plane ictal single‐photon emission computerized and amydalar
                                   tomography         (CT)   scan    reveals    the  placement         of  the   hippocampal
      depth electrodes, as well
                         tomography        as the
                                        (SPECT)  imagelocation      of the
                                                        demonstrating        hippocampal
                                                                       hyperperfusion              focus
                                                                                        of the right temporal(green      cross)
                                                                                                                lobe (arrow).      as identified by
                                                                                                                               (G) A
                         coronal plane 18F‐fluorodeoxyglucose (FDG) (positron emission tomography) PET image
      SAM(g2). (E) An example of a seizure that arose from the anterior hippocampal and amygdalar
                         demonstrating hypometabolism of the right temporal lobe (arrow).
      electrodes, (black asterisks). (F) A coronal plane ictal single-photon emission computerized tomography
      (SPECT) image3.2. Case  2: MEG Discrimateshyperperfusion
                           demonstrating             among Multiple Seizureof Foci
                                                                                the right temporal lobe (arrow). (G) A coronal
                         A 24‐year‐old man whose
      plane 18F-fluorodeoxyglucose                 (FDG)focal(positron
                                                              seizures began   at age 7 presented
                                                                            emission       tomography)for furtherPET
                                                                                                                   evaluation.
                                                                                                                          imageDuringdemonstrating
                   his episodes, the patient was reported as having a surprised look on his face, covering his mouth with
      hypometabolism         of the right temporal lobe (arrow).
                   his hands, and laughing. These episodes happened several times per day and were followed by
                     marching movements of the legs and grunting noises. The patient had no alteration of consciousness
               during his seizures. He also experienced hypermotor seizures arising out of sleep at least nightly and
3.2. Case 2: MEG  Discrimates among Multiple Seizure Foci
               often had several per night. The patient sustained bilateral frontal lobe damage, intraparenchymal
                     hemorrhages, and extra axial hemorrhages following a severe fall in 2006. He was seen by several
     A 24-year-old    man whose focal seizures began at age 7 presented for further evaluation. During
                 neurologists before coming to WFBH.
his episodes, the patient was reported as having a surprised look on his face, covering his mouth
with his hands, and laughing. These episodes happened several times per day and were followed by
marching movements of the legs and grunting noises. The patient had no alteration of consciousness
during his seizures. He also experienced hypermotor seizures arising out of sleep at least nightly and
often had several per night. The patient sustained bilateral frontal lobe damage, intraparenchymal
hemorrhages, and extra axial hemorrhages following a severe fall in 2006. He was seen by several
neurologists before coming to WFBH.
     The patient’s epilepsy was refractory to multiple antiseizure medications. His initial EMU
admission in 2001 was unable to localize the seizure onset zone. The interictal EEG showed very
frequent epileptiform discharges arising from the right frontal region, but PET showed mild decreased
activity in the left medial temporal lobe which was consistent with an epileptogenic focus. Both ictal
and interictal SPECT indicated slightly asymmetric activity within the temporal lobes with the right
side greater than the left, also suggestive of an epileptogenic focus within the left temporal lobe.
Because of the discordant findings, the patient proceeded to invasive monitoring. ICEEG pointed
towards a right frontal lobe origin, but the pattern of spiking occurred almost simultaneously with
patient’s clinical semiology. At that time, it was felt that the seizure focus was not clearly localized to
warrant right frontal lobectomy. The patient then received a VNS in addition to medication, and this
combination was effective for several years.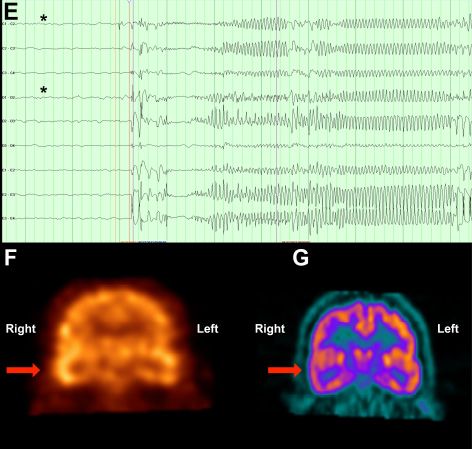
Brain Sci. 2018, 8, 157 8 of 22
The patient began to experience more problems around 2012 and was recommended for a MEG
scan. The patient’s MEG data were very noisy owing to metal hardware in his skull that covered the
burr holes from his previous invasive monitoring, but SAM(g2) sufficiently removed these artifacts
and revealed a single focus in the right middle frontal gyrus (Figure 2A) with numerous, MEG-only
spikes (Figure 2B). (Because the head is magnetically transparent, MEG is not susceptible to breach
effects from craniotomies or other defects.) The MRI obtained for the MEG scan also revealed a small
focus of cortical thinning and irregularity with subtle T2 hypointensity in the right frontal lobe. Based
on the MEG results, the patient underwent invasive monitoring with a stereo-EEG array placed over
the MEG focus (Figure 2C). The patient’s epileptiform activity (green arrowhead, Figure 2D) was
subsequently localized to the three ICEEG contacts (green arrows) nearest to the peak of the SAM
focus (red sphere, Figure 2C). The patient then received a right frontal lobe resection of the seizure
focus and has been seizure free since.
3.3. Case 3: MEG Identifies an Unexpected Seizure Focus
A 21-year-old man with an onset of seizures in 2004 presented for further evaluation. He had one
febrile seizure in infancy and has a history of headaches. His events consisted of staring off for a few
minutes, being unaware of surroundings, and exhibiting abnormal behavior and incomprehensible
speech. He felt tired afterwards and typically had an aura of a right frontal headache. The patient’s
seizure frequency was 1–2 per week, and his longest seizure-free interval was two years. The patient
had tried multiple antiseizure medications but his seizures were insufficiently controlled under them.
During a subsequent EMU admission, scalp EEG recorded several seizures originating in the left
temporal region, and his interictal EEG was notable for occasional left temporal slowing and left
temporal epileptiform activity. Ictal SPECT exhibited left occipital and left temporal hyperperfusion
during one of these seizures, and a later interictal SPECT uncovered two possible anterior and posterior
left temporal foci that were considered worrisome for seizure foci. The PET scan was negative.
Structural MRI indicated a possible subtle form of hippocampal malrotation as well as two small
foci of T2 hyperintensity in the bilateral frontal white matter that were nonspecific, but were thought
to be the sequelae of prior ischemia, inflammation/infection, trauma or demyelination. In contrast,
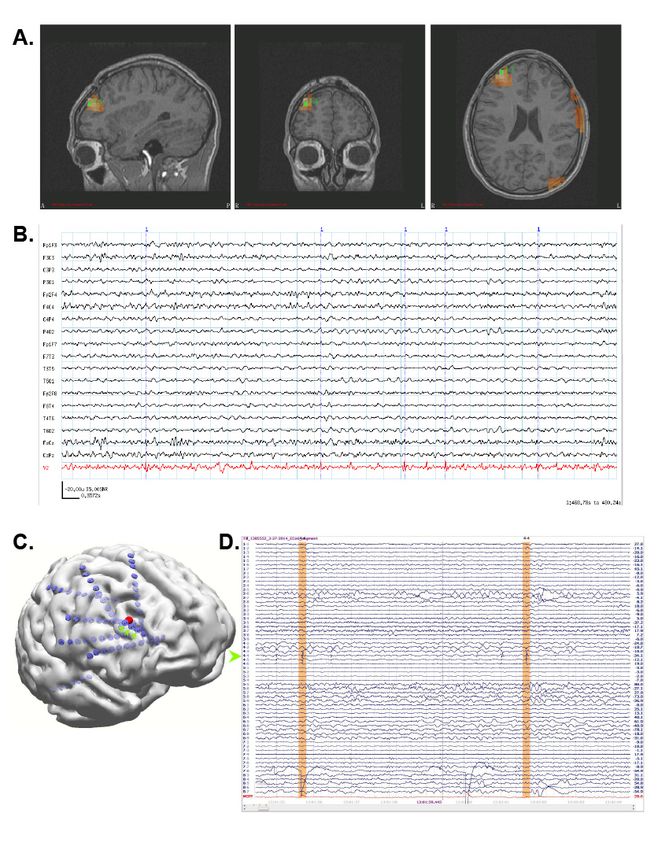
the patient’s MEG scan revealed a left occipital focus (Figure 3A) with hundreds of MEG-only spikes
visible on the virtual electrode (Figure 3B). Based on the collective results, the patient received invasive
monitoring with inter-hemispheric and left lateral occipital grids and left temporal depth electrodes.
ICEEG confirmed the left occipital MEG focus as the seizure generator. The patient had a left occipital
resection and had a few seizures shortly after surgery in the setting of medication nonadherence.
Following this, he has been seizure-free for over a year.Brain
Brain Sci.Sci. 2018,
2018, 8, x FOR PEER REVIEW
8, 157 9 of9 22
of 22
Figure 2. (A) SAM(g2) identified a single focus in the right middle frontal gyrus. (B) The virtual
electrode (red) exhibited numerous small, sharp spikes which were not visible in the simultaneous
Figure 2. (A) SAM(g2) identified a single focus in the right middle frontal gyrus. (B) The virtual
EEG (black traces).
electrode (C) Stereo
(red) exhibited EEG electrodes
numerous (green
small, sharp arrows)
spikes whichplaced
were directly over
not visible in the
the MEG focus (red
simultaneous
sphere) exhibited frequent epileptiform activity ((D), green arrow), two spikes of which are highlighted
EEG (black traces). (C) Stereo EEG electrodes (green arrows) placed directly over the MEG focus (red
in orange.
sphere) exhibited frequent epileptiform activity ((D), green arrow), two spikes of which are
highlighted in orange.Brain Sci. 2018, 8, 157 10 of 22
Brain Sci. 2018, 8, x FOR PEER REVIEW 10 of 22
Figure 3. (A)
Figure SAM(g2)
3. (A) SAM(g2)indicated
indicatedthe
thepresence
presenceofof aa left occipital focus
left occipital focuswith
withnumerous
numerousMEG‐only
MEG-only spikes
spikes
visible on the virtual electrode ((B), red trace). The simultaneous scalp EEG recording (black traces)
visible on the virtual electrode ((B), red trace). The simultaneous scalp EEG recording (black traces) did
notdid
detect these spikes.
not detect these spikes.
3.4.3.4.
Case 4: 4:
Case SAM Localization
SAM LocalizationIsIsSuperior
SuperiortotoDipole
Dipole Analysis
Analysis
A 31‐year‐old
A 31-year-old woman
woman withwith
a VNSa VNS implantation
implantation three three years toprior
years prior to herrecording
her MEG MEG recording
presented
for further evaluation. Since age 5, the patient had focal seizures that began with a “funny“funny
presented for further evaluation. Since age 5, the patient had focal seizures that began with a feeling,”
feeling,”
flushing, andflushing, and head
head turning turning
to the right.toSome
the right. Someterminated
seizures seizures terminated at this
at this point, point,
while at while
other at otherher
times
times progressed
seizures her seizurestoprogressed to impairand/or
impair awareness awareness and/or
evolved evolved
into into aconvulsive
a bilateral bilateral convulsive seizure.
seizure. Treatment
with several antiseizure medicines failed to improve the woman’s seizure frequency. An MRIAn
Treatment with several antiseizure medicines failed to improve the woman’s seizure frequency. did
notMRI did not demonstrate
demonstrate any structural
any structural brain abnormalities.
brain abnormalities. An EMU An EMU evaluation
evaluation captured
captured seizures
seizures with
with a broad, right hemispheric onset. An initial MEG recording prior to VNS implantation captured
a broad, right hemispheric onset. An initial MEG recording prior to VNS implantation captured
epileptiform activity, which was originally and unsuccessfully analyzed using equivalent current
epileptiform activity, which was originally and unsuccessfully analyzed using equivalent current
dipole modeling (Figure 4A). The interpretation at the time was that the MEG study did not provide
dipole modeling (Figure 4A). The interpretation at the time was that the MEG study did not provide
localizing information. As the patient’s seizure focus was not localized with any modality, she
localizing information. As the patient’s seizure focus was not localized with any modality, she received
received a VNS.
a VNS.Brain Sci. 2018, 8, 157 11 of 22
Brain Sci. 2018, 8, x FOR PEER REVIEW 11 of 22
Figure 4. (A) Prior to VNS implantation, equivalent current dipole map of interictal spikes was
Figure 4. (A) Prior to VNS implantation, equivalent current dipole map of interictal spikes was
nonlocalizing. The yellow circle indicates the dipole position, and the yellow tail indicates dipole
nonlocalizing. The yellow circle indicates the dipole position, and the yellow tail indicates dipole
magnitude and orientation. (B) Dipole map of interictal spikes following VNS implantation. Dipoles
magnitude and orientation. (B) Dipole map of interictal spikes following VNS implantation. Dipoles
localize to VNS leads in the patient’s neck. Tails have been omitted for clarity. All images are in
localize to VNS leads in the patient’s neck. Tails have been omitted for clarity. All images are in
radiological coordinates,
radiological coordinates, where
where the
the patient’s
patient’s left
left is
is presented
presented on
on the
the right
right side
side of
of each
each figure.
figure.
However, the patient continued to have seizures after the VNS implantation. Because we had
However, the patient continued
subsequently implemented SAM(g2) as to have seizures after
an alternative the VNS
to dipole implantation.
analyses, the patient Because
returnedweforhada
subsequently implemented SAM(g2) as an alternative to dipole analyses,
second MEG scan. SAM(g2) was used to analyze this second MEG recording, as well as the previous the patient returned for a
second MEG scan. SAM(g2) was used to analyze this second MEG recording,
recording performed prior to VNS implantation. Even though the second recording was separated as well as the previous
recording performed
from the first by six yearspriorand
to VNS
the rawimplantation.
MEG sensorEven data though the second
were strongly recordingby
contaminated was separated
artifact from
from the first by six years and the raw MEG sensor data were
the VNS during the second recording, an equivalent right frontal focus was identified on strongly contaminated by artifact
both
from the VNS during the second recording, an equivalent right frontal focus
recordings (Figure 5A), a focus not revealed by dipole analysis previously. This indicates that SAM was identified on both
recordings (Figurelocalize
can reproducibly 5A), a interictal
focus not epileptiform
revealed by dipole
activityanalysis
despite previously.
the presenceThis indicates
of large thatdue
artifacts SAM to
can
the VNS implant. (The dipole localization in the presence of VNS artifact is shown in Figure 4Bdue
reproducibly localize interictal epileptiform activity despite the presence of large artifacts for
to the VNS implant.
comparison. The dipole (Thetails
dipole
have localization
been omitted in the
forpresence
clarity.) of VNS artifact
Examination of istheshown
virtualin electrodes
Figure 4B
for comparison. The dipole tails have been omitted for clarity.) Examination
reconstructed from the SAM(g2) focus demonstrated MEG epileptiform discharges that correlated of the virtual electrodes
reconstructed from the SAM(g2)
with the simultaneously focus scalp
recorded demonstrated
EEG duringMEG epileptiform
the second discharges
recording that correlated
(Figure 5C), with
and,
the simultaneously
importantly, recorded
that lacked the scalp EEG during
high‐amplitude the secondpresent
fluctuations recording in (Figure
the raw5C), MEG and, importantly,
data that were
that lacked
induced by the
thehigh-amplitude
VNS (Figure 5B). fluctuations present inthe
(For comparison, the raw
raw MEGMEG data sensor that were
data induced
prior to VNS by
the VNS (Figure
implantation 5B). (For in
are depicted comparison,
the top part theofraw MEG
Figure 5B.)sensor data prior
Furthermore, to VNS
during the implantation
patient’s second are
depicted in the top part of Figure 5B.) Furthermore, during the patient’s
MEG recording an electrographic seizure was recorded on EEG, with a preceding MEG‐recorded second MEG recording an
electrographic seizure was recorded on EEG, with a preceding MEG-recorded
discharge detected in the virtual electrode (Figure 5D). Given the new localizing information discharge detected in the
virtual
provided electrode
by the(Figure 5D). Given the
MEG recordings, the new localizing
patient informationtoprovided
was determined by the MEG
be a candidate recordings,
for ICEEG and
the patient was determined to be a candidate for ICEEG and possible
possible resection. A subdural grid was placed over the right frontal lobe, covering the resection. A subdural gridfocus
was
placed overon
identified theMEG
right (Figure
frontal lobe,
5F). covering
Seizures the focus identified
captured during the on invasive
MEG (Figure 5F). Seizures
monitoring captured
demonstrated
during the invasive
electrographic onsetmonitoring
(Figure 5E)demonstrated
very close to the electrographic
focus of peak onset (Figure
kurtosis 5E) very
identified byclose to theon
SAM(g2) focus
the
of peak kurtosis identified by SAM(g2) on the MEG recordings (Figure 5F).
MEG recordings (Figure 5F). Following resection, which included the focus identified by SAM(g2), Following resection, which
included
the patient the focus identified
experienced by SAM(g2),
a significant the patient
improvement experienced
in her seizures, aimproving
significantfrom improvement
four to sixinfocal
her
seizures,
seizures with loss of awareness and sometimes evolution to bilateral convulsive seizures monthly to
improving from four to six focal seizures with loss of awareness and sometimes evolution to
bilateral
two to fourconvulsive seizures
focal seizures with monthly
retainedtoawareness
two to four focal seizures
monthly. Her scalpwith EEGretained awareness
recordings monthly.
demonstrated
Her scalpreduced
a greatly EEG recordings
frequency demonstrated
of interictalaepileptiform
greatly reduced frequency of interictal epileptiform activity.
activity.Brain Sci. 2018, 8, 157 12 of 22
Brain Sci. 2018, 8, x FOR PEER REVIEW 12 of 22
Figure 5. (A) SAM(g2) analysis of the MEG recording before VNS implantation (upper panel) and
Figure 5. (A) SAM(g2) analysis of the MEG recording before VNS implantation (upper panel) and after
after VNS implantation (lower panel) identifies a peak of kurtosis at the same anatomical location. (B)
VNS implantation (lower panel) identifies a peak of kurtosis at the same anatomical location. (B) The
The raw MEG recording (black traces, displayed as a butterfly plot) before VNS implantation (upper
raw MEG recording (black traces, displayed as a butterfly plot) before VNS implantation (upper panel)
panel) and after VNS implantation (lower panel). The raw MEG recording after VNS implantation
and after VNS implantation (lower panel). The raw MEG recording after VNS implantation was heavily
was heavily contaminated by artifact from the patient’s VNS, while the virtual electrode signals
contaminated by artifact from the patient’s VNS, while the virtual electrode signals (lower panel, red
(lower panel, red trace) permitted the identification of epileptiform activity (lower panel, asterisks).
trace) permitted the identification of epileptiform activity (lower panel, asterisks). (C) Epileptiform
(C) Epileptiform activity (asterisks) identified within the virtual electrode (red trace) coincided with
activity (asterisks) identified within the virtual electrode (red trace) coincided with poorly localized
poorly localized activity on the simultaneously recorded scalp EEG (black traces). (D) A run of
activity on the activity
epileptiform simultaneously
was seen recorded scalp
in the virtual EEG (black
electrode traces).
(red trace) (D)toAa run
prior of epileptiform
poorly activity
localized discharge
was seen
that wasinobserved
the virtual electrode
on scalp EEG (red trace)
(black prior
traces). (E)to a poorly localized was
Electrocorticography discharge
used tothat was an
identify observed
ictal
onfocus
scalp(red
EEGtrace).
(black
(F)traces). (E) Electrocorticography
Reconstruction of the patient’s brainwas used
from herto identify
own an ictal focus
MRI illustrates (red trace).
the placement
(F)of
Reconstruction of the
the subdural grid patient’s
(blue disks). brain from herthat
The electrode ownwasMRI illustrates
determined tothe placement
overlie the ictaloffocus
the subdural
(green
grid (blue disks). The electrode that was determined to overlie the ictal focus (green
disk, red trace from (E)) colocalized with the peak identified from the MEG recording (red cross). disk, red trace
from (E)) colocalized with the peak identified from the MEG recording (red cross).
3.5. Case 5: MEG-Only Seizure
A 31-year-old woman with spells preceded by visual symptoms of macropsia and micropsia
and olfactory auras presented for further evaluation. Following the auras, the patient often exhibitedBrain Sci. 2018, 8, 157 13 of 22
right eye deviation and tonic flexion of the right upper extremities followed by a loss of awareness
and generalized tonic-clonic events of 2–3 min in length. Afterwards, the patient experienced mild
confusion and was tired for tens of minutes. She also had jerking of her arms and legs during sleep
and the patient’s husband was unable to arouse her. The patient’s auras occurred every few days.
She had 1–2 daytime spells a month, and she estimated that she had several more nighttime spells.
These spells had been captured on routine EEG and during two EMU admissions and no electrographic
change suggestive of seizure was noted. Neither a CT nor an MRI demonstrated any structural brain
abnormalities. Treatment with several antiseizure medicines failed to provide adequate relief, and the
patient had allergic reactions to some of the medicines. Despite the significant concern that her
spells were nonepileptic in nature, given the severity of her events the patient received a diagnostic
MEG scan.
SAM(g2) identified three foci of epileptiform activity during her MEG scan: one focus in the
left posterior temporal/lateral occipital cortex (Figure 6A), and bilateral mesial temporal foci (not
shown). The left posterior temporal/lateral occipital cortical focus was likely responsible for her visual
symptoms, and the bilateral mesial temporal foci were likely responsible for her olfactory auras as
the irritable zones encompassed entorhinal cortex. The irritability of the mesial temporal cortices was
initially supported by bilateral sphenoidal electrodes, which detected interictal epileptiform activity.
Importantly, MEG captured two seizures during the recording which originated within the posterior
temporal/lateral occipital cortex, and neither of these seizures was discernable on EEG (Figure 6B).
Based on the MEG localizing information, ICEEG was performed as part of a presurgical evaluation.
During a recorded seizure, ICEEG demonstrated early epileptiform activity (red channel, Figure 6D)
at electrodes (green) near the SAM(g2) peaks (red crosses, Figure 6C). While ICEEG confirmed
the localization of the three SAM(g2) foci, it also corroborated the MEG finding that the posterior
temporal/lateral occipital focus was indeed the seizure initiator. Interestingly, the morphology of
the ICEEG seizure was very similar to the morphology of the MEG seizure; both started with an
initial spike, then exhibited a period of fast activity, and then evolved into a rhythmic discharge.
Because the patient’s primary focus encompassed part of visual cortex, she decided against surgery to
avoid a potential visual field defect. However, the MEG findings were still useful as they definitively
identified the patient as having epilepsy. The patient is currently being considered for responsive
neurostimulation device (RNS) placement.Brain Sci. 2018, 8, 157 14 of 22
Brain Sci. 2018, 8, x FOR PEER REVIEW 14 of 22
Figure
Figure 6.6. (A)
(A) SAM(g2)
SAM(g2) maps
maps reveal
reveal aa strong
strong focus
focus in
in the
the left
left posterior
posterior temporal/lateral occipital cortex.
temporal/lateral occipital cortex.
(B) A MEG-only electrographic seizure emanating from the left temporal/occipital focus
(B) A MEG‐only electrographic seizure emanating from the left temporal/occipital focus was visible was visible
in
in the
the upper
upper virtual
virtual electrode
electrode(red,
(red,top
toptrace).
trace). The
The patient
patient reported
reported experiencing
experiencing her
her aura
aura during
during this
this
event, which later evolved into a tonic clonic event and necessitated her removal from
event, which later evolved into a tonic clonic event and necessitated her removal from the scanner. the scanner.
The lower virtual electrode (red, bottom trace) corresponds to activity from one of the mesial temporal
The lower virtual electrode (red, bottom trace) corresponds to activity from one of the mesial temporal
foci, but epileptiform signals were not evident during this initial time frame. The simultaneous EEG
foci, but epileptiform signals were not evident during this initial time frame. The simultaneous EEG
(black, upper traces) did not reveal the discharge. (C) During a recorded seizure, electrocorticography
(black, upper traces) did not reveal the discharge. (C) During a recorded seizure, electrocorticography
(ECoG) demonstrates early epileptiform activity (red channel) at an electrode ((D), green) near the
(ECoG) demonstrates early epileptiform activity (red channel) at an electrode ((D), green) near the
SAM(g2) peaks (red crosses). The ECoG positions are approximate because they were reconstructed
SAM(g2) peaks (red crosses). The ECoG positions are approximate because they were reconstructed
based on x-ray images and because the patient experienced swelling after implantation.
based on x‐ray images and because the patient experienced swelling after implantation.
4.
4. MEG
MEG in
in Research
Research
We
We have
have undertaken
undertaken several
several clinical
clinical studies
studies as
as part
part of
of our
our ongoing
ongoing effort
effort to
to improve
improve patient
patient
care. These research studies are possible because of the advances and capabilities developed through
care. These research studies are possible because of the advances and capabilities developed through
use of MEG as a clinical diagnostic tool. As mentioned above, we have explored the uses of SAM to
remove artifacts associated with dental hardware, with biological devices located outside the brainBrain Sci. 2018, 8, 157 15 of 22
use of MEG as a clinical diagnostic tool. As mentioned above, we have explored the uses of SAM to
remove artifacts associated with dental hardware, with biological devices located outside the brain
volume, such as those arising from VNS devices or pacemakers, or even artifacts arising from within
the brain volume such as those associated with CSF shunts. It should be mentioned that alternative
noise reduction techniques such as signal space separation [120] cannot accommodate noise arising
from within the brain itself. The goal of such studies is to enable patients with devices to be the subject
of research studies, allowing for advances to be made in this medically-complex population. We also
have ongoing studies of new MEG language and other functional tests, as well as additional ways to
map seizure networks or seizure foci with MEG/MSI.
In addition to our clinical research, the WFBH MEG lab maintains a vibrant basic and translational
research program. In contrast to fMRI, MEG is a direct measure of brain activity, so use of MEG/MSI
more accurately determines the neurophysiologic activity of brain networks, which underlies the
processing of information. This approach is used to study cognitive processes in multiple pathological
conditions including epilepsy, post-traumatic stress disorder, traumatic brain injury, and by drugs
of abuse. These studies are performed both humans and nonhuman primates. The cognitive and
precognitive tasks developed can be used to probe network behavior in each of these conditions,
and are deployed as translational assays of function in populations as diverse as children, Veterans
with posttraumatic stress disorder (PTSD) and/or traumatic brain injury (TBI) [117,118], normal adults,
and nonhuman primates [119,121]. The goal in coupling MEG with probes of brain function is to
develop a set of metrics that typify a particular disorder, and may eventually lead to better diagnosis
and clinical interventions. These unique research capabilities allow for collaboration, which synergizes
with clinical referrals between institutions.
5. Conclusions
MEG can be a highly utilized tool for both clinical and research use. Clinically, MEG can
provide critical information in often difficult epilepsy cases, where other imaging modalities may be
inconclusive. Our experience suggests that MEG can lead to demonstrably improved patient outcomes,
particularly in the more difficult cases, as highlighted in the selected cases above. The ability to map
eloquent cortex enhances clinical decision making in complex surgical cases. Our utilization of SAM
provides the fine level of detail similar to the signals obtained by ICEEG, without the need for invasive
procedures. Better utilization of MEG/MSI leads to much better localization and lateralization of
seizure foci, more tailored ICEEG coverage, and increased utilization of surgery. Patients who receive
surgery have a much better chance of epilepsy freedom or seizure reduction and experience improved
quality of life, all of which reduce treatment and societal costs [25,34,37]. Research uses of the MEG
have been very successful, by providing information on whole-brain activity at levels of resolution not
possible by any other approach, both in humans and in nonhuman primates. Furthermore, the MEG
represents a translational science success story, as the advanced analyses techniques for MEG and
technical experience have led to improved patient care. As continuing advances in our understanding
of the brain open up new opportunities for diagnosis and treatment of individuals in clinical settings,
and for continued advancements in research settings, MEG is uniquely positioned to provide measures
of whole-brain activity with a combination of high temporal and spatial resolution which are not
available by any other means.
Author Contributions: J.R.S.-K. performed the analysis and wrote the paper. R.J.K. performed a subset of the
analyses and wrote the paper. G.P. provided clinical interpretation. D.W.G. wrote the paper.
Funding: D.W.G. and J.R.S.-K. were supported as part of the Chronic Effects of Neurotrauma Consortium, (CENC)
W81XWH-13-2-0095 (DoD); I01RX002172-01 (VA) and pilot funding from the Department of Neurology, WFBH.
D.W.G. was additionally supported by R01AA016852 and P50AA026117.
Acknowledgments: We would also like to thank Cassie Cornell and Valerie Woodard for their assistance on
this project.
Conflicts of Interest: The authors declare no conflicts of interest.Brain Sci. 2018, 8, 157 16 of 22
References
1. Baillet, S.; Mosher, J.C.; Leahy, R.M. Electromagnetic brain mapping. IEEE Signal Process. Mag. 2001, 18,
14–30. [CrossRef]
2. Caton, R. The Electric Currents of the Brain. BMJ 1875, 2, 278. [CrossRef]
3. Cohen, D. Magnetoencephalography: Detection of the brain’s electrical activity with a superconducting
magnetometer. Science 1972, 175, 664–666. [CrossRef] [PubMed]
4. Burle, B.; Spieser, L.; Roger, C.; Casini, L.; Hasbroucq, T.; Vidal, F. Spatial and temporal resolutions of EEG: Is
it really black and white? A scalp current density view. Int. J. Psychophysiol. 2015, 97, 210–220. [CrossRef]
[PubMed]
5. Hillebrand, A.; Barnes, G.R.; Hubert, P. Beamformer Analysis of MEG Data. In International Review of
Neurobiology; Academic Press: New York, NY, USA, 2005; Volume 68, pp. 149–171, ISBN 0074-7742.
6. Troebinger, L.; Lopez, J.D.; Lutti, A.; Bradbury, D.; Bestmann, S.; Barnes, G. High precision anatomy for MEG.
Neuroimage 2014, 86, 583–591. [CrossRef] [PubMed]
7. Imai, K.; Otsubo, H.; Sell, E.; Mohamed, I.; Ochi, A.; RamachandranNair, R.; Snead, O.C., 3rd. MEG source
estimation from mesio-basal temporal areas in a child with a porencephalic cyst. Acta Neurol. Scand. 2007,
116, 263–267. [CrossRef] [PubMed]
8. Quraan, M.A.; Moses, S.N.; Hung, Y.; Mills, T.; Taylor, M.J. Detection and localization of hippocampal activity
using beamformers with MEG: A detailed investigation using simulations and empirical data. Hum. Brain
Mapp. 2011, 32, 812–827. [CrossRef] [PubMed]
9. Tesche, C.D.; Karhu, J. Somatosensory evoked magnetic fields arising from sources in the human cerebellum.
Brain Res. 1997, 744, 23–31. [CrossRef]
10. Riggs, L.; Moses, S.N.; Bardouille, T.; Herdman, A.T.; Ross, B.; Ryan, J.D. A complementary analytic approach
to examining medial temporal lobe sources using magnetoencephalography. Neuroimage 2009, 45, 627–642.
[CrossRef] [PubMed]
11. Stapleton-Kotloski, J.R.; Kotloski, R.J.; Boggs, J.A.; Popli, G.; O’Donovan, C.A.; Couture, D.E.; Cornell, C.;
Godwin, D. Localization of Interictal Epileptiform Activity Using Magnetoencephalography with Synthetic
Aperture Magnetometry in Patients with a Vagus Nerve Stimulator. Front. Neurol. 2014, 5. [CrossRef]
[PubMed]
12. Cornwell, B.R.; Carver, F.W.; Coppola, R.; Johnson, L.; Alvarez, R.; Grillon, C. Evoked amygdala responses to
negative faces revealed by adaptive MEG beamformers. Brain Res 2008, 1244, 103–112. [CrossRef] [PubMed]
13. Hung, Y.; Smith, M.L.; Bayle, D.J.; Mills, T.; Cheyne, D.; Taylor, M.J. Unattended emotional faces elicit early
lateralized amygdala-frontal and fusiform activations. Neuroimage 2010, 50, 727–733. [CrossRef] [PubMed]
14. Ioannides, A.A.; Corsi-Cabrera, M.; Fenwick, P.B.; del Rio Portilla, Y.; Laskaris, N.A.; Khurshudyan, A.;
Theofilou, D.; Shibata, T.; Uchida, S.; Nakabayashi, T.; et al. MEG tomography of human cortex and brainstem
activity in waking and REM sleep saccades. Cereb. Cortex 2004, 14, 56–72. [CrossRef] [PubMed]
15. Balderston, N.L.; Schultz, D.H.; Baillet, S.; Helmstetter, F.J. How to Detect Amygdala Activity with
Magnetoencephalography using Source Imaging. JoVE 2013, e50212. [CrossRef] [PubMed]
16. Dumas, T.; Dubal, S.; Attal, Y.; Chupin, M.; Jouvent, R.; Morel, S.; George, N. MEG Evidence for Dynamic
Amygdala Modulations by Gaze and Facial Emotions. PLoS ONE 2013, 8, e74145. [CrossRef]
17. Styliadis, C.; Ioannides, A.A.; Bamidis, P.D.; Papadelis, C. Amygdala responses to valence and its interaction
by arousal revealed by MEG. Int. J. Psychophysiol. 2014, 93, 121–133. [CrossRef] [PubMed]
18. Martin, T.; Houck, J.M.; Bish, J.P.; Kičić, D.; Woodruff, C.C.; Moses, S.N.; Lee, D.C.; Tesche, C.D. MEG reveals
different contributions of somatomotor cortex and cerebellum to simple reaction time after temporally
structured cues. Hum. Brain Mapp. 2005, 27, 552–561. [CrossRef] [PubMed]
19. Styliadis, C.; Ioannides, A.A.; Bamidis, P.D.; Papadelis, C. Distinct cerebellar lobules process arousal, valence
and their interaction in parallel following a temporal hierarchy. Neuroimage 2015, 110, 149–161. [CrossRef]
[PubMed]
20. Robinson, S.E.; Vrba, J. Functional neuroimaging by synthetic aperture magnetometry (SAM). Recent
Adv. Biomagn. 1999, 302–305.You can also read