Design and psychometric evaluation of epilepsy-related apathy scale (E-RAS) in adults with epilepsy: a sequential exploratory mixed methods design ...
←
→
Page content transcription
If your browser does not render page correctly, please read the page content below
Shamsalinia et al. BMC Neurology     (2021) 21:121
https://doi.org/10.1186/s12883-021-02139-2

 RESEARCH ARTICLE                                                                                                                                    Open Access

Design and psychometric evaluation of
epilepsy-related apathy scale (E-RAS) in
adults with epilepsy: a sequential
exploratory mixed methods design
Abbas Shamsalinia1, Mozhgan Moradi2, Reza Ebrahimi Rad3, Reza Ghadimi4, Mansoureh Ashghali Farahani5,
Reza Masoudi6, Leili Rabiei7 and Fatemeh Ghaffari1*

  Abstract
  Background: Apathy in patients with epilepsy is associated with a wide range of consequences that reduce the
  patient’s ability to perform social functions and participate in self-care and rehabilitation programs. Therefore,
  apathy is one of the important diagnoses of the healthcare team in the process of caring for epileptic patients and
  its dimensions need to be examined and recognized. Therefore, appropriate instruments with the sociocultural
  milieu of each community should be provided to health care providers. The aim of the present study was to design
  and measure epilepsy–related apathy scale (E-RAS) in adults with epilepsy.
  Methods: This study of sequential exploratory mixed methods design was conducted in Iran from April 2019 to
  December 2019. In the Item generation stage, two inductive (face-to-face and semi-structured interviews with 17
  adult epileptic patients) and deductive (literature review) were used. In item reduction, integration of qualitative
  and literature reviews and scale evaluation were accomplished. For Scale Evaluation, face, content, construct
  [exploratory factor analysis (EFA) (n = 360) and confirmatory factor analysis (CFA) (n = 200)], convergent and
  divergent Validity and reliability (internal consistency and stability) were investigated.
  Results: The results of EFA showed that E-RAS has four factors, namely, motivation; self-regulatory; cognition and
  emotional-effective. These four latent factors accounted for a total of 48.351% of the total variance in the E-RAS
  construct. The results of CFA showed that the 4-factor model of E-RAS has the highest fit with the data. The results
  of convergent and divergent validity showed that the values of composite reliability (CR) and average variance
  extracted (AVE) for the four factors were greater than 0.7 and 0.5, respectively, and the value of AVE for each factor
  was greater than CR. The Cronbach’s alpha coefficient for the whole scale was obtained 0.815. The results of the
  test-retest showed that there was a significant agreement between the test and retest scores (P < 0.001).
  Conclusion: E-RAS is a multidimensional construct consisting of 24 items, and has acceptable validity and reliability
  for the study of epilepsy-related apathy in adult epileptic patients.
  Keywords: Factor analysis, Epilepsy-related apathy, Psychometric, Reliability, Validity

* Correspondence: ghafarifateme@yahoo.com
1
 Nursing Care Research Center, Health Research Institute, Babol University of
Medical Sciences, Babol, Iran
Full list of author information is available at the end of the article

                                         © The Author(s). 2021 Open Access This article is licensed under a Creative Commons Attribution 4.0 International License,
                                         which permits use, sharing, adaptation, distribution and reproduction in any medium or format, as long as you give
                                         appropriate credit to the original author(s) and the source, provide a link to the Creative Commons licence, and indicate if
                                         changes were made. The images or other third party material in this article are included in the article's Creative Commons
                                         licence, unless indicated otherwise in a credit line to the material. If material is not included in the article's Creative Commons
                                         licence and your intended use is not permitted by statutory regulation or exceeds the permitted use, you will need to obtain
                                         permission directly from the copyright holder. To view a copy of this licence, visit http://creativecommons.org/licenses/by/4.0/.
                                         The Creative Commons Public Domain Dedication waiver (http://creativecommons.org/publicdomain/zero/1.0/) applies to the
                                         data made available in this article, unless otherwise stated in a credit line to the data.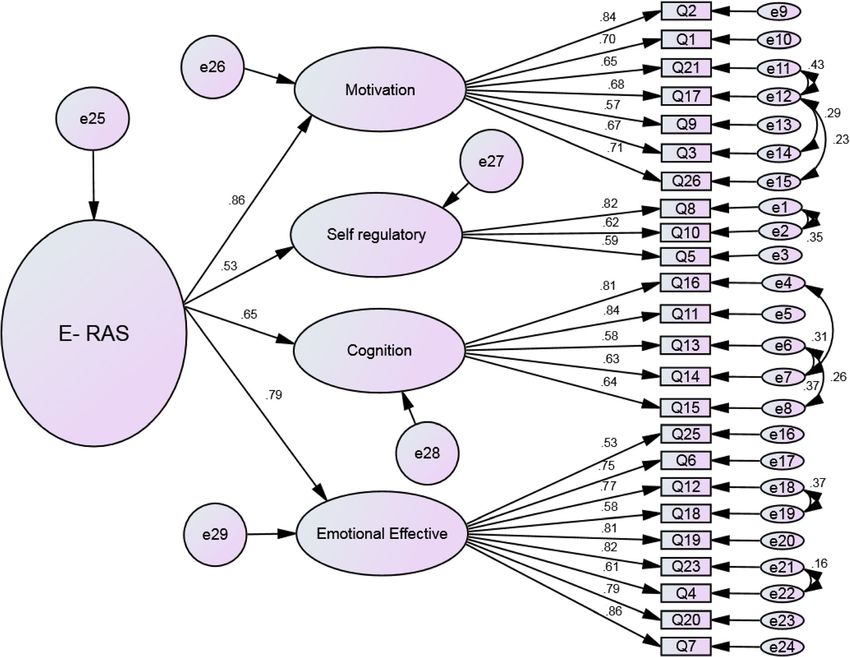
Shamsalinia et al. BMC Neurology   (2021) 21:121                                                                   Page 2 of 17

Highlights                                                       due to decreased level of consciousness, cognitive im-
                                                                 pairment, emotional distress, or direct physiological ef-
   Epilepsy in adults is associated with several                fects of the use of substances such as drugs or
      problems due to its chronic nature and symptoms            medications [9].
      such as seizures and social stigma.                           Other researchers have referred to apathy as the failure
     Disease-related problems may affect the patient’s          to respond to stimuli in the form of inaction. Others
      understanding, feeling, and behaviour toward the           consider apathy to be a disorder in the dimensions of ex-
      disease and lead to behavioural symptoms in the            ecutive cognition or will (i.e., a decrease in human
      patient.                                                   power, potency, or ability to initiate action, or a low de-
     Apathy in patients with epilepsy can have a wide           sire for goal formulation and voluntary behavior) [10,
      range of consequences and should be investigated           11]. In clinical settings, apathy is diagnosed by decreased
      and identified.                                            vitality, decreased self motivation and poor initiative [8],
     To gain information on epilepsy-related apathy, ap-        lack of interest in learning new things or new experi-
      propriate instruments with the socio-cultural milieu       ences, and decreased emotional response to effective
      of each community are needed.                              changes in the course of treatment or failure to respond
     The E-RAS is a valid and reliable instrument for           to positive or negative events [12]. According to Robert
      assessing the motivation; self-regulatory; cognition       et al. (2018), four indicators of apathy in patients with
      and emotional-effective dimensions of the apathy in        brain disorders include 1- Reduced goal-directed behav-
      adults with epilepsy.                                      iour compared to the patient’s previous level of perform-
                                                                 ance, 2. Having two of the following three main
                                                                 symptoms: Behavioral/cognitive symptoms (decreased
Background                                                       level of public activity, less persistence, decreased inter-
Neurological disorders are one of the chronic diseases           est, personal wellbeing), Emotional symptoms (verbal or
that are commonly associated with apathy. In the litera-         physical expressions, impact on others, emotional reac-
ture review, 20–80% of patients with Parkinson’s disease,        tions to the environment, less spontaneous emotions,
progressive supranuclear palsy, stroke [1] and Alzhei-           empathy) and Social symptoms (spontaneous social ini-
mer’s disease [2] were reported to have epilepsy. Apathy         tiative, environmentally stimulated social interaction, re-
in patients with chronic diseases can reduce treatment           lationship with family members, verbal interaction,
response due to reduced adherence to the treatment               homebound) for at least 4 weeks and continuously. 3-
protocol [3]. Therefore (For this reason), apathy due to         Clinically, the first and second indicators lead to disrup-
cognitive and emotional problems associated with the             tion in personal, social, occupational, or other important
disease in chronic disease patients (in patients with            areas of functioning and 4 - Lack of simultaneity of the
chronic diseases) has currently been emphasized [4].             first and second indicators with other clinical disorders
   Epilepsy is a chronic non-communicable brain disease          such as physical disabilities, motor disabilities, substance
that affects about 50 million people worldwide and               use or environmental changes [13].
therefore accounts for one of the leading neurological              Apathy in patients with chronic disease is associated
diseases across the world. The incidence rate of epilepsy        with a wide range of consequences; for example, it can
is reported to be 61.4 per 100,000 population every year         cause the patient not to strive for daily activities and be-
(95% CI; 50.7–74.4) [5]. The prevalence of epilepsy in           come dependent on others or it can reduce the patient’s
Iran is reported to be 5% (95% CI: 2–8) [6]. Self-care be-       quality of life [14]. Apathy increases the care burden of
haviors are the basis for treating and controlling seizures      family caregivers [15] and reduces the patient’s ability to
that can be affected by apathy [7]. Although apathy can          perform social functions and participate in self-care and
be a personality trait, suffering from a chronic illness         rehabilitation programs [12]; the patient’s care-related
may lead to the disease-related apathy due to long-term          needs including physical, mental and social care increase
involvement with it and its treatment process. Apathy            as well [2].
refers to a set of behavioural, emotional, and cognitive            Because apathy is challenging to diagnose due to its
traits such as decreased interest in daily activities, lack of   similar characteristics to depression and requires its own
motivation to engage in creative activities, a tendency to       diagnostic instruments [8], and apathy treatment is often
withdraw early from activities, lack of interest, and di-        complicated and difficult, and the available guidelines
minished emotions [8] various definitions and character-         for therapists (clinical psychologists) are limited, it is ne-
istics have been provided for the concept of apathy.             cessary to take preventive measures to identify the fac-
Some define indifference as a lack of motivation related         tors effective on the treatment process and improve the
to the patient’s level of performance in terms of age and        outcomes of treatment. Apathy is one of the important
culture, provided that lack of motivation in apathy is not       diagnoses of the healthcare team in caring for epileptic
Shamsalinia et al. BMC Neurology (2021) 21:121 Page 3 of 17
patients, and therefore should be examined and charac- Although Geun Seo Jong et al. (2017) used the AES-Self
terized [12, 16, 17]. For this purpose, appropriate instru- (AES-S)-Self (AES-S) version of Marin’s apathy evalu-
ments with each community’s socio-cultural milieu ation scale (AES) to examine the apathy in epileptic pa-
should be provided to healthcare providers [17]. The tients [12], the AVS does not explicitly examine the
available instruments (Table 1) often measure general- apathy related to different aspects of epilepsy. Marin
ized apathy in living with illness or in healthy conditions, et al. (1991) argue that epilepsy in different groups is
and none of them examine the patient’s specific feelings, under environmental, psychological and social influences
thoughts, and behaviors in facing chronic illness. that need to be investigated under the same conditions
Table 1 Available instruments for assessment of apathy
NO Authors Scale Title Item Domain Target group Type
Number
1 Overall and Gorham(1962) [18] Brief Psychiatric 5 Paranoid, Schizophrenic Sub-scale
Rating scale and Depressive
2 Kay et al.(1989) [19] Positive and Negative 8 schizophrenia Sub-scale
Symptoms scale
3 Andreasen(1989) [20] Assessment of Negative 8 schizophrenia Sub-scale
Symptoms
4 Burns etal(1990) [21] Apathy 5 Single factor Huntington and full
Alzheimer disease
5 Marin etal(1991) [22] Apathy Evaluation 18 3 Well elderly, Left full
Scale (AES) hemisphere stroke,
Right hemisphere
stroke, Probable
Alzheimer’s disease
and Major depression
6 Cummings et al.(1994) [23] Neuropsychiatric 9 dementia patients Sub-scale
Inventory
7 Starkstein et al.(1995) [24] Apathy Scale 14 Single factor Alzheimer’s disease full
8 Grace et al.(1999) [25] Frontal Systems 27 frontal lobe brain- Sub-scale
Behaviour scale damaged patients
9 Strauss and Sperry(2002) [26] Dementia Apathy 16 Alzheimer Disease Sub-scale
Interview and Rating
10 Norris and Tate(2002) [27] The Behavioral 20 All groups Sub-scale
Assessment of
Dysexecutive
Syndrome- DEX
11 Robert et al.(2002) [28] Apathy Inventory 3 Emotional blunting, Alzheimer’s disease, Full
Lack of initiative and Parkinson’s disease
Lack of interest and mild cognitive
impairment (caregiver
and patient)
12 Belanger et al.(2002) [29] Key Behavior Change 28 Elderly with memory Sub-scale
Inventory disorder
13 Sockeel etal(2006) [30] The Lille apathy rating 33 reduction in everyday Parkinson’s disease full
scale (LARS) productivity; lack of
interest; lack of initiative;
extinction of novelty
seeking and motivation;
blunting of emotional
responses; lack of
concern; poor social life
and extinction of self-
awareness
14 Radakovic & Abrahams Dimensional Apathy 24 Executive, Emotional neurodegenerative full
(2014) [31] scale (DAS) and Behavioral/ disease and motor
Cognitive Initiation dysfunction such as
Parkinson’s disease
15 Ang etal(2017) [32] Apathy Motivation Index 18 behavioral, social All groups full
and emotionalShamsalinia et al. BMC Neurology (2021) 21:121 Page 4 of 17
[22]. Because social stigma and chronic nature of epi- the short form of the Beck’s Depression Inventory ([38],
lepsy and its symptoms such as seizures may affect the treatment with antiepileptic drugs for at least 1 year, age
patient’s feelings, reactions, and behaviour in dealing of 74–18 years and lack of substance abuse. Exclusion
with the disease and its treatment [33], it is necessary to criteria included unwillingness to continue participation
have a specific instrument assessing apathy in epileptic in the study. Participants were people who could provide
patients. Collins et al. (2006) emphasized the necessity first-hand information to the researcher (young patients
and appropriateness of using mixed methods to assess with epilepsy). Sampling continued until data saturation
existing instruments’ appropriateness or utility [34]. was achieved. Data saturation in qualitative research is
Therefore, this study was conducted to design and psy- obtained when the data are duplicated, and no new code
chometrically analyze epilepsy-related apathy scale (E- is obtained [39]. Finally, 17 semi-structured face-to-face
RAS) in adults with epilepsy. interviews were performed. Individual interviews lasted
40 min on average. Participants were asked the following
Methods questions:
Design and setting
This study of sequential exploratory mixed methods de- 1. Please explain to me the concept of epilepsy-related
sign was conducted in Iran from April 2019 to Decem- apathy.
ber 2019.This study is part of a research project entitled
“ relationship between disease– related fear with apathy In addition, during the interviews, what are the prob-
and nutrition status in adults with epilepsy: a multiple- ing questions such as “what do you mean?”, “If possible,
center study(Cod; IR.MUBABOL.HRI.REC.1398.132)”. please explain more?” or “How did you feel about that?”
Creswell and Plano Clark (2011) recommended using se- were also raised.
quential mixed methods research design for scale devel- At the completion of each interview, participants were
opment and exploratory instrument design. Sequential asked to state something if they felt it as having not
mixed methods research design consists of three phases: talked of throughout the interview and then the inter-
a qualitative phase to define the construct of the instru- viewer spoke of the possibility of further interviews. The
ment; an instrument development phase including item interviews were conducted in the researcher’s room at
generation and revision; and a confirmatory quantitative the request of the participants.
phase for instrument testing [35]. Hinkin et al. (1995)
proposed three phases: item development, scale develop- Trustworthiness of data
ment, and scale evaluation, to create a rigorous scale In this study, Guba and Lincoln’s four criteria, i.e., cred-
[36]. The present study was also conducted in three ibility, dependability, confirmability, and transferability,
phases. were used to ensure the qualitative phase’s accuracy and
precision [40]. To obtain valid data, member checking
Item generation was used to verify the accuracy of the extracted data and
The item generation step is also called question develop- codes. Codes that did not reflect the views of the partici-
ment. Two methods, i.e., inductive and deductive, are pants were modified. In order to conduct peer checking,
used to identify appropriate items [36]. the texts of some of the interviews and extracted codes
and categories were reviewed by three faculty members
First phase in addition to the authors, with 93–95% agreement
In this phase, the inductive method was used. The among the results. The method proposed by Paulite and
method is also known as grouping or classification Hangler was used to calculate the agreement [41]. In
from below. In this phase, the items are generated order to investigate the transferability, the findings were
from qualitative data from direct observations and in- shared with some patients with epilepsy who did not
dividual interviews or focus groups, including the participate in the study, and they confirmed the appro-
target-population [37]. priateness of the findings with their experiences. Max-
imum variation sampling in terms of age, sex, education
Data collection level, marital status, age at onset of epilepsy, duration of
The research settings were the Iranian Epilepsy Associ- of epilepsy, seizure frequency per month, and duration
ation and the neurological clinics of the hospitals affili- of administered antiepileptic drugs (AEDs) intake was
ated to Iran University of Medical Sciences, and the observed.
office of neurologists in the cities of north Iran. In this
phase, sampling was purposeful. Inclusion criteria in- Data analysis
cluded having suffered from epilepsy for at least 1 year, Data analysis was performed using conventional content
depressive disorder (obtaining a score of 4 or less from analysis method based on Graneheim and LundmanShamsalinia et al. BMC Neurology (2021) 21:121 Page 5 of 17
method [42]. For this purpose, first, the data were read categories extracted from each phase of the study were
line by line, and the open codes (which are the words of examined separately. Then all the codes and categories
the participants themselves) were extracted. The ob- of both phases were put together. Duplicate items were
tained codes were compared with previous codes and deleted, and similar items merged. Because the codes
codes that were conceptually similar were assigned to and subcategories were the basis for building items pool,
the same category. Gradually, categories were formed. they were rated more deliberately. They were coded,
The categories were also compared and merged with classified, and labelled over 3 months until the research
each other as needed, or in some cases, one category team reached a consensus. In this part of the study,
was divided into two or more categories, or a code was using the information obtained in the qualitative stage
transferred from one category to another. Eventually, the (interviews), a pool of 29 items was formed. An example
main subcategories were formed. In this study, of the items pool formation process is presented in
MAXQDA/10 software was used to organize and Table 2. In the deductive stage (literature review), 15
categorize the extracted codes. items were obtained and added to the items pool formed
in the qualitative stage. The items were re-checked by
Second phase the research team, the duplicate items were deleted, and
In this phase, the deductive method was used. The avail- similar items were merged. Some items were also modi-
able literature and scales were reviewed and evaluated. fied. The items were edited to be suitable for both low
The deductive method is also known as logical partition- and medium literacy levels. E-RAS was finally included
ing or classification from above [43]. In this phase, the in 31 items for adults with epilepsy.
literature review was conducted in Pubmed, Scopus,
Web of Science and PsycINFO databases using the key-
words fear, apathy, epilepsy-related apathy, adult scale, Scale evaluation
questionnaire, and epilepsy from 10th April until 1st In examining the validity of a research tool, face validity,
June 2019. In total, 30 relevant articles were retrieved content validity, and construct validity need to be evalu-
that had been published from 1962 to 2019. Some of the ated [44].
articles addressed the tools that measured apathy (Table
1), and some were qualitative studies on the concept of
apathy and its dimensions. Face validity
The face validity of E-RAS was investigated in two quan-
Item reduction titative and qualitative ways:
Third phase
Integration of qualitative and literature reviews: provid-
ing the pool of items. First, each interview was coded, Qualitative face validity
and similar codes merged into categories and subcat- Ten adult patients with epilepsy were asked to comment
egories. Then all the texts, including the available tools, on each statement’s level of difficulty, appropriateness,
qualitative studies related to the studied construct were and ambiguity. Corrective comments were applied to the
coded separately, and then the same codes were formed instrument. The time required to respond to the tool
the categories and subcategories. The codes and was also estimated.
Table 2 An example of the process of determining the spheres designed from participants’ experiences
Item Category Participants’ experiences
Criticizing and rejecting me by others reduces Motivation I remember going to school. The time I was 15 years old. My
my motivation to treat my illness. friends didn’t let me join their circles. They rejected me. But I
hoped I would be cured and my illness would be controlled. I
did not lose my spirit. I had motivation for the future of my life.
I actively follow behaviors related to the dimensions of Self-Regulatory It is important for me to try to follow what my doctor tells me.
controlling my illness (such as preventing possible injuries I don’t ride a bicycle and I care not to get injured during a seizure.
during seizures and adhering to the therapeutic regimen).
Cooperation of others, I will explain the conditions/ Cognition When I meet someone like new colleagues or friends who do not
symptoms of my illness to them. know my condition, I tell them about the disease and its symptoms.
I ask them to understand me and help me during the seizure.
Deprivation of social rights due to my illness has made Emotional- Effective I have long been looking for a job, but as soon as the employer
me angry and frustrated me in continuing my social understands that I have epilepsy, he doesn’t give me the job. I wanted
activities. to marry my favorite girl, but my illness prevented her family from
agreeing. I’m nervous and desperate to do something.Shamsalinia et al. BMC Neurology (2021) 21:121 Page 6 of 17
Quantitative face validity relevant = 4). CVI calculation was done by the follow-
The E-RAS face validity was quantified using the Item ing formula:
Impact method. For this purpose, for each of the tool-
bars, a 5-part Likert scale (perfectly important = 5, im- ni
CVI ¼
portant = 4, moderately important = 3, slightly n
important = 2 and not at all important = 1) was consid- where ni represents the number of experts that scored
ered. Then, using the Item Impact method formula, the the item as 3 or 4; and n represents the total number of
quantitative face validity was calculated. experts panel members.
ðImportance ð%Þ Frequency ¼ Item Impact Score Construct validity
Then the mean CVI was calculated for all tool items; the
A score higher than 1.5 was considered acceptable for acceptable value for CVI is equal to and higher than
each item [45]. 0.78 [49, 50]. The validity of the structure was assessed
using exploratory factor analysis (EFA; N = 360) and
Content validity
confirmatory factor analysis (CFA; N = 200).
Two qualitative and quantitative methods are used to
determine the content validity of designed tools [46]. In EFA The internal correlation of the instrument should
this study, the content validity of E-RAS was evaluated be examined before sampling for construct validity in-
by two methods: qualitative and quantitative: vestigation. A pilot study was conducted to calculate it.
After confirming the items’ internal correlation, explora-
Qualitative content validity
tory factor analysis was performed to determine whether
The qualitative content validity of E-RAS was evaluated the tool is a single scale or consists of several domains.
by ten experts (5 Nursing PhD holders, two psycholo- Then, confirmatory factor analysis was performed to
gists, two neurologists and three geriatricians). These in- confirm the extracted dimensions [51]. Before the EFA,
dividuals were asked to comment on the observance of 360 adult patients with epilepsy were enrolled in the
the grammar, the use of appropriate words, the place- study using the Convenience Sampling method. The in-
ment of the items in their proper place, and the appro- clusion and exclusion criteria of the study were the same
priate scoring of the questionnaire [47]. In this study, as those mentioned in the qualitative phase. For this
Content Validity Ratio (CVR) and Content Validity purpose, a cross-sectional study was performed.
Index (CVI) were measured to quantify the content To extract latent factors, exploratory factor analysis
validity: was performed using the principal axis factoring (PAF),
Varimax rotation, and scree diagram. Eigenvalue was
CVR Lawshe’s model (1975) was used to calculate the used more than once to determine the number of the
CVR [48]. In this way, the questionnaire was given to 10 factors extracted [52]. The Kaiser-Meyer-Olkin (KMO)
people (the same people who were invited to collaborate index was used to assess sampling sufficiency, and the
to check the validity of quality content), and they were Bartlett’s test of sphericity was used to investigate the
asked to comment on the necessity of tool items using appropriateness of the factor analysis model. KMO
the 3-point Likert scale (Unnecessary = 1, Useful but un- values between 0.7 and 0.8 are considered acceptable,
necessary = 2 and Necessary = 3). The CVR was then cal- and values between 0.8 and 0.9 excellent [53].
culated using the following formula. The presence of one item in the factor was determined
based on the following formula, which was obtained ap-
ne - ðN=2Þ ne - ðN=2Þ
CVR ¼ CVR ¼ proximately 0.3:
N 2 N 2
pffiffiffiffiffiffiffiffiffiffiffiffiffiffi
CV ¼ 5:152 ðn − 2Þ
The minimum acceptable value for CVR according to
the views of 10 experts is 0.62 [49]. In this formula, CV is the number of factors that can
be extracted and n the sample size of the study [54].
CVI To calculate the CVI, the designed tool was
given to 10 professionals (the same people who were CFA The factors extracted using the first- and second-
invited to collaborate to review the CVR tool) to cal- order CFA (maximum likelihood estimation) and the
culate each item based on the Waltz and Basel con- most common goodness-of-fit indices of modeling
tent index (52) in terms of relevance to a 4-point structural equation were examined. The number of
Likert scale (Irrelevant = 1, Needing major revision = 2, samples in the confirmatory factor analysis was 200
Relevant yet needing revision = 3, and Absolutely people. Fit indices used in the study include: Chi-Shamsalinia et al. BMC Neurology (2021) 21:121 Page 7 of 17
square (χ2), Chi-square/degree-of-freedom ratio (nor- values were taken into account. Another point that was
malized Chi-square CMIN/DF), Adjusted Goodness- considered was the samples’ stability in the test-retest
of-Fit Index (AGFI) > 0.8, Parsimonious Comparative interval in terms of the characteristic in question. In case
Fit Index (PCFI) > 0.50, Comparative Fit Index of any mental, psychological or severe stress, the sample
(CFI) > 0.90, Incremental Fit Index (IFI) > 0.90, Parsi- was excluded from the second phase.
monious Normed Fit Index (PNFI) > 0.50 and Root
Mean Square Error of Approximation (RMSEA) < Standard error of measurement (SEM)
0.05 good [55]. In the second-order CFA, it was as- SEM is one of the indices of measurement accuracy and
sumed that the extracted latent factors were present test reliability. Due to the error in repeating each meas-
in the first-order CFA. Therefore, the second-order urement, there is always some difference [62]. In the
CFA, more general concepts at the secondary and present study, the standard error measurement ( SEM
pffiffiffiffiffiffiffiffiffiffiffiffiffiffiffiffi pffiffiffiffiffiffiffiffiffiffiffiffiffiffiffiffi
higher levels will present. Moreover, the construct ¼ SD 1 − ICC 1 − ICC ) and the minimally
validity was investigated through correlations be- pffiffiffi
detectable change ( MDC ¼ SEM Z score 2Z
tween the construct factors and demographic and pffiffiffi
score 2 ) and the minimally important change
clinical variables.
(MIC = 0.5 × SD ofΔscore × SD ofΔscore) were
calculated.
Convergent and divergent validity
The convergent and divergent validity of the D-RAS
Ceiling effect and floor effect
were evaluated based on the Fornell and Larker (1981)
This effect occurs when more than 15% of the respon-
approach using Average Variance Extracted (AVE),
dents score the highest or lowest attainable score [51].
Maximum Shared Squared Variance (MSV), Average
Shared Square Variance (ASV) and Composite Reliability
Scale scoring
(CR) [56]. Acceptable indicators for convergent validity
In this instrument, the Likert scale was used for
are AVE > 0.5 and for divergent validity are MSV < AVE
responding to the items. In the final version of the ques-
and ASV < AVE [57].
tionnaire, standardization 100 method was used to score
and compare the scores of different subscales of the
Reliability
questionnaire. The following linear transformation for-
In the reliability study, three characteristics internal
mula was used to convert the scores of the subscales
consistency, stability and error measurement were
and the whole questionnaire to a score of 0 to 100 [63].
evaluated:
actual raw score − lowest possible raw score
transformed score ¼ 100
Internal consistency possible raw score range
Internal consistency refers to the homogeneity of vari-
ables within a tool and, in fact, an estimate of the correl-
ation between the variables that make up the structure The normal distribution of data, outliers and missing data
or tool [58]. In this study, the coefficients of Cronbach’s In order to determine whether data distribution is nor-
alpha coefficient, McDonald’s Omega and Theta (θ) mal or not, skewness and kurtosis indices should be cal-
were estimated and values greater than 0.7 were culated. The assumption of normality was investigated
accepted [59]. Then, the CR was calculated using con- on the basis of skewness at ±3 and kurtosis at ±7 [64].
firmatory factor analysis. By replacing Cronbach’s alpha Mardia coefficient (8>) was used to check the normality
coefficient in structural equation modelling, we can of multivariate normality [65]. To investigate the lack of
calculate the construct reliability. The construct reliabil- multivariate outlier data, the d-squared Mahalanobis
ity can be calculated based on the composite reliability index (above 20) was examined (P < 0.001) [66]. The per-
and the Average Variance Extracted (AVE). Construct centage of missing data was evaluated using Multiple
reliability should fulfil CR > 0.7 and AVE > 0.5 [60]. Imputation and then replaced by the average respondent
response [57].
Stability
The D-RAS was administered twice with a two-week Data analysis
interval to 50 adults with epilepsy who fulfilled the cri- For EFA, SPSS 24 software was used, and for CFA,
teria to enter the study. Pearson correlation coefficient AMOS24 software, and for other calculations, EXCEL
and Intraclass Coefficient Correlation (ICC) correlation 2016 software was used. JASP software was also used in
coefficient were then calculated. The ICC of 0.8 or this study to calculate the Omega McDonald’s coeffi-
higher indicates acceptable stability [61]. During the cient. Depending on the type of variable, Pearson’s cor-
test-retest, the amount and management of the missing relation coefficient or point-biserial and polyserialShamsalinia et al. BMC Neurology (2021) 21:121 Page 8 of 17
correlation coefficients were used to investigate the cor- Table 3 Socio-demographic and clinical profiles of the
relation between factors and demographic and clinical participants (N = 560)
variables. Variable N %
Gender
Results Female 306 54.6
The demographic characteristics of the study partici-
Male 254 45.4
pants are presented in Table 3.
Education level
In the qualitative section of the face validity investiga-
tion, the item I disagree with most of the suggestions of Illiterate 57 10.2
my treatment team was deleted. In the quantitative sec- Under high school diploma 265 47.3
tion of the face validity investigation, two items: Looking High school diploma 187 33.4
at my job or education is important to me to the end Academic education 51 9.1
and I have the initiative were deleted due to score of less
Marital status
than 1.5. Therefore, in this section, the 31-item scale
Single 324 57.9
was reduced to a 28-item scale. In the qualitative study
of content validity, two items were modified, and all the Married 204 36.4
proposed changes of experts were made to the appear- Widow/widower 32 5.7
ance of items. The quantitative study of content validity Occupation
was performed by CVR and CVI, with one item “I’m Civil servant 37 6.6
concerned about my illness” was deleted due to a CVR
Laborer 83 14.8
of less than 0.62 and one item “I don’t care about com-
Retired 13 2.3
municating with the treatment team” due to a CVI of
less than 0. 78. Finally, a 26-item scale remained to be Jobless 246 43.9
investigated for its construct validity. The results also Self-employed 60 10.7
showed that KMO obtained 0.728 and Bartlett’s test ob- Housewife 121 21.6
tained 3154,373 (P < 0.001). The scree diagram (Fig. 1) Income level
shows that four factors were extracted from the explora-
Sufficient 98 17.5
tory factor analysis of the E-RAS construct. These four
Approximately sufficient 214 38.2
latent factors accounted for 3.632, 3.162, 2.866, and
1.944 of the Eigenvalue, respectively, collectively explain- Lower than sufficient 248 44.3
ing 48,351% of the total variance in the E-RAS construct. Insurance
The results of the exploratory factor analysis showed Yes 460 82.1
that the two items Although I’m sick, I’m neither happy No 100 17.9
nor sad (I’m something in the middle) and Worrying
Intensity of physical activity
about my illness has overshadowed my emotional reac-
Low 164 29.3
tions were deleted because of having a factor load of less
than 0.4 (Table 4). Moderate 309 55.2
In the first-order factor analysis, the goodness of fit Intense 87 15.5
index (chi-square) was obtained 577.195 (P < 0.001) BMI
(241) χ2. Then, to evaluate the fit of the model, other in- < 19 24 4.3
dicators were examined that all indicators RMSEA =
19–21 68 12.1
0.075, PCFI = 0.64, PNFI = 0.68, AGFI = 0.70, IFI = 0.92
22–23 203 36.3
and CFI = 0.91 confirmed the appropriate fit of the final
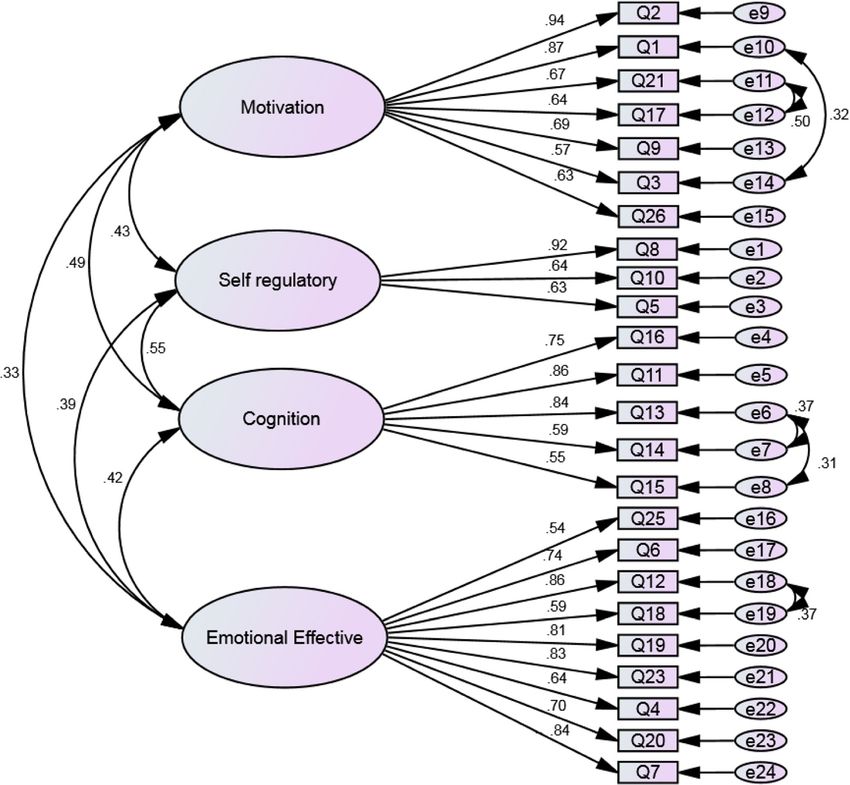
model (Table 5 and Fig. 2). After study of the first-order > 23 265 47.3
confirmatory factor analysis, the E-RAS structural com- Age: mean (SD), Years 38.83 (11.78)
ponents were separately investigated for correlation be- Age at onset of epilepsy: mean (SD), years 7.97 (7.58)
tween the structures and the subscales were identified Seizure frequency: mean (SD), month 2.53 (2.55)
using the structural equation model to measure whether
Duration of epilepsy: mean (SD), years 30.70 (11.49)
the number of components is incorporated into the gen-
Duration of administered antiepileptic 27.46 (11.45)
eral E-RAS concept, The second-order factor analysis drugs (AEDs) intake: mean (SD), years
was also performed. The fit indices of this confirmatory
factor analysis are shown in Table 5 in comparison with
those of the first-order confirmatory factor analysis. Fig-
ure 3 illustrates the structural model and confirmatoryShamsalinia et al. BMC Neurology (2021) 21:121 Page 9 of 17 Fig. 1 Scree plot for the exploratory factor analysis of the E-RAS factor analysis of the E-RAS construct with factor loads Scale scoring with standardized coefficients. The values of the factor The final version of E-RAS consists of 24 items. Scale in- load obtained for all E-RAS items were higher than 0.50 cludes 4 dimensions including motivation (7 items); self- (P < 0.001). regulatory (3 items); cognition (5 items) and emotional- The results show that epilepsy-related indifference in effective (9 items). The items are rated on a 4-part Likert all four factors had a significant relationship with the scale (Almost always = 4, Often = 3, Occasionally = 2, demographic and clinical variables of adults with epi- Hardly Ever = 1). The items 17,18,19,20, 21, 23, 25 and lepsy (Table 6). 26) are scored inversely. The minimum and maximum The results also showed that, in the first-order con- attainable scores on the scale are 45 and 91, respectively. firmatory factor analysis, the AVE of all factors was The responses to each subscale’s items are summed up, greater than 0.5 and the AVE of each factor was greater and then calculated and expressed as percentage for than that of ASV and MSV. The results showed that the each subscale and the entire scale using the linear trans- E-RAS construct had convergent and divergent validity. formation formula. Eventually a score of 0 to 100 is ob- In the second factor analysis, AVE was obtained > 0.5, tained, with a lower score indicating less epilepsy related which confirms the convergent validity (Table 7). apathy in an adult patient with epilepsy.The results The results also showed that the internal stability and showed that the value of Mardia coefficient is 8.54 and CR (> 0.7) of the four extracted factors from the E-RAS its critical ratio is 2.46. Therefore, it can be concluded construct were confirmed (Table 7). The stability (test- that the hypothesis of the multivariate normality with retest) of the scale was investigated using ICC. The proper approximation was fulfilled. mean pre- and post-test scores were 64.46 ± 10.96 and 62.25 ± 6.48, respectively. The ICC was equal to 0.843 Discussion (P < 0.001, 95% CI: 0.773–0.900) (Table 8). The results This study investigated the reliability and validity of the showed that the SEM, MDC and MIC of E-RAS were E-RAS, a new instrument for the assessment of apathy 4567, 12,660 and 5321, respectively (Table 8). in adults with epilepsy. Available tools such as dimen- The results showed that more than 15% of the respon- sional apathy scale measure apathy in healthy and nor- dents obtained the highest or lowest possible score on mal samples [67] and other tools (Table 1) measure E-RAS (Table 9). general apathy in different target groups. Therefore, the
Shamsalinia et al. BMC Neurology      (2021) 21:121                                                                          Page 10 of 17

Table 4 Exploratory factor analysis of the E-RAS (N = 360)
                                                                                                      a
Factor Name             Items                                                               Factor        h2   Eigenvalues   % of variance
                                                                                            loading
Motivation              2. Despite having epilepsy, it’s easy for me to pursue              0.648     0.530       3.632         15.134
                        my interests/aspirations.
                        I’m interested in engaging in NGOs of epileptic patients.           0.609     0.424
                        21. To start any new therapeutic method or recommendation,          0.424     0.391
                        I need a force to motivate me.
                        17. Someone needs to listen to me every day about what              0.594     0.475
                        I can do to manage my illness.
                        9-I need energy to follow up my illness                             0.553     0.609
                        3. Criticizing and rejecting me by others reduces my motivation     0.572     0.355
                        to treat my illness.
                        26. I’m not interested in participating in self-care programs.      0.592     0.384
Self-Regulatory         I assess how to do health-promoting behaviors (such as              0.662     0.547       3.162         13.174
                        exercising, resting adequately, eating healthy foods, avoiding
                        alcohol, smoking and drugs, and avoiding stress).
                        10. I actively follow behaviors related to the dimensions of        0.618     0.574
                        controlling my illness (such as preventing possible injuries
                        during seizures and adhering to the therapeutic regimen).
                        5. I believe I can actively participate in decisions related to     0.563     0.407
                        disease management.
Cognition               11. I understand the importance of self-care.                       0.595     0.638       2.866         11.940
                        13. I know that I have to follow my treatment protocol for          0.794     0.640
                        the rest of my life.
                        14. I understand the symptoms and consequences of my                0.785     0.650
                        illness (such as seizures, occupational, educational, and family
                        problems, and cognitive problems such as time, place, and
                        person, and memory problems).
                        16. I know I need to follow up my treatment on time and             0.484     0.536
                        not delay it.
                        15. To justify and attract the cooperation of others, I will        0.488     0.373
                        explain the conditions/symptoms of my illness to them.
Emotional- Effective    25. I don’t care how others communicate with me.                    0.630     0.475       1.944          8.102
                        6. The new goals and plans I have for the future of my life;        0.791     0.634
                        are not overshadowed by my illness.
                        12. In controlling my illness, I accept the new methods             0.568     0.376
                        offered by the treatment team (such as brain surgery
                        and traditional medicine).
                        18. Deprivation of social rights due to my illness has              0.515     0.376
                        made me angry and frustrated me in continuing my
                        social activities.
                        19. The uncertainty about the future of my illness has made         0.657     0.501
                        precautions related to treatment unimportant to me.
                        23. I don’t get excited when I have positive treatment results.     0.645     0.437
                        4. Although I suffer from distress, I am interested in expressing   0.514     0.354
                        my feelings about my illness.
                        20. My fear of the symptoms of the disease has led me toward        0.653     0.585
                        feeling a kind of alienation.
                        7. I don’t care how others react to my symptoms.                    0.594     0.534
a 2
h : Communalities

researchers preferred not to compare the psychometric                         Recently, researchers have presented mixed methods as
properties of E-RAS with other tools that measure ap-                         the most appropriate method for validation. The use of
athy. The present study was conducted with the aim of                         quantitative and qualitative methods for the generation
designing and evaluating E-RAS by mixed method.                               of items increases the validity of the content [68].
Shamsalinia et al. BMC Neurology (2021) 21:121 Page 11 of 17 Table 5 Fit indices of the first- and second-order confirmatory factor analysis of the E-RAS CFA χ2 df P-value CMIN/df RMSEA PCFI PNFI AGFI IFI CFI First-order after structure modification 577.195 241 < 0.001 2.39 0.075 0.64 0.68 0.70 0.92 0.91 Second-order after structure modification 480.868 239 < 0.001 2.01 0.062 0.72 0.83 0.88 0.95 0.96 Abbreviations: E-RAS epilepsy– related apathy scale, CFA confirmatory factor analysis, CMIN/DF Chi-square/degree-of-freedom ratio, RMSEA Root Mean Square Error of Approximation, PCFI Parsimonious Comparative Fit Index, PNFI Parsimonious Normed Fit Index, AGFI Adjusted Goodness-of-Fit Index, IFI Incremental Fit Index, CFI Comparative Fit Index Fit indices: PNFI, PCFI, AGFI (> 0.5), CFI, IFI (> 0.9), RMSEA (> 0.08), CMIN/DF (> 3 good, > 5 acceptable) Onwuegbuzie et al. (2010) also believe that mixed this study, inductive and deductive methods were used methods can be used to provide content-related evi- to prepare items pool. When the purpose is to design a dence for face validity, item validity and sampling valid- new tool or develop a scale, the validity and reliability of ity, and construct-related evidence for substantive the item generation phase can be increased by using validity, outcome validity, and generalizability [69]. In qualitative and quantitative methods [35, 70]. In the Fig. 2 Structure of E-RAS: modified model of first-order confirmation factor analysis
Shamsalinia et al. BMC Neurology         (2021) 21:121                                                            Page 12 of 17

    Fig. 3 Structure of E-RAS: modified model of second-order confirmatory factor analysis

Table 6 Correlations of the E-RAS subscale with demographic/disease-related variables
Demographic/disease                         E-RAS subscales
Variables
                                            Motivation                 Self-regulatory       Cognition   Emotional-Effective
Age                                         .252**                     .206**                .145**      .153**
Age at onset of epilepsy                    .160**                     −.132*                −.108*      .122*
Seizure frequency                           .173**                     −.129*                −.147*      −.161**
Level of education                          .154*                      .219**                .118**      .134**
Duration of AEDs intake                     .187**                     .277**                .146**      .129*
Genderb                                     −.169**                    −.225**               −.191**     −.261**
Mariagea                                    −.199**                    −.114*                −.104*      −.168**
a
 Polyserial correlations
b
 point-biserial correlation
*p < .05
**p < .01
Shamsalinia et al. BMC Neurology (2021) 21:121 Page 13 of 17
Table 7 Convergent and divergent validity, internal consistency, and constructs reliability of E-RAS
Factor α θ Ω CR First-order Second-order
AVE MSV ASV AVE
Motivation 0.770 0.726 0.728 0.883 0.528 0.240 0.177 0.516
Self-Regulatory 0.763 0.759 0.742 0.780 0.550 0.302 0.213
Cognition 0.792 0.803 0.815 0.846 0.531 0.302 0.239
Emotional-Effective 0.889 0.846 0.840 0.912 0.541 0.176 0.145
Abbreviations: E-RAS epilepsy– related apathy scale, a Cronbach’s alpha coefficients, θ theta coefficient, Ω McDonald omega coefficient, CR construct reliability, AVE
average variance extracted, MSV maximum shared squared variance, ASV average shared squared variance
present study, after preparing the primary instrument, E- indexes of the equations models is the root mean error
RAS psychometric indicators were examined. Designing of approximation (RMSEA). For models with a good fit,
or selecting research instruments requires special atten- this value should be less than 0.09 [77]. Given the value
tion to psychometric criteria [71]. In this study, in order of the RMSEA in the present study, the results indicated
to investigate the face validity of E-RAS, the opinions of that the model was appropriate. The results of explora-
a number of patients with epilepsy were elicited. Target tory and confirmatory factor analyses showed that E-
population’s judgements are extremely important in RAS has four dimensions, namely, motivation, self-
assessing face validity and can make the tool applicable regulatory, cognition, and emotional-effective. Sockeel
to the target group [72]. In this study, two qualitative et al. (2006) stated that apathy has four dimensions in-
and quantitative methods were used to investigate the cluding intellectual curiosity, self-awareness, emotion
content validity. The use of ideas of experts with know- and action initiation [30]. The first dimension is motiv-
ledge and experience in the subject matter can signifi- ation, which explains 15,134% of the total variance. This
cantly help to increase the content validity of new tools dimension addresses issues such as the patient’s motiv-
[73]. Construct validity can be provided by factor ana- ation and interests in disease management. Ang et al.
lysis, testing hypothesis, and convergent and divergent (2017) labelled this dimension as social motivation and
validity [62], all of which were investigated in the present argued that this subscale includes items that examine a
study. In the present study, the Meyer-Kaiser-Olkin person’s motivation to participate in social interactions
(KMO) index was examined before performing the ex- [32]. The second dimension is Self-Regulatory, which ex-
ploratory factor analysis to examine sampling adequacy. plained 13.174% of the variance. The items of this di-
The amount of KMO = 0.8 indicates that the number of mension address the patients’ value-based behaviours
samples is sufficient [74]. Bartlett’s test of sphericity was and efforts aimed to control the situation. This dimen-
also run to investigate the appropriateness of factor ana- sion was labelled in the study of Levy and Dubois
lysis. The significance of this test means that the correl- (2006), quoted by Habib (2004), as auto-activation and
ation matrix between the items is confirmed and the defined as a low desire toward thoughts and related be-
factor analysis model is appropriate [75]. In the present haviours such as lack of motor responsiveness (akinesia)
study, 360 samples were used in the investigation of ex- and lack of discourse [78]. Ang et al. assigned the behav-
ploratory factor analysis and 200 samples in study of ioural activation label to this subscale. Ang argues that
confirmatory factor analysis. Determining the number of this dimension examines things like self-initiate goal-
samples is essential for factor analysis. Costello and Os- directed behaviour (for example, what a person should
borne (2005) consider the best way to determine sample do without the need to others’ reminding). However, in
size to be the ratio of sample to item. They believe that the present study, such variables were assigned to the
it is better to take 10 or 20 samples for each item [76]. motivation dimension. The third dimension is cognition,
According to the obtained results, one of the best fit that explained 11.940% of the variance in the epilepsy-
Table 8 ICC, SEM, MDC and MIC of the E-RAS in adult with epilepsy
Factor Range of score ICC(95% CI) P-value SEM MDC MIC Agreement
Motivation 12–28 0.707(0.614–0.853) < 0.001 2.138 5.926 1.472 positive
Self-Regulatory 6–12 0.798(0.696–0.898) < 0.001 .822 2.279 0.287 positive
Cognition 5–20 0.843(0.762–0.903) < 0.001 1.434 3.975 1.813 positive
Emotional-Effective 17–34 0.750(0.684–0.879) < 0.001 2.305 6.389 2.952 positive
Total 45–91 0.843(0.773–0.900) < 0.001 4.567 12.660 5.321 positive
Abbreviations: ICC intra-class correlation, SEM standard error of measurement, MDC Minimal Detectable Change, MIC minimal important changeShamsalinia et al. BMC Neurology (2021) 21:121 Page 14 of 17 Table 9 Percentage of people who scored the minimum and maximum scores on each subscale and the entire E-RAS scale Factor Range of variations Minimum score (%) Maximum score (%) Motivation 26–10 22.25 57.2 Self-Regulatory 12–3 21.91 54.9 Cognition 20–8 28.16 52.13 Emotional-Effective 30–13 26.35 48 Total 76–48 23.41 53.03 related apathy variable in our study. In fact, this dimen- perception of the threat and increases the patient’s mo- sion includes the items that address the patient’s inabil- tivation to adhere to a treatment protocol and increases ity to understand and recognize the disease, its setting goals to achieve recovery and to reduce the ef- consequences, and treatment protocol. In their study, fects of the disease. Married people seem to be more Levy and Dubois (2006) also considered cognition as motivated to manage themselves because of their social one of the dimensions of apathy. According to Levy, this support. The results also showed that women had less dimension addresses an individual’s inability to manage apathy than men. This may be due to the characteristics cognitive goals and strategies with a negative impact on of women and their sensitivity and paying attention to cognitive and action planning [78]. The fourth dimen- various aspects of health, illness and treatment. In exam- sion is emotional-effective. This dimension was found to ining the reliability of an instrument, three characteris- explain 8.102% variance in the epilepsy-related apathy tics, internal consistency, stability, and error variable. This dimension measures the patient’s emo- measurement are mainly evaluated [44], all three of tional and behavioural reactions in facing others’ reac- which were measured in the present study. The alpha tions to the disease and its symptoms, as well as the coefficient for the whole E-RAS was 0.815. An alpha co- patient’s reaction to the disease and its complications. efficient of 0.7 is often considered as an acceptable This dimension was also found as one of the dimensions threshold for reliability. However, 0.8 and 0.95 are pre- of apathy in the study of Levy and Dubois (2006) [78]. ferred for the psychometric quality of scales [79]. To test Ang et al. (2017) later labelled this dimension as emo- the stability in the present study, the test-retest method tional sensitivity and argued that this subscale included was implemented. Stability of an instrument refers to items that express a person’s positive and negative the repeatability of its administration or its reliability. In emotions, which seem to be similar to emotional the test-retest, which is the most common method to blunting. The results show that epilepsy-related ap- test stability, the test is administered twice to one group athy in all four factors had a significant relationship with a given time interval. To this end, after a period of with the demographic and clinical variables of adult time (usually 2 weeks), the same instrument is adminis- epileptic patients [32]. tered again to the same respondents, and then the cor- The results also showed that there was a positive cor- relation between the test and retest scores is calculated relation between the four E-RAS subscales and older [62]. Efforts were made to make E-RAS items unambigu- age. Reasonable assumption is that aging can be a factor ous and straightforward so that low-literacy participants for reduced motivation and hope in patients with epi- could fill out the instrument. Schinka et al. (2013) argue lepsy to adopt a new plan for the future, and also de- that instrument items should be unambiguous and creased motivation to adhere to treatment. The results straightforward, and should not contradict religious be- also showed a positive correlation between E-RAS sub- liefs, ethnicity, race, economic status, or gender [80]. scales and long-term administration of antiepileptic Some E-RAS items are scored inversely. Inversely scored drugs (AEDs). Prolonged use of AEDs appears to cause items have been proposed as a strategy to prevent re- fatigue and frustration with the treatment protocol. sponse bias in using self-report instruments. Response Therefore, the patient’s motivation to pursue the goals bias refers to a pattern of response that does not reflect of the treatment protocol is reduced. The study of Seo the actual opinions or conditions of the respondents et al. (2017) also showed that there was a statistically sig- [81]. Missing values and their management were import- nificant relationship between the duration of AEDs con- ant throughout the factor analysis and should be re- sumption and apathy [12]. The results of the present ported [75]. In this study, the missing values were study showed that the rate of epilepsy-related apathy re- reported. duced with increasing number of seizures in most sub- scales. Besides that, apathy in females and married Conclusion people is less than other groups. It can be argued that The results of the present study showed that E-RAS was increasing the number of seizures increases the a multidimensional instrument and had acceptable
Shamsalinia et al. BMC Neurology             (2021) 21:121                                                                                          Page 15 of 17

validity and reliability for the study of epilepsy-related                          Authors’ contributions
apathy symptoms in adult epileptic patients. E-RAS is in                            FGh and ASH contributed substantially to the conception of the study and
                                                                                    the interpretation of the data, and drafted the manuscript. RGH, RM, MAF,
fact a measure of motivation and can serve as a valid                               GZG, L R, MM, and RER contributed substantially to the conception of the
predictor of epilepsy recovery. E-RAS may be useful in                              study and the interpretation of the data, and critically revised the
diagnosing the patient’s problems in managing the dis-                              manuscript. FGh and ASH contributed substantially to the conception of the
                                                                                    study and the analysis of the data, and critically revised the manuscript. All
ease, or it may be used as a guide for families dealing                             authors approved the final version of the manuscript.
with functional problems of epileptic patients.
                                                                                    Funding
Implications and limitations                                                        The study was funded by the Babol University of Medical Sciences. The
                                                                                    funder had no role in study design, data collection and analysis, decision to
                                                                                    publish, or preparation of the manuscript.
   In this study, efforts were made to investigate the
       validity of a research instrument through a                                  Availability of data and materials
       psychometric process and by reporting the relevant                           The excel file can be provided on demand. F Gh (corresponding author)
                                                                                    should be contacted by anyone requesting the data.
       details in order to provide appropriate evidence to
       ensure its validity.                                                         Declarations
      In designing E-RAS, it was attempted to reduce the
       number of items so that it would not be boring for                           Ethics approval and consent to participate
                                                                                    The study protocol was approved by the Ethics Committee of Babol
       patients with epilepsy.                                                      University of Medical Sciences (IR.MUBABOL.HRI.REC.1398.132). In the
      E-RAS items were modified by experts and patients                            qualitative phase of the study, the interviews were recorded with the written
       with epilepsy throughout various phases to                                   consent of the participants (patients with epilepsy). In both phases of the
                                                                                    study, the objectives were explained to all the samples and all of them were
       ultimately achieve an instrument that can be                                 given the right to withdraw from the study and all of them were assured
       understood and accepted by samples with different                            that their information would not be disclosed in the research report. The
       levels of literacy and sociocultural status.                                 code was used for the texts of the interviews and the participants were not
                                                                                    named. To ensure confidentiality, participants’ statements were not
      Sampling in the qualitative and quantitative phases                          discussed with other members of the research team.
       were done in different regions of Iran, enabling us to
       reduce the effect of the culture variable on samples’                        Consent for publication
       responses.                                                                   Not applicable.

      In this study, an adequate number of samples were
                                                                                    Competing interests
       included so that the results could represent epilepsy-                       The authors declare that they have no competing interests to disclose.
       related apathy in adults.
      Psychological and environmental variables may be                             Author details
                                                                                    1
                                                                                      Nursing Care Research Center, Health Research Institute, Babol University of
       the primary cause of epilepsy. Therefore, the results                        Medical Sciences, Babol, Iran. 2Iran University of Medical Sciences, Tehran,
       of the present study may be influenced by variables                          Iran. 3Department of Medicine, Islamic Azad University, Tonekabon Branch,
       that have not been taken into account in the current                         Tonekabon, Mazandaran, Iran. 4Social Determinants of Health Research
                                                                                    Center, Health Research Institute, Babol University of Medical Sciences, Babol,
       study.                                                                       Iran. 5Nursing Care Research Center and School of Nursing and Midwifery,
      E-RAS is a self-report instrument and therefore can                          Iran University of Medical Sciences, Tehran, Iran. 6Community-Oriented
                                                                                    Nursing Midwifery Research Center, Department of Adult and Geriatric
       lead to report errors.                                                       Nursing, Nursing and Midwifery School, Shahr-e-Kord University of Medical
                                                                                    Sciences, Shahr-e-Kord, Iran. 7Social Determinants of Health Research Center,
Abbreviations
                                                                                    Shahrekord University of Medical Sciences, Shahrekord, Iran.
E-RAS: Epilepsy– related apathy scale; CVR: Content validity ratio;
CVI: Content validity index; KMO: Kaiser-Meyer-Olkin; EFA: Exploratory factor
                                                                                    Received: 21 August 2020 Accepted: 5 March 2021
analysis; ICC: Intraclass correlation coefficient; PAF: Principal axis factoring;
CMIN/DF: Chi-square degree-of-freedom ratio; χ2: Chi-square; AGFI: Adjusted
Goodness-of-Fit Index; PCFI: Parsimonious Comparative Fit Index;
CFI: Comparative Fit Index; IFI: Incremental Fit Index; PNFI: Parsimonious          References
Normed Fit Index; RMSEA: Root Mean Square Error of Approximation;                   1. Stanton BR, Carson AJ. Apathy: a practical guide for neurologists. Pract
AVE: Average Variance Extracted; MSV: Maximum Shared Squared Variance;                  Neurol. 2016;16(1):42–7.
ASV: Average Shared Squared Variance                                                2. Apostolova LG, Akopyan GG, Partiali N, Steiner CA, Dutton RA, Hayashi KM,
                                                                                        et al. Structural correlates of apathy in Alzheimer’s disease. Dement Geriatr
                                                                                        Cogn Disord. 2007;24(2):91.
Supplementary Information                                                           3. Padala PR, Desouza CV, Almeida S, Shivaswamy V, Ariyarathna K, Rouse L,
The online version contains supplementary material available at https://doi.            et al. The impact of apathy on glycemic control in diabetes: a cross-
org/10.1186/s12883-021-02139-2.                                                         sectional study. Diabet Res Clin Pract. 2008;79(1):37–41.
                                                                                    4. Lee S-J, Kim J-E, Seo J-G, Cho YW, Lee J-J, Moon H-J, et al. Predictors of
 Additional file 1. E-RAS (English language version).                                   quality of life and their interrelations in Korean people with epilepsy: a
                                                                                        MEPSY study. Seizure. 2014;23(9):762–8.
                                                                                    5. Fiest KM, Sauro KM, Wiebe S, Patten SB, Kwon C-S, Dykeman J, et al.
Acknowledgments                                                                         Prevalence and incidence of epilepsy: a systematic review and meta-analysis
We thank all the patients with epilepsy who helped us with this study.                  of international studies. Neurology. 2017;88(3):296–303.
You can also read


