A Bayesian optimization approach for rapidly mapping residual network function in stroke
←
→
Page content transcription
If your browser does not render page correctly, please read the page content below
doi:10.1093/brain/awab109                                                                                     BRAIN 2021: 144; 2120–2134             | 2120

A Bayesian optimization approach for
rapidly mapping residual network function
in stroke

                                                                                                                                                              Downloaded from https://academic.oup.com/brain/article/144/7/2120/6174117 by guest on 20 October 2021
 Romy Lorenz,1,2,3 Michelle Johal,4 Frederic Dick,5 Adam Hampshire,4 Robert Leech6
and Fatemeh Geranmayeh4

Post-stroke cognitive and linguistic impairments are debilitating conditions, with limited therapeutic options.
Domain-general brain networks play an important role in stroke recovery and characterizing their residual func-
tion with functional MRI has the potential to yield biomarkers capable of guiding patient-specific rehabilitation.
However, this is challenging as such detailed characterization requires testing patients on multitudes of cognitive
tasks in the scanner, rendering experimental sessions unfeasibly lengthy. Thus, the current status quo in clinical
neuroimaging research involves testing patients on a very limited number of tasks, in the hope that it will reveal a
useful neuroimaging biomarker for the whole cohort. Given the great heterogeneity among stroke patients and the
volume of possible tasks this approach is unsustainable. Advancing task-based functional MRI biomarker discov-
ery requires a paradigm shift in order to be able to swiftly characterize residual network activity in individual
patients using a diverse range of cognitive tasks.
Here, we overcome this problem by leveraging neuroadaptive Bayesian optimization, an approach combining real-
time functional MRI with machine-learning, by intelligently searching across many tasks, this approach rapidly
maps out patient-specific profiles of residual domain-general network function. We used this technique in a cross-
sectional study with 11 left-hemispheric stroke patients with chronic aphasia (four female, age ± standard devi-
ation: 59 ± 10.9 years) and 14 healthy, age-matched control subjects (eight female, age ± standard deviation:
55.6 ± 6.8 years). To assess intra-subject reliability of the functional profiles obtained, we conducted two independ-
ent runs per subject, for which the algorithm was entirely reinitialized.
Our results demonstrate that this technique is both feasible and robust, yielding reliable patient-specific functional
profiles. Moreover, we show that group-level results are not representative of patient-specific results. Whereas
controls have highly similar profiles, patients show idiosyncratic profiles of network abnormalities that are associ-
ated with behavioural performance.
In summary, our study highlights the importance of moving beyond traditional ‘one-size-fits-all’ approaches
where patients are treated as one group and single tasks are used. Our approach can be extended to diverse brain
networks and combined with brain stimulation or other therapeutics, thereby opening new avenues for precision
medicine targeting a diverse range of neurological and psychiatric conditions.

1 MRC Cognition and Brain Sciences Unit, University of Cambridge, Cambridge CB2 7EF, UK
3 Stanford University, Stanford, CA 94305, USA
3 Max-Planck Institute for Human Cognitive and Brain Sciences, Leipzig 04303, Germany
4 Computational, Cognitive and Clinical Neuroimaging Laboratory, Department of Brain Sciences, Imperial College
  London, London W12 0NN, UK
5 Birkbeck/UCL Centre for Neuroimaging, Birkbeck University, London WC1H 0AP, UK
6 Centre for Neuroimaging Science, King’s College London, London SE5 8AF, UK

Received July 29, 2020. Revised January 4, 2021. Accepted January 4, 2021. Advance access publication March 16, 2021
C The Author(s) (2021). Published by Oxford University Press on behalf of the Guarantors of Brain.
V
This is an Open Access article distributed under the terms of the Creative Commons Attribution License (http://creativecommons.org/licenses/by/4.0/), which
permits unrestricted reuse, distribution, and reproduction in any medium, provided the original work is properly cited.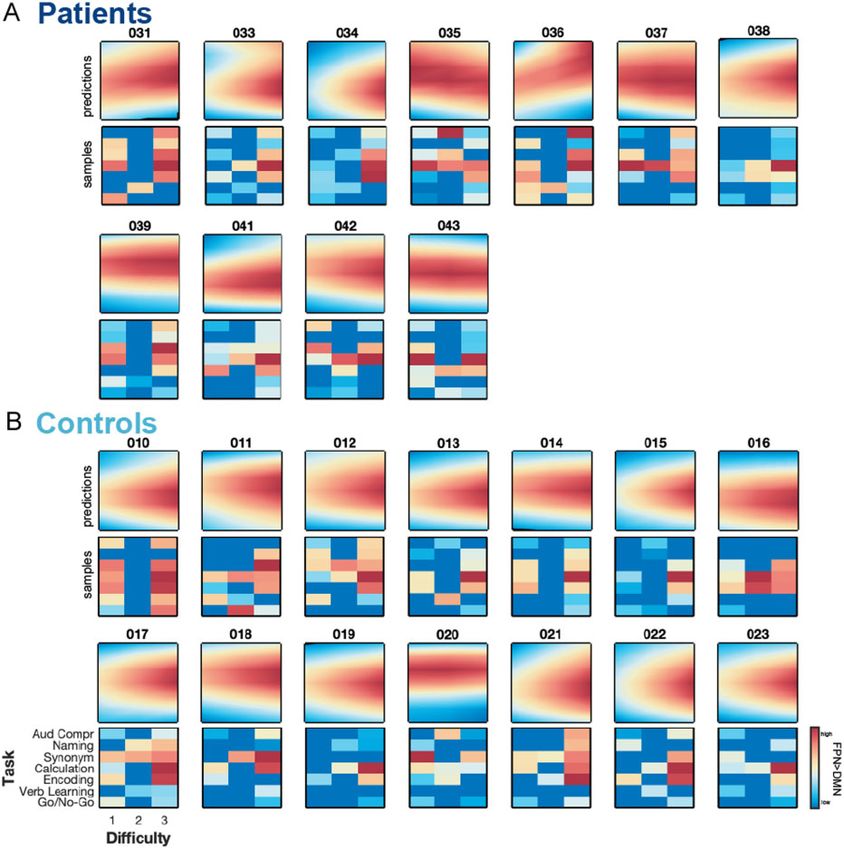
Mapping residual brain network function                                                            BRAIN 2021: 144; 2120–2134          | 2121

Correspondence to: Romy Lorenz
MRC Cognition and Brain Sciences Unit, University of Cambridge
Cambridge CB2 7EF, UK
E-mail: romy.lorenz@mrc-cbu.cam.ac.uk

Correspondence may also be addressed to: Fatemeh Geranmayeh
Computational, Cognitive and Clinical Neuroimaging Laboratory
Department of Brain Sciences, Imperial College London
London W12 0NN, UK
E-mail: fatemeh.geranmayeh00@imperial.ac.uk

Keywords: chronic stroke; cognition; functional neuroimaging; closed-loop; machine learning
Abbreviations: AUROC = area under the receiver operating characteristic curve; DMN = default mode network;
FPN = frontoparietal network; LME = linear mixed effect; MAD = median absolute deviation; MDS = multidimensional

                                                                                                                                                    Downloaded from https://academic.oup.com/brain/article/144/7/2120/6174117 by guest on 20 October 2021
scaling

Introduction                                                              relatively ad hoc manner, in the hope that it will reveal a useful
                                                                          neuroimaging biomarker. Given both the sheer volume of possible
Cognitive and linguistic impairments following brain injury such          tasks and the constraints on patient time, this approach is unsuit-
as stroke are a leading cause of disability, affecting over a quarter     able. Advancing task-based functional MRI biomarker discovery
of a million people in the UK, with numbers expected to increase          requires a paradigm shift in order to be able to swiftly characterize
dramatically given the ageing population.1 Current therapeutic            residual brain network activity in individual patients using a di-
strategies are only of limited success2–4; therefore, there is a need     verse range of cognitive tasks.
for developing biomarkers that guide clinical prognosis as well as            Development of real-time analysis of functional MRI data in
rehabilitation strategies. Given the great heterogeneity in stroke        combination with machine-learning techniques (i.e. Bayesian opti-
patients, functional MRI is a promising method for discovering            mization)21,22 provides an unprecedented opportunity to derive
candidate biomarkers capable of distinguishing patient subgroups          subject-specific profiles of brain network function across multiple
as it allows non-invasive mapping of brain (dys)function.                 tasks in a short period of time,23 making it feasible to use in
However, to date, no functional MRI-derived biomarker is ready to         patients. Neuroadaptive Bayesian optimization can efficiently
be used in clinical trials for predicting recovery of cognitive or lan-   search a large task space (Fig. 1A) to identify the optimal set of cog-
guage function.5                                                          nitive tasks that maximize a predefined target brain network state
    Nonetheless, functional MRI measures during task execution            in each individual (Fig. 1B). The approach’s efficiency stems from
(‘task-based functional MRI’) show promising potential as clinical-       the intelligent search procedure: based on real-time analysis of the
ly relevant biomarkers and thereby represent a developmental pri-         functional MRI data, the machine-learning algorithm decides
ority.5 A major challenge for any progress in this direction is           which task to test next in that particular subject; this is substan-
selecting the optimal task (or battery of tasks) to be administered       tially faster than exhaustively testing all possible tasks while far
to patients in the magnetic resonance scanner.                            more informative than selecting tasks at random.
    This is because neither cognitive nor language-related func-              Here, we apply neuroadaptive Bayesian optimization to a
tions can be readily mapped to distinct, single brain regions but ra-     cohort of left-hemispheric stroke patients with chronic aphasia
ther emerge through the interaction between domain-specific (e.g.         and demonstrate the approach’s potential for assessing patient-
motor, auditory, language networks) and domain-general brain              specific residual brain network function effectively and rapidly.
systems. Highly domain-general brain networks, such as fronto-            Specifically, for each patient we identify the set of cognitive tasks
parietal networks (FPNs) support processes including attention,           that maximally dissociate two domain-general networks, namely
working memory and learning (or re-acquisition) of a skill.6–9            increasing activation in the bilateral FPN, and decreasing activa-
Damage to domain-general brain networks may explain why cog-              tion in the default mode network (DMN) (Fig. 1C). The choice of
nitive impairments seen in stroke are distributed across diverse          this target brain state (i.e. FPN 4 DMN) was motivated by evidence
cognitive processes.10,11 We have previously shown that intact do-        suggesting that the difference in activity between these two
main-general brain regions are critical in recovery of language           networks was associated with language performance in left-hemi-
function following aphasic stroke12–15 in keeping with studies con-       spheric, aphasic stroke patients.15 For comparison, the method
firming their role in recovery of motor deficits16 and the learning       was also run in age-matched, healthy control subjects.
of pseudo language.17 This builds a convincing case for their po-
tential as a prognostic biomarker.
    However, characterizing residual function of domain-general
networks in stroke patients is challenging because there is not a         Materials and methods
single, optimal task that is unique to probe each network; instead
                                                                          Participants
it involves quantifying network activation across many different
cognitive tasks. However, such prolonged, multi-task neuroimag-           The study was approved by the National Research Ethics Service
ing protocols18–20 are practically unfeasible in patients. Thus, the      Committee. We recruited 14 patients with left hemisphere infarcts,
current status quo for clinical neuroimaging studies typically            over the age of 40 [mean age ± standard deviation (SD):
involves selecting a specific task (or small subset of tasks) in a        58.57 ± 10.43 years, mean post-stroke time ± SD: 5.52 ± 3.25 years]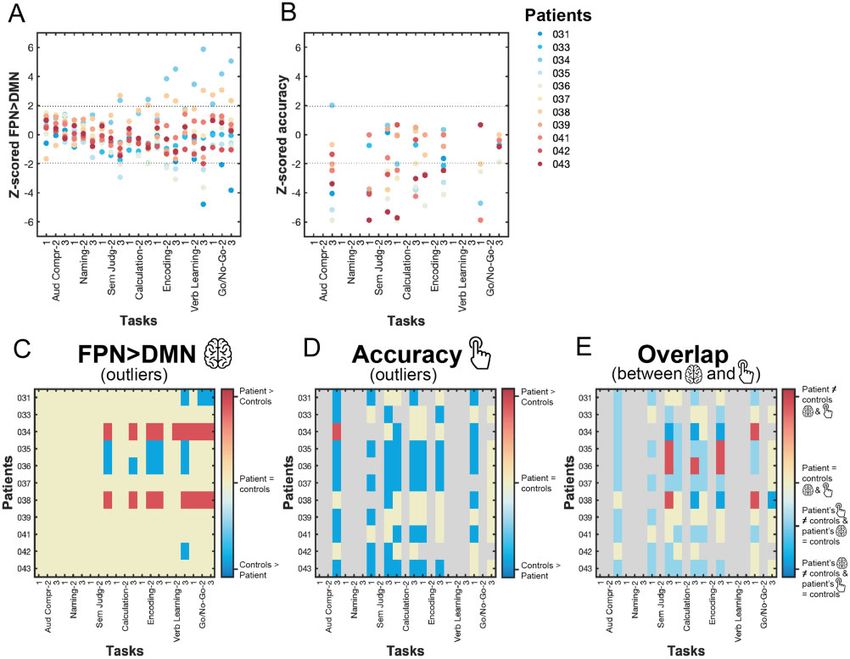
2122 | BRAIN 2021: 144; 2120–2134 R. Lorenz et al.
Downloaded from https://academic.oup.com/brain/article/144/7/2120/6174117 by guest on 20 October 2021
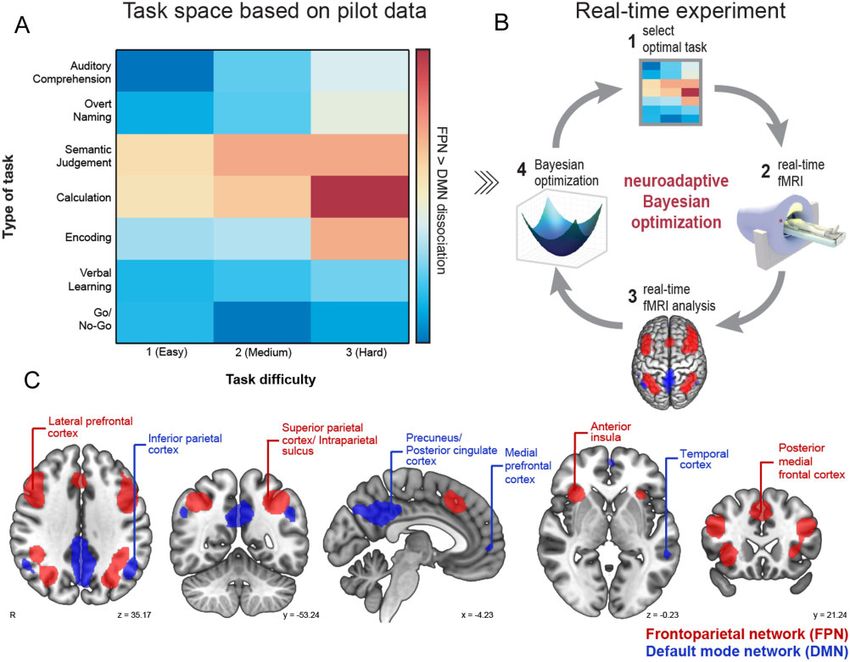
Figure 1 Overview of methodology. (A) We designed a 2D task space with one dimension corresponding to type of task (seven tasks), and the other to
task difficulty (three levels). Tasks were ordered using pilot data collected separately in healthy volunteers. (B) This task space was searched through
in our real-time experiment using neuroadaptive Bayesian optimization. The aim was to quickly identify a subject-specific set of tasks that maximize
the difference in activity between the FPN and DMN. The method operates in the following steps: (1) the algorithm chooses a specific task difficulty
combination from the task space; (2) functional MRI data are collected while the subject is performing the task; (3) the difference in brain level activa-
tion between FPN (red) and DMN (blue) is computed in real-time; and (4) the result from step 3 is used to update the algorithm and subsequently
choose the next task difficulty combination to be presented to the subject in the next iteration [back to step (1) in a closed-loop fashion]. (C) FPN
and DMN network masks derived from Yeo et al.24
and premorbid fluency in English. Patients with a previous history Task space
of a stroke resulting in aphasia or other neurological illness, or
Neuroadaptive Bayesian optimization is substantially more effi-
concurrent use of psychoactive drugs, were not eligible to enter
cient than randomly or exhaustively sampling all tasks because of
the study. Table 1 contains further patient details. As controls, we
two desirable properties: (i) it incorporates prior information about
recruited 15 fluent English-speaking healthy participants over the
how the cognitive tasks relate to each other; and (ii) guides its own
age of 40 (mean age ± SD: 56.73 ± 6.76 years), with no history of any
sampling trajectory across tasks in an intelligent manner. The in-
neurological/psychiatric disorders. Sample size was informed by
tuition behind (i) is that tasks that are expected to elicit a similar
our previous studies using this technique in healthy individu-
brain response are grouped together in the search space, while dis-
als.21,25 All participants were right-handed, had normal or cor- similar tasks are grouped further apart. Thanks to this prior infor-
rected-to-normal vision and normal adult hearing. For three mation, the algorithm does not need to test all possible tasks in
patients (Patients 030, 032 and 040) the second run was discarded the real-time optimization run, but instead can sample a few,
due to distress and/or fatigue, causing us to stop the run prema- highly informative tasks and then make predictions for all other
turely. These three patients were excluded from all analyses as tasks by applying a non-linear spatial regression (i.e. Gaussian pro-
we could not guarantee the validity of the patient-specific cess regression). This allows the algorithm to swiftly identify
results. In addition, from the 15 control subjects, one had to be regions in the task space that are suboptimal for its optimization
excluded as auditory stimuli could not be heard due to a aim (i.e. maximizing FPN 4 DMN dissociation) and instead focus
technical issue. Thus, all analyses are based on 11 patients (four on sampling tasks from the optimal regions in the search space.
female, mean age ± SD: 59 ± 10.9 years, mean post-stroke time ± Here, we designed a 2D task space (Fig. 1A) with one dimension
SD: 5.95 ± 3.42 years) and 14 controls (eight female, mean age ± corresponding to ‘type of task’ and the other to ‘task difficulty’. We
SD: 55.6 ± 6.8 years). selected three cognitive tasks (Calculation, Go/No-Go, and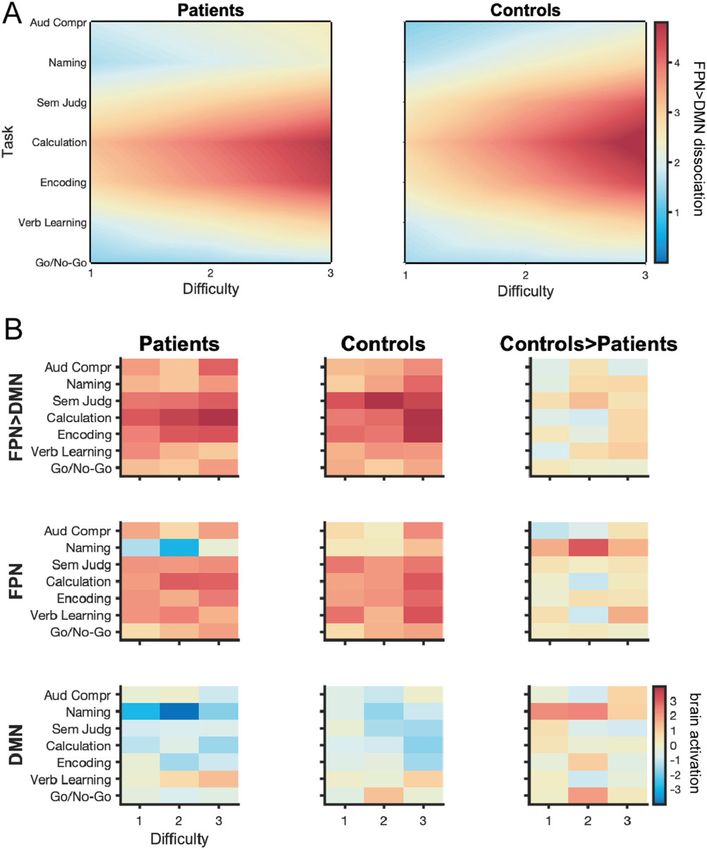
Mapping residual brain network function                                                                                        BRAIN 2021: 144; 2120–2134                   | 2123

Table 1 Details of stroke patients

     Patient ID       Age         Sex        Time since               Lesion territory                                            Lesion volume, in cm3              CAT score
                                             stroke, in years                                                                                                       Average/sum

     030a             69        Female               6                SC, WM, C (FC, IC, PC, TC)                                             22.28                    119.0/10.82
     031              58        Male                11.5              C (left PC, TC), SC, WM                                                12.63                    511.0/46.45
     032a             50        Male                 1.5              C (left FC, TC, PC), SC regions                                        17.81                    307.0/27.91
     033              63        Male                 5.5              C (left FC, PC), WM                                                     4.87                    595.0/54.09
     034              40        Male                 0.5              Left SC WM                                                              0.31                    805.0/73.18
     035              60        Female               5.5              SC WM, SC GM, C (FC, TC, PC, OFC)                                      21.64                    424.5/38.59
     036              78        Female               6.5              SC WM, C (FC, TC, PC, OFC)                                              1.96                    573.5/52.14
     037              52        Female               4.5              C (left FC, IC, PC), WM                                                14.34                    558.0/50.73
     038              55        Male                 5                C (FC, IC, PC), WM, SC GM                                               4.58                    702.5/63.86
     039              72        Male                 2.5              C (left FC, IC, PC), WM, SC GM                                          8.55                    627.5/57.05
     040a             52        Male                 4.25             C (left FC, IC, WM), right-sided pontine WM                             3.33                    612.5/55.68

                                                                                                                                                                                         Downloaded from https://academic.oup.com/brain/article/144/7/2120/6174117 by guest on 20 October 2021
     041              67        Female               4.5              C (left PC)                                                             1.52                    590.5/53.68
     042              47        Male                12                C (left FC, IC and PC)                                                 21.42                    422.5/38.41
     043              57        Male                 7.5              C (left FC, IC, PC), WM, SC GM                                         12.76                    179.0/16.27

C = cortical; FC = frontal cortex; GM = grey matter; IC = insular cortex; OFC = orbitofrontal cortex; PC = parietal cortex; SC = subcortical; TC = temporal cortex; WM = white matter.
a
    Patients were excluded from all analyses as their second run had to be prematurely stopped.

Encoding) and four language tasks (Overt Naming, Auditory                                          Subjects were trained on all tasks outside of the scanner and
Comprehension, Semantic Judgement, and Verbal Learning). Tasks                                 informed about the real-time nature of the functional MRI experi-
were chosen according to three criteria: (i) their ability to assess                           ment, but no information was given on the actual aim of the study
core cognitive and language deficits; (ii) their predicted probability                         or which parameters would be adapted in real-time. The investiga-
of recruiting the FPN24; and (iii) the ability for patients to perform                         tor was not blinded due to the complexity of data acquisition and
and understand these tasks.26 Whereas in our past work, we have                                the need to ensure that real-time optimization was functioning.
aligned tasks in the search space based on a previous meta-ana-
lysis,23 here we added three tasks (Auditory Comprehension,
Semantic Judgement and Verbal Learning) that were not part of
                                                                                               Real-time functional MRI
this meta-analysis. Therefore, to order these seven tasks along the                            Masks of the bilateral target brain networks (Fig. 1C) were based on
task dimension, we used pilot data collected prior to the real-time                            a meta-analysis reported in Yeo et al.24 The FPN (i.e. component
study in eight healthy volunteers (three female, mean age ± SD:                                09) covered the superior parietal cortex, intraparietal sulcus, lat-
27.9 ± 8.3 years). Each task had three levels of difficulty with                               eral prefrontal cortex, anterior insula and the posterior medial
increasing complexity and cognitive demand, resulting in a total                               frontal cortex. The DMN (i.e. component 10) spanned the posterior
of 21 different task  difficulty conditions the algorithm could                               cingulate cortex, precuneus, inferior parietal cortex, temporal cor-
choose from. All tasks and their variants are briefly described in                             tex and medial prefrontal cortex. Thresholded (z 4 2) and binar-
the Supplementary material and depicted in Supplementary Fig. 1.                               ized maps of the two brain networks were used as mask.
                                                                                                    Real-time functional MRI data analyses were performed on a
                                                                                               conventional Mac mini system; in the Supplementary material we
Experimental procedure                                                                         detail hardware specifications as well as the exact procedure for
All patients underwent the Comprehensive Aphasia Test (CAT)                                    turning on the real-time export of functional MRI data on the
outside of the scanner27 before the experiment began                                           Siemens magnetic resonance console computer. For real-time func-
(Supplementary material).                                                                      tional MRI preprocessing (Supplementary material), we followed a
    For the real-time functional MRI study, each participant under-                            similar procedure as described in our previous work.23 For comput-
went two, independent optimization runs for which the algorithm                                ing the FPN 4 DMN dissociation target measure, after each task
was reinitialized and thus blind to any data collected in the sub-                             block, we ran incremental general linear models (GLMs)
ject’s previous run or any previous subjects, allowing us to assess                            (Supplementary material) on the preprocessed time courses of each
the intra-subject reliability of results.                                                      network separately and then computed the difference between the
    Each run was initiated randomly (i.e. first four task blocks were                          estimates of all task regressors of interest (i.e. beta coefficients) for
selected randomly from across the task space). The start of each                               the FPN and DMN (i.e. FPN 4 DMN). The resulting contrast values
run was synced with the onset of the first repetition time and each                            were then entered into the Bayesian optimization algorithm. An ini-
new task block was initiated by a repetition time. The first task                              tial burn-in phase of four randomly selected tasks was employed,
commenced after 10 repetition times to allow for T1 equilibration                              i.e. the first GLM was only computed at the end of the fourth block
effects. Each run lasted 14.2 min and consisted of 16 task block                               after which the closed-loop experiment commenced.
iterations; each iteration consisted of a task block lasting 34 s fol-
lowed by 10 s rest block (white fixation cross on black background).
Preceding each task block, participants received a brief instruction
                                                                                               Bayesian optimization
(5 s) about the task they would need to perform in the upcoming                                Bayesian optimization is a two-stage procedure that repeats itera-
block followed by a short 3 s rest period (black background). For                              tively in a closed loop. The first stage is the data modelling stage,
five patients, task instructions had to be provided orally via a                               in which the algorithm uses all available samples obtained from
microphone because of reading impairments. Participants used                                   real-time functional MRI (i.e. FPN 4 DMN contrast values) up to
their left hand to indicate answers via a keypad.                                              that iteration to predict the subject’s brain response across the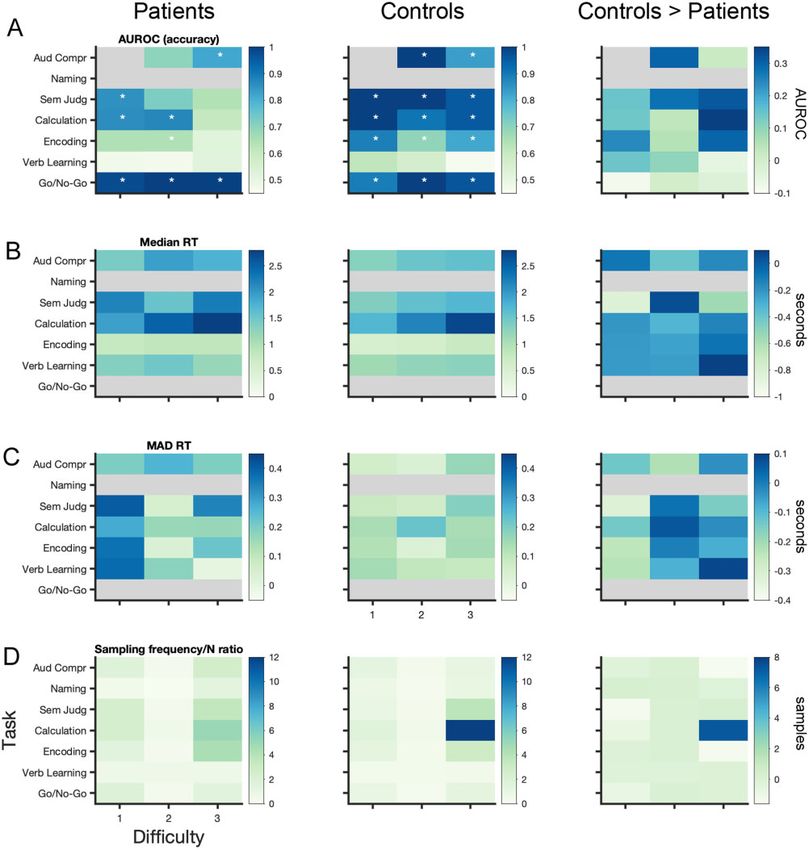
2124    | BRAIN 2021: 144; 2120–2134                                                                                        R. Lorenz et al.

entire task space using Gaussian process regression.28–30 For the       permutations) where we shuffled the FPN 4 DMN values and cor-
Gaussian process, we used a zero mean function and the squared          responding task indices of the second run and then refitted the
exponential kernel.29 The second stage is the guided search stage,      Gaussian process (hyperparameters were kept identical to the
in which an acquisition function is used to propose the task the        real-time scenario) for these shuffled values before computing the
subject will need to perform in the next iteration. Here we used        correlation coefficient between the two runs. For each permuta-
the upper-confidence bound (GP-UCB) acquisition function31 that         tion, we then computed the median of the Fisher z-transformed
favours the selection of points with high predicted mean value (i.e.    correlation values for each group separately. To correct for mul-
optimal tasks), but equally prefers points with high variance (i.e.     tiple comparisons, at each permutation we only kept the max-
tasks worth exploring). Algorithmic details for both stages are pro-    imum of both median values (i.e. ‘max statistic’ method34). The
vided in the Supplementary material.                                    median of our true empirically obtained (Fisher z-transformed)
                                                                        correlation coefficients for patients and controls were then com-
                                                                        pared to the generated null distribution of maximum median val-
Statistical analysis                                                    ues with a one-sided alpha-level set at 0.05.
Behavioural accuracy

                                                                                                                                                  Downloaded from https://academic.oup.com/brain/article/144/7/2120/6174117 by guest on 20 October 2021
To assess if patients understood task instructions and performed
                                                                        Assessing dissimilarity of patients’ functional profiles
higher than chance-level on the various tasks, we computed the
non-parametric effect size measure AUROC (area under the re-            To assess if patients’ individual profiles were more dissimilar
ceiver operating characteristic curve32) between the true empirical     among each other than those of control subjects, we computed a
distribution of patients’ accuracy and the generated chance-level       dissimilarity matrix, i.e. the correlation distance (1 – Spearman’s
distribution for each task condition separately. The empirical dis-     rank correlation35) of each subject’s functional profile to all other
tribution was computed for each task condition separately based         subjects’ individual profiles. As intra-subject reliability was high
on the mean accuracy (i.e. not AUROC) of each patient. The              across runs (see the ‘Results’ section), we derived each individual’s
chance-level distribution was derived by randomly shuffling (1000       functional profile by collapsing both runs (i.e. fitting Gaussian pro-
permutations) the trial sequence and the corresponding behav-           cess on all observations from both runs) with the aim of deriving a
ioural responses of each task block, and then re-computing the          more precise depiction of individuals’ functional profiles. Next, we
mean accuracy of each patient; this procedure had the advantage         computed the correlation distance among all subjects. For statis-
of preserving the overall response pattern of each patient. AUROC       tical inference, we performed permutation testing (10 000 permu-
is one of the few existing non-parametric measures of effect size;      tations) where we replicated this procedure but randomly shuffled
thereby robust to violations of normality and advised for small         the label for patients and controls. We then computed two differ-
samples. AUROC can be understood as a measure of overlap be-            ent t-statistics: (i) the difference between controls’ dissimilarity
tween two distributions and its values range from 0 to 1; a value at    (i.e. upper triangle of control-by-control matrix) and patients’ dis-
0.5 indicates that there is no effect found between the two distri-     similarity (i.e. upper triangle of patient-by-patient matrix); and (ii)
butions (i.e. chance-level performance). Significance was deter-        the difference between controls-by-patient dissimilarity (i.e. full
mined when the one-sided lower 95% confidence bound                     matrix) and patients’ dissimilarity. Finally, our true empirical t-
(computed via bootstrapping) was higher than an AUROC of 0.5.           statistics were then compared to the generated null distribution of
                                                                        t-values with a one-sided alpha-level set at 0.05. To visualize dis-
                                                                        similarity among patients’ functional profiles in 2D, we used clas-
Linear mixed-effect models of behavioural and functional
                                                                        sical multidimensional scaling (MDS), a dimensionality reduction
MRI data
                                                                        technique that preserves between-subject distances. The tech-
To assess behavioural performance, functional MRI measures, in-         nique can be understood analogous to a principal component ana-
scanner motion and the relationship between functional MRI and          lysis on the dissimilarity matrix, yielding the main principal
behaviour, linear mixed-effect (LME) modelling was performed. As        coordinates through the data (i.e. eigenvectors); with the first one
difficulty level 2 was sampled far fewer times than difficulty levels   explaining most variance (i.e. largest eigenvalue). For subject
1 and 3 (Fig. 2D), results from difficulty levels 1 and 2 were merged   clustering, we performed density-based spatial clustering of appli-
for these analyses. Several LME models were specified (by model-        cations with noise (DBSCAN) on the dissimilarity matrix, an ap-
ling interactions among fixed effects and adding/dropping random        proach that groups together points that are closely packed
effects) for each dependent variable and model selection (details       together (i.e. points with many neighbours) and marks outliers
in the Supplementary material) was performed using simulated            that lie alone in low-density regions (i.e. with nearest neighbours
likelihood ratio tests (with 500 replications for simulation and        too far). Cluster results were visualized in 2D MDS space. For com-
alpha level set at 0.05); each winning model as well as the number      parison to MDS, we also computed the t-distributed stochastic
of competitor models tested against are listed in Table 2. For non-     neighbour embedding (t-SNE) on the dissimilarity matrix, a non-
significant group-level LME results (i.e. no difference found be-       linear dimensionality reduction technique that better preserves
tween patients and controls), we performed equivalence testing          the global structure of the data at the cost of between-subject
using the two one-sided tests procedure33 with an alpha set to 0.05     distances.
to confirm the absence of a group-level effect. For this, the small-         To explore whether the dissimilarity among subjects’ function-
est effect size of interest was determined for each research ques-      al profiles may be associated with performance, we took subjects’
tion based on objective criteria and/or heuristics, which are           weightings on the first principal coordinate of MDS and correlated
detailed in the Supplementary material.                                 (i.e. Pearson r) it with in-scanner and out-of-scanner behaviour.
                                                                        Since each subject had performed different tasks and difficulty lev-
                                                                        els in the scanner, mean in-scanner accuracy could not be
Intra-subject reliability
                                                                        obtained by simple averaging across all tasks; thus, we obtained
To assess intra-subject reliability of our results, we computed the     mean in-scanner accuracy by extracting each subject’s random
Spearman’s rank correlation of the Bayesian predictions across the      intercept from an LME (LME A1 in Table 2 but excluding the ‘Group’
task space between the two runs of each subject. For statistical in-    regressor). For out-of-scanner performance, we used the sum of
ference, we performed permutation testing (i.e. 10 000                  patients’ CAT score. To account for patients’ lesion volume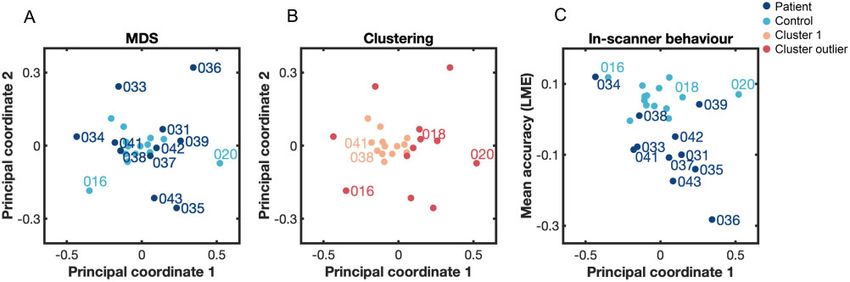
Mapping residual brain network function                                                                   BRAIN 2021: 144; 2120–2134            | 2125

                                                                                                                                                             Downloaded from https://academic.oup.com/brain/article/144/7/2120/6174117 by guest on 20 October 2021
Figure 2 Behavioural results and sampling behaviour of algorithm. All results are listed for patients (left), controls (middle) and the difference between
controls and patients (right). (A) AUROC is a non-parametric effect size measure indicating the difference between the empirically obtained accuracy
and chance level for each task. Stars indicate the tasks for which patients and controls performed significantly above chance; significance was deter-
mined using a one-sided 95% lower confidence bound criterium of AUROC 4 0.5, exact values are listed in Supplementary Table 1. (B) Median and (C)
variance of reaction time [i.e. median absolute deviation (MAD)] across task space. (D) Given the algorithm’s subject-specific trajectories through the
task space, each subject is exposed to a different set of tasks; here, we show the absolute number of times each task was selected by the algorithm—
corrected for the difference in sample size n across both groups (i.e. n = 11 for patients and n = 14 for control subjects). Grey shaded areas correspond
to NaN: accuracy could not be computed for the Naming task (as no chance level could be determined) and the first difficulty level of the Auditory
Comprehension (as it was always correct); reaction time could not be computed in the Naming task (as no button press was required) and for Go/No-
Go tasks (as subjects were instructed to inhibit a response). See Supplementary material for details on each task.

(Table 1), we also ran partial correlation analyses. For statistical in-        Normalizing patient’s FPN 4 DMN contrast and accuracy
ference of these correlation analyses, we performed permutation
                                                                                to control distribution
testing (50 000 permutations, one-sided alpha-level set at 0.05) by
randomly shuffling subjects’ labels; P-values obtained from this                To assess if there was a single task, for which all patients showed a
were corrected for multiple comparisons using the false-discov-                 different FPN 4 DMN dissociation than controls, we ‘normalized’ the
ery-rate (FDR)36 with an alpha-level set at 0.05.                               Bayesian prediction of each patient’s FPN 4 DMN contrast value to
2126 | BRAIN 2021: 144; 2120–2134 R. Lorenz et al.
Table 2 LME models for each dependent variable
Domain Dependent variable ‘Winner’ LME model (based on Won competi-
simulated likelihood ratio tests) tions/#
competitor
models
Behaviour (A1) Accuracy (% of correct trials Acc 1 + Group 3 Run + Group 3 Difficulty + 7/7
within a task block) (1 j Subject) + (1 j Task) + (1 j Subject: Task)
(A2) Reaction times (correct Rt 1 + Group 3 Run + Group 3 Difficulty + (1 j Subject) 3/3
responses) + (1 j Task) + (1 j Subject: Task)
(A3) MAD accuracy MAD_Acc 1 + Group 3 Run + Group 3 Difficulty + Run 4/4
3 Difficulty + Group 3 Run 3 Difficulty + (1 j Task) +
(1jSubject)
(A4) MAD reaction times MAD_Rt 1 + Group 3 Difficulty + (1jSubject) 7/7
Functional MRI (B1) FPN 4 DMN betas_FPN4DMN 1 + Run + Group 3 Task + Group 3 11/11
Downloaded from https://academic.oup.com/brain/article/144/7/2120/6174117 by guest on 20 October 2021
Difficulty + Task 3 Difficulty + Group: Task: Difficulty
+ (1 j Subject) + (1 j Subject: Task) + (1 j Repetition)
(B2) FPN betas_FPN 1 + Run + Group 3 Task + Group 3 5/5
Difficulty + Task 3 Difficulty + Group: Task: Difficulty
+
(1 j Subject)
(B3) DMN betas_DMN 1 + Group 3 Run + Group 3 Difficulty + 4/5
(1 j Subject) + (1 j Task) + (1 j Subject: Task)
(B4) MAD FPN 4 DMN MAD_betas_FPN4DMN 1 + Group 3 Run + (1 j Subject) 7/7
(B5) In-scanner motion (mean FD 1 + Group + Run + (1 j Subject) 2/2
framewise displacement FD)
Functional MRI (C1) Accuracy and FPN4DMN Acc 1 + Run + Difficulty + Group 3 betas_FPN4DMN + 18/19
and (1 j Subject) + (1 j Task) + (1 j Repetition) + (1 j Subject:
behaviour Task)
(C2) Reaction time and FPN 4 DMN Rt 1 + Run + Difficulty + Group 3 betas_FPN 4 DMN + 13
(1 j Subject) + (1 j Task) + (1 j Subject: Task)
Acc = accuracy; FD = framewise displacement; Rt = reaction time. For LMEs, categorical regressors were ‘Group’ (patients or controls), ‘Subject’ (our 25 different subjects), ‘Run’ (run
1 or run 2) and ‘Task’ (the seven tasks). Ordinal regressors were ‘Difficulty’ (difficulty level 1 or 3), and ‘Repetition’ (corresponding to the number of times the same task has been
sampled before in an individual subject’s run). For the LME formulas in the third column of the table, fixed effects are indicated in bold and random effects are in italics.
the control distribution using the modified z-score.37 This analysis scan, indicating their understanding of the various task instruc-
was done for each task and difficulty level separately. This procedure tions. For this, non-parametric effect size measures (i.e. AUROC)
was also performed for patient’s accuracy. However, in contrast to were computed for each task condition separately, comparing pa-
FPN 4 DMN contrast values for which we had Bayesian predictions tient group-level accuracy with chance level. Results (Fig. 2A, left,
for each task (i.e. Gaussian process regression across the task space), corresponding lower confidence bound is listed in Supplementary
we did not have each subject’s accuracy for each task condition due Table 1) demonstrate that patients performed above chance for all
to the sampling behaviour of the algorithm (Fig. 2D). Therefore, we difficulty levels of the Go/No-Go task, for the easiest and medium
limited the normalization of patient’s accuracy to task conditions for levels of the Calculation task and the easiest level of the Semantic
which we had enough controls (i.e. n 4 7) to accurately compute the Judgement task. Further, they performed above chance for the
control distribution. A patient’s FPN 4 DMN contrast value and accur- most difficult level of the Auditory Comprehension task but not for
acy for a particular task was marked significantly different (i.e. ‘out- the medium level—which can likely be explained due to unequal
lier’) when the absolute modified z-score was 41.96. This was a sampling across both conditions (i.e. the medium level was only
liberal criterion, as commonly a threshold of 3.5 is used. sampled three times) (Fig. 2D). With respect to the Encoding task,
patients performed only above chance for the medium difficulty
level. Given that the lower confidence bound for the easiest level
Data availability
of the Encoding task is 0.4903 (Supplementary Table 1) and AUROC
All Python, bash and MATLAB code for implementing neuroadap- values are 40.6 for the easiest and medium level of this task, it
tive Bayesian optimization is available from GitHub http://github. can be assumed that patients performed higher than chance—
com/romylorenz/strokeLoop. For Gaussian process regression, we even though it appears that this task is among the harder tasks
use a Python implementation from http://github.com/SheffieldML/ tested. Patients did not perform above chance for any level of the
GPy. Relevant data are available from the authors upon reasonable Verbal Learning task, however, neither did controls (Fig. 2A, mid-
request. dle), illustrating that this task was ill-designed (Supplementary
material).
Results
Patients perform less accurately, slower and more
Most patients are able to perform multiple tasks in variably than control subjects
the scanner
As expected, overall patients performed less accurately [LME A1 (all
Given the nature of the clinical populations, we first assessed LME formulas listed in Table 2): Group t(746) = –4.13, P 5 0.001] and
whether patients performed above chance while undergoing the slower than controls [LME A2: Group t(643) = 5.53, P 5 0.001].Mapping residual brain network function BRAIN 2021: 144; 2120–2134 | 2127
Median and variance [i.e. median absolute deviation (MAD)] of reac- the DMN. Collapsed over all tasks, more difficult task conditions
tion times for each task are shown in Fig. 2B and C, respectively. result in a larger FPN-DMN dissociation in both groups [LME B1:
Both patients and controls performed less accurately [LME A1: Difficulty t(771) = 2.95, P = 0.003]. The sampling behaviour of the
Difficulty t(746) = –4.76, P 5 0.001] and more slowly for more difficult Bayesian optimization algorithm clearly confirms these results
task levels [LME A2: Difficulty t(643) = 9.84, P 5 0.001]. Patients’ ac- (Fig. 2D): for both patients and controls the most difficult condi-
curacy was not differentially affected by task difficulty compared to tions of these three tasks were most often selected by the algo-
controls [i.e. no interaction effect, LME A1: Group Difficulty t(746) rithm, indicating that the algorithm identified them as optimal for
= –0.95, P 5 0.034]; in fact, they showed a gentler increment in re- maximizing the FPN 4 DMN dissociation. While this is very pro-
sponse time with increasing difficulty compared to controls [LME nounced for controls, in particular for difficulty level 3 of the
A2: Group Difficulty t(643) = –2.58, P = 0.01]. This is due to Calculation task (Fig. 2D, middle); it is worth noting that the algo-
patients’ considerably slower responses for the easiest task condi- rithms sampled much more exhaustively across the task space for
tions relative to controls (Fig. 2B) and that there was a set time win- patients (Fig. 2D, left), potentially indicating more diversity in the
dow to respond for each task (Supplementary material). Whereas optima identified among individual patients. Surprisingly, at the
reaction times decreased from the first to second run in both groups group level, it appears that patients do not show a qualitatively
[LME A2: Run t(643) = –2.98, P = 0.003], only patients were more ac- different FPN-DMN dissociation pattern across the task space com-
Downloaded from https://academic.oup.com/brain/article/144/7/2120/6174117 by guest on 20 October 2021
curate in the second run [LME A1: Group Run t(746) = 2.04, P = pared to controls (Fig. 3A), but only seem to have a slightly dimin-
0.042]. Overall, we found that patients showed a trend to vary more ished FPN 4 DMN dissociation for the Semantic Judgement,
in their within-task accuracy than controls [LME A3: Group t(100) = Calculation and Encoding tasks. These qualitative observations are
1.97, P = 0.052]. Accuracy in both groups varied more in the second also confirmed statistically: patients have a significantly lower
versus first run [LME A3: Run t(100) = 2.33, P = 0.022], but this effect FPN 4 DMN dissociation only for the Semantic Judgement task in-
seems to be driven by an increase in variance for controls rather dependent of difficulty level [LME B1: Group Semantic
than patients [LME A3: Group Run t(100) = –3.05, P = 0.003], but Judgement t(771) = –2.11, P = 0.035]. This finding may be because
only for the easiest task conditions [LME A3: Group Run the patients’ group-level results are not a good representation of
Difficulty t(100) = 2.42, P = 0.017] as across both groups, variability of individual results of patients and is in line with the algorithm’s
accuracy decreased in the second run for the most difficult task con- sampling behaviour. To understand the relative contribution of
ditions [LME A3: Run Difficulty t(100) = –2.47, P = 0.015]. We found both the FPN and DMN to these results we also computed the acti-
no effects of within-task variance in reaction times (LME A4) be- vation values for both networks across the task space separately
tween both groups; however, we could not confirm that the group- (Fig. 3B, second and third row). While we found no significant dif-
level effect was statistically equivalent [t(16.33) = 0.48, P = 0.319], ference among the groups for either the FPN [LME B2: Group t(771)
given symmetric equivalence bounds of ± 0.6 in standardized = 1.28, P = 0.20] or DMN [LME B3: Group t(794) = 0.61, P = 0.54],
Cohen’s d effect size. equivalence testing could not confirm the group-level effect to be
statistically equivalent for either network [tFPN(10.56) = 0.76, P =
0.23, tDMN(10.4) = 0.35, P = 0.36, given symmetric equivalence
Neuroadaptive Bayesian optimization is a feasible
bounds of ±0.5 in Cohen’s d effect size]. Finally, we were interested
technique for patients in understanding the relationship between neural and behavioural
With respect to our real-time optimization results of FPN 4 measures. While higher FPN 4 DMN contrast values were associ-
DMN dissociation across the task space, we found significant ated with longer reaction times across both groups [LME C2: FPN 4
intra-subject reliability for controls (median Spearman rho ± SD: DMN t(643) = 2.47, P = 0.014], there was no significant difference of
0.91 ± 0.18, P 5 0.001) and patients (0.71 ± 0.45, P 5 0.001). When this effect in patients [LME C2: Group FPN 4 DMN t(643) = –1.31,
investigating how FPN 4 DMN contrast values varied for the same P = 0.19]. Further, we did not find any association between the
task within an individual (i.e. when sampled multiple times), we magnitude of FPN 4 DMN dissociation and accuracy across [LME
found no significant difference in variance between patients and C1: FPN 4 DMN t(746) = 1.59, P = 0.11] or between the two groups
controls [LME B4: Group t(108) = 0.88, P = 0.38], this effect was stat- [LME C1: Group FPN 4 DMN t(746) = 0.35, P = 0.73].
istically equivalent [t(14.71) = 1.99, P = 0.033], given symmetric
equivalence bounds of ±1.2 in Cohen’s d effect size. With respect to
in-scanner motion, we found that both patients and controls Patients show unique profiles of network
moved significantly more in the second run [LME B5: Run t(47) = dysfunction
2.34, P = 0.023] but that there was no significant difference be- Motivated by these findings, we wanted to understand if indeed
tween the two groups [LME B5: Group t(47) = 1.74, P = 0.088]. We patients’ real-time optimization results are more diverse than con-
confirmed this effect to be statistically equivalent [t(14.42) = 2.425, trol subjects’ results. When looking at the dissimilarity of FPN 4
P = 0.015] given symmetric equivalence bounds of ±0.2 mm on a DMN profiles between patients (Fig. 4A), we found that they are
raw scale. This indicates robustness of our obtained results and significantly more dissimilar (t = –5.02, P = 0.038) than the FPN 4
demonstrates the feasibility of the approach to achieve reliable DMN profiles between controls (Fig. 4B). Interestingly, we found
results in patient populations. that patients’ individual profiles are even more dissimilar amongst
each other than when comparing them with controls’ individual
Semantic judgement, calculation and encoding profiles (t = –2.77, P = 0.024). These statistically significant findings
demonstrate that patients really have unique profiles of network
tasks maximally dissociate FPN from DMN in
dysfunction but that some patients look more similar to controls
patients and controls than to other patients.
Group-level Bayesian predictions across the task space (i.e. To visualize this finding, we plotted the dissimilarity among
Gaussian process regression on all observations) are shown in Fig. each patient’s and control’s individual profile in 2D using MDS, a
3A for patients and controls, separately. We found that across both dimensionality reduction technique that preserves between-sub-
groups, Semantic Judgement [LME B1: t(771) = 5.11, P 5 0.001], ject distances. In Fig. 5A, we see that the majority of controls clus-
Calculation [LME B1: t(771) = 4.39, P 5 0.001] and Encoding [LME B1: ter together (turquoise) at the centre, indicating high similarity
t(771) = 4.26, P 5 0.001] tasks maximally differentiate the FPN from between their functional profiles. In contrast, most patients (dark2128 | BRAIN 2021: 144; 2120–2134 R. Lorenz et al.
Downloaded from https://academic.oup.com/brain/article/144/7/2120/6174117 by guest on 20 October 2021
Figure 3 Group-level results of real-time optimization. (A) Group-level Bayesian predictions across task space (i.e. Gaussian process regression across
all observations) for patients (left) and controls (right) indicate no qualitative difference in the FPN 4 DMN dissociation pattern across the task space
between both groups. Patients appear to only have a slightly diminished FPN 4 DMN dissociation for the Semantic Judgement, Calculation and
Encoding tasks. (B) To confirm that Bayesian predictions in A are not driven by the specific hyperparameters of the Gaussian process regression
(Supplementary material), we also plotted the median of the FPN 4 DMN dissociation values across the task space for both groups (top row). We con-
firm that the Bayesian predictions appropriately capture the underlying distribution of median FPN 4 DMN contrast values. To understand the rela-
tive contribution of the FPN and DMN to our group-level results, we plot the brain activation values for those networks separately (second and third
rows).Mapping residual brain network function BRAIN 2021: 144; 2120–2134 | 2129
blue) lie dispersed around the cluster of healthy controls and show t-SNE (Supplementary Fig. 2) pulls apart patients mainly based on
higher variance along the first and second principal coordinates, their respective weighting on the first principal coordinate derived
indicating higher dissimilarity among their functional profiles. from MDS (Patients 033, 034, 038 and 041 have a negative weight-
Using density-based clustering, we confirm these descriptive ing and are thus grouped closer to controls with t-SNE, while the
results: we identified one dense cluster (peach) consisting of most other patients have a positive weighting). Thus, to explore whether
controls (11 of 14 controls, exceptions are: Subjects 016, 018 and variance on the MDS’s first principal coordinate (that explains
020) and two patients (Patients 038 and 041) while all other nine most of the variance of dissimilarity between all subjects’ func-
patients were classified as ‘outliers’ (red) of the cluster by the algo- tional profiles) also relates to variance in behaviour, we simply cor-
rithm (Fig. 5B). We found that subjects within the cluster perform relate the weighting on the first coordinate with in-scanner
significantly better [t(23) = 2.17, P = 0.018] and less variable [two- behaviour (i.e. mean accuracy across all tasks performed in the
sample F-test for equal variance, F(12,11) = 0.17, P = 0.002] on tasks scanner—derived by extracting each subject’s random intercept
in the scanner than subjects around the cluster; given that most from an LME, see ‘Materials and methods’ section). We found a sig-
controls fall into this cluster, these results are expected. nificant negative relationship (r = –0.40, n = 25, P = 0.025/PFDR =
For comparison, we used another dimensionality reduction 0.042) across patients and controls; however, this seems to be
technique (t-SNE) that better preserves the global structure of mainly driven by patients given the controls’ performance
Downloaded from https://academic.oup.com/brain/article/144/7/2120/6174117 by guest on 20 October 2021
the data at the cost of between-subject distances. We notice that approaching ceiling level (Fig. 5C). When only taking patients into
Figure 4 Subject-level results of real-time optimization. (A) Patients show unique profiles of FPN 4 DMN dissociation across the task space. (B) It can
be clearly seen that in contrast to patients, controls show a striking similarity of FPN 4 DMN dissociation across the task space. For all patients and
controls, we show the Bayesian predictions of FPN 4 DMN dissociation (i.e. Gaussian process regression based on subject-specific samples) across
the entire task space (top row) as well as all samples individually (bottom row); when a task was sampled multiple times within a subject, we computed
the median across those samples. We can see that Bayesian predictions appropriately capture the underlying distribution of samples.2130 | BRAIN 2021: 144; 2120–2134 R. Lorenz et al.
Downloaded from https://academic.oup.com/brain/article/144/7/2120/6174117 by guest on 20 October 2021
Figure 5 Dissimilarity of functional profiles and association with behaviour. (A) Visualization of dissimilarity (1 – Spearman) among each patient’s
(dark blue) and control’s (turquoise) individual profile in 2D using MDS, a non-linear dimensionality reduction technique that preserves between-sub-
ject distances. Most controls (except Patients 016 and 020) cluster together at the centre, indicating high similarity between their functional profiles.
In contrast, most patients lie dispersed around the cluster of healthy controls, indicating higher dissimilarity among their functional profiles. (B)
Density-based clustering of dissimilarity (1 – Spearman) among each subject’s functional profile confirms descriptive results from A: we identified
one dense cluster (peach) consisting of almost all controls (except Subjects 016, 018, 020) and two patients (Patients 038 and 041). All other nine
patients were classified as ‘outliers’ of the cluster by the algorithm (red). (C) Subject’s variance on the first principal coordinate of MDS is significantly
associated with their behavioural performance in the scanner (r = –0.40, n = 25, P = 0.025/PFDR = 0.042). As controls (turquoise) perform almost at ceil-
ing, this association is mainly driven by patients (dark blue) and persists even when accounting for patients’ respective lesion volume (r = –0.63,
n = 11).
account, this negative association is strengthened (r = –0.64, separating patients from controls. Moreover, different tasks iden-
n = 11, P = 0.016/PFDR = 0.042) and remains high even when tify different subsets of patients that display a significantly altered
accounting for patients’ lesion volume (r = –0.63, n = 11, P = 0.025/ FPN 4 DMN dissociation compared to controls; this implies that
PFDR = 0.042). We found a moderate, yet not significant negative re- task selection has an impact on which patients are labelled as
lationship with out-of-scanner behaviour (Supplementary Fig. 3). deviating from controls. Importantly, when comparing these
Given our low sample size, we want to caution against the overin- results to patients’ individual task performance (Fig. 6B and D), we
terpretation of these correlation results. found little resemblance (Fig. 6E): most patients performed signifi-
Since our patient cohort suffers from chronic post-stroke apha- cantly worse than controls on those tasks while showing no sig-
sia, we would expect that the result of patients exhibiting unique nificant difference in their FPN 4 DMN dissociation (light blue).
patterns of network function is not specific for the dissociation of Taken together, these results highlight the challenge in a priori
the FPN from the DMN but also holds for functional networks clas- selecting an appropriate task and difficulty level, questioning the
sically associated with language. We tested this assumption and potential of univariate task-based functional MRI biomarkers for
could replicate our results for a left-lateralized language network. predicting stroke recovery.
By contrast, when focusing our analysis on a network associated
with motor function, we found no significant difference between
patients and controls (Supplementary material). These supporting
Discussion
analyses illustrate our method’s specificity in characterizing indi- In this study, we applied neuroadaptive Bayesian optimization for
vidual level network dysfunction in patients. the first time to a cohort of patients with the aim of rapidly search-
ing through a variety of different cognitive and language-related
task conditions in order to obtain patient-specific functional pro-
The potential of single tasks for biomarker discovery is
files of residual domain-general network function.
limited
At the group level, patients qualitatively did not show an altered
Functional profiles derived from real-time optimization seem suit- FPN 4 DMN dissociation pattern across tasks compared to controls.
able for inferring patient’s current behavioural capabilities, indi- For both patients and controls, more difficult task conditions and
cating their potential usefulness as clinically relevant biomarkers particularly the Semantic Judgement, Calculation and Encoding
for predicting stroke recovery (i.e. a patient’s future functional cap- tasks maximally dissociated the FPN from the DMN. This is in line
acity). To further understand if these multivariate profiles of re- with our previous work, showing that the Calculation and Encoding
sidual network function yield additional information to that can tasks as well as increased task demands strongly recruit this par-
be obtained from univariate analyses of individual task activa- ticular FPN in healthy volunteers.23,24 While we found no significant
tions, as is conventionally performed in clinical neuroimaging re- difference between patients and controls for the Calculation and
search, we ‘normalized’ each patient’s task-specific Bayesian Encoding tasks, we did find the Semantic Judgement task to be asso-
prediction values with respect to the controls’ distribution. Results ciated with a significantly diminished FPN 4 DMN dissociation in
from this analysis revealed the particular tasks on which each pa- patients on a group level. However, it should be noted that our sam-
tient significantly deviates from healthy controls (Fig. 6A and C). ple size was primarily optimized for individual-level analyses (i.e.
We were able to identify difference in patients’ FPN 4 DMN dis- small sample with multiple runs per subject) and not for drawing
sociation from those of healthy controls, in only 9 of 21 possible group comparisons. Given that some of our equivalence tests
task conditions. As those conditions include almost exclusively yielded non-significant results, our study lacks power to detect
the hardest (five) and medium (three) difficulty levels, selecting an smaller group-level differences. Additional analyses revealed though
appropriate task difficulty level seems to play an important role in that even the existence of a group-level effect is not a prerequisiteMapping residual brain network function BRAIN 2021: 144; 2120–2134 | 2131
Downloaded from https://academic.oup.com/brain/article/144/7/2120/6174117 by guest on 20 October 2021
Figure 6 Task-wise normalization (z-scoring) of patients’ FPN 4 DMN dissociation and accuracy to controls’ group result. (A) Patients’ FPN 4 DMN
Bayesian prediction values z-scored with respect to the control distribution for each task condition; each patient has a unique colour code. (B)
Patients’ accuracy z-scored with respect to control distribution separately for each task condition; each patient has a unique colour code. Note that
not all tasks could be z-scored because of a too small control sample for those tasks (refer to the ‘Materials and methods’ section). (C) A patient’s FPN
4 DMN contrast value for a particular task was marked significantly different (i.e. ‘outlier’, red or blue) when the absolute modified z-score was
41.96. For only 9 out of 21 possible task conditions, we identified at least a single patient that showed a dysfunctional FPN 4 DMN dissociation (i.e.
weaker or stronger FPN 4 DMN dissociation than controls). Importantly, there are only a few tasks that show a dysfunctional FPN 4 DMN dissoci-
ation in the exact same subset of patients: (i) Patients 034, 035, 036 and 038 showed significantly different FPN 4 DMN contrast values for the medium
and most difficult levels of the Encoding task and the most difficult level of the Semantic Judgement task; (ii) Patients 031, 034 and 038 showed a sig-
nificantly different FPN 4 DMN dissociation for the medium and difficult level of the Go/No-Go task. Importantly, for more than half of the tasks (i.e.
12), we do not find a significantly different FPN 4 DMN dissociation for patients. (D) A patient’s accuracy was marked significantly different (i.e. ‘out-
lier’, red or blue) when the absolute modified z-score was 41.96. (E) When comparing the outlier results, we observed little correspondence between
patient’s dysfunctional FPN 4 DMN dissociation and behaviour (red). Interestingly, patients that showed a significantly stronger FPN 4 DMN dissoci-
ation than controls (i.e. Subjects 034 and 038) seemed to perform similarly to controls on some of these tasks (dark blue). The majority of our patients,
however, performed significantly worse than controls while showing no significant difference in FPN 4 DMN dissociation (light blue). Grey shaded
areas correspond to NaN because of missing behavioural data for that subject (grey square) or because of a too small control sample for those tasks
(grey column).
that a given tasks differentiates well between patients and controls differentiating patients from controls as well as subgroups of
on the individual level: when investigating individual patients’ neur- patients; this is especially important considering the heterogeneity
al responses for the Semantic Judgement task (i.e. the task that in patients with respect to lesion location and multiple co-morbid-
showed significantly different FPN 4 DMN dissociation between ities (e.g. vascular disease) that differentially affect the function of
patients and controls on the group level), only two out of all patients brain networks.
showed a significantly lower FPN 4 DMN dissociation compared to At the subject-level, we confirmed the validity of patient-spe-
controls and two other patients showed a significantly stronger FPN cific functional profiles by comparing the real-time optimization
4 DMN dissociation on that task compared to controls. This high- results of two independent runs. We found patient-specific pro-
lights the limitations involved with the conventional approach in files to be consistent; however, controls’ functional profiles were
clinical neuroimaging: it is remarkably difficult to predict before the characterized by a much higher intra-subject reliability. This lower
start of a clinical study which task will reveal a sensitive biomarker intra-subject reliability of patient-specific functional profiles may
that can be applied to an individual patient and that is capable of be explained by patients showing learning effects (improvedYou can also read