Intrinsic Cortico-Subcortical Functional Connectivity in Developmental Dyslexia and Developmental Coordination Disorder
←
→
Page content transcription
If your browser does not render page correctly, please read the page content below
Cerebral Cortex Communications, 2020, 1, 1–14

                                                                               doi: 10.1093/texcom/tgaa011
                                                                               Original Article

ORIGINAL ARTICLE

                                                                                                                                                        Downloaded from https://academic.oup.com/cercorcomms/article/1/1/tgaa011/5816576 by guest on 23 October 2020
Intrinsic Cortico-Subcortical Functional Connectivity in
Developmental Dyslexia and Developmental
Coordination Disorder
Fabien Cignetti1 , Federico Nemmi2 , Marianne Vaugoyeau3,4 , Nadine Girard5 ,
Jean-Michel Albaret2 , Yves Chaix2 , Patrice Péran2 and Christine Assaiante3,4
1 University of Grenoble Alpes, CNRS, TIMC-IMAG, F-38000 Grenoble, France 2 ToNIC, Toulouse NeuroImaging
Center, Université de Toulouse, Inserm, UPS, 31024 Toulouse, France 3 Aix Marseille University, CNRS, LNC,
13331 Marseille, France 4 Aix Marseille University, CNRS, Fédération 3C, 13331 Marseille, France 5 Aix Marseille
University, CNRS, CRMBM, 13385 Marseille, France

Address correspondence to Fabien Cignetti. Email: fabien.cignetti@univ-grenoble-alpes.fr.

Abstract
Developmental dyslexia (DD) and developmental coordination disorder (DCD) are distinct diagnostic disorders. However, they
also frequently co-occur and may share a common etiology. It was proposed conceptually a neural network framework that
explains differences and commonalities between DD and DCD through impairments of distinct or intertwined
cortico-subcortical connectivity pathways. The present study addressed this issue by exploring intrinsic cortico-striatal and
cortico-cerebellar functional connectivity in a large (n = 136) resting-state fMRI cohort study of 8–12-year-old children with
typical development and with DD and/or DCD. We delineated a set of cortico-subcortical functional circuits believed to be
associated with the brain’s main functions (visual, somatomotor, dorsal attention, ventral attention, limbic, frontoparietal
control, and default-mode). Next, we assessed, using general linear and multiple kernel models, whether and which circuits
distinguished between the groups. Findings revealed that somatomotor cortico-cerebellar and frontoparietal cortico-striatal
circuits are affected in the presence of DCD, including abnormalities in cortico-cerebellar connections targeting
motor-related regions and cortico-striatal connections mapping onto posterior parietal cortex. Thus, DCD but not DD may be
considered as an impairment of cortico-subcortical functional circuits.

Key words: cortico-subcortical networks, developmental coordination disorder, developmental dyslexia, machine learning,
resting-state fMRI,

Introduction                                                                   respectively. There is firm evidence of an overlap between these
Developmental dyslexia (DD) and developmental coordination                     two disorders, with rates of comorbidity ranging from 30% to
disorder (DCD) are neurodevelopmental disorders that impede                    50% (Chaix et al. 2007; Haslum and Miles 2007; Flapper and
the child’s ability to learn reading and to master motor skills,               Schoemaker 2013a). This significant overlap has led researchers

Received: 31 March 2020; Revised: 31 March 2020; Accepted: 2 April 2020

© The Author(s) 2020. Published by Oxford University Press.
This is an Open Access article distributed under the terms of the Creative Commons Attribution License (http://creativecommons.org/licenses/by/4.0/),
which permits unrestricted reuse, distribution, and reproduction in any medium, provided the original work is properly cited.

                                                                                                                                               1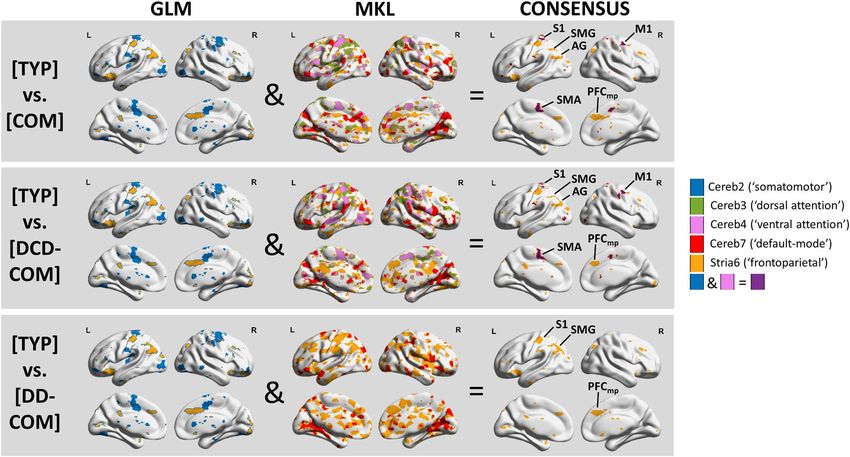
2     Cerebral Cortex Communications, 2020, Vol. 1, No. 1

to believe in a common etiology, with shared causes to motor            in specific, motor and cognitive, cortico-subcortical functional
and speech-language abnormalities. An attractive hypothesis             circuits, but this is conjecture at the moment. As regards DCD,
states that DD and DCD have impairments of the procedural               data suggest alterations in the structure and function of the
learning system (Nicolson and Fawcett 2007), which subserves            cerebellum as well as a ‘disconnection syndrome’ within a large-
the learning of new, and the control of established, sensorimotor       scale cortico-subcortical functional network (e.g., Biotteau et al.
and cognitive skills, rules and habits (Ullman 2004; Knowlton           2016; Wilson et al. 2017, for reviews). However, studies are too
et al. 2017). Impairment of this system would therefore explain         sparse and suffer several limitations (e.g., few studies, small
deficits found in an extremely wide range of motor and percep-          and inhomogeneous samples, uncontrolled comorbidities, weak
tual skills in DCD children (Wilson et al. 2013, 2017; Adams et al.     neuroimaging standards; Biotteau et al. 2016) to reach more
2014), as well as secondary motor symptoms widely reported in           than a tentative conclusion. Finally, some authors even went
DD (Nicholson and Fawcett 1994; Ramus et al. 2003, 2004). The           one step further by formulating a neural system topography for
procedural learning system is also proposed to subserve rule-           learning disorders, in which DD and DCD are mainly related to

                                                                                                                                               Downloaded from https://academic.oup.com/cercorcomms/article/1/1/tgaa011/5816576 by guest on 23 October 2020
based procedures that govern language (‘the mental grammar’),           anomalies in cortico-cerebellar and cortico-striatal circuitries,
including aspects of phonology (Ullman, 2004). As such, impair-         respectively (Nicolson and Fawcett 2007). However, once again,
ments of the procedural learning system may also account for            this proposition has been conjectured (i.e., deduced from
the phonological deficit, which is known to play a primary causal       behavioral symptoms) but is not based on real brain evidence.
role in DD (Ramus 2003, 2004).                                              Based on the aforementioned grounds, we built on the pro-
    Human brain-imaging research has demonstrated that the              cedural learning deficit theory of DD and DCD and have accord-
procedural learning system in the motor domain is subtended by          ingly studied cortico-subcortical functional connectivity in these
cortico-striatal and cortico-cerebellar networks. Cortico-striatal      disorders. We sought to determine whether different cortico-
networks are crucial to learning and retention of sequences of          striatal and cortico-cerebellar circuits are impaired in these two
new movements, while cortico-cerebellar networks are involved           disorders, and whether impairment is exacerbated when both
in motor adaptation to environmental constraints (Doyon and             disorders are combined (comorbidity; COM). Indeed, a number
Benali 2005; Doyon et al. 2009; Debas et al. 2010). There also exists   of conceptual models (Kaplan et al. 2006) and empirical studies
a dynamic reconfiguration of the activity/connectivity of these         (Jongmans et al. 2003; Ramus et al. 2003; Flapper and Schoe-
networks during the course of learning. Early to advanced visuo-        maker 2013b; Rao and Landa 2014) on the relationships between
motor learning involves a shift from cognitive to sensorimotor          developmental disorders support the idea that comorbidity of
cortico-striatal circuits (Lehéricy et al. 2005; Amiez et al. 2012).    disorders results in more severely affected children.
In the same vein, the spatial representation of a motor sequence            We answered these questions by examining intrinsic (rs-
undergoes a reorganization from the dorsomedial (cognitive con-         fMRI) functional connectivity (iFC) of multiple cortico-striatal
trol) to the dorsolateral (sensorimotor) striatum as the sequence       and cortico-cerebellar networks within a large sample (n = 136)
consolidates (Pinsard et al. 2019). Cerebellar activation during        of 8–12-year-old typically developing children (TYP; n = 42) and
motor adaptation to a new tool spans first over posterior and           children with DD (n = 45), DCD (n = 20), and COM (n = 29) scanned
anterior lobes and becomes confined to anterior lobe with time          over two French MRI centers. iFC maps were derived from a seed-
(Imamizu et al. 2000). This suggests disengagement of cognitive         to-voxel approach that assessed correlation between the time
cerebellar territories in favor of sensorimotor ones as learning is     course of striatal and cerebellar seed regions and the time course
completing. Hence, motor procedures, regardless of whether they         of all other voxels in the brain. We have opted for the ‘seven-
relate to motor sequence or motor adaptation, begin as rather           network’ striatal and cerebellar seeds (Buckner et al. 2011; Choi
abstract action plans within cognitive cortico-subcortical circuits     et al. 2012), which correspond to striatal and cerebellar regions
before they translate into purely motor procedures over time            predominantly linked to the most common large-scale cere-
within sensorimotor cortico-subcortical circuits. This view is also     bral (visual, somatomotor, dorsal attention, ventral attention,
supported by animal studies (Ashby et al. 2010). Furthermore,           limbic, frontoparietal control, and default-mode) resting state
different types of procedural learning (e.g., motor or cognitive        networks (Yeo et al. 2011). This seed-to-voxel framework enabled
skills, habits) may be instantiated in different functional cortico-    us to delineate the main cortico-striatal and cortico-cerebellar
subcortical circuits. It is therefore important to emphasize the        networks (Figs 1 and 2), especially sensorimotor and cognitive
functional segregation of cortico-subcortical circuits as a pivotal     (frontoparietal) control ones, and test between-group difference
principle underlying procedural learning.                               for each through univariate general linear model (GLM). Fur-
    It remains unclear whether or not impaired functional               ther, we determined which networks discriminate the groups
cortico-subcortical connectivity is a core hallmark of DD and/or        the most using a multivariate, sparse multiple-kernel learning
DCD. In DD, there is direct and strong evidence of altered activity     (MKL; Schrouff et al. 2018), classification of the iFC maps. This
and functional connectivity within the cortical reading network,        method identified a subset of circuits that carried predictive
roughly a left fronto-temporo-parietal network (e.g., Shaywitz          information for group classification. Finally, we have undertaken
et al. 2002; Richlan et al. 2011; Richlan 2012; Finn et al., 2014;      a consensus analysis that uses both univariate/GLM and mul-
Norton et al. 2014; Schurz et al. 2015). In comparison, there is only   tivariate/MKL findings in conjunction (Varoquaux et al. 2018),
indirect evidence of altered cortico-striatal and cortico-cerebellar    with the aim of reaching the most reliable conclusion as regards
network functioning. A meta-analysis found hyperactive regions          specific cortico-striatal and cortico-cerebellar functional circuits
in the striatum of individuals with reading disorder, and also          that are affected in DD and/or DCD.
indicated that these regions overlap mostly with a motor cortico-
striatal network involved in articulatory processing (Hancock
et al. 2017). Another meta-analysis reported that lobule VI and         Materials and Methods
crus I of the cerebellum have decreased gray matter volume in
dyslexia and that these regions mapped onto cognitive, ventral
                                                                        Participants
attention and frontoparietal, functional cortico-cerebellar             About 136 right-handed children between the ages of 8 and
circuits (Stoodley 2014). Hence, DD may show abnormalities              12 years participated in this study, including 42 TYP children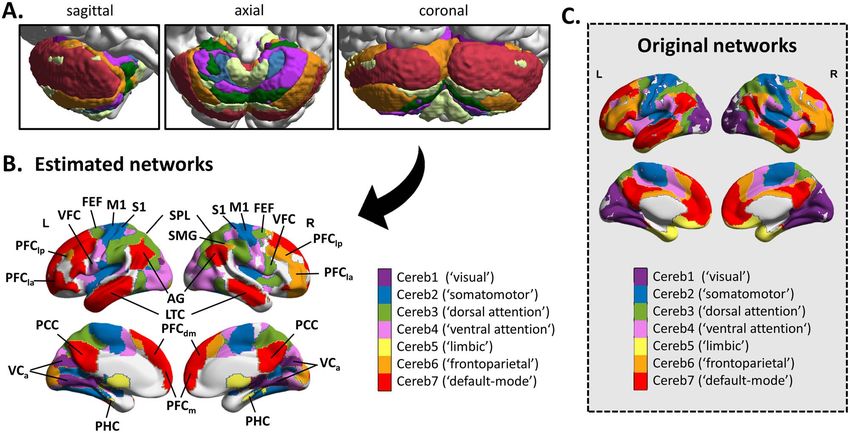
Intrinsic Cortico-Subcortical Functional Connectivity in DD and DCD                                Cignetti et al.          3

                                                                                                                                                                                  Downloaded from https://academic.oup.com/cercorcomms/article/1/1/tgaa011/5816576 by guest on 23 October 2020
Figure 1. Estimated cortico-cerebellar functional circuits. (A) Cerebellar seeds used in the seed-to-voxels analysis. (B) Map of the cerebral regions functionally connected
to the seeds in all children. Significant regions were obtained by applying a cluster-forming threshold P < 0.001 and cluster-extent threshold P-FDR < 0.05. (C) Map of the
original 7 cerebral networks provided for (qualitative) comparison purposes (Buckner et al. 2011; Yeo et al. 2011). Heuristic name labels associated with the networks
in the parentheses are taken from the study of Yeo et al. (2011). This should not be taken to mean that the estimated networks correspond exactly to those of Yeo
et al. (2011), despite clear similarities, or that the networks code only for functions associated with their assigned name. Abbreviations: PFCla : lateral anterior prefrontal
cortex; PFClp : lateral posterior prefrontal cortex; PFCdm : dorsal medial prefrontal cortex; PFCm : medial prefrontal cortex; VFC: ventral frontal cortex; FEF: frontal eye
field; M1: primary motor cortex; S1: primary somatosensory cortex; AG: angular gyrus; SMG: supramarginal gyrus; SPL: superior parietal lobule; PCC: posterior cingulate
cortex; LTC: lateral temporal cortex; VCA : anterior visual cortex; and PHC: para-hippocampal cortex.

Figure 2. Estimated cortico-striatal functional circuits. (A) Striatal seeds used in the seed-to-voxels analysis. (B) Map of the cerebral regions functionally connected to
the seeds in all children. Significant regions were obtained by applying a cluster-forming threshold P < 0.001 and cluster-extent threshold P-FDR < 0.05. (C) Map of the
original 7 cerebral networks provided for (qualitative) comparison purpose (Buckner et al. 2011; Yeo et al. 2011). Heuristic name labels associated with the networks in
the parentheses are taken from the study of Yeo et al. (2011). We changed the labels of some of our estimated networks due to clear topographic differences with those of
the original networks (straight black arrows). Estimated networks related to stria1, stria3, and stria4 do not correspond to visual, dorsal attention, and ventral attention
networks but instead are similar to the sensorimotor network. Labeling should not be taken to mean that the networks code only for functions associated with their
assigned name. Abbreviations: PFCla : lateral anterior prefrontal cortex; PFClp : lateral posterior prefrontal cortex; PFCdm : dorsal medial prefrontal cortex; PFCm : medial
prefrontal cortex; VFC: ventral frontal cortex; PFCdp : dorsal posterior prefrontal cortex; M1: primary motor cortex; and S1: primary somatosensory cortex.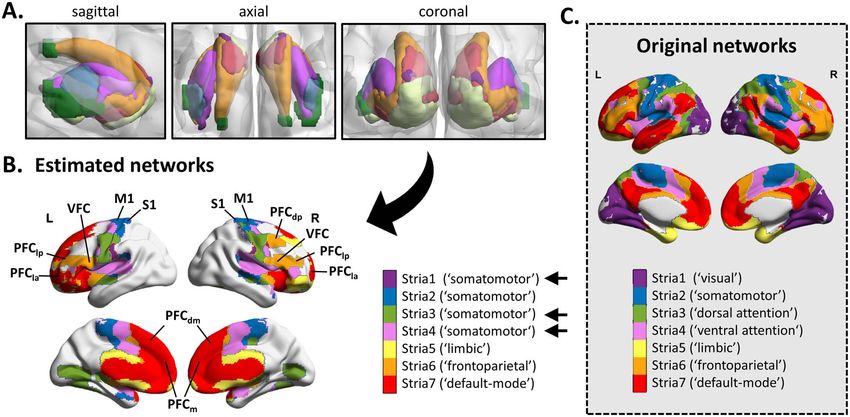
4     Cerebral Cortex Communications, 2020, Vol. 1, No. 1

(10.10 years ± 1.16 year, 20 girls), 45 DD children (10.22 years         Time repetition (TR)/time echo (TE) = 3000/40 ms, flip angle
± 1.09 year, 20 girls), 20 DCD children (9.96 years ±1.23 year, 6        (FA) = 90◦ , field of view (FOV) = 240 mm, matrix = 80 × 80, voxel
girls), and 29 COM children (10.19 years ± 1.31 year, 10 girls).         size = 3.0 × 3.0 × 3.0 mm, 46 axial slices. The scan session was
About half of the children were recruited in Toulouse area and           600 s long and included 200 volumes. Participants received
the other half in Aix-Marseille area (Toulouse/Aix-Marseille; TYP:       instructions to keep their eyes closed, to think nothing
21/21; DD: 25/20; DCD: 11/9; COM: 15/14).                                in particular, and to not move. T1-weighted images were
    All children underwent neuropsychological assessment,                acquired using a fast field echo sequence: TR/TE = 8.1/3.7 ms,
including tests of intellectual abilities (WISC-IV; Wechsler,            FOV = 240 mm, matrix = 240 × 240 × 170, voxel size = 1 × 1 × 1 mm,
2005), reading skills (Alouette test, Lefavrais 2005; ODEDYS-1           and 170 sagittal slices.
battery, Jacquier-Roux et al. 2005), and motor skills (Movement              Aix-Marseille: MRI images were acquired at the radiology
Assessment Battery for Children, M-ABC French translation,               department of the University Medical Centre La Timone using
Soppelsa and Albaret 2004). DCD children all met the DSM-                a Siemens Magnetom Skyra 3.0 T MRI scanner equipped with

                                                                                                                                               Downloaded from https://academic.oup.com/cercorcomms/article/1/1/tgaa011/5816576 by guest on 23 October 2020
V diagnostic criteria for discrete motor disorder: (1) M-ABC-            a 32-channel head coil. Rs-fMRI scans were collected using
1 was below the fifth percentile; (2) treated for a motor                an EPI sequence: TR/TE = 2540/30 ms, FA = 90◦ , FOV = 192 mm,
coordination problem by a pediatric physical therapist due to            matrix = 64 × 64, voxel size = 3.0 × 3.0 × 3.0 mm, and 45 axial
a persistent interference with activities of daily living; (3) no        slices. A scan session was 635 s long and included 250
sign of intellectual disability (IQ score > 70 or subtest similarities   volumes. Participants received similar instructions as in
and picture concepts scaled scores > 7 in WISC-IV); and (4) no           Toulouse for rs-fMRI. T1-weighted images were acquired
visual impairments or neurological conditions that could affect          using a magnetization-prepared rapid gradient echo (MPRAGE)
their motor abilities. Children with DD met the DSM-V diagnostic         sequence: TR/TE = 1900/2.5 ms, inversion time = 993 ms, FA = 9◦ ,
criteria for specific learning disorder with impairment in reading:      FOV = 230 mm, matrix = 256 × 256, voxel size = 0.9 × 0.9 × 0.9 mm,
(1) their accuracy and speed when reading were significantly             and 192 sagittal slices.
low, that is a performance for reading isolated irregular words or
logatoms (ODEDYS-1) 1.5 standard deviation (SD) below the mean
and an Alouette text reading speed score or accuracy score 1 SD          Image Preprocessing
below the mean; (2) they were treated for a reading problem
                                                                         Rs-fMRI images were preprocessed using functions of SPM12
by a pediatric speech therapist; and (3) they had no diagnosis
                                                                         (Wellcome Trust Centre for Neuroimaging; www.fil.ion.ucl.ac.uk/
of any significant medical or social condition known to affect
                                                                         spm) including the following steps: 1/realignment and unwarp,
reading abilities and they did not have any sign of intellectual
                                                                         2/slice-timing correction, 3/direct normalization to functional
disability (WISC total IQ > 70 or/and subtest similarities and
                                                                         MNI space, 4/detection of functional outliers (ART-based cen-
picture concepts scaled scores > 7). To avoid any overlap between
                                                                         soring; www.nitrc.org/projects/artifact_detect), and 5/smoothing
children with DD and DCD, additional inclusion criteria included
                                                                         with an 8-mm kernel. Direct normalization (via segmentation)
an M-ABC total percentile score > 20th percentile for DD children
                                                                         to the T1 MNI template image was also applied to the struc-
and reading (accuracy and speed) scores above 0.5 SD below the
                                                                         tural image as part of preprocessing. In step 4, an image was
mean on both the Alouette and ODEDYS-1 (irregular words or
                                                                         identified as an outlier if the framewise displacement (FD) of
logatoms) tests for DCD children. These criteria also applied for
                                                                         the head position was greater than 0.5 mm from the previ-
TD children, who were also screened on intellectual abilities
                                                                         ous frame, or if the global mean intensity in the image was
(IQ score > 70 or subtest similarities and picture concepts
                                                                         greater than 3 SDs from the mean image intensity for the entire
scaled scores > 7 in WISC-IV). COM children combined DSM-
                                                                         resting session. These conservative threshold values have been
V diagnostic criteria for both discrete motor disorder and
                                                                         used in previous developmental studies (i.e., children cohorts)—
learning disorder with impairment in reading mentioned
                                                                         whose preprocessing/denoising procedures were very similar
above. DD children received multicomponent interventions
                                                                         to ours—to attenuate motion-related artifacts (e.g., Chai et al.
targeting fluency, reading comprehension, phonological skills,
                                                                         2014, 2016; Cignetti et al. 2018a; Whitfield-Gabrieli et al. 2019).
and vocabulary study. Treatments for DCD children involved
                                                                         This censoring strategy identified on average 18% of invalid
process-oriented, task-oriented, and conventional physical and
                                                                         volumes in our entire sample and yielded a reduction in FD of
occupational therapies. Children with suspicion of attention
                                                                         the head at a value close to 0.2 mm in any groups (Table 1).
deficit hyperactivity disorder (ADHD) were excluded from the
                                                                         These values roughly correspond to generally accepted norms
study as assessed through parent and clinician ratings on the
                                                                         (e.g., Power et al. 2012, 2014).
DSM-V diagnostic criteria for ADHD (< six inattention and six
hyperactive/impulsive symptoms). This exclusion criterion was
particularly important to consider given the aggravating impact
of ADHD on DD and DCD (Crawford et al. 2006; Chaix et al. 2007).
                                                                         Denoising
    The study was approved by local ethics committees (CPP) in           BOLD time series were denoised using the aCompCor method
Toulouse and Aix-Marseille and was conducted in accordance               (Behzadi et al. 2007; Chai et al. 2012, 2014) of the CONN toolbox
with the Declaration of Helsinki. We obtained written informed           (www.nitrc.org/projects/conn; Whitfield-Gabrieli and Nieto-Cas-
consent from the parents and their children.                             tanon 2012). This consisted in regressing out from the BOLD
                                                                         time series at each voxel temporal confounds, including five
                                                                         principal components of the signals from white matter and cere-
                                                                         brospinal masks with partial volume correction applied. Head
MRI Acquisition                                                          motion parameters (three translation and three rotation param-
Toulouse: MRI images were acquired at the Toulouse Neu-                  eters, plus another six parameters representing their first-order
roImaging Center using a Philips Achieva dStream 3.0 T MRI               temporal derivatives), and outlier images were also regressed out
scanner equipped with a 32-channel head coil. Rs-fMRI scans              from the BOLD time series. The BOLD time series were finally
were collected using an echo planar imaging (EPI) sequence:              band-pass filtered (0.008–0.09 Hz).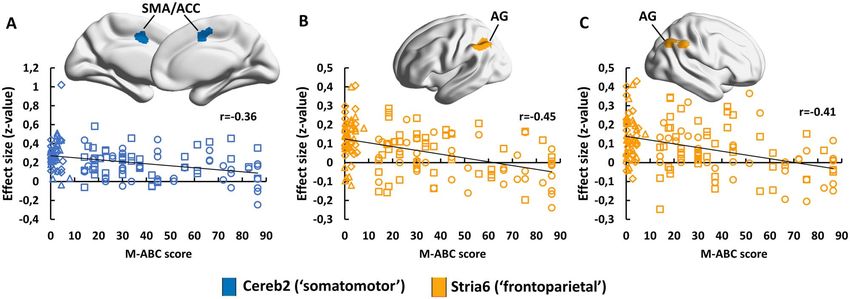
Intrinsic Cortico-Subcortical Functional Connectivity in DD and DCD                             Cignetti et al.       5

Table 1. Summary statistics of motion censoring

                    % Invalid scans              FD before censoring (mm)                                     FD after censoring (mm)

                                                 ART                  Power               Jenkinson           ART                 Power               Jenkinson

TYP                 16 (24)                      0.41 (0.59)         0.45 (0.54)          0.24 (0.31)         0.15 (0.07)         0.19 (0.09)         0.09 (0.04)
DD                  14 (16)                      0.28 (0.21)         0.32 (0.23)          0.17 (0.13)         0.14 (0.04)         0.17 (0.04)         0.08 (0.02)
DCD                 26 (23)                      0.60 (0.67)         0.65 (0.68)          0.34 (0.35)         0.17 (0.04)         0.21 (0.06)         0.11 (0.03)
COM                 18 (18)                      0.30 (0.25)         0.34 (0.28)          0.18 (0.15)         0.15 (0.04)         0.18 (0.06)         0.09 (0.05)

ART’s FD measure has been used to censor invalid scans. Power (Power et al. 2012) and Jenkinson (Jenkinson et al. 2002) FDs are also provided for comparison purposes.
Values are mean (SD).

                                                                                                                                                                         Downloaded from https://academic.oup.com/cercorcomms/article/1/1/tgaa011/5816576 by guest on 23 October 2020
Functional Connectivity                                                               procedure. Both adjusted and nonadjusted P-values are reported
                                                                                      in the manuscript.
Functional connectivity was calculated as the Pearson’s corre-
lation coefficient between denoised average BOLD time series
computed across all the voxels within each seven-network                              MKL Analysis
cerebellar (Buckner et al. 2011) and striatal (Choi et al. 2012)
                                                                                      We performed MKL analysis using PRoNTo toolbox (http://www.
seeds and every other voxel in the brain (seed-to-voxel analysis).
                                                                                      mlnl.cs.ucl.ac.uk/pronto; Schrouff et al. 2013, 2018). This machine
These seeds have been previously delineated using a winner-
                                                                                      learning approach is based on the formulation of a support vector
takes-all algorithm that associated each voxel of the cerebellum
                                                                                      machine (SVM) classifier, but rather than relying on a single
and of the striatum with a cortical network (defined in Yeo
                                                                                      kernel to separate the data into classes, it forms an optimal
et al. 2011) with the most similar profile of connectivity.
                                                                                      kernel from a linear combination of kernels (Rakotomamonjy
Accordingly, names of the seeds have been originally assigned
                                                                                      et al. 2008; Gönen and Alpaydin 2011; Schrouff et al. 2018), here
based on the cortical networks best corresponding to them,
                                                                                      corresponding to our connectivity maps. To determine whether
namely visual, somatomotor, dorsal attention, ventral attention,
                                                                                      and which correlation maps distinguished between the four
limbic, frontoparietal, and default-mode. However, some of our
                                                                                      groups of children, we implemented six binary MKL models (i.e.,
estimated cortico-cerebellar and cortico-striatal networks did
                                                                                      TYP vs DD, TYP vs DCD, TYP vs COM, DD vs DCD, DD vs COM,
not correspond to these reference labels, which led us to change
                                                                                      and DCD vs COM), thus transforming the four-class problem
the nomenclature. This is explained in the results, section
                                                                                      into six binary learning problems (i.e., class binarization). In
‘Cortico-cerebellar and cortico-striatal estimated functional
                                                                                      all MKL models, the first step consisted of building as many
networks’ and illustrated in Figures 1, 2, S1, and S2. Finally,
                                                                                      kernel matrices of size n x n (n being the number of subjects)
correlation coefficients were converted to normally distributed
                                                                                      as seed-based correlation maps (i.e., 14), which represented the
z-scores using the Fisher transformation.
                                                                                      similarity between subjects for each map. To this end, signal in
                                                                                      voxels of each correlation map was extracted and concatenated
GLM Analysis
                                                                                      in a feature vector of size d x 1, with d the number of voxels,
T-tests and F-tests were run on the first-level correlation maps.                     for each individual. Each vector was then associated to a label
One-sample T-tests produced group level correlation maps for                          (here a categorical value, given the above binary classification).
each seed in the entire sample (i.e., all groups combined), with                      Finally, a linear kernel (i.e., dot product) was then built from the
the aim of delineating the cortico-striatal and cortico-cerebellar                    feature vectors for each correlation map. Kernels were mean-
functional circuits and comparing them (qualitatively) with pre-                      centered and normalized before entering the MKL model. The
vious results from the literature (Buckner et al. 2011). ANCOVA                       built kernels and their associated labels were then submitted to
F-tests examined between-group differences for each seed-based                        an SVM classifier that defined a decision boundary separating
correlation map, including age, gender, and GCOR (average global                      the labels per kernel (Schrouff et al. 2018). More specifically, this
correlation) as covariates. Correction for GCOR at the group level                    classifier estimated/optimized model parameters (wm ) to deter-
is a conservative approach to reduce global variations in BOLD                        mine decision boundaries for classification, one per kernel m,
signal due to noise and nuisance sources (Saad et al. 2013), like                     and weighted them (by a parameter dm ) to provide a final decision
the factor center in our experiment. Note that we did not judged                      function. Regularization constraints in the considered classifier
necessary to include motion-related measures in group-level                           enforced sparsity on the kernels, so that only some kernels had
analysis because neither the percentage (arcsin transformed) of                       non-null contribution dm to the final decision function. Details
invalid scans (F(3,135) = 1.58; P = 0.19) nor the mean FD after censor-               on regularization and optimisation of MKL can be found else-
ing (F(3,135) = 1.63; P = 0.18) significantly differed between groups.                where (Rakotomamonjy et al. 2008, Schrouff et al. 2018). In sum,
Furthermore, we tested through bivariate regression any associ-                       the classifier identified which kernels (here connectivity maps)
ation between functional connectivity of the cortico-striatal and                     contributed the most to the classification. In addition, the models
cortico-cerebellar functional maps and behavioral scores that                         weights wm were mapped onto brain volume to display the
capture motor and reading skills. These scores were the M-ABC                         decision function at the voxel level (i.e., weight maps). Model per-
(expressed as percentile) and the first principal component (99%                      formance was assessed through a leave-one-subject-per-class-
of the total variance explained) of a set of reading scores (i.e.,                    out crossvalidation scheme, which consisted in leaving out a
Alouette text reading speed and accuracy and reading isolated                         single subject from each class at a time for testing and training
irregular words and logatoms in ODEDYS-1). All analyses were                          with the remaining subjects. This crossvalidation scheme was
thresholded by applying cluster-forming threshold P < 0.001 and                       the most appropriate given that we have matched subjects across
cluster-extent threshold P-FDR < 0.05. FDR was also adjusted on                       groups based on MRI center, gender, and age, to avoid unbal-
the entire set of seeds (n = 14) using the Benjamini and Hochberg                     anced datasets and biasing our prediction models towards the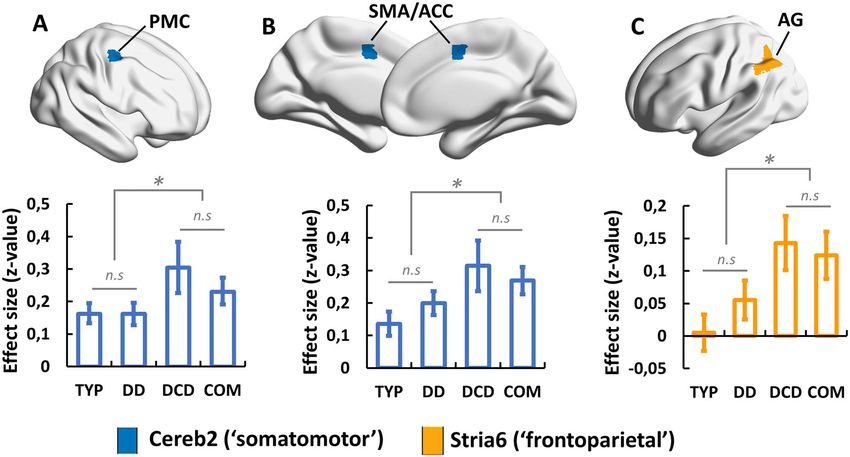
6      Cerebral Cortex Communications, 2020, Vol. 1, No. 1

Table 2. Model performance for the MKL model distinguishing between the different classes of children

Model MKL                        Balanced accuracy (%)                True positives/Total positives True negatives/Total negatives AUCROC

[TYP] vs. [DD]                   44.05 (P = 0.75)                     18/42                                19/42                                0.41
[TYP] vs. [DCD]                  57.50 (P = 0.27)                     14/20                                9/20                                 0.60
[TYP] vs. [COM]                  75.86 (P = 0.005)                    23/29                                21/29                                0.80
[DD] vs. [DCD]                   45.50 (P = 0.76)                     9/20                                 8/20                                 0.51
[DD] vs. [COM]                   46.55 (P = 0.67)                     13/29                                14/29                                0.52
[DCD] vs. [COM]                  47.50 (P = 0.61)                     11/20                                8/20                                 0.41
[TYP] vs. [DCD-COM]              71.43 (P = 0.001)                    30/42                                30/42                                0.75
[TYP] vs. [DD-COM]               63.10 (P = 0.04)                     28/42                                25/42                                0.67

All significant MKL models survived FDR correction. Binary classifier performance is summarized through 3 measures: balanced accuracy, true positives/negatives

                                                                                                                                                                            Downloaded from https://academic.oup.com/cercorcomms/article/1/1/tgaa011/5816576 by guest on 23 October 2020
that represent the number of children classified correctly as belonging to class1/class2, and the AUC of the receiver operator characteristic curve (1 represents perfect
performance, 0.5 represents random performance).

more common classes. Thus, subject matching involved under-                            association visual cortices (visual network; purple), connections
sampling the largest groups, including 42 samples for the TYP vs                       to primary motor and somatosensory cortices (somatomotor
DD model, 20 samples for the TYP vs DCD model, 29 samples for                          network; blue), connections to superior parietal lobules and
the TYP vs COM model, 20 samples for the DD vs DCD model,                              frontal eye fields (dorsal attention network; green), connections
29 samples for the DD vs COM model, and 20 samples for the                             to temporo-parietal junction and ventral frontal regions (ventral
DCD vs COM model (see Table 2). Balanced accuracy served as the                        attention network; violet), connections to para-hippocampal
model performance metric, computed as the mean of the class                            cortices (limbic network; cream), connections to lateral pre-
accuracies (corresponding to the sensitivity and specificity). A                       frontal cortices and inferior parietal lobules (frontoparietal
P-value associated with balanced accuracy was estimated using                          network; orange), and connections to ventromedial prefrontal
1000 permutations of the training labels, with any value smaller                       and posterior cingulate cortices and angular gyri (default-mode
than 0.05 reported as being significant. However, given that we                        network; red). Overall, the topography of the above cortico-
implemented several MKL models, we also controlled FDR using                           cerebellar networks matched well the original seven network
the Benjamini and Hochberg procedure, and reported adjusted                            topography (Buckner et al. 2011; Yeo et al. 2011), although there
P-value when primary P-value was below 0.05.                                           were also some regional differences. First, occipital regions
                                                                                       figured surprisingly in all our estimated functional networks.
                                                                                       Second, the cortico-cerebellar ventral attention network was not
GLM–MKL Consensus                                                                      limited to temporo-parietal and ventral frontal regions but also
                                                                                       included motor and somatosensory cortical regions (Fig. S1). As
Multivariate approaches, such as MKLs, are thought to be more
                                                                                       such, the ventral attention network does not correspond exactly
specific (more localized outcomes) and sensitive (easier detec-
                                                                                       to his assigned name but embeds also a clear sensorimotor
tion of significant outcomes) than univariate approaches, such
                                                                                       dimension. This underlines that the reference labels associated
as the GLMs. But there is also an interpretability issue with
                                                                                       with the networks are only heuristic labels and should not be
multivariate approaches due to the contribution of noise in
                                                                                       taken to mean that the networks code solely for these functions.
the decoding process of linear classifiers (Haufe et al. 2014).
                                                                                           The topography of our cortico-striatal networks was different
Therefore, several authors recommend using both approaches
                                                                                       from that of the original seven networks (Fig. 2). Only the cortico-
in conjunction to come up with more robust and interpretable
                                                                                       striatal somatomotor network (blue) corresponded well to that
conclusions (Schrouff et al. 2016, 2018; Varoquaux et al. 2018).
                                                                                       in the literature, spanning primary motor, and somatosensory
However, performing conjunction analysis between data that use
                                                                                       cortical regions. We also identified cortico-striatal frontoparietal
different statistics (in our case F-values and SVM weights) is
                                                                                       (orange) and default-mode (red) networks, yet incompletely. The
not straightforward and requires some rescaling to bring those
                                                                                       frontoparietal network spanned both lateral prefontal cortices,
statistics into a comparable scale. In our case, the conjunction (or
                                                                                       but not posterior parietal cortices. The default mode network
consensus) focused on weight maps of MKL models having per-
                                                                                       involved ventromedial prefrontal regions but lacked classical
formed significantly above chance level and F-maps of GLM hav-
                                                                                       posterior parietal and posterior cingulate regions. The limbic net-
ing demonstrated significant between-group differences. First,
                                                                                       work (cream) was almost inexistent, with only a few voxels span-
we computed z-scores for the weight maps by dividing the classi-
                                                                                       ning the parahippocampal gyrus. Finally, striatal seeds assigned
fier weights by their standard error (obtained by crossvalidation).
                                                                                       to vision (purple), ventral attention (violet), and dorsal atten-
Then, we normalized z-scores of the weight maps and F-scores of
                                                                                       tion (green) all connected to motor and somatosensory regions,
the F-maps by rescaling them on the same [0–1] range, using the
                                                                                       hence revealing overlapping sensorimotor cortico-striatal con-
formula (x – xmin )/(xmax – xmin ). Finally, we thresholded the maps
                                                                                       nectivity patterns (Fig. S2). Thus, the topographic distribution of
using a 95% percentile threshold and intersected them to identify
                                                                                       the cortico-striatal functional connectivity was expressed in a
common voxels.
                                                                                       few separate networks, mainly sensorimotor, frontoparietal, and
                                                                                       default-mode networks.
Results
Cortico-Cerebellar and Cortico-Striatal Estimated Functional                           Impact of DD and DCD on Cortico-Cerebellar and
Networks                                                                               Cortico-Striatal Functional Circuits
Cerebellar seeds showed segregated functional connectivity                             We found main effects of group in somatomotor cortico-
pathways with cortical regions (Fig. 1), including connections to                      cerebellar and frontoparietal cortico-striatal circuits (Fig. 3). With
Intrinsic Cortico-Subcortical Functional Connectivity in DD and DCD Cignetti et al. 7
Downloaded from https://academic.oup.com/cercorcomms/article/1/1/tgaa011/5816576 by guest on 23 October 2020
Figure 3. Cerebral regions of the cortico-subcortical functional circuits that expressed any difference between TYP, DD, DCD, and COM children. All results were obtained
using a cluster-forming threshold P < 0.001 and a cluster-extent threshold P-FDR < 0.05 for whole brain, and survived FDR correction on the entire set of networks. Effect
sizes are provided as mean ± 90% CI. ∗ : group means are significantly different. PMC: premotor cortex; SMA: supplementary motor area; ACC: anterior cingulate cortex;
and AG: angular gyrus.
respect to the somatomotor cortico-cerebellar connectivity, there connectivity indexes motor control capabilities. We further
was a significant cluster (P-FDR = 0.0035; adjusted P-FDR = 0.025) found a significant negative correlation between functional
in the right dorsal premotor cortex (MNI X, Y, Z coordinates: 36, connections established between the cerebellum and the right
−10, 54) and another significant cluster (P-FDR = 0.0038; adjusted angular gyrus (MNI X, Y, Z coordinates: 50, −55, 52) and the
P-FDR = 0.026) at the boundary between the supplementary M-ABC (P-FDR = 0.000087; adjusted P-FDR = 0.0012), indicating
motor area and the dorsal anterior cingulate cortex (MNI that not only the left angular gyrus but also the right angular
X, Y, Z coordinates: 6, −2, 46). For both, posthoc pairwise t- gyrus is associated with motor control. Altogether, the above
tests revealed a stronger iFC (hyperconnectivity) in DCD and findings paint the consistent picture that some somatomotor
COM children compared with TYP and DD children. Regarding cortico-cerebellar and frontoparietal cortico-striatal functional
the frontoparietal cortico-striatal connectivity, there was a connections are central to motor control, which once altered
significant cluster (P-FDR = 0.000391; adjusted P-FDR = 0.0055) in (here, overconnected) are hallmarks of DCD disorder. Note that
the left angular gyrus (MNI X, Y, Z coordinates: −46, −56, 42), correlation analysis between connectivity in these regions and
where iFC was also stronger (hyperconnectivity) in DCD and the reading score did not reveal any significant result.
COM children compared with TYP and DD children. Note that
connectivity about this posterior parietal region was close to
zero-level in both TYP and DD children, which explains the fact Decoding Children Populations from Cortico-Cerebellar
that the region was not previously identified as being part of and Cortico-Striatal Functional Connectivity
the frontoparietal cortico-striatal circuit at the entire sample Among all models, only the one classifying TYP and COM
level. In sum, somatomotor cortico-cerebellar and frontoparietal children was found to be significant (P = 0.005) with accuracy
cortico-striatal network hyperconnectivity sets apart conditions and area under curve (AUC) values of 75.86% and 0.8, respectively
with DCD from DD and TYP conditions. Besides, there was no (Table 2). This result remained significant (adjusted P-FDR = 0.03)
additive effect of comorbidity on hyperconnectivity. when correcting P-value using the Benjamini and Hochberg
Interestingly, we further found that two of the functional procedure to address multiple testing across MKL models. There
connectivity pathways that expressed a group effect, namely were four kernels that contributed the most to the decision
the one established between the cerebellum and the border function of the TYP-COM MKL model, including three cortico-
region between the supplementary motor area and dorsal cerebellar iFC maps—default-mode (∼44%), dorsal attention
anterior cingulate cortex and the one linking the striatum and (∼13%), and ventral attention (∼11%)—and the frontoparietal
the left angular gyrus, also showed significant correlations (P- cortico-striatal (∼12%) iFC map (Table 3). At first sight, it may
FDR = 0.028; adjusted P-FDR = 0.16 and P-FDR = 0.000028; adjusted seem surprising not to find somatomotor cortico-cerebellar iFC
P-FDR = 0.0004, respectively) with the M-ABC score (Fig. 4). For map among the kernels that contributed the most to the TYP-
both relationships, the higher the iFC the poorer the children COM MKL model while GLM identified difference between TYP
motor control (i.e., the lower the M-ABC). Hence, somatomotor and COM children in this functional pathway. However, it should
cortico-cerebellar and frontoparietal cortico-striatal network be recalled that ventral attention cortico-cerebellar network8 Cerebral Cortex Communications, 2020, Vol. 1, No. 1
Downloaded from https://academic.oup.com/cercorcomms/article/1/1/tgaa011/5816576 by guest on 23 October 2020
Figure 4. Cerebral regions of the cortico-subcortical functional circuits that expressed a significant correlation with M-ABC score. All results were obtained using a
cluster-forming threshold P < 0.001 and a cluster-extent threshold P-FDR < 0.05 for whole brain. Only correlations between M-ABC and frontoparietal cortico-striatal
connections survived FDR correction on the entire set of networks. Circle: TYP; Square: DD; Diamond: DCD; Triangle: COM. SMA: supplementary motor area; ACC:
anterior cingulate cortex; and AG: angular gyrus.
Table 3. Kernel contribution (dm ) to the MKL models performing significantly above chance level, along with the expected ranking, across folds
Model MKL [TYP] vs. [COM] Model MKL [TYP] vs. [DCD-COM] Model MKL [TYP] vs. [DD-COM]
ROI# dm (%) ER ROI# dm (%) ER ROI# dm (%) ER
Cereb7 (‘default-mode’) 44.4370 14 Cereb7 (‘default-mode’) 39.8886 14 Cereb7 (‘default-mode’) 46.3638 14
Cereb3 (‘dorsal attention’) 13.4819 12.4103 Cereb4 (‘ventral attention’) 13.1845 12.2619 Cereb6 (‘frontoparietal’) 14.7626 12.5476
Stria6 (‘frontoparietal’) 12.4501 11.7586 Stria6 (‘frontoparietal’) 12.2180 11.9048 Stria6 (‘frontoparietal’) 13.8192 12.3571
Cereb4 (‘ventral attention’) 11.0945 11.1379 Cereb3 (‘dorsal attention’) 10.4024 11.0952 Cereb3 (‘dorsal attention’) 7.0694 10.2857
Stria7 (‘default-mode’) 8.1143 9.8966 Cereb2 (‘somatomotor’) 7.7157 9.6667 Cereb4 (‘ventral attention’) 7.0532 9.9762
Stria4 (‘somatomotor’) 6.1296 8.7931 Cereb6 (‘frontoparietal’) 6.0691 8.9524 Cereb2 (‘somatomotor’) 4.0890 8.0714
Cereb1 (‘visual’) 3.9389 7.6552 Stria4 (‘somatomotor’) 5.9496 8.4048 Cereb5 (‘limbic’) 3.2966 7.6667
Cereb6 (‘frontoparietal’) 0.3346 1.4828 Stria7 (‘default-mode’) 3.4399 6.7619 Stria7 (‘default-mode’) 3.1173 7.2381
Cereb5 (‘limbic’) 0.0191 0.2414 Cereb5 (‘limbic’) 0.4929 2.3810 Stria5 (‘limbic’) 0.3052 2.0476
Cereb2(‘frontoparietal’) 0 0 Cereb1 (‘visual’) 0.3341 2.3571 Stria4 (‘somatomotor’) 0.1237 1.0714
Stria1 (‘somatomotor’) 0 0 Stria5 (‘limbic’) 0.3052 2.0476 Cereb1 (‘visual’) 0 0
Stria2 (‘somatomotor’) 0 0 Stria1 (‘somatomotor’) 0 0 Stria1 (‘somatomotor’) 0 0
Stria3 (‘somatomotor’) 0 0 Stria2 (‘somatomotor’) 0 0 Stria2 (‘somatomotor’) 0 0
Stria5 (‘limbic’) 0 0 Stria3 (‘somatomotor’) 0 0 Stria3 (‘somatomotor’) 0 0
Expected ranking was computed as the average of the ranking across folds, thus evaluating the stability of the kernel contribution. Only the kernels that carry the most
predictive information about group classification (>10% of contribution to MKL) are discussed in the text.
aggregated both ventral attention and somatomotor regions children were matched with TYP children based on MRI center,
(see also weight maps results below). Accordingly, the true gender and age. Both models were significant (P and adjusted P-
conclusion from MKL should be that several cortico-cerebellar FDR = 0.04 for TYP-[DD-COM] model and P = 0.001 and adjusted
functional circuits believed to be associated with default- P-FDR = 0.002 for TYP-[DCD-COM] model). The differences were
mode, somatomotor, dorsal attention, and ventral attention in prediction accuracy and contributing kernels to the mod-
functions and a cortico-striatal circuit likely to be associated with els. Accuracy and AUC values for the classification of TYP and
frontoparietal control mostly contribute to differentiate TYP and DCD-COM children remained very close to those of the TYP-
COM children. As such, it is interesting to note that MKL revealed COM model (71.43% and 0.75 versus 75.86% and 0.8, respectively;
a much more complex picture of cortico-subcortical connectivity Table 2). Likewise, kernels with the most important contribu-
differences between TYP and COM than the one derived from the tion to the TYP-[DCD-COM] model were the same as those of
GLM, suggesting a complementarity between the two methods the TYP-COM model, including the default-mode (∼40%), dorsal
that we further capitalize on below (see Consensus between GLM attention (∼10%), and ventral attention (∼13%) cortico-cerebellar
and MKL approaches). iFC maps as well as the frontoparietal cortico-striatal (∼12%) iFC
We also built extra MKL binary models distinguishing TYP chil- map (Table 3). Therefore, the same conclusion is reached, saying
dren and either DD-COM children or DCD-COM children (Table 2). that cortico-cerebellar functional circuits believed to be associ-
The idea behind mixing COM children with either DD or DCD ated with multiple functions (default-mode, dorsal attention/so-
children was to tease out which of the DD or DCD disorder matomotor, ventral attention) and a cortico-striatal circuit likely
was the most contributing to the differentiation between TYP associated with frontoparietal control mostly differentiate TYP
and COM children reported above (i.e., posthoc testing within and DCD-COM children. On the other hand, accuracy and AUC
the MKL framework). Mixtures of DD-COM and DCD-COM chil- values for the TYP-[DD-COM] model decreased compared with
dren included the same number of DD or DCD children (n = 16) those of the TYP-COM model (63.10% and 0.67 versus 75.86%
grouped with the COM children (n = 26). DD-COM and DCD-COM and 0.8, respectively; Table 2). There were also some changesIntrinsic Cortico-Subcortical Functional Connectivity in DD and DCD Cignetti et al. 9
Downloaded from https://academic.oup.com/cercorcomms/article/1/1/tgaa011/5816576 by guest on 23 October 2020
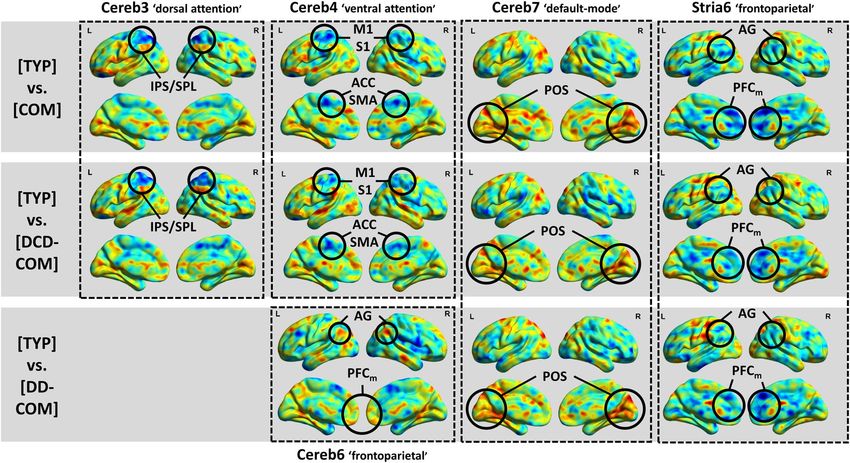
Figure 5. Weight images at the voxel level for the TYP-COM, TYP-[DCD-COM], and TYP-[DD-COM] MKL models. Only images for kernels (cortico-subcortical circuits)
with the greatest contribution (>10%) to the models are presented. Voxels increasing the signed distance from the classification boundary the most, either toward TYP
(voxels in warm colors) or COM, DCD-COM, and DD-COM (voxels in cold colors), have been circled. Voxels in green have null contribution to the model. Abbreviations:
PFCm : medial prefrontal cortex; M1: primary motor cortex; S1: primary somatosensory cortex; SMA: supplementary motor area; ACC: anterior cingulate cortex; AG:
angular gyrus; IPS: intraparietal sulcus; SPL: superior parietal lobule; and POS: parieto-occipital sulcus.
in the kernels that contributed the most to the MKL model, in Consensus Between GLM and MKL Approaches
that only default-mode cortico-cerebellar iFC map (∼46%) and
As a final step, we captured the consensus between the GLM
frontoparietal cortico-striatal iFC map (∼14%) still conveyed most
and MKL approaches. Results showed that COM children differ
of the predictive information, altogether with the frontoparietal
from TYP children mainly at (i) sensorimotor cortico-cerebellar
cortico-cerebellar iFC map (∼15%). Both dorsal and ventral atten-
connections projecting onto the left primary somatosensory cor-
tion cortico-cerebellar iFC maps still conveyed some predictive
tex, the right motor cortex and the right and left supplemen-
information, but to a lower extent (∼7%). In sum, the distinction
tary motor and anterior cingulate areas, and (ii) frontoparietal
between TYP and COM appears to be driven more by the DCD
cortico-striatal connections projecting onto the left angular and
condition than by the DD condition. As such, DCD rather than
supramarginal gyri and the right and left medial prefrontal cor-
DD may be characterized by impaired connectivity in multiple
tices (Fig. 6). Results were exactly the same for the differentia-
cortico-cerebellar (default-mode, dorsal attention/somatomotor,
tion between TYP and DCD-COM children while only the fron-
ventral attention) and cortico-striatal (fronto-parietal) networks.
toparietal cortico-striatal connections still differentiated TYP
Weight maps representing the relative contribution of voxels
and DD-COM children. This leads to the conclusion that impaired
to all predictive models (i.e., TYP-COM, TYP-[DCD-COM], and
sensorimotor cortico-cerebellar connections and frontoparietal
TYP-[DD-COM]) attributed high negative weights to voxels in
cortico-striatal connections is characteristic of DCD, and that
right and left posterior parietal and medial prefrontal cortices for
impairments in frontoparietal cortico-striatal connections may
the cortico-striatal connectivity (Fig. 5; frontoparietal map) and
also be shared by DD.
high positive weights to voxels close to the parieto-occipital junc-
tion as regards the cortico-cerebellar connectivity (Fig. 5, default-
mode map). This means that increase in signal at these regions
increases the distance from the classification boundary the most,
Discussion
moving towards either COM, DCD-COM or DD-COM children for Our study investigated whether intrinsic cortico-subcortical
the fronto-parietal regions and moving towards TYP children functional circuits are impaired in DD and/or DCD and whether
for the parieto-occipital junction. In addition, weight maps of some impairments in these circuits are more related to either
TYP-COM and TYP-[DCD-COM] models attributed high negative of the disorders. The goal was to address the assumption
weights to voxels in medial (supplementary motor area/anterior according to which any neurodevelopmental disorder, including
cingulate cortex) and lateral (premotor and primary motor and DD and DCD, would have impairments in cortico-subcortical
somatosensory cortices) central regions (Fig. 5, ventral attention circuits (Nicolson and Fawcett 2007). Our findings demonstrated
map) and in the superior parietal lobule (Fig. 5, dorsal attention for the first time that intrinsic cortico-subcortical functional
map), with any increase in signal at these regions increasing the connectivity is affected in children with DCD and DD-DCD (i.e.,
probability of being class COM and DCD-COM. COM), including abnormalities in cortico-cerebellar connections10 Cerebral Cortex Communications, 2020, Vol. 1, No. 1
Downloaded from https://academic.oup.com/cercorcomms/article/1/1/tgaa011/5816576 by guest on 23 October 2020
Figure 6. Maps for consensus between GLM and MKL. These maps single out a set of cerebral regions associated to cortico-subcortical circuits that distinguishes between
groups of children. Abbreviations: S1: primary somatosensory cortex; M1: primary motor cortex; SMA: supplementary motor area; AG: angular gyrus; SMG: supramarginal
gyrus; and PFCmp: medial posterior prefrontal cortex.
targeting sensorimotor regions (S1, M1, SMA/ACC) and cortico- goal-directed motor actions (Scott 2004). As such, performance
striatal connections mapping onto posterior parietal cortex (AG, difficulties exhibited by DCD children in a wide range of
SMG). On the other hand, we did not find clear evidence of a movements, in particular eyes movements, reaching, grasping,
functional connectivity deficit in DD, although our data cannot bimanual lifting, manual interception, posture, and gait (Wilson
totally exclude the possibility that frontoparietal cortico-striatal et al. 2013, 2017), could stem from the reported connectivity
functional network is marginally affected in DD. As such, our impairments. Relatedly, a growing literature reports atypical
study supports the proposal of impaired cortico-subcortical predictive motor control in DCD, which impacts negatively
functional circuits as a core feature of DCD phenotype, but this both motor planning and online control of movements (Jover
may not apply as a general rule for any neurodevelopmental et al. 2010; Adams et al. 2014; Wilson et al. 2013, 2017; Cignetti
disorder. For DCD, this finding complements previous studies et al. 2018b). Internal models subtending predictive motor
that foreshadowed atypical functional brain networks involving control have been linked to the cerebellum (Wolpert et al.
cortical (e.g., parietal) and subcortical (cerebellum, basal ganglia) 1998; Blakemore et al. 1999, 2001; Imamizu et al. 2000), the
regions (Biotteau et al. 2016; Wilson et al. 2017; Fuelscher somatosensory cortex (Shergill et al. 2013), and the posterior
et al. 2018). In contrast, the null outcome is startling for DD parietal cortex (Wolpert et al. 1998; Desmurget and Sirigu 2009).
given that previous studies reported impaired regions in the Accordingly, abnormalities in functional cerebellar and striatal
striatum and the cerebellum, which also overlapped with known connections projecting onto sensorimotor and posterior parietal
cortico-striatal (motor) and cortico-cerebellar (ventral attention, regions, respectively, are compatible with the internal modeling
frontoparietal control, default-mode) functional pathways hypothesis in DCD. Besides, DCD children have difficulties
(Stoodley 2014; Hancock et al. 2017). However, this was not direct in learning new motor skills, and both skill acquisition and
evidence of impaired cortico-subcortical functional connectivity. retention processes seem to be affected (King et al. 2011;
Besides, these previous studies considered DD children on the Biotteau et al. 2015). In recent years, brain studies have shown
single basis of their performance in reading while we also dynamic reconfiguration of the activity/connectivity of cortical-
controlled for motor deficits. This is critical given that 30– subcortical networks during the course of motor learning, from
50% of DD children also show difficulties in fine and/or gross cognitive control to sensorimotor networks as learning moves
motor coordination (Chaix et al. 2007; Haslum and Miles 2007; from acquisition to retention (Lehéricy et al. 2005; Amiez et al.
Flapper and Schoemaker 2013a). It is therefore possible that they 2012; Pinsard et al. 2019). As such, difficulties in acquisition
included a significant proportion of comorbid, DD-DCD, children and retention of motor skills in DCD may be engendered by
who may have biased the results. impaired cortico-subcortical functional connections projecting
Functional connectivity impairments in sensorimotor onto sensorimotor and posterior parietal regions as reported in
cortico-cerebellar and frontoparietal cortico-striatal networks the present study.
in the presence of DCD altogether with the relationship found Interestingly, a previous study on individuals with autism
between functional connectivity of these pathways and M- spectrum disorder (ASD) reported resting state overconnectiv-
ABC offer an explanatory framework to the disease clinical ity in cortico-subcortical (both cerebellum and basal ganglia)
picture. Pathways linking the cerebellum, the basal ganglia and pathways targeting sensorimotor regions (Cerliani et al. 2015).
precentral /postcentral cortical regions are common pathways of The authors related this finding to the atypical sensorimotorIntrinsic Cortico-Subcortical Functional Connectivity in DD and DCD Cignetti et al. 11
behavior commonly reported in ASD. Hence, cerebellar and stri- connectivity profiles in DCD and COM children compared with
atal overconnections with the sensorimotor (motor/somatosen- DD and TYP children. Another limit has to do with our parcella-
sory) cortical regions may be the hallmark of neurodevelopmen- tion strategy, which involved template-based parcels and seed-
tal disorders characterized by sensorimotor dysfunction, either to-voxels methododology. Using this strategy, we were not able to
DCD or ASD. The authors further proposed that overconnectiv- reproduce the entire set of cortico-cerebellar and cortico-striatal
ity might be due to disrupted GABAergic functioning. Cortico- networks reported in the original studies in adults (Buckner
cerebellar overconnectivity could stem from a disinhibition of et al. 2011; Choi et al. 2012). Although the estimated cortico-
the deep cerebellar nuclei due to the loss of GABAergic Purk- cerebellar networks corresponded well to the adults seven net-
inje cells. Cortico-striatal overconnectivity could result from a works, with the exception of an overlap between the somato-
loss of GABAergic projection neurons within the striatum. For motor and ventral attention networks, the estimated cortico-
instance, studies on Huntington’s disease showed loss of striatal striatal networks included only the sensorimotor network and
projection neurons in the indirect pathway, and this is thought incomplete default-mode and frontoparietal control networks.
Downloaded from https://academic.oup.com/cercorcomms/article/1/1/tgaa011/5816576 by guest on 23 October 2020
to tip the balance in favor of the direct pathway whose role Hence, our template-based parcellation strategy have ‘missed’
is excitatory on cortex and hence cause abnormal involuntary some cortico-subcortical, especially cortico-striatal, functional
movements (Reiner et al. 1988; Albin et al. 1992). Thus, we can networks. This may be because the segregation of these circuits
speculate that GABAergic dysfunction may also underlie cortico- is still underway by age 8–12 years, so that templates derived
striatal overconnections reported in the presence of DCD. Local- from adults were suboptimal. There is evidence that cortico-
ized proton magnetic resonance spectroscopy, which measures cerebellar and cortico-striatal functional connectivity is still far
in vivo neurochemical information and has already been used in from having reached maturity by end childhood (Supekar et al.
ASD children to show reduced GABA concentration (e.g., Gaetz 2009; Cerliani et al. 2015; Cignetti et al. 2017; van Duijvenvo-
et al. 2014; Rojas et al. 2014), may be useful to test this hypothesis orde et al. 2019). Accordingly, it cannot be excluded that DD
and uncover the neurobiology of DCD. and/or DCD children may show abnormalities in other functional
A point which is worth mentioning is that default-mode connectivity pathways than those revealed here. Some of the
cortico-cerebellar connectivity map contributed importantly to cortico-cerebellar networks may have also been slightly biased
the decision function in all MKL models (TD-COM, TD-[DCD- because of the seed-to-voxel approach. It has been documented
COM], and TD-[DD-COM]). In particular, the results suggested blurring of fMRI signal across the cerebellar–cerebral boundary
atypical cerebellar connectivity targeting mainly the parieto- that leads especially to artifactual correlations between seeds
occipital sulcus in DD and/or DCD children. To our knowledge, spanning the cerebellum and the occipital cortex (Buckner et al.
this result is without precedent in DCD while there are studies 2011). We believe that such a blurring issue may be responsible
that already reported disrupted connectivity with occipito- of the unexpected presence of occipital regions in our estimated
temporal areas in dyslexia (Shaywitz et al. 2003; van der Mark cortico-cerebellar networks (Figs 1 and S1). Fortunately, group
et al. 2011; Finn et al. 2014; Schurz et al., 2015). The parieto- differences were not located in these regions, thus allowing us
occipital sulcus is known to be involved in tasks requiring to exclude the possibility that our main findings may be biased.
visuo-spatial attention and working memory (Richter et al. 2019), Beyond these methodological elements, we would like to stress
domains where both DD and DCD children demonstrate deficits that our study provides the first piece of evidence that fine
(Valdois et al. 2004; Ahissar 2007; Biotteau et al. 2017; Wilson et al. parcellation of the cerebellum and of the striatum into multiple
2017). Hence, atypical cerebellar functional connectivity with the networks is necessary to address the etiology behind neurode-
posterior occipito-temporal sulcus might be a defining feature of velopmental disorders, calling for more research on this topic. In
both diseases. In addition, MKL also identified particularities in this vein, an important next step will be to also evaluate whether
cerebellar functional connectivity targeting the superior parietal circuit impairments such as those identified in the present study
lobule (i.e., dorsal attention cortico-cerebellar connectivity) as during resting state also manifest during task state.
part of the DCD phenotype. Given that the dorsal attention
network enables top–down cognitive selection of stimuli and
actions (Corbetta et al. 2008), this deficit may relate to difficulties
in executive function reported in DCD (Wilson et al. 2017). But,
Conclusion
again, these are secondary outcomes that did not survive the The results presented here indicate that functional somatomotor
consensus analysis. As such, they should only be considered as cortico-cerebellar and frontoparietal cortico-striatal circuits are
avenues for future research. impaired in DCD. This is compatible with current complementary
Finally, although our findings support the notion of a deficit explanatory frameworks of DCD, including procedural motor skill
in cortico-subcortical circuits that applies to DCD but not to DD, learning deficit and internal modelling deficit, thus providing
some limitations should be mentioned. First, our conclusion has them with a neural basis. On the other hand, the results run
been obtained in an indirect way with regards to MKL, mixing against the idea of an impaired cortico-subcortical connectivity
COM children with either DCD or DD children. Using it, we in DD, and consequently the idea that the above frameworks
demonstrated that TYP vs [DCD-COM] model led to the same are useful to conceptualize DD. As an alternative solution, we
classification and kernels as TYP vs COM model, while accuracy can allude speculatively the most popular phonological deficit
decreased and some kernels get lost for TYP vs [DD-COM] model. framework of DD that is related to the left cerebral reading
Hence, the addition of DD children decreased the distance from network. Just as important, the fact that DD-DCD comorbidity
COM children and brought the diseased children closer to the did not lead to more severely impaired circuits compared with
TYP children. We had to go through these posthoc MKL models DCD alone also casts doubts on a common brain origin to both
to interpret TYP vs COM results given that direct classification disorders. Further studies are required to complete the picture
of TYP vs DD or DCD did not reach significance (likely because of the boundaries and overlaps of brain systems subtending
of the low sample size for DCD). Of course, one has to keep in neurodevelopmental disorders. These studies should not be lim-
mind that our overall interpretation has also been established ited to DD and DCD but should also include other disorders
based on the GLM that identified atypical cortico-subcortical (e.g., ASD, attention-deficit/hyperactivity disorder) to evaluateYou can also read