Inferring the effectiveness of government interventions against COVID-19 - Science
←
→
Page content transcription
If your browser does not render page correctly, please read the page content below
RESEARCH ARTICLES

                                                                                                                                Cite as: J. M. Brauner et al., Science
                                                                                                                                   10.1126/science.abd9338 (2020).

Inferring the effectiveness of government interventions
against COVID-19
Jan M. Brauner1,2*†, Sören Mindermann1*†, Mrinank Sharma2,3,4*†, David Johnston5,6, John Salvatier6,
Tomáš Gavenčiak7, Anna B. Stephenson8, Gavin Leech9, George Altman10, Vladimir Mikulik11,
Alexander John Norman12, Joshua Teperowski Monrad2,13,14, Tamay Besiroglu15, Hong Ge16,
Meghan A. Hartwick17, Yee Whye Teh3, Leonid Chindelevitch18,19‡, Yarin Gal1‡, Jan Kulveit2‡
1
 Oxford Applied and Theoretical Machine Learning (OATML) Group, Department of Computer Science, University of Oxford, Oxford, UK. 2Future of Humanity Institute,
University of Oxford, Oxford, UK. 3Department of Statistics, University of Oxford, Oxford, UK. 4Department of Engineering Science, University of Oxford, Oxford, UK. 5College
of Engineering and Computer Science, Australian National University, Canberra, Australia. 6Quantified Uncertainty Research Institute, San Francisco, CA, USA. 7Independent
scholar, Prague, Czech Republic. 8Harvard John A. Paulson School of Engineering and Applied Sciences, Harvard University, Cambridge, MA, USA. 9School of Computer
Science, University of Bristol, Bristol, UK. 10School of Medical Sciences, University of Manchester, Manchester, UK. 11Indepdendent scholar, London, UK. 12Mathematical,
Physical and Life Sciences (MPLS) Doctoral Training Centre, University of Oxford, Oxford, UK. 13Faculty of Public Health and Policy, London School of Hygiene and Tropical

                                                                                                                                                                                Downloaded from http://science.sciencemag.org/ on May 7, 2021
Medicine, London, UK. 14Department of Health Policy, London School of Economics and Political Science, London, UK. 15Faculty of Economics, University of Cambridge,
Cambridge, UK. 16Engineering Department, University of Cambridge, Cambridge, UK. 17Tufts Initiative for the Forecasting and Modeling of Infectious Diseases, Tufts
University, Boston, MA, USA. 18Medical Research Council (MRC) Centre for Global Infectious Disease Analysis, School of Public Health, Imperial College London, London, UK.
19
  Abdul Latif Jameel Institute for Disease and Emergency Analytics (J-IDEA), School of Public Health, Imperial College London, London, UK.
*Corresponding author. Email: jan.brauner@cs.ox.ac.uk (J.M.B.); soren.mindermann@cs.ox.ac.uk (S.M.); mrinank@robots.ox.ac.uk (M.S.)
†These authors contributed equally to this work. ‡These authors contributed equally to this work.

Governments are attempting to control the COVID-19 pandemic with nonpharmaceutical interventions
(NPIs). However, the effectiveness of different NPIs at reducing transmission is poorly understood. We
gathered chronological data on the implementation of NPIs for several European, and other, countries
between January and the end of May 2020. We estimate the effectiveness of NPIs, ranging from limiting
gathering sizes, business closures, and closure of educational institutions to stay-at-home orders. To do so,
we used a Bayesian hierarchical model that links NPI implementation dates to national case and death
counts and supported the results with extensive empirical validation. Closing all educational institutions,
limiting gatherings to 10 people or less, and closing face-to-face businesses each reduced transmission
considerably. The additional effect of stay-at-home orders was comparatively small.

Worldwide, governments have mobilized resources to fight                                 exist [(1, 5–8); summarized in table S7]. In contrast, we eval-
the COVID-19 pandemic. A wide range of nonpharmaceutical                                 uated the impact of several NPIs on the epidemic’s growth in
interventions (NPIs) has been deployed, including stay-at-                               34 European and seven non-European countries. If all coun-
home orders and the closure of all nonessential businesses.                              tries implemented the same set of NPIs on the same day, the
Recent analyses show that these large-scale NPIs were jointly                            individual effect of each NPI would be unidentifiable. How-
effective at reducing the virus’ effective reproduction number                           ever, the COVID-19 response was far less coordinated: coun-
(1), but it is still largely unknown how effective individual                            tries implemented different sets of NPIs, at different times,
NPIs were. As more data become available, we can move be-                                in different orders (Fig. 1).
yond estimating the combined effect of a bundle of NPIs and                                  Even with diverse data from many countries, estimating
begin to understand the effects of individual interventions.                             NPI effects remains a challenging task. First, models are
This can help governments efficiently control the epidemic,                              based on uncertain epidemiological parameters; our NPI ef-
by focusing on the most effective NPIs to ease the burden put                            fectiveness study incorporates some of this uncertainty di-
on the population.                                                                       rectly in the model. Second, the data are retrospective and
    A promising way to estimate NPI effectiveness is data-                               observational, meaning that unobserved factors could con-
driven, cross-country modeling: inferring effectiveness by re-                           found the results. Third, NPI effectiveness estimates can be
lating the NPIs implemented in different countries to the                                highly sensitive to arbitrary modeling decisions, as shown by
course of the epidemic in these countries. To disentangle the                            two recent replication studies (9, 10). Fourth, large-scale pub-
effects of individual NPIs, we need to leverage data from mul-                           lic NPI datasets suffer from frequent inconsistencies (11) and
tiple countries with diverse sets of interventions in place. Pre-                        missing data (12). Hence, the data and the model must be
vious data-driven studies (table S8) estimate effectiveness for                          carefully validated if they are to be used to guide policy deci-
individual countries (2–4) or NPIs, although some exceptions                             sions. We have collected a large public dataset on NPI

First release: 15 December 2020                                          www.sciencemag.org                 (Page numbers not final at time of first release) 1
implementation dates that has been validated by independ-          quantified uncertainty with Bayesian prediction intervals,
ent double entry, and extensively validated our effectiveness      which are wider than standard credible intervals. These re-
estimates. This is a crucial, but often absent or incomplete,      flect differences in NPI effectiveness across countries among
element of COVID-19 NPI effectiveness studies (10).                several other sources of uncertainty. Bayesian prediction in-
    Our results provide insight on the amount of COVID-19          tervals are analogous to the standard deviation of the effec-
transmission associated with various areas and activities of       tiveness across countries, rather than the standard error of
public life, such as gatherings of different sizes. Therefore,     the mean effectiveness. Under the default model settings, the
they may inform the packages of interventions that countries       percentage reduction in Rt (with 95% prediction interval; Fig.
implement to control transmission in current and future            2) associated with each NPI was: limiting gatherings to 1000
waves of infections. However, we need to be careful when in-       people or less: 23% (0 to 40%); to 100 people or less: 34% (12
terpreting this study’s results. We only analyzed the effect       to 52%); to 10 people or less: 42% (17 to 60%); closing some
NPIs had between January and the end of May 2020, and NPI          high-risk face-to-face businesses: 18% (−8 to 40%); closing
effectiveness may change over time as circumstances change.        most nonessential face-to-face businesses: 27% (−3 to 49%);
Lifting an NPI does not imply that transmission will return        closing both schools and universities in conjunction: 38% (16
to its original level and our window of analysis does not in-      to 54%); and issuing stay-at-home orders (additional effect on

                                                                                                                                        Downloaded from http://science.sciencemag.org/ on May 7, 2021
clude relaxation of NPIs. These and other limitations are de-      top of all other NPIs): 13% (−5 to 31%). Note that we were not
tailed in the Discussion section.                                  able to robustly disentangle the individual effects of closing
                                                                   schools and closing universities since these NPIs were imple-
Cross-country NPI effectiveness modeling                           mented on the same day or in close succession in most coun-
We analyzed the effects of seven commonly used NPIs be-            tries [except Iceland and Sweden, where only universities
tween the 22nd of January and the 30th of May 2020. All            were closed (see also fig. S21)]. We thus reported “schools and
NPIs aimed to reduce the number of contacts within the pop-        universities closed in conjunction” as one NPI.
ulation (Table 1). If a country lifted an NPI before the 30th of       Some NPIs frequently co-occurred, i.e., were partly collin-
May, the window of analysis for that country terminates on         ear. However, we were able to isolate the effects of individual
the day of the lifting (see Methods). To ensure high data qual-    NPIs since the collinearity was imperfect and our dataset
ity, all NPI data were independently entered by two of the         large. For every pair of NPIs, we observed one without the
authors (independent double entry) using primary sources,          other for 504 country-days on average (table S5). The mini-
and then manually compared with several public datasets.           mum number of country-days for any NPI pair is 148 (for lim-
Data on confirmed COVID-19 cases and deaths were taken             iting gatherings to 1000 or 100 attendees). Additionally,
from the Johns Hopkins CSSE COVID-19 Dataset (13). The             under excessive collinearity, and insufficient data to over-
data used in this study, including sources, are available          come it, individual effectiveness estimates would be highly
online on GitHub (14).                                             sensitive to variations in the data and model parameters (15).
    We estimated the effectiveness of NPIs with a Bayesian         Indeed, high sensitivity prevented Flaxman et al. (1), who had
hierarchical model. We used case and death data from each          a smaller dataset, from disentangling NPI effects (9). In con-
country to infer the number of new infections at each point        trast, our effectiveness estimates are substantially less sensi-
in time, which is itself used to infer the (instantaneous) re-     tive (see below). Finally, the posterior correlations between
production number Rt over time. NPI effects were then esti-        the effectiveness estimates are weak, further suggesting man-
mated by relating the daily reproduction numbers to the            ageable collinearity (fig. S22).
active NPIs, across all days and countries. This relatively sim-
ple, data-driven approach allowed us to sidestep assumptions       Effectiveness of NPI combinations
about contact patterns and intensity, infectiousness of differ-    Although the correlations between the individual estimates
ent age groups, and so forth, that are typically required in       were weak, we took them into account when evaluating com-
modeling studies. It also allowed us to directly model many        bined NPI effectiveness. For example, if two NPIs frequently
sources of uncertainty, such as uncertain epidemiological pa-      co-occurred, there may be more certainty about the combined
rameters, differences in NPI effectiveness between countries,      effectiveness than about the effectiveness of each NPI indi-
unknown changes in testing and infection fatality rates, and       vidually. Figure 3 shows the combined effectiveness of the
the effect of unobserved influences on Rt. The code is availa-     sets of NPIs that are most common in our data. In combina-
ble online on GitHub (14).                                         tion, the NPIs in this study reduced Rt by 77% (67 to 85%).
                                                                   Across countries, the mean Rt without any NPIs (i.e., the R0)
Effectiveness of individual NPIs                                   was 3.3 (table S4). Starting from this number, the estimated
Our model enabled us to estimate the individual effectiveness      Rt likely could have been brought below 1 by closing schools
of each NPI, expressed as a percentage reduction in Rt. We         and universities, high-risk businesses, and limiting gathering

First release: 15 December 2020                        www.sciencemag.org       (Page numbers not final at time of first release)   2
sizes to at most 10. Readers can interactively explore the ef- four categories of sensitivity analyses (Fig. 4, B to E), and each
fects of sets of NPIs with our online mitigation calculator (16). individual sensitivity analysis is shown in the supplementary
A CSV file containing the joint effectiveness of all NPI com- materials. The trends in the results are also stable within
binations is available online (14). these categories.
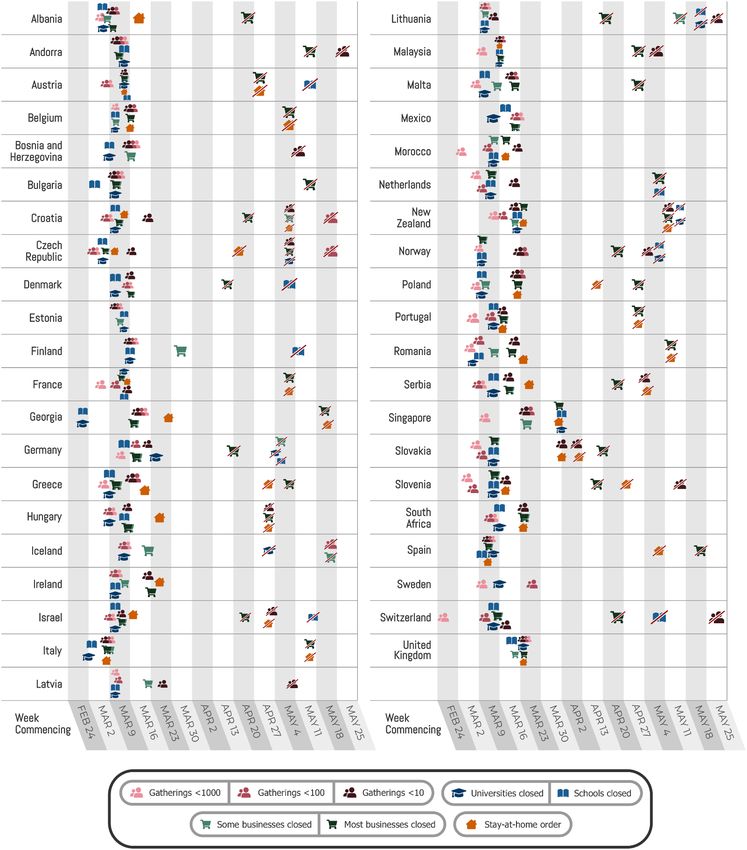
Sensitivity and validation Discussion
We performed a range of validation and sensitivity experi- We used a data-driven approach to estimate the effects that
ments (figs. S2 to S19). First, we analyzed how the model ex- seven nonpharmaceutical interventions had on COVID-19
trapolated to countries that did not contribute data for fitting transmission in 41 countries between January and the end of
the model, and found that it could generate calibrated fore- May 2020. We found that several NPIs were associated with
casts for up to 2 months, with uncertainty increasing over a clear reduction in Rt, in line with mounting evidence that
time. Multiple sensitivity analyses showed how the results NPIs are effective at mitigating and suppressing outbreaks of
changed when we modified the priors over epidemiological COVID-19. Furthermore, our results indicate that some NPIs
parameters, excluded countries from the dataset, used only outperformed others. While the exact effectiveness estimates
deaths or confirmed cases as observations, varied the data vary with modeling assumptions, the broad conclusions dis-
Downloaded from http://science.sciencemag.org/ on May 7, 2021
preprocessing, and more. Finally, we tested our key assump- cussed below are largely robust across 206 experimental con-
tions by showing results for several alternative models [struc- ditions in 11 sensitivity analyses.
tural sensitivity (10)] and examined possible confounding of Business closures and gathering bans both seem to have
our estimates by unobserved factors influencing Rt. In total, been effective at reducing COVID-19 transmission. Closing
we considered NPI effectiveness under 206 alternative exper- most nonessential face-to-face businesses was only somewhat
imental conditions (Fig. 4A). Compared with the results ob- more effective than targeted closures, which only affected
tained under our default settings (Figs. 2 and 3), median NPI businesses with high infection risk, such as bars, restaurants,
effectiveness varied under alternative plausible experimental and nightclubs (see also Table 1). Therefore, targeted busi-
conditions. However, the trends in the results are robust, and ness closures can be a promising policy option in some cir-
some NPIs outperformed others under all tested conditions. cumstances. Limiting gatherings to 10 people or less was
While we tested large ranges of plausible values, our experi- more effective than limits of up to 100 or 1000 people and
ments did not include every possible source of uncertainty. had a more robust effect estimate. Note that our estimates
We categorized NPI effects into small, moderate, and are derived from data between January and May 2020, a pe-
large, which we define as a posterior median reduction in Rt riod when most gatherings were likely indoors due to
of less than 17.5%, between 17.5 and 35%, and more than 35% weather.
(vertical lines in Fig. 4). Four of the NPIs fell into the same Whenever countries in our dataset introduced stay-at-
category across a large fraction of experimental conditions: home orders, they essentially always also implemented, or al-
closing both schools and universities was associated with a ready had in place, all other NPIs in this study. We accounted
large effect in 96% of experimental conditions, and limiting for these other NPIs separately and isolated the effect of or-
gatherings to 10 people or less had a large effect in 99% of dering the population to stay at home, in addition to the ef-
conditions. Closing most nonessential businesses had a mod- fect of all other NPIs. In accordance with other studies that
erate effect in 98% of conditions. Issuing stay-at-home orders took this approach (2, 6), we found that issuing a stay-at-
(i.e., in addition to the other NPIs) fell into the “small effect” home order had a small effect when a country had already
category in 96% of experimental conditions. Three NPIs fell closed educational institutions, closed nonessential busi-
less clearly into one category: Limiting gatherings to 1000 nesses, and banned gatherings. In contrast, Flaxman et al. (1)
people or less had a moderate-to-small effect (moderate in and Hsiang et al. (3) included the effect of several NPIs in the
81% of conditions) while limiting gatherings to 100 people or effectiveness of their stay-at-home order (or “lockdown”)
less had a moderate-to-large effect (moderate in 66% of con- NPIs and accordingly found a large effect for this NPI. Our
ditions). Finally, closing some high-risk businesses, including finding suggests that some countries may have been able to
bars, restaurants, and nightclubs had a moderate-to-small ef- reduce Rt to below 1 without a stay-at-home order (Fig. 3) by
fect (moderate in 58% of conditions). Limiting gatherings to issuing other NPIs.
1000 people or less was the NPI with the highest variation in We found a large effect for closing schools and universi-
median effectiveness across the experimental conditions (Fig. ties in conjunction, which was remarkably robust across dif-
4A), which may reflect the NPI’s partial collinearity with lim- ferent model structures, variations in the data, and
iting gatherings to 100 people or less. epidemiological assumptions (Fig. 4). It remained robust
Aggregating all sensitivity analyses can hide sensitivity to when controlling for NPIs excluded from our study (fig. S9).
specific assumptions. We display the median NPI effects in Our approach cannot distinguish direct effects on
First release: 15 December 2020 www.sciencemag.org (Page numbers not final at time of first release) 3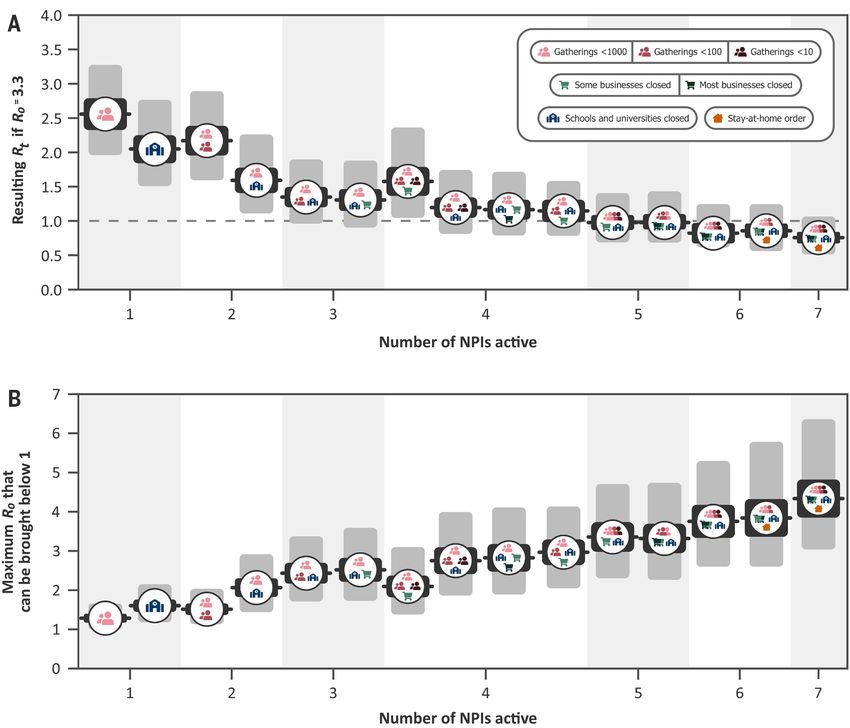
transmission in schools and universities from indirect effects,     40,000 confirmed cases associated with universities in the
such as the general population behaving more cautiously af-         UK since they reopened in September 2020 show that educa-
ter school closures signaled the gravity of the pandemic. Ad-       tional institutions may still play a large role in transmission,
ditionally, since school and university closures were               despite safety measures (30). Fourth, we do not have data on
implemented on the same day, or in close succession in most         some promising interventions, such as testing, tracing, and
of the countries we study, our approach cannot distinguish          case isolation. These interventions could become an im-
their individual effects (fig. S21). This limitation likely also    portant part of a cost-effective epidemic response (31), but we
holds for other observational studies that do not include data      did not include them because it is difficult to obtain compre-
on university closures and estimate only the effect of school       hensive data on their implementation. In addition, although
closures (1–3, 5–8). Furthermore, our study does not provide        the data are more readily available, it is difficult to estimate
evidence on the effect of closing preschools and nurseries.         the effect of mask-wearing in public spaces because there was
    Previous evidence on the role of pupils and students in         limited public life as a result of other NPIs. We discuss fur-
transmission is mixed. Although infected young people (aged         ther limitations in the supplementary text, section E.
ca. 12 to 25) are often asymptomatic, they appear to shed sim-         Although our work focused on estimating the impact of
ilar amounts of virus as older people (17, 18), and might there-    NPIs on the reproduction number Rt, the ultimate goal of gov-

                                                                                                                                         Downloaded from http://science.sciencemag.org/ on May 7, 2021
fore infect higher-risk individuals. Early data suggested that      ernments may be to reduce the incidence, prevalence, and ex-
children and young adults had a notably lower observed in-          cess mortality of COVID-19. For this, controlling Rt is
cidence rate than older adults—whether this was due to              essential, but the contribution of NPIs toward these goals
school and university closures remains unknown (19–22). In          may also be mediated by other factors, such as their duration
contrast, the recent resurgence of cases in European coun-          and timing (32), periodicity and adherence (33, 34), and suc-
tries has been concentrated in the age group corresponding          cessful containment (35). While each of these factors ad-
to secondary school and higher education (especially the lat-       dresses transmission within individual countries, it can be
ter), and is now spreading to older age groups as well as pri-      crucial to additionally synchronize NPIs between countries,
mary-school-aged children (23, 24). Primary schools may be          since cases can be imported (36).
generally less affected than secondary schools (20, 25–28),            Many governments around the world seek to keep Rt be-
perhaps partly because children under the age of 12 are less        low 1 while minimizing the social and economic costs of their
susceptible to SARS-CoV-2 (29).                                     interventions. Our work offers insights into which areas of
    Our study has several limitations. First, NPI effectiveness     public life are most in need of virus containment measures so
may depend on the context of implementation, such as the            that activities can continue as the pandemic develops; how-
presence of other NPIs, country demographics, and specific          ever, our estimates should not be taken as the final word on
implementation details. Our results thus need to be inter-          NPI effectiveness.
preted as the effectiveness in the contexts in which the NPI
was implemented in our data (10). For example, in a country         Materials and methods
with a comparatively old population, the effectiveness of clos-
ing schools and universities would likely have been on the          Dataset
lower end of our prediction interval. Expert judgement              We analyzed the effects of NPIs (Table 1) in 41 countries (37)
should thus be used to adjust our estimates to local circum-        (see Fig. 1). We recorded NPI implementations when the
stances. Second, Rt may have been reduced by unobserved             measures were implemented nationally or in most regions of
NPIs or voluntary behavior changes such as mask-wearing.            a country (affecting at least three-fourths of the population).
To investigate whether the effect of these potential confound-      We only recorded mandatory restrictions, not recommenda-
ers could be falsely attributed to the observed NPIs, we per-       tions. Supplementary text section G details how edge cases in
formed several additional analyses and found that our results       the data collection were handled. For each country, the win-
are stable to a range of unobserved factors (fig. S9). However,     dow of analysis starts on the 22nd of January and ends after
this sensitivity check cannot provide certainty and investigat-     the first lifting on an NPI, or on the 30th of May 2020, which-
ing the role of unobserved factors is an important topic to         ever was earlier. The reason to end the analysis after the first
explore further. Third, our results cannot be used without          major reopening (38) was to avoid a distribution shift. For
qualification to predict the effect of lifting NPIs. For example,   example, when schools reopened, it was often with safety
closing schools and universities in conjunction seems to have       measures, such as smaller class sizes and distancing rules. It
greatly reduced transmission, but this does not mean that re-       is therefore expected that contact patterns in schools will
opening them will necessarily cause infections to soar. Edu-        have been different before school closure compared to after
cational institutions can implement safety measures such as         reopening. Modeling this difference explicitly is left for future
reduced class sizes as they reopen. However, the nearly             work. Data on confirmed COVID-19 cases and deaths were

First release: 15 December 2020                         www.sciencemag.org       (Page numbers not final at time of first release)   4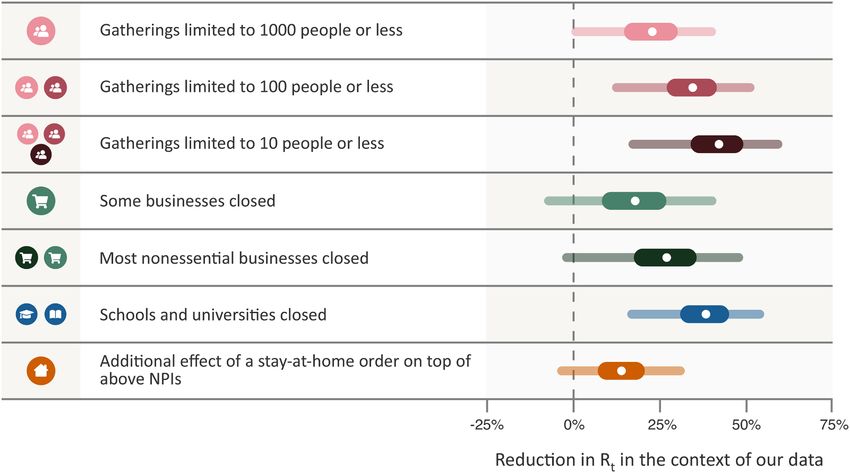
taken from the Johns Hopkins CSSE COVID19 Dataset (13). estimated by relating the daily reproduction numbers to the
The data used in this study, including sources, are available active NPIs, across all days and countries. This relatively sim-
online on GitHub (14). ple, data-driven approach allowed us to sidestep assumptions
about contact patterns and intensity, infectiousness of differ-
Data collection ent age groups, and so forth that are typically required in
We collected data on the start and end date of NPI implemen- modeling studies. Code is available online on GitHub (14).
tations, from the start of the pandemic until the 30th of May Our model builds on the semi-mechanistic Bayesian hier-
2020. Before collecting the data, we experimented with sev- archical model of Flaxman et al. (1), with several additions.
eral public NPI datasets, finding that they were not complete First, we allow our model to observe both case and death
enough for our modeling and contained incorrect dates (39). data. This increases the amount of data from which we can
By focusing on a smaller set of countries and NPIs than these extract NPI effects, reduces distinct biases in case and death
datasets, we were able to enforce strong quality controls: We reporting, and reduces the bias from including only countries
used independent double entry and manually compared our with many deaths. Second, since epidemiological parameters
data to public datasets for cross-checking. are only known with uncertainty, we place priors over them,
First, two authors independently researched each country following recent recommended practice (42). Third, as we do
Downloaded from http://science.sciencemag.org/ on May 7, 2021
and entered the NPI data into separate spreadsheets. The re- not aim to infer the total number of COVID-19 infections, we
searchers manually researched the dates using internet can avoid assuming a specific infection fatality rate (IFR) or
searches: there was no automatic component in the data ascertainment rate (rate of testing). Fourth, we allow the ef-
gathering process. The average time spent researching each fects of all NPIs to vary across countries, reflecting differ-
country per researcher was 1.5 hours. ences in NPI implementation and adherence.
Second, the researchers independently compared their en- We now describe the model by going through Fig. 5 from
tries to the following public datasets and, if there were con- bottom to top. The growth of the epidemic is determined by
flicts, visited all primary sources to resolve the conflict: the the time- and country-specific reproduction number Rt,c,
EFGNPI database (40) and the Oxford COVID-19 Government which depends on (i) the (unobserved) basic reproduction
Response Tracker (41). number in country c, R0,c, and (ii) the active NPIs at time t.
Third, each country and NPI was again independently en- R0,c accounts for all time-invariant factors that affect trans-
tered by one to three paid contractors, who were provided mission in country c, such as differences in demographics,
with a detailed description of the NPIs and asked to include population density, culture, and health systems (43).
primary sources with their data. A researcher then resolved Following Flaxman et al. and others (1, 6, 8), each NPI is
any conflicts between this data and one (but not both) of the assumed to independently affect Rt,c as a multiplicative factor
spreadsheets. I
Finally, the two independent spreadsheets were combined =Rt , c R0, c ∏ exp ( −αi , c xi ,t , c )
i =1
and all conflicts resolved by a researcher. The final dataset where xi,t,c = 1 indicates that NPI i is active in country c on
contains primary sources (government websites and/or me-
day t (xi,t,c = 0 otherwise), I is the number of NPIs, and αi,c is
dia articles) for each entry.
the “effect parameter” for NPI i in country c. The multiplica-
tive effect encodes the plausible assumption that NPIs have a
Data preprocessing
smaller absolute effect when Rt,c is already low.
When the case count is small, a large fraction of cases may be
We assume that the effect of each NPI on Rt,c is stable
imported from other countries and the testing regime may
across time but can vary across countries to some degree.
change rapidly. To prevent this from biasing our model, we
Concretely, the effect parameter of intervention i in country
neglected case numbers before a country has reached 100
c is defined as αi,c = αi + zi,c, where αi represents the mean
confirmed cases and death numbers before a country has
reached 10 deaths. We included these thresholds in our sen- effect parameter, and zi , c ~ (0, σi2 ) . The variance σi2 corre-
sitivity analysis (fig. S13). sponds to the degree of cross-country variation in the effec-
tiveness of NPI i and is inferred from the data. This partial
Short model description pooling of NPI effect parameters minimizes bias from coun-
In this section, we give a short summary of the model (Fig. try-specific sources while also reflecting that NPI effective-
5). The detailed model description is given in the supplemen- ness is likely different across countries. We define the
tary text section A. In short, our model uses case and death “effectiveness” of NPI i as the percentage reduction in Rt as-
data from each country to “backward” infer the number of sociated with NPI i across countries. This effectiveness, dis-
new infections at each point in time, which is itself used to played in Figs. 2 to 4, is computed as 1 – exp(–(αi + zi)), where
infer the reproduction numbers. NPI effects are then again zi ~ (0, σi2 ) and σi2 is drawn from its posterior. We
First release: 15 December 2020 www.sciencemag.org (Page numbers not final at time of first release) 5place an asymmetric Laplace prior on αi that allows for both 3. S. Hsiang, D. Allen, S. Annan-Phan, K. Bell, I. Bolliger, T. Chong, H. Druckenmiller, L.
Y. Huang, A. Hultgren, E. Krasovich, P. Lau, J. Lee, E. Rolf, J. Tseng, T. Wu, The
positive and negative effects but places 80% of its probability
effect of large-scale anti-contagion policies on the COVID-19 pandemic. Nature
mass on positive effects, reflecting that NPIs are more likely 584, 262–267 (2020). doi:10.1038/s41586-020-2404-8 Medline
to reduce Rt,c than to increase it. 4. S. Lai, N. W. Ruktanonchai, L. Zhou, O. Prosper, W. Luo, J. R. Floyd, A. Wesolowski,
In the early phase of an epidemic, the number of new daily M. Santillana, C. Zhang, X. Du, H. Yu, A. J. Tatem, Effect of non-pharmaceutical
interventions to contain COVID-19 in China. Nature 585, 410–413 (2020).
infections grows exponentially. During exponential growth,
doi:10.1038/s41586-020-2293-x Medline
there is a one-to-one correspondence between the daily 5. Y. Liu, C. Morgenstern, J. Kelly, R. Lowe, CMMID COVID-19 Working Group, M. Jit,
growth rate and Rt,c (44). The correspondence depends on the The impact of non-pharmaceutical interventions on SARS-CoV-2 transmission
generation interval (the time between successive infections across 130 countries and territories. medRxiv 2020.08.11.20172643v1 [Preprint].
12 August 2020. https://doi.org/10.1101/2020.08.11.20172643.
in a chain of transmission), which we assume to have a
6. N. Banholzer, E. van Weenen, B. Kratzwald, A. Seeliger, D. Tschernutter, P.
gamma distribution. The prior on the mean generation inter- Bottrighi, A. Cenedese, J. Puig Salles, W. Vach, S. Feuerriegel, Impact of non-
val has a mean of 5.06 days, derived from a meta-analysis pharmaceutical interventions on documented cases of COVID-19. medRxiv
(45). 2020.04.16.20062141v3 [Preprint]. 28 April 2020.
https://doi.org/10.1101/2020.04.16.20062141.
We model the daily new infection count separately for
7. N. Islam, S. J. Sharp, G. Chowell, S. Shabnam, I. Kawachi, B. Lacey, J. M. Massaro,
confirmed cases and deaths, representing those infections R. B. D’Agostino Sr., M. White, Physical distancing interventions and incidence of
Downloaded from http://science.sciencemag.org/ on May 7, 2021
which are subsequently reported and those which are subse- coronavirus disease 2019: Natural experiment in 149 countries. BMJ 370, m2743
quently fatal. However, both infection numbers are assumed (2020). doi:10.1136/bmj.m2743 Medline
8. X. Chen, Z. Qiu, Scenario analysis of non-pharmaceutical interventions on global
to grow at the same daily rate in expectation, allowing the
COVID-19 transmissions. Covid Economics 7, 46–67 (2020).
use of both data sources to estimate each αi. The infection 9. K. Soltesz, F. Gustafsson, T. Timpka, J. Jalden, C. Jidling, A. Heimerson, T. B. Schon,
numbers translate into reported confirmed cases and deaths A. Spreco, J. Ekberg, O. Dahlstrom, F. Bagge Carlson, A. Joud, B. Bernhardsson,
after a delay. The delay is the sum of two independent distri- On the sensitivity of non-pharmaceutical intervention models for SARS-CoV-2
spread estimation. medRxiv 2020.06.10.20127324 [Preprint]. 12 June 2020.
butions, assumed to be equal across countries: the incubation
https://doi.org/10.1101/2020.06.10.20127324.
period and the delay from onset of symptoms to confirma- 10. M. Sharma, S. Mindermann, J. M. Brauner, G. Leech, A. B. Stephenson, T.
tion. We put priors over the means of both distributions, re- Gavenčiak, J. Kulveit, Y. W. Teh, L. Chindelevitch, Y. Gal, How robust are the
sulting in a prior over the mean infection-to-confirmation estimated effects of nonpharmaceutical interventions against COVID-19?
arXiv:2007.13454 [stat.AP] (27 July 2020).
delay with a mean of 10.92 days (45), see supplementary text
11. C. Cheng, J. Barceló, A. S. Hartnett, R. Kubinec, L. Messerschmidt, COVID-19
section A.3. Similarly, the infection-to-death delay is the sum government response event dataset (CoronaNet v. 1.0). Nat. Hum. Behav. 4, 756–
of the incubation period and the delay from onset of symp- 768 (2020). doi:10.1038/s41562-020-0909-7 Medline
toms to death, and the prior over its mean has a mean of 21.8 12. Oxford COVID-19 Government Response Tracker (OxCGRT) (2020);
https://github.com/OxCGRT/covid-policy-tracker.
days (45). Finally, as in related models (1, 6), both the re-
13. E. Dong, H. Du, L. Gardner, An interactive web-based dashboard to track COVID-19
ported cases and deaths follow a negative binomial output in real time. Lancet Infect. Dis. 20, 533–534 (2020). doi:10.1016/S1473-
distribution with separate inferred dispersion parameters for 3099(20)30120-1 Medline
cases and deaths. 14. J. M. Brauner, S. Mindermann, M. Sharma, D. Johnston, J. Salvatier, T. Gavenčiak,
A. B. Stephenson, G. Leech, G. Altman, V. Mikulik, A. J. Norman, J. T. Monrad, T.
Using a Markov chain Monte Carlo (MCMC) sampling al-
Besiroglu, H. Ge, M. A. Hartwick, Y. W. The, L. Chindelevitch, Y. Gal, J. Kulveit,
gorithm (46), this model infers posterior distributions of each epidemics/COVIDNPIs: Inferring the effectiveness of government interventions
NPI’s effectiveness while accounting for cross-country varia- against COVID-19, Zenodo (2020); https://doi.org/10.5281/zenodo.4268449.
tions in effectiveness, reporting, and fatality rates as well as 15. C. Winship, B. Western, Multicollinearity and model misspecification. Sociol. Sci. 3,
627–649 (2016). doi:10.15195/v3.a27
uncertainty in the generation interval and delay distribu-
16. EpidemicForecasting.org, Mitigation calculator (2020);
tions. To analyze the extent to which modeling assumptions http://epidemicforecasting.org/calc.
affect the results, our sensitivity analysis included all epide- 17. T. C. Jones, B. Mühlemann, T. Veith, G. Biele, M. Zuchowski, J. Hoffmann, A. Stein,
miological parameters, prior distributions, and many of the A. Edelmann, V. M. Corman, C. Drosten, An analysis of SARS-CoV-2 viral load by
patient age. medRxiv 2020.06.08.20125484v1 [Preprint]. 9 June 2020.
structural assumptions introduced above. MCMC conver-
https://doi.org/10.1101/2020.06.08.20125484.
gence statistics are shown in fig. S19. 18. A. G. L’Huillier, G. Torriani, F. Pigny, L. Kaiser, I. Eckerle, Culture-competent SARS-
CoV-2 in nasopharynx of symptomatic neonates, children, and adolescents.
REFERENCES AND NOTES
Emerg. Infect. Dis. 26, 2494–2497 (2020). doi:10.3201/eid2610.202403 Medline
1. S. Flaxman, S. Mishra, A. Gandy, H. J. T. Unwin, T. A. Mellan, H. Coupland, C.
19. The Independent Scientific Advisory Group for Emergencies (SAGE), The
Whittaker, H. Zhu, T. Berah, J. W. Eaton, M. Monod, A. C. Ghani, C. A. Donnelly, S.
Independent SAGE Report 3, “When should a school reopen? Final report” (2020);
Riley, M. A. C. Vollmer, N. M. Ferguson, L. C. Okell, S. Bhatt; Imperial College
www.independentsage.org/wp-content/uploads/2020/06/Independent-Sage-
COVID-19 Response Team, Estimating the effects of non-pharmaceutical
Brief-Report-on-Schools.pdf.
interventions on COVID-19 in Europe. Nature 584, 257–261 (2020).
20. Y. J. Park, Y. J. Choe, O. Park, S. Y. Park, Y.-M. Kim, J. Kim, S. Kweon, Y. Woo, J.
doi:10.1038/s41586-020-2405-7 Medline
Gwack, S. S. Kim, J. Lee, J. Hyun, B. Ryu, Y. S. Jang, H. Kim, S. H. Shin, S. Yi, S. Lee,
2. J. Dehning, J. Zierenberg, F. P. Spitzner, M. Wibral, J. P. Neto, M. Wilczek, V.
H. K. Kim, H. Lee, Y. Jin, E. Park, S. W. Choi, M. Kim, J. Song, S. W. Choi, D. Kim, B.-
Priesemann, Inferring change points in the spread of COVID-19 reveals the
H. Jeon, H. Yoo, E. K. Jeong; COVID-19 National Emergency Response Center,
effectiveness of interventions. Science 369, eabb9789 (2020).
Epidemiology and Case Management Team, Contact tracing during coronavirus
doi:10.1126/science.abb9789 Medline
First release: 15 December 2020 www.sciencemag.org (Page numbers not final at time of first release) 6disease outbreak, South Korea, 2020. Emerg. Infect. Dis. 26, 2465–2468 (2020). O’Reilly, A. Endo, J. Hellewell, E. S. Nightingale, B. J. Quilty, C. I. Jarvis, T. W.
doi:10.3201/eid2610.201315 Medline Russell, P. Klepac, N. I. Bosse, S. Funk, S. Abbott, G. F. Medley, H. Gibbs, C. A. B.
21. N. S. Mehta, O. T. Mytton, E. W. S. Mullins, T. A. Fowler, C. L. Falconer, O. B. Murphy, Pearson, S. Flasche, M. Jit, S. Clifford, K. Prem, C. Diamond, J. Emery, A. K. Deol,
C. Langenberg, W. J. P. Jayatunga, D. H. Eddy, J. S. Nguyen-Van-Tam, SARS-CoV- S. R. Procter, K. van Zandvoort, Y. F. Sun, J. D. Munday, A. Rosello, M. Auzenbergs,
2 (COVID-19): What do we know about children? A systematic review. Clin. Infect. G. Knight, R. M. G. J. Houben, Y. Liu; Centre for the Mathematical Modelling of
Dis. 71, 2469–2479 (2020). 10.1093/cid/ciaa556 Medline Infectious Diseases COVID-19 working group, Effects of non-pharmaceutical
22. P. Zimmermann, N. Curtis, Coronavirus infections in children including COVID-19: interventions on COVID-19 cases, deaths, and demand for hospital services in the
An overview of the epidemiology, clinical features, diagnosis, treatment and UK: A modelling study. Lancet Public Health 5, e375–e385 (2020).
prevention options in children. Pediatr. Infect. Dis. J. 39, 355–368 (2020). doi:10.1016/S2468-2667(20)30133-X Medline
doi:10.1097/INF.0000000000002660 Medline 35. X. Hao, S. Cheng, D. Wu, T. Wu, X. Lin, C. Wang, Reconstruction of the full
23. Office for National Statistics, Coronavirus (COVID-19) Infection Survey, UK: 6 transmission dynamics of COVID-19 in Wuhan. Nature 584, 420–424 (2020).
November 2020 (2020); doi:10.1038/s41586-020-2554-8 Medline
www.ons.gov.uk/peoplepopulationandcommunity/healthandsocialcare/conditi 36. N. W. Ruktanonchai, J. R. Floyd, S. Lai, C. W. Ruktanonchai, A. Sadilek, P. Rente-
onsanddiseases/bulletins/coronaviruscovid19infectionsurveypilot/6november2 Lourenco, X. Ben, A. Carioli, J. Gwinn, J. E. Steele, O. Prosper, A. Schneider, A.
020. Oplinger, P. Eastham, A. J. Tatem, Assessing the impact of coordinated COVID-19
24. A. Aleta, Y. Moreno, Age different analysis of COVID-19 second wave in Europe exit strategies across Europe. Science 369, 1465–1470 (2020).
reveals highest incidence amongst young adults. medRxiv 2020.11.11.20230177 doi:10.1126/science.abc5096 Medline
[Preprint]. 13 November 2020. https://doi.org/10.1101/2020.11.11.20230177. 37. The countries were selected for the availability of reliable NPI data at the time
25. M. Levinson, M. Cevik, M. Lipsitch, Reopening primary schools during the when we started data collection and modelling (April 2020); and for their presence
Downloaded from http://science.sciencemag.org/ on May 7, 2021
pandemic. N. Engl. J. Med. 383, 981–985 (2020). doi:10.1056/NEJMms2024920 in at least one of the public datasets that we used to cross-validate our collected
Medline data. We excluded countries with fewer than 100 cases (or 10 deaths) by March
26. J. Couzin-Frankel, G. Vogel, M. Weiland, School openings across globe suggest 31, as our model neglects new cases and deaths below these thresholds. We also
ways to keep coronavirus at bay, despite outbreaks. Science excluded a small number of countries if there were credible media reports casting
10.1126/science.abd7107 (2020). doi:10.1126/science.abd7107. doubt on the trustworthiness of their reporting of cases and deaths. Finally, we
27. A. Fontanet, L. Tondeur, Y. Madec, R. Grant, C. Besombes, N. Jolly, S. Fernandes excluded very large countries like China, the United States, and Canada, for ease
Pellerin, M.-N. Ungeheuer, I. Cailleau, L. Kuhmel, S. Temmam, C. Huon, K.-Y. Chen, of data collection, as these would require more locally fine-grained data. Of the 41
B. Crescenzo, S. Munier, C. Demeret, L. Grzelak, I. Staropoli, T. Bruel, P. Gallian, S. included countries, 33 are in Europe. As a result, the NPI effectiveness estimates
Cauchemez, S. van der Werf, O. Schwartz, M. Eloit, B. Hoen, Cluster of COVID-19 may be biased toward effects in Europe, and NPI effectiveness may have been
in northern France: A retrospective closed cohort study. medRxiv different in other parts of the world.
2020.04.18.20071134 [Preprint]. 23 April 2020. 38. Concretely, the window of analysis extended until 2 days after the first reopening
https://doi.org/10.1101/2020.04.18.20071134. for confirmed cases, and 10 days after the first reopening for deaths. These
28. C. Stein-Zamir, N. Abramson, H. Shoob, E. Libal, M. Bitan, T. Cardash, R. Cayam, I. durations correspond to the 5% quantiles of the infection-to-case-confirmation
Miskin, A large COVID-19 outbreak in a high school 10 days after schools’ and infection-to-death distributions, ensuring that less than 5% of the new
reopening, Israel, May 2020. Euro Surveill. 25, 2001352 (2020). infections on the reopening day or later were observed in the window of analysis.
doi:10.2807/1560-7917.ES.2020.25.29.2001352 Medline 39. We evaluated the following datasets: the Oxford COVID-19 Government Response
29. K. Sun, W. Wang, L. Gao, Y. Wang, K. Luo, L. Ren, Z. Zhan, X. Chen, S. Zhao, Y. Tracker (OxCGRT), the Epidemic Forecasting Global NPI Database, and the
Huang, Q. Sun, Z. Liu, M. Litvinova, A. Vespignani, M. Ajelli, C. Viboud, H. Yu, ACAPS #COVID19 Government Measures Dataset. Note that these datasets are
Transmission heterogeneities, kinetics, and controllability of SARS-CoV-2. under continuous development. Many of the mistakes found will already have
Science 10.1126/science.abe2424 (2020). doi:10.1126/science.abe2424 Medline been corrected. We know from our own experience that data collection can be very
30. University and College Union, COVID-19 case dashboard (2020); challenging. We have the fullest respect for the people behind these datasets. In
www.ucu.org.uk/covid-dashboard. this paper, we focus on a more limited set of countries and NPIs than these
31. T. Colbourn, W. Waites, J. Panovska-Griffiths, D. Manheim, S. Sturniolo, G. datasets contain, allowing us to ensure higher data quality in this subset. Given
Colbourn, C. Bowie, K. M. Godfrey, J. Peto, R. A. Burgess, D. Foster, D. McCoy, N. our experience with public datasets and our data collection, we encourage fellow
A. Alwan, G. Yao, K. Ouyang, P. J. Roderick, E. Pizzo, T. Hill, N. McGrath, M. Orcutt, COVID-19 researchers to independently verify the quality of public data they use,
O. Evans, N. J. Cheetham, M. Sculpher, C. Bonell, M. Gomes, R. Raine, Modelling if feasible.
the health and economic impacts of population-wide testing, contact tracing and 40. EpidemicForecasting.org, Epidemic forecasting global NPI database (2020);
isolation (PTTI) strategies for COVID-19 in the UK. SSRN 10.2139/ssrn.3627273 http://epidemicforecasting.org/datasets.
(2020). doi:10.2139/ssrn.3627273 41. T. Hale, S. Webster, A. Petherick, T. Phillips, B. Kira, Oxford COVID-19 Government
32. K. Prem, Y. Liu, T. W. Russell, A. J. Kucharski, R. M. Eggo, N. Davies, M. Jit, P. Response Tracker, Blavatnik School of Government (2020);
Klepac; Centre for the Mathematical Modelling of Infectious Diseases COVID-19 www.bsg.ox.ac.uk/research/research-projects/coronavirus-government-
Working Group, The effect of control strategies to reduce social mixing on response-tracker.
outcomes of the COVID-19 epidemic in Wuhan, China: A modelling study. Lancet 42. S. Abbott, J. Hellewell, R. N. Thompson, K. Sherratt, H. P. Gibbs, N. I. Bosse, J. D.
Public Health 5, e261–e270 (2020). doi:10.1016/S2468-2667(20)30073-6 Munday, S. Meakin, E. L. Doughty, J. Y. Chun, Y.-W. D. Chan, F. Finger, P. Campbell,
Medline A. Endo, C. A. B. Pearson, A. Gimma, T. Russell, S. Flasche, A. J. Kucharski, R. M.
33. P. G. T. Walker, C. Whittaker, O. J. Watson, M. Baguelin, P. Winskill, A. Hamlet, B. Eggo, S. Funk, Estimating the time-varying reproduction number of SARS-CoV-2
A. Djafaara, Z. Cucunubá, D. Olivera Mesa, W. Green, H. Thompson, S. Nayagam, using national and subnational case counts. Wellcome Open Res. 5, 112 (2020).
K. E. C. Ainslie, S. Bhatia, S. Bhatt, A. Boonyasiri, O. Boyd, N. F. Brazeau, L. doi:10.12688/wellcomeopenres.16006.2
Cattarino, G. Cuomo-Dannenburg, A. Dighe, C. A. Donnelly, I. Dorigatti, S. L. van 43. S. Yadav, P. K. Yadav, Basic reproduction rate and case fatality rate of COVID-19:
Elsland, R. FitzJohn, H. Fu, K. A. M. Gaythorpe, L. Geidelberg, N. Grassly, D. Haw, Application of meta-analysis. medRxiv 2020.05.13.20100750v1 [Preprint]. 16
S. Hayes, W. Hinsley, N. Imai, D. Jorgensen, E. Knock, D. Laydon, S. Mishra, G. May 2020. https://doi.org/10.1101/2020.05.13.20100750.
Nedjati-Gilani, L. C. Okell, H. J. Unwin, R. Verity, M. Vollmer, C. E. Walters, H. Wang, 44. J. Wallinga, M. Lipsitch, How generation intervals shape the relationship between
Y. Wang, X. Xi, D. G. Lalloo, N. M. Ferguson, A. C. Ghani, The impact of COVID-19 growth rates and reproductive numbers. Proc. Biol. Sci. 274, 599–604 (2007).
and strategies for mitigation and suppression in low- and middle-income doi:10.1098/rspb.2006.3754 Medline
countries. Science 369, 413–422 (2020). doi:10.1126/science.abc0035 Medline 45. E. S. Fonfria, M. I. Vigo, D. Garcia-Garcia, Z. Herrador, M. Navarro, C. Bordehore,
34. N. G. Davies, A. J. Kucharski, R. M. Eggo, A. Gimma, W. J. Edmunds, T. Jombart, K. Essential epidemiological parameters of COVID-19 for clinical and mathematical
First release: 15 December 2020 www.sciencemag.org (Page numbers not final at time of first release) 7modeling purposes: a rapid review and meta-analysis. medRxiv Ferguson, S. Riley, A simple approach to measure transmissibility and forecast
2020.06.17.20133587v1 [Preprint]. 19 June 2020. incidence. Epidemics 22, 29–35 (2018). doi:10.1016/j.epidem.2017.02.012
https://doi.org/10.1101/2020.06.17.20133587. Medline
46. M. D. Hoffman, A. Gelman, The No-U-Turn Sampler: Adaptively setting path 62. S. Cauchemez, A.-J. Valleron, P.-Y. Boëlle, A. Flahault, N. M. Ferguson, Estimating
lengths in Hamiltonian Monte Carlo. J. Mach. Learn. Res. 15, 1593–1623 (2014). the impact of school closure on influenza transmission from Sentinel data. Nature
47. Y. Liu, A. A. Gayle, A. Wilder-Smith, J. Rocklöv, The reproductive number of COVID- 452, 750–754 (2008). doi:10.1038/nature06732 Medline
19 is higher compared to SARS coronavirus. J. Travel Med. 27, taaa021 (2020). 63. P. R. Rosenbaum, D. B. Rubin, Assessing sensitivity to an unobserved binary
doi:10.1093/jtm/taaa021 Medline covariate in an observational study with binary outcome. J. R. Stat. Soc. B 45, 212–
48. S. Flaxman, S. Mishra, A. Gandy, H. J. T. Unwin, T. A. Mellan, H. Coupland, C. 218 (1983). doi:10.1111/j.2517-6161.1983.tb01242.x
Whittaker, H. Zhu, T. Berah, J. W. Eaton, M. Monod, Imperial College COVID-19 64. J. M. Robins, A. Rotnitzky, D. O. Scharfstein, “Sensitivity analysis for selection bias
Response Team, A. C. Ghani, C. A. Donnelly, S. Riley, M. A. C. Vollmer, N. M. and unmeasured confounding in missing data and causal inference models” in
Ferguson, L. C. Okell, S. Bhatt, Code for modelling estimated deaths and cases for Statistical Models in Epidemiology, the Environment, and Clinical Trials, M. E.
COVID-19 from report 13 published by MRC Centre for Global Infectious Disease Halloran, D. Berry, Eds. (Springer, 2000), pp. 1–94.
Analysis, Imperial College London: Estimating the number of infections and the 65. A. Gelman, J. Hill, “Causal inference using regression on the treatment variable”
impact of nonpharmaceutical interventions on COVID-19 in 11 European countries in Data Analysis Using Regression and Multilevel/Hierarchical Models (Cambridge
(2020); https://mrc-ide.github.io/covid19estimates/#/interventions/. Univ. Press, 2007), pp. 167–198.
49. S. T. Ali, L. Wang, E. H. Y. Lau, X.-K. Xu, Z. Du, Y. Wu, G. M. Leung, B. J. Cowling, 66. C. E. Rasmussen, “Gaussian processes in machine learning” in Summer School on
Serial interval of SARS-CoV-2 was shortened over time by nonpharmaceutical Machine Learning, O. Bousquet, U. von Luxburg, G. Rätsch, Eds. (Springer, 2003),
interventions. Science 369, 1106–1109 (2020). doi:10.1126/science.abc9004 pp. 63–71.
Downloaded from http://science.sciencemag.org/ on May 7, 2021
Medline 67. B. Xu, B. Gutierrez, S. Mekaru, K. Sewalk, L. Goodwin, A. Loskill, E. L. Cohn, Y.
50. C. Fraser, Estimating individual and household reproduction numbers in an Hswen, S. C. Hill, M. M. Cobo, A. E. Zarebski, S. Li, C.-H. Wu, E. Hulland, J. D.
emerging epidemic. PLOS ONE 2, e758 (2007). Morgan, L. Wang, K. O’Brien, S. V. Scarpino, J. S. Brownstein, O. G. Pybus, D. M.
doi:10.1371/journal.pone.0000758 Medline Pigott, M. U. G. Kraemer, Epidemiological data from the COVID-19 outbreak, real-
51. J. Salvatier, T. V. Wiecki, C. Fonnesbeck, Probabilistic programming in python time case information. Sci. Data 7, 106 (2020). doi:10.1038/s41597-020-0448-0
using PyMC3. PeerJ Comput. Sci. 2, e55 (2016). doi:10.7717/peerj-cs.55 Medline
52. L. Ferretti, C. Wymant, M. Kendall, L. Zhao, A. Nurtay, L. Abeler-Dörner, M. Parker, 68. J. Naude, B. Mellado, J. Choma, F. Correa, S. Dahbi, B. Dwolatzky, L. Dwolatzky, K.
D. Bonsall, C. Fraser, Quantifying SARS-CoV-2 transmission suggests epidemic Hayasi, B. Lieberman, C. Maslo, K. Monnakgotla, X. Ruan, F. Stevenson, Worldwide
control with digital contact tracing. Science 368, eabb6936 (2020). effectiveness of various non-pharmaceutical intervention control strategies on
doi:10.1126/science.abb6936 Medline the global COVID-19 pandemic: A linearised control model. medRxiv
53. S. A. Lauer, K. H. Grantz, Q. Bi, F. K. Jones, Q. Zheng, H. R. Meredith, A. S. Azman, 2020.04.30.20085316v2 [Preprint]. 12 May 2020.
N. G. Reich, J. Lessler, The incubation period of coronavirus disease 2019 (COVID- https://doi.org/10.1101/2020.04.30.20085316.
19) from publicly reported confirmed cases: Estimation and application. Ann. 69. R. Dandekar, G. Barbastathis, Neural network aided quarantine control model
Intern. Med. 172, 577–582 (2020). doi:10.7326/M20-0504 Medline estimation of global COVID-19 spread. arXiv:2004.02752 [q-bio.PE] (2 April
54. D. Cereda, M. Tirani, F. Rovida, V. Demicheli, M. Ajelli, P. Poletti, F. Trentini, G. 2020).
Guzzetta, V. Marziano, A. Barone, M. Magoni, S. Deandrea, G. Diurno, M. 70. M. Gatto, E. Bertuzzo, L. Mari, S. Miccoli, L. Carraro, R. Casagrandi, A. Rinaldo,
Lombardo, M. Faccini, A. Pan, R. Bruno, E. Pariani, G. Grasselli, A. Piatti, M. Spread and dynamics of the COVID-19 epidemic in Italy: Effects of emergency
Gramegna, F. Baldanti, A. Melegaro, S. Merler, The early phase of the COVID-19 containment measures. Proc. Natl. Acad. Sci. U.S.A. 117, 10484–10491 (2020).
outbreak in Lombardy, Italy. arXiv:2003.09320v1 [q-bio.PE] (20 March 2020). doi:10.1073/pnas.2004978117 Medline
55. N. M. Linton, T. Kobayashi, Y. Yang, K. Hayashi, A. R. Akhmetzhanov, S. M. Jung, 71. C. I. Jarvis, K. Van Zandvoort, A. Gimma, K. Prem, P. Klepac, G. J. Rubin, W. J.
B. Yuan, R. Kinoshita, H. Nishiura, Incubation period and other epidemiological Edmunds; CMMID COVID-19 working group, Quantifying the impact of physical
characteristics of 2019 novel coronavirus infections with right truncation: A distance measures on the transmission of COVID-19 in the UK. BMC Med. 18, 124
statistical analysis of publicly available case data. J. Clin. Med. 9, 538 (2020). (2020). doi:10.1186/s12916-020-01597-8 Medline
doi:10.3390/jcm9020538 Medline 72. M. U. G. Kraemer, C.-H. Yang, B. Gutierrez, C.-H. Wu, B. Klein, D. M. Pigott, L. du
56. A. Gelman, J. B. Carlin, H. S. Stern, D. B. Rubin, “Model checking and Plessis, N. R. Faria, R. Li, W. P. Hanage, J. S. Brownstein, M. Layan, A. Vespignani,
improvement” in Bayesian Data Analysis (Chapman & Hall/CRC Texts in H. Tian, C. Dye, O. G. Pybus, S. V. Scarpino; Open COVID-19 Data Working Group,
Statistical Science, Taylor & Francis, ed. 2, 2003). The effect of human mobility and control measures on the COVID-19 epidemic in
57. A. Gelman, J. Hwang, A. Vehtari, Understanding predictive information criteria for China. Science 368, 493–497 (2020). doi:10.1126/science.abb4218 Medline
Bayesian models. Stat. Comput. 24, 997–1016 (2013). doi:10.1007/s11222-013- 73. A. J. Kucharski, T. W. Russell, C. Diamond, Y. Liu, J. Edmunds, S. Funk, R. M. Eggo,
9416-2 F. Sun, M. Jit, J. D. Munday, N. Davies, A. Gimma, K. van Zandvoort, H. Gibbs, J.
58. C. F. Dormann, J. Elith, S. Bacher, C. Buchmann, G. Carl, G. Carré, J. R. G. Marquéz, Hellewell, C. I. Jarvis, S. Clifford, B. J. Quilty, N. I. Bosse, S. Abbott, P. Klepac, S.
B. Gruber, B. Lafourcade, P. J. Leitão, T. Münkemüller, C. McClean, P. E. Osborne, Flasche; Centre for Mathematical Modelling of Infectious Diseases COVID-19
B. Reineking, B. Schröder, A. K. Skidmore, D. Zurell, S. Lautenbach, Collinearity: A working group, Early dynamics of transmission and control of COVID-19: A
review of methods to deal with it and a simulation study evaluating their mathematical modelling study. Lancet Infect. Dis. 20, 553–558 (2020).
performance. Ecography 36, 27–46 (2013). doi:10.1111/j.1600- doi:10.1016/S1473-3099(20)30144-4 Medline
0587.2012.07348.x 74. L. Lorch, W. Trouleau, S. Tsirtsis, A. Szanto, B. Schölkopf, M. Gomez-Rodriguez, A
59. T. W. Russell, N. Golding, J. Hellewell, S. Abbott, L. Wright, C. A. B. Pearson, K. van spatiotemporal epidemic model to quantify the effects of contact tracing, testing,
Zandvoort, C. I. Jarvis, H. Gibbs, Y. Liu, R. M. Eggo, W. J. Edmunds, A. J. Kucharski; and containment. arXiv:2004.07641 [cs.LG] (15 April 2020).
CMMID COVID-19 working group, Reconstructing the early global dynamics of 75. B. F. Maier, D. Brockmann, Effective containment explains subexponential growth
under-ascertained COVID-19 cases and infections. BMC Med. 18, 332 (2020). in recent confirmed COVID-19 cases in China. Science 368, 742–746 (2020).
doi:10.1186/s12916-020-01790-9 Medline doi:10.1126/science.abb4557 Medline
60. A. Cori, N. M. Ferguson, C. Fraser, S. Cauchemez, A new framework and software 76. L. Orea, I. Álvarez, “How effective has been the Spanish lockdown to battle COVID-
to estimate time-varying reproduction numbers during epidemics. Am. J. 19? A spatial analysis of the coronavirus propagation across provinces” (Tech.
Epidemiol. 178, 1505–1512 (2013). doi:10.1093/aje/kwt133 Medline Rep. Working Paper 2020-03, FEDEA, 2020).
61. P. Nouvellet, A. Cori, T. Garske, I. M. Blake, I. Dorigatti, W. Hinsley, T. Jombart, H. 77. B. J. Quilty, C. Diamond, Y. Liu, H. Gibbs, T. W. Russell, C. I. Jarvis, K. Prem, C. A. B.
L. Mills, G. Nedjati-Gilani, M. D. Van Kerkhove, C. Fraser, C. A. Donnelly, N. M. Pearson, S. Clifford, S. Flasche, CMMID COVID-19 working group, P. Klepac, R. M.
First release: 15 December 2020 www.sciencemag.org (Page numbers not final at time of first release) 8Eggo, M. Jit, The effect of inter-city travel restrictions on geographical spread of 21 July 2020; resubmitted 25 September 2020
COVID-19: Evidence from Wuhan, China. medRxiv 2020.04.16.20067504v1 Accepted 8 December 2020
[Preprint]. 21 April 2020. https://doi.org/10.1101/2020.04.16.20067504. Published online 15 December 2020
78. S. B. Villas-Boas, J. Sears, M. Villas-Boas, V. Villas-Boas, Are we #StayingHome to 10.1126/science.abd9338
flatten the curve? (Tech. Rep. CUDARE Working Papers, UC Berkeley: Department
of Agricultural and Resource Economics, 2020);
https://escholarship.org/uc/item/5h97n884.
79. M. J. Siedner, G. Harling, Z. Reynolds, R. F. Gilbert, S. Haneuse, A. S.
Venkataramani, A. C. Tsai, Social distancing to slow the US COVID-19 epidemic:
Longitudinal pretest-posttest comparison group study. PLOS Med. 17, e1003244
(2020). doi:10.1371/journal.pmed.1003244 Medline
ACKNOWLEDGMENTS
We thank J. Lagerros for operational support and for introducing some of the
authors to each other. We thank M. Balatsko, M. Pukaj, and T. Witzany for
developing the interactive website. We thank T. Groemer, G. Krönke, and M.
Herrmann for advice and mentorship. Funding: J.M.B. was supported by the
EPSRC Centre for Doctoral Training in Autonomous Intelligent Machines and
Downloaded from http://science.sciencemag.org/ on May 7, 2021
Systems (EP/S024050/1) and by Cancer Research UK. S.M.’s funding for
graduate studies was from Oxford University and DeepMind. M.S. was supported
by the EPSRC Centre for Doctoral Training in Autonomous Intelligent Machines
and Systems (EP/S024050/1). G.L. was supported by the UKRI Centre for
Doctoral Training in Interactive Artificial Intelligence (EP/S022937/1). V.M.
contributed in his personal time while employed at DeepMind. L.C. acknowledges
funding from the MRC Centre for Global Infectious Disease Analysis (reference
MR/R015600/1), jointly funded by the UK Medical Research Council (MRC) and
the UK Foreign, Commonwealth & Development Office (FCDO), under the
MRC/FCDO Concordat agreement and is also part of the EDCTP2 program
supported by the European Union; and acknowledges funding by Community
Jameel. Y.W.T. is also a principal research scientist at DeepMind. The paid
contractor work helping with the data collection, the development of the
interactive website, and the costs for cloud compute were funded by the
Berkeley Existential Risk Initiative. Author contributions: D.J., J.M.B., J.K., G.A.,
A.J.N., J.T.M., G.L., and V.M. designed and conducted the NPI data collection.
S.M., M.S., J.M.B., A.B.S., H.G., Y.W.T., Y.G., J.K., T.G., J.S., V.M., M.A.H., and L.C.
designed the model and modeling experiments. M.S., A.B.S., T.G., and J.S.
performed and analyzed the modeling experiments. J.M.B., S.M., M.S., J.K., and
T.G. conceived the research. S.M., M.S., J.M.B., L.C., J.K., and T.B. did the
literature search. J.M.B., S.M., M.S., G.L., L.C., T.B., and V.M. wrote the
manuscript. All authors read and gave feedback on the manuscript and approved
the final manuscript. J.M.B., S.M., and M.S. contributed equally. L.C., Y.G., and
J.K. contributed equally to senior authorship. Competing interests: No conflicts
of interests. L.C. has acted as a paid consultant to Pfizer and the Foundation for
Innovative New Diagnostics, outside of the submitted work. Y.G. has received a
research grant (studentship) from GlaxoSmithKline, outside of the submitted
work. J.K. has advised several governmental and nongovernmental entities
about interventions against COVID-19. Data and materials availability: All data
and code are available in the paper or publicly online at (14). This work is licensed
under a Creative Commons Attribution 4.0 International (CC BY 4.0) license,
which permits unrestricted use, distribution, and reproduction in any medium,
provided the original work is properly cited. To view a copy of this license, visit
https://creativecommons.org/licenses/by/4.0/. This license does not apply to
figures/photos/artwork or other content included in the article that is credited
to a third party; obtain authorization from the rights holder before using such
material.
SUPPLEMENTARY MATERIALS
science.sciencemag.org/cgi/content/full/science.abd9338/DC1
Supplementary Text
Figs. S1 to S24
Tables S1 to S8
References (47–79)
MDAR Reproducibility Checklist
First release: 15 December 2020 www.sciencemag.org (Page numbers not final at time of first release) 9You can also read