The Effect of Superstition on Health: Evidence from the Taiwanese Ghost Month - IZA DP No. 12066 JANUARY 2019
←
→
Page content transcription
If your browser does not render page correctly, please read the page content below
DISCUSSION PAPER SERIES

IZA DP No. 12066

The Effect of Superstition on Health:
Evidence from the Taiwanese Ghost
Month

Martin Halla
Chia-Lun Liu
Jin-Tan Liu

JANUARY 2019
DISCUSSION PAPER SERIES

IZA DP No. 12066

The Effect of Superstition on Health:
Evidence from the Taiwanese Ghost
Month

Martin Halla
Johannes Kepler University Linz, CDECON, IZA and Austrian Public Health Institute
Chia-Lun Liu
Lehigh University
Jin-Tan Liu
National Taiwan University and NBER

JANUARY 2019

Any opinions expressed in this paper are those of the author(s) and not those of IZA. Research published in this series may
include views on policy, but IZA takes no institutional policy positions. The IZA research network is committed to the IZA
Guiding Principles of Research Integrity.
The IZA Institute of Labor Economics is an independent economic research institute that conducts research in labor economics
and offers evidence-based policy advice on labor market issues. Supported by the Deutsche Post Foundation, IZA runs the
world’s largest network of economists, whose research aims to provide answers to the global labor market challenges of our
time. Our key objective is to build bridges between academic research, policymakers and society.
IZA Discussion Papers often represent preliminary work and are circulated to encourage discussion. Citation of such a paper
should account for its provisional character. A revised version may be available directly from the author.

                                           IZA – Institute of Labor Economics
Schaumburg-Lippe-Straße 5–9                      Phone: +49-228-3894-0
53113 Bonn, Germany                             Email: publications@iza.org                                    www.iza.org
IZA DP No. 12066 JANUARY 2019
ABSTRACT
The Effect of Superstition on Health:
Evidence from the Taiwanese Ghost
Month*
Superstition is a widespread phenomenon. We empirically examine its impact on health-
related behavior and health outcomes. We study the case of the Taiwanese Ghost month.
During this period, which is believed to increase the likelihood of bad outcomes, we observe
substantial adaptions in health-related behavior. Our identification exploits idiosyncratic
variation in the timing of the Ghost Month across Gregorian calendar years. Using high-
quality administrative data, we document for the period of the Ghost Months reductions in
mortality, hospital admissions, and births. While the effect on mortality is a quantum effect,
the latter two effects reflect changes in the timing of events. Efficient public health policy
should account for emotional and cultural factors.
JEL Classification: I12, D83, D91, Z12
Keywords: superstition, false beliefs, health, risky activities, health-care
utilization, mortality, fertility, birth outcomes
Corresponding author:
Martin Halla
Johannes Kepler University of Linz
Department of Economics
Altenbergerstraße 69
4040 Linz
Austria
E-mail: martin.halla@jku.at
* For helpful discussions and comments we would like to thank seminar participants at the Hungarian Academy of
Sciences (Centre for Social Sciences, RECENS) and the University of Hohenheim. The usual disclaimer applies. A Web
Appendix available on the corresponding author’s website provides further results referenced in the paper.1 Introduction
Historically, medicine was closely associated with superstitions, magic and religion. The
Greek physician Hippocrates laid the foundation for a rational approach to medicine.
While modern scientific medicine rejects any supernatural origin of disease, many patients
still believe in supernatural powers and superstition, or have severe misconceptions about
the origin of certain diseases and the effectiveness of treatments. For instance, the believe
that witchcraft can cause and heal diseases is widespread within developing countries in
general, and in Africa in particular (Tenkorang et al., 2011). One recent phenomenon
in high-income countries is the surge in the opposition to vaccines. The so-called “anti-
vaccine movement” is fueled by misconceptions and myths about immunizations (Chang,
2018; Hussain et al., 2018; Oster, 2018). Despite the pervasiveness of such wrong beliefs,
empirical evidence quantifying its impact on health is scarce.
In this paper, we estimate the impact of superstition on health-related behavior and
health outcomes. Our research design is based on the so-called Ghost Month. In Taiwanese
culture, the seventh lunar month is Ghost Month. According to legend, during this month,
the gates of the afterlife are opened, and ghosts roam the living world. The presence of
the ghosts is believed to increase the risks of accidents and cause a higher likelihood of bad
outcomes in general. Therefore, believers of this legend try to avoid a number of activities,
such as traveling, swimming, leaving the house after sunset, major social events, major
purchases, and supposedly even elective surgeries. According to survey data, about 72
percent of all Taiwanese participate in the Ghost Month festival, and about 66 percent
believe that ghosts that are not offered any worship will wander around.1
There are several potential channels through which the Ghost Month may affect health.
All channels are linked to the adaption of health-related behavior. The most effective
adaption would be a self-enforced restraint from (or avoidance of) certain social or eco-
nomic activities. Depending on the nature of these activities the effects on health can be
either positive of negative. The avoidance of activities involving risks or causing stress
may improve health. In contrast, adaptions in the domain of health-care utilization may
be detrimental. If followers avoid or postpone health-care services (such as surgeries or
births), they may jeopardize their health. The followers’ adaptions may also generate
spillover effects on others including non-followers. Other patients could be affected by
variation in hospital occupancy rates caused by followers. Or, on a macro-level, a reduc-
tion in the overall volume of traffic (and in related pollution) may have positive effects
on the population at a large.
We have access to high-quality administrative data, which allows us to test the effect
of the Ghost Month in different domains. First, we have access to cause-specific mortality
1
About 20 percent believe in the latter statement “yes, very much”, and about 46 percent believe “yes,
somewhat”. All figures are based on data from the Taiwan Social Change Survey. Details are provided
in Section 2.
2data. These allow us to infer on changes in activities associated with certain risks (such
as driving). Second, we can utilize information on hospital admissions to study health-
care utilization. Third, we use birth certificates to examine a potential effect on fertility
and children’s health at birth. We aim to identify an intention-to-treat (ITT) effect of
the Ghost Month, without relying on the actual behavioral adaption due to superstitious
beliefs. To identify this causal effect, we exploit the idiosyncratic timing of the Ghost
Month. The exact date of the Ghost Month is determined by the lunar calendar, which is
based on cycles of the lunar phases. Since the lunar and the Gregorian calendar are not
fully synchronized, the exact date of the Ghost Month varies in the Gregorian calendar
over years. For official and business purposes, Taiwan has adopted the Gregorian calendar
for the longest time. The traditional lunar calendar is only used to define the dates of
such festivals. Our estimation strategy is to identify the behavioral consequences of the
Ghost Month (in daily data), while controlling for Gregorian calendar day and year fixed-
effects. Thus, our identifying assumption is that the variation in timing of the Ghost
Month across Gregorian calendar years is not correlated with unobserved determinants of
our outcomes.2
Our analysis provides evidence that the Ghost Month affects mortality, the timing of
health-care utilization, and fertility. During the Ghost Month, mortality drops by about
4 percent. Since there is no evidence that deaths were shifted to the period before or after
the event, we conclude that the Ghost Month saves (yearly about 316) lives. Our analysis
of cause-specific mortalities highlights two causal mechanism. First, there is a drop in
accidental deaths by about 8 percent. This effect is stronger among younger people, who
are less likely to die from drowning or traffic accidents. Second, there is a reduction in
non-accidental deaths by about 3 percent. This effect comes from people above 60, who
are less likely to die from cerebro-cardiovascular diseases. This can be explained with
a reduction in overall activity and lower levels of stress. With respect to health-care
utilization, we estimate a reduction in hospital admission during the Ghost Month by
about 4 percent. This reduction comes exclusively from admission with surgeries (minus
9 percent) and is substantially larger for “deferrable” conditions (up to minus 20 percent).
This effect is (at least to large extent) a tempo effect, since we observe more admissions
shortly before and after the Ghost Month. Further analysis provides some evidence for
negative health effects due to this re-scheduling of surgeries. Finally, we find an effect on
fertility. Births are significantly less likely during the Ghost month (minus 4 percent),
but peak shortly before and after. This tempo effect is mainly driven by an adaption in
conception and to a much smaller degree by a manipulation in the date of birth. There
2
A comparable estimation strategy has been used in the economic literature before to identify the effect
of diurnal fasting during pregnancy on later child outcomes, which exploits that the fasting month of
Ramadan follows the lunar calendar (Almond and Mazumder, 2011; Almond, Mazumder and Van Ewijk,
2015). These papers assume that pregnancies are not timed relative to Ramadan along unobserved
determinants of health.
3are no adverse effects on birth outcomes.
Our findings contribute to two strands of literature. First, we add to the literature
on superstition. Superstition is a widespread phenomenon. Data from the World Values
Survey (WVS), covering respondents from 33 countries, shows that about 19 percent cary
a lucky charm (such as a mascot or a talisman), and about 49 percent believe that a
lucky charm can protect or help them. About two-thirds of all respondents consult a
horoscope to know about their future, and about one-third takes this into account in
their daily life. While these beliefs and behavior are negatively correlated with education,
they are present in every strata of the population (see Appendix Tables A.1 and A.2 for
descriptive statistics and a regression analysis, respectively.) These figures make clear
that superstition should not be treated as a cognitive deficit found in small parts of the
population.3
Despite the high prevalence of superstition, little is known how these false beliefs affect
market outcomes and overall welfare. The existing empirical evidence in the economics
and finance literature comes predominantly from stock markets, housing markets, and
license-plate auction markets.4 While these settings provide excellent environments to
study the effects of superstition on market outcomes, the negative welfare-consequences
are in these cases probably limited. We consider any effects on health as more relevant.
Here the analytical evidence is sparse. In the medical literature, there are a couple
of mostly descriptive papers showing that superstition affects the timing of health-care
utilization.5 Economics scholars have so far focused on the effect of superstition on the
3
Recent theoretical literature in economics and psychology considers choices influenced by superstition
as the result from wrong beliefs. These modelling approaches face the challenge to explain how wrong
beliefs (= superstition) can persist. Economic models are sparse. Most prominently, Fudenberg and
Levine (2006) show in a game-theoretic model that (some but not all) superstition can persist, even
when agents are rational. The model’s key insight is, loosely speaking, that persistence tends to arise if
superstition is about something that happens very infrequently. Psychologists suggest to use dual process
models — such as the corrective model advocated by Kahneman and Shane (2002, 2005) — to understand
why superstitious thinking is widespread. These models suggest that individuals derive their choices
using two systems: “System 1 quickly proposes intuitive answers to judgment problems as they arise, and
System 2 monitors the quality of these proposals, which it may endorse, correct or override” (Kahneman
and Shane, 2005, page. 51). If individuals explicitly recognize that their intuitive judgment was wrong,
but nevertheless maintain it, they are said to acquiesce to their intuition (Risen, 2016).
4
In the finance literature, a note by Kolb and Rodriguez (1987) started a debate, whether stock market
returns on Friday the thirteenth are different from the returns of other Fridays (Dyl and Maberly, 1988;
Chamberlain et al., 1991; Coutts, 1999; Lucey, 2001). There is evidence for an impact of numbers con-
sidered ‘lucky’ in Chinese numerology on financial decision in the Chinese initial public offering market
(Hirshleifer et al., 2018), in the Chinese real estate markets (Shum et al., 2014), as well as in the North
American market (Fortin et al., 2014). Similar findings are documented on the Russian market (Pokry-
shevskaya and Antipov, 2015). There is also a small literature on the law and economics of superstition
(summarized in Leeson (2017)), which uses rational choice theory to explain seemingly bizarre practices.
5
The outcomes under consideration are the timing of hospital discharge in Japan (Hira et al., 1998)
and Norther-Ireland (O’Reilly and Stevenson, 2000), of orthopedic surgeries in Taiwan (Chiu et al.,
2018), and the timing of death in several countries (Panesar and Goggins, 2009; Anson and Anson, 2001;
Wilches-Gutiérrez et al., 2012). With respect to accidents there is best to our knowledge only one paper.
Yang et al. (2008) present descriptive evidence that drowning deaths decrease in Taiwan during the Ghost
Month.
4timing and mode of birth. Almond, Chee, Sviatschi and Zhong (2015) provide evidence
that Chinese-American mothers manipulate the timing of birth to achieve a “lucky” or
to avoid an “unlucky” birthdate, which include the number “8” and “4”, respectively.
This skewed pattern in the timing of Chinese birth is driven by sons only. The authors
provide further evidence that the change in timing is accompanied with an increase in
the incidence of C-sections. A comparable pattern was pointed out in two papers in
the medical literature, both of which study Taiwan.6 Whether or not the change in the
timing and/or mode of birth has consequences for the children’s health remains is not
analyzed in these studies.7 We add to this literature by studying the consequences of
superstition in high-quality administrative data and providing the first comprehensive
analysis of superstition and health. In terms of outcomes, our analysis (goes beyond
the timing and mode of birth and) studies a wide array of outcomes allowing us to
infer on the effect of superstition on activities involving certain risks and all types of
inpatient health care-utilization. In contrast to the mostly descriptive studies in the
medical literature, our evidence is derived from an econometric estimation strategy that
exploits only idiosyncratic variation in the timing of superstitious behavior.
Second, we contribute more broadly to the literature on the demand for health-care
that incorporates non-rational factors (Rice, 2013; Matjasko et al., 2016). Our findings
show that false believes (driven by superstition) are an important case of bounded ratio-
nality in the domain of health. We show that superstition has far-reaching consequences
not only for health-care utilization, but also for health outcomes and even for mortality.
While our evidence is based on a specific case, we conclude more generally to pay more
attention to emotional and cultural factors in the demand for health-care. There are
several public health concerns which should be addressed with a more holistic approach.
For instance, policymakers in high-income countries have to resolve the underutilization
of vaccinations and the overutilization of antibiotics. Low-income countries face problems
such as non-pathogenic disease theories (Bennett et al., 2018), harmful belief in witchcraft
or female genital mutilation (Vogt et al., 2016).
The remainder of the paper is organized as follows. The next section describes the leg-
end of the Ghost Month in more detail and provides survey-based evidence on the number
and characteristics of followers. Section 3 presents our research design and discusses our
data sources, our estimation strategy and some descriptive statistics of our estimation
samples. Section 4 discusses our main findings. Section 5 concludes the paper.
6
Lo (2003) shows in data from the year 1988 that C-sections are significantly higher (lower) on aus-
picious (inauspicious) days. Closer related to our work is Lin et al. (2006), who also study the Ghost
Month. They provide evidence that C-section rates are significantly lower during the Ghost Month.
7
A related strand of literature examines how incentives created by taxes and subsidies affect the
timing of births (see, for instance, Dickert-Conlin and Chandra, 1999; Gans and Leigh, 2009; Schulkind
and Shapiro, 2014; LaLumia et al., 2015; Borra et al., forthcoming). This behavior can — in contrast to
adaptions due to superstition — in principle be reconciled with rational behavior. However, this literature
points to negative health effects due to birth date manipulations.
52 Ghost Month
In Taiwanese culture, the seventh lunar month is called Ghost Month. According to
legend, during this period, the gates of the afterlife are opened, and ghosts roam the
living world. The presence of the ghosts is believed to increase the risks of accidents and
elevate the likelihood of bad outcomes in general. Therefore, believers of this legend try
to avoid several activities. For instance, swimming during the Ghost Month is considered
as dangerous since people believe ghosts are looking for victims of drowned to be reborn.
Hospitals are regarded as the places where life and death are connected. Thus, believers
avoid visiting hospitals and supposedly even doing surgeries during the Ghost Month.
Other activities believers try to avoid include, but not limited to, traveling, leaving the
house after sunset, whistling at night, major social events such as funerals and weddings,
and major purchases.
The period of the Ghost Month is defined by the lunar calendar. Since the lunar
calendar has intercalary months and days, it changes in relation to the Gregorian calendar
every year. Thus, the timing of the Ghost Month changes across years defined by the
Gregorian calendar. Figure 1 shows the variation in the starting and end date of the
Ghost Month (according to the Gregorian calendar) across the years 1980 to 2000. The
27th of July, for instance, was only in the year 1995 in the Ghost Month. In all other
years, the 27th of July was before the Ghost month. The dates of the lunar calendar are
always published in the printed Gregorian calendar and Taiwanese people are well aware
of the start and end-date of the Ghost Month.
How widespread is the belief in the Ghost Month? During the Ghost Festival, which
is on the 15th day of the Ghost Month, people prepare food, burn incense, and burn joss
paper to the spirits of ancestors and lost ghosts. It is widely believed that worshiping
to the supernatural power can protect people. According to the data from the Taiwan
Social Change Survey (TSCS), about 72% of Taiwanese take part in the Ghost Festival.8
Of course, participating in this festival could simply reflect cultivation of customs and
traditions, and does not necessarily imply that participants actually believe in the legend.
To assess the prevalence of the latter phenomenon, we use the following survey question:
“Do you believe that, ghosts that are not offered any worship will wander around? ”. Ac-
cording to data from several waves of the TSCS, about 66 percent of Taiwanese believe
either “very much” or “somewhat” in this statements on ghosts. Table 1 shows the full
distribution of answers by survey years from 1994 to 2014. The share of believers is re-
markably stable over this 20 years time period. Since the responses to this question reveal
how strong respondents believe in the existence of ghosts, it should be a good proxy for
whether they also believe in the Ghost Month. In fact, the share of Taiwanese believing
8
Similar to the WVS, the TSCS tracks the long-term trends of various values in Taiwanese society. The
survey is carried out at 5-year cycles for each topic of questionnaires and provides pooled cross-sectional
data. The 72 percent stated in the main text are based on data from 1990.
6in ghosts is almost as high as the participation rate in the Ghost Festival.
Who are the believers of the Ghost Month? Having established that about two-thirds
of all Taiwanese believe in the Ghost month, we want to explore whether believers differ
systematically from non-believers in their socioeconomic characteristics. To provide evi-
dence we estimate a linear probability model. We define a binary variable equal to one
if people respond either “very much” or “somewhat” to the ghost question from above
and regress this on several demographic characteristics. The estimation results are sum-
marized in Table 2. It turns out that females and employed individuals are more likely
to be superstitious. The estimated effects are about plus 10 and 3 percentage points,
respectively. We see that superstition is decreasing with age, however the magnitude
is quite small. Most importantly, we learn that the belief is negatively associated with
educational attainment. For instance, respondents with a college degree are about 23
percentage points less likely to believe as compared to the base group with primary edu-
cation only. A comparison of the second and the third column reveals that conditioning
on educational attainment, household income is not correlated with believing.9
Are believers of the Ghost Month indeed adapting their behavior? So far, we have
evidence that roughly two-thirds of Taiwanese believe in the Ghost Month, with believers
being more likely young, female and having a lower level of education. This evidence
based on stated preferences suggests that the Ghost Month may have pronounced effects
on actual behavioral. In our main analysis, we will test whether this translates into
health effects. At this point we are able to present some evidence on the avoidance of
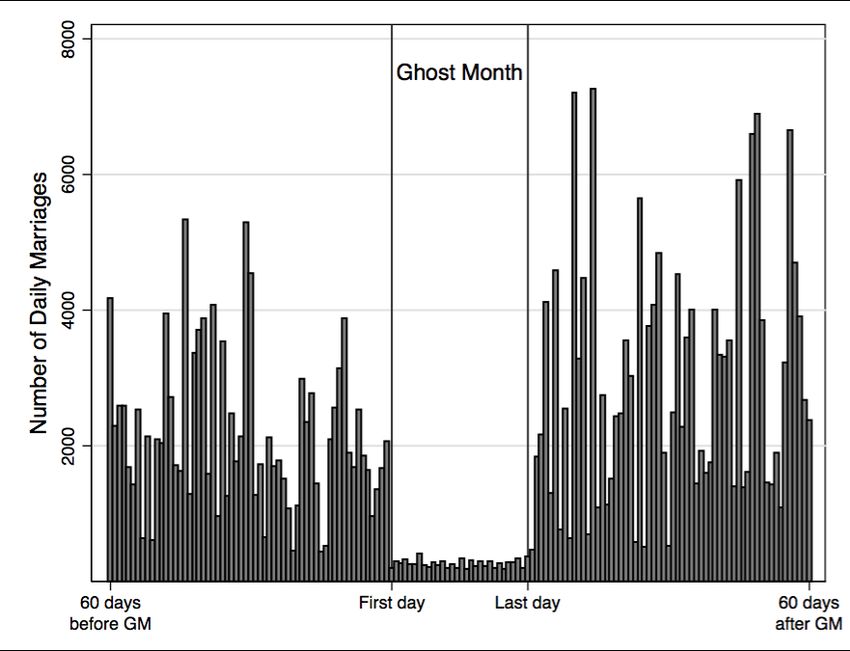
major social events. We have access to data from Marriage Certificates, which covers the
universe of marriages from 1998 to 2006. Figure 2 depicts the aggregated average number
of daily marriages around the Ghost Month. This figure clearly shows that people avoid
getting married during the entire period of the Ghost Month. The average number of daily
marriages sixty days before and after the Ghost Month is 283, while the corresponding
number during the Ghost Month is only 29. This is equivalent to a reduction of about 90
percent. While these behavioral adaption — most likely affecting only the timing, but not
the incidence of marriages — bears no welfare consequences, it nicely demonstrates that
the Ghost Month affects behavior.10
In summary, stated and revealed preferences provide compelling evidence for widespread
behavioral adaptions due to superstitious beliefs in the Ghost Month.
9
The correlations with sex, age and education are remarkably similar to those found in the analysis of
the determinants of other aspects of superstition in international survey data discussed in the introduction
(see Appendix Table A.2). A more comprehensive analysis of the determinants of superstition based on
WVS data is provided by Torgler (2007). Mocan and Pogorelova (2017) exploit compulsory schooling
reforms in 11 European countries to show that education causally decreases these superstitious beliefs.
10
An alternative strategy to provide evidence for behavioral adaption during the Ghost Month, would
have been the analysis of time-use survey data. Unfortunately, all three waves of the Time Utilization
Survey have been conducted outside the Ghost Month.
73 Research Design
In this section, we first introduce our administrative data sources and define our outcome
variables. Then we present our estimation strategy and discuss the resulting identifying
assumption. In the final step, we present some descriptive statistics for our estimation
samples.
3.1 Data Sources
For our empirical analysis, we have access to several high-quality administrative data
sources from Taiwan. We use three different individual-level data sets: (1) Death Cer-
tificates; (2) Inpatient Hospitalization Records; and (3) Birth Certificates. The first data
set covers the universe of all deaths in the period between 1980 and 2001. It includes
information on the exact date of death and the cause of death according to the Inter-
national Classification of Diseases (ICD). The second data set comprises information on
all hospital admissions in the period between 1982 and February 1995 for the sample of
people, who had been covered by Labor Insurance.11 It includes information on the exact
dates of admission and discharge, diagnosis, medical treatment, and fees. The third data
set includes information on live births in the period between 1978 and 2006. It comprises
information on the date and location of birth, gestational length, birth weight, and some
socioeconomic information on parents.
3.2 Outcome Variables
To study the effect of the Ghost Month on accidents, the demand of health-care utilization
and fertility, we compile different panel data sets with daily observations across all 25
counties in Taiwan. The outcome variables are the daily number of deaths (by type),
daily number of hospital admissions (by type), and the daily number of births. We also
consider sub-samples defined by characteristics such as sex, age, educational attainment
to explore potential heterogeneity of treatment effects.
To estimate the health consequence of avoiding having appropriate medical treatments
due to false beliefs, we use individual-level data on mortality, morbidity and birth out-
comes. We use the national identification number received by each citizen in Taiwan
to merge inpatient data and Death Certificates to track death records of patients after
their hospitalization. This allows us to test whether shifting a surgery to avoid the Ghost
Month affects the probability of death within a certain period of time. To assess any
11
The individuals are only observed until February 1995 since the National Health Insurance (NHI)
was introduced in Taiwan after March 1995. In this study, we only obtain hospital admissions data before
the NHI. For more details on the NHI of Taiwan, see Chou et al. (2014). According to official statistics,
the number of workers who are covered by Labor Insurance before the introduction of NHI is 8, 496, 883,
which comprises 55.3% of the population aged over 15.
8effects on morbidity, we use the longitudinal component of the Inpatient Hospitalization
Records. This allows us to estimate any effect on the likelihood of a hospital re-admission.
In the case of births, we use the information on gestational length and birth weight in
birth certificates. This data allows us to define binary outcomes of being preterm, low
birth weight, and very low birth weight.
3.3 Estimation Strategy
To identify causal effects, we exploit that the exact timing of the Ghost Month varies
across years defined by the Gregorian calendar. Figure 1 depicts the variation in the
starting and end dates across the years 1980 to 2000. To define our estimation sample
we use the earliest start date (27th of July) and latest end date (22nd of September). We
further exclude 24th and 25th of August, which belong to the Ghost Month in every year.
This way we have in our estimation sample for each calendar day at least one year, in
which this day was during the Ghost Month, as well as, at least one year, in which this
particular day was outside the Ghost Month. This variation allows us to estimate the
effect of the Ghost month, while controlling for Gregorian calendar day fixed-effects. To
be more specific, this idea can be translated into the following type of estimation model,
X X X
Ordy = α + τ · gmdy + κd + δy + γr + nbdy + it (1)
d y r
where Ordy is the absolute number of incidences in outcome O on Gregorian calendar-day
d in year y in region r. The coefficients capturing the Gregorian calendar-days fixed-
effects are denoted by κd . We also control for Gregorian calendar year fixed-effects (δy )
to capture unobserved secular trends in the respective outcome variable, and for regional
fixed-effects (γr ) accounting for time-invariant heterogeneity across regions. Finally, we
control for two types of non-business days (nbdy ). First, we include a binary variable equal
to one if the day is either a Saturday or a Sunday.12 Second, we control for official public
holidays and so-called “unofficial holidays”. This requires the inclusion of two binary
control variables for the Mid-Autumn Festival and Qixi Festival, respectively.13
12
It is important to control for weekends. First, there is typically a substantially lower volume of
health-care utilization on weekends. For instance, we expect a significantly lower number of hospital
admissions. Second, different strands of literature have documented a weekday pattern also in mortality.
For instance, the so-called weekend effect describes the robust finding that the risk of mortality after
admission to a hospital is significantly higher on weekends as compared to weekdays (Pauls et al., 2017).
13
In Taiwan, there are (official) public holidays and so-called “unofficial holidays”. In both categories,
some holidays are determined by the Gregorian calendar, while others follow the lunar calendar. The
holidays determined by the Gregorian calendar are in our estimation models automatically covered by the
Gregorian calendar-days fixed-effects κr . Notably, in the relevant time period (i.e., between the 27th of
July and the 27th of September) there are only 3 holidays, all of which are unofficial ones (Father’s Day
on the 8th of August, the Journalist’ Day on the 1th of September, and the Armed Forces Day on 3rd of
September). The holidays determined by the lunar calendar require additional control variables in our
model. During the relevant time period there is one official public holiday and one unofficial holiday.
9The variable of primary interest is gmdy , which is equal to one if the day d is within
the Ghost Month in the given year y, and zero otherwise. The coefficient τ measures
the effect of the Ghost Month on the respective outcome. Thus, we aim to identify an
intention-to-treat (ITT) effect, without relying on the actual behavioral adaption due to
superstitious beliefs. We have to assume that the timing of the Ghost Month is exogenous,
but the unobserved behavioral adaption can be endogenous. Using the language of RCTs,
we could compare the timing of the Ghost Month with the assignment to treatment (which
has to be random), and the actual behavioral adaption is equivalent to the compliance
(which can be endogenous). This exogeneity assumption is equivalent to assuming that the
variation in timing of the Ghost Month across Gregorian calendar years is not correlated
with unobserved determinants of the respective health outcome. We see no obvious reason
why the idiosyncratic timing of the Ghost month should be correlated with unobserved
determinants of the daily number of deaths, hospital admissions, or births.
We estimate a version of eq. (1) that allows for a more flexible behavioral adaption
with respect to the timing. If individuals adjust their health relevant behavior in response
to the Ghost Month, they may also pre- or postpone certain activities to the period before
or after the Ghost Month. To test this specific adaption, we include binary variables gm−5 dy
and gm+5 dy , which are equal to one if the day d is within a 5 days period before and after
the start of the Ghost Month in the given year y, respectively.
Ordy = α + τ pre gm−5 1 1−10
dy + τ gmdy + τ 2 gm11−20
dy + τ 3 gm21−last
dy + τ post gm+5
dy
X X X (2)
+ κd + δy + γr + it
d y r
Further, we allow the effect of the Ghost Month on the respective health outcome to
vary across the duration of the Ghost month. We distinguish between the first ten days
(gm1−10
dy ), the second ten days (gmdy
11−20
), and the remaining nine or ten days (gm21−last
dy ).
Thus, the parameters τ 1 , τ 2 and τ 3 show to which degree the incidences change during
the Ghost Month, while τ pre and τ post , inform us about related pre- and or postponment.
3.4 Estimation Samples and Descriptive Statistics
Table 3 provides descriptive statistics for our estimation samples drawn from three differ-
ent data sources. First, we use data from Death Certificates (see Panel A). These data are
available in the period between 1980 and 2001. We compile a daily county-level data set
with 30,750 observations. Here we focus on calendar days for which with have variation
in the Ghost Month status over the years (see notes to Table 3 for details). The average
daily incidence of death is 10.78 cases, including 1.32 cases of accidental deaths and 9.26
The former is the Mid-Autumn Festival (on 15th day of the 8th lunar month) and the latter is the Qixi
Festival (on the 7th day of 7th lunar month).
10cases of non-accidental deaths. For a small fraction of cases, the cause is unknown. Sec-
ond, we use data from Inpatient Hospitalization Records, which are available in the period
between 1982 and 1995 (see Panel B). Our unit of observation is again county-day. The
average number of admissions is 66.15, including about 41% of admissions with surgeries
and 59% without surgeries. Finally, we use Birth Certificates, which are available in the
period between 1978 and 2006 (see Panel C). We compile a daily county-level data set on
number of live births. We further use individual-level data to study birth outcomes. Here
we focus on births to mothers aged between 16 and 45. This sample comprises 1,537,170
births, where the average gestation is 39.2 weeks and the average birth weight is around
3,200 grams.
4 Estimation Results
We present our estimation results in three steps. First, we discuss our evidence on the
effect on (cause-specific) mortality. Second, we present our estimates on adaptions in
the domain of health-care utilizations using information on different types of hospital
admissions. We also explore consequences of the latter behavior on subsequent health
outcomes. Third, we turn to our evidence on the effect on fertility and birth outcomes.
4.1 Mortality
Table 4 summarizes our results of the estimation model described by eq. (2). The depen-
dent variable is the daily number of deaths (of a certain type) at county-level divided by its
sample mean. Thus, our estimates are semi-elasticities and can be interpreted as percent
changes. We find robust evidence for a reduction in mortality during the Ghost Month.
The overall number of deaths decreases by around 3.9 percent. The estimates suggest that
the effect is somewhat stronger during the first 10-day interval (almost minus 5 percent)
and decreases thereafter to 3 to 4 percent (see column (1)). All three coefficients are pre-
cisely estimated and statistically significant at the 1-percent level. In contrast, there are
no significant changes in mortality just before or after the Ghost Month. This suggests
that the reduction in mortality is not a tempo, but a quantum effect. Put differently,
behavioral adaptions to the Ghost month save lives. Each year about 316 lives are saved
due to behavioral adaptions in response to the Ghost Month.14
In columns (2) and (3) of Table 4, we distinguish between the two broad categories of
accidental and non-accidental deaths, which are defined by the ICD-9 code available in our
data. We find comparably stronger effects for accidental as compared to non-accidental
deaths. In the former case, we see reductions between 7 to almost 10 percent. This effect
is quantitatively very comparable to the weekday-weekend gradient in this estimation,
14
This estimate is calculated as follows: 10.782 × 3.9% estimated reduction×30 days×25 counties = 316.
11which suggests that there are 9 percent more accidental deaths on weekends. In contrast,
non-accidental deaths go down by only 3 to 4 percent. Notably, the baseline level of
non-accidental deaths is, however, much larger, such that the effect is more important in
absolute terms.15
The drop in accidental deaths can unambiguously be explained by a reduction in
activities with certain risks. Since we do not see any significant effects just before or after
the Ghost Month, we conclude that individuals not only pre- or postpone risky activities,
but completely forgo these during the Ghost Month. To gain more insights, we re-run our
analysis for cause-specific mortalities summarized in Table 5. Columns (1) to (5) report
the results for the top five leading causes of accidental deaths; daily averages are reported
in the lower panel. We find the strongest effects on deaths caused by traffic accidents
(about minus 7 percent) and drowning (about minus 23 percent). This evidence is in line
with the widespread Ghost Month beliefs, that strongly emphasize to avoid swimming,
traveling, and leaving the house after sunset. For other accidental causes of death (i.e.,
falling, poisoning, and electric) we only find weak evidence.
In the case of non-accidental deaths, the interpretation of the results is not so straight-
forward. There are two plausible causal mechanism. First, the reduction of overall activity
during the Ghost Month may lead to lower levels of stress; reducing the mortality among
high-risk groups. Second, the negative effect on mortality may be related to adaptions in
health-care utilizations. We come back to the latter channel in Section 4.2.2, and examine
cause-specific mortalities to explore the former mechanism. We focus on the top five lead-
ing underlying cause of non-accidental deaths in our data: Diabetes mellitus; Malignant
neoplasm of liver and intrahepatic bile ducts; Malignant neoplasm of trachea, bronchus,
and lung; Acute but ill-defined cerebrovascular disease; and Chronic liver disease and
cirrhosis. We suggest to interpret deaths by diabetes mellitus predominantly as caused
by cerebro-cardiovascular diseases.16 Our estimations results are summarized in columns
(6) to (10) of Table 5. We find a significant effect of the Ghost Month for two (out of five)
cause-specific deaths: cerebrovascular disease and diabetes mellitus. Both categories can
15
In the Death Certificates, there are about 1.9 percent of cases with an unknown cause of death (i.e.,
the ICD-9 code is missing, see Table 3). We also examine the effects of the Ghost Month on the incidence
of these cases. We find no statistically significant coefficients.
16
First, one has to acknowledge that the reporting practice of one cause does not capture the reality
of many deaths having multiple causes. Our data follows ICD-9, which defines the underlying cause of
death (UCD) as “the disease [. . . ] which initiated the train of morbid events leading directly to death”.
In the case of diabetes, it is generally difficult to unambiguously determine one UCD, since most diabetic
patients suffer from multiple conditions. Importantly, patients with diabetes are almost twice as likely
to have a heart attack or a stroke as people who do not have diabetes. Second, it is documented that
Taiwanese physicians tend to choose diabetes as the UCD if multiple diseases coexist. The latter fact
is discussed in a report published (in Mandarin) by the Department of Health, Executive Yuan (Chen,
2005), which has access to Death Certificates with richer information. This report compares Taiwanese
physicians with their peers from Sweden and the US. It offers three explanations why Taiwanese physicians
“favor” diabetes as UCD if multiple diseases coexist: (i) it is a habit of local physicians, (ii) it is due
to medical training in filing the death certificates, or (iii) it is the location of filling diabetes on the
Taiwanese certificates paperwork. Third, we have checked our suggested interpretation with a physician.
12be associated with a decreased number of deaths due to strokes and heart attacks. We
suggest that the negative effect on non-accidental deaths, can be explained by a reduced
risk-exposure due to the avoidance of activities such as traveling, going-out at night and
major events.17
4.1.1 Treatment Effect Heterogeneity
Our survey data analysis suggests that female, younger and less educated individuals
tend to be more superstitious (see Table 2). Given that the Death Certificates include
individual-level information on sex, age and educational attainment, we can test whether
these differences in stated preferences translate into differences in revealed preferences.
Put differently, we check whether behavioral adjustment due to superstitious beliefs and
the resulting effects on mortality vary significantly across different sub-samples defined
by these socio-demographic characteristics. Figure 3 depicts the estimation results using
our main model described by eq. (2) by these group and place of occurrence. We find no
significant differences between the sexes or educational groups. The same holds true for
residents in urban and rural areas. With respect to age, we find (in line with the stated
preferences) stronger effects for younger individuals. Teenagers, a group which is prone to
risky behavior, seem to benefit the most from behavioral adjustments during the Ghost
Month. If we distinguish between accidental and non-accidental deaths and apply our
heterogeneity analysis on these two sub-sample (not shown), we learn that the effects for
teenagers indeed exclusively comes from accidental deaths. In contrast, the reduction in
non-accidental deaths is driven by individuals above 60.
Overall, our analysis of mortality provides evidence that behavioral adaptions to the
Ghost Month — such as a reduction in risky activities and overall activity — save lives by
reducing accidental and non-accidental deaths.
4.2 Health-care Utilization: Hospital Admissions
We now turn to the effect of the Ghost Month on health-care utilization. There are
four potential causal channels: (i) the reduction in risky activities may not only reduce
mortality, but also lead to a decline in hospital admissions; (ii) the reduction in overall
activity may reduce related admissions, such as strokes or heart attacks; (iii) superstitious
patients may want to avoid hospital admissions during the Ghost Month and schedule
17
One potential causal pathway is reduced exposure to pollution. We have tried to test the hypothesis
that pollution levels are lower during the Ghost Month. Our analysis was based on a data-set on different
pollutants in the period between 1982 and 2001 covering up to 71 monitoring stations operated by the
Environmental Protection Administration, Executive Yuan. While we found mostly negative effects of
the Ghost Month on pollution levels, we consider these findings not robust. Detailed estimation output
is available upon request.
13their appointments accordingly; (iv) superstitious doctors may reduce their labor supply
during the Ghost Month. While all mechanism would lead to a reduction of health-care
utilization during the Ghost Month, we expect for the former two channels a quantum
effect, and for the latter two channels a tempo effect.
Our first outcome variable is the daily number of hospital admissions. Column (1) of
Table 6 shows that hospital admissions are significantly lower during the Ghost Month.
The effect size varies somewhat over the course of the period with an average of about
minus 3.8 percent. However, unlike the quantum effect we observed in the case of mortal-
ity, the evidence for health-care utilization points to a tempo effect. We find significant
effects for an increased number of admissions in the period just after the Ghost Month
of about 6 percent. Since the time span for postponing surgeries is unknown, it is hard
to assess whether the total effect is mere tempo or also some quantum. Thus while we
cannot rule out the presence of the causal channels iii. and iv, we can conclude that
channel i. and/or ii. are in place.
This results suggest that the main causal driver of this effect is a lower demand (or
supply) for medical services. It seems plausible that believers of the Ghost Month only
try to avoid potentially risky health-care services. To test this hypothesis, we distinguish
in columns (2) and (3), between patients who undergo surgery during the hospital stay,
and those who do not. As expected, the effect is driven by the more risky admissions
with surgery. We find a significant reduction in this category, during the Ghost Month of
about 9 percent and important increases just before and after of about 3 and 8 percent,
respectively. This result confirms the interpretation of a tempo effect, with believers pre-
and postponing surgeries. Since the effect of the postponement is comparably larger, we
conclude that it is easier for patients to defer a hospital visit rather than schedule an
earlier one. In the case of admission without surgeries, there is only some evidence for an
increased number right after the Ghost Month.
Given this clear evidence that patients distinguish between different types of health-
care utilization, we provide further tests exploiting the degree of “deferability” of admis-
sions. To approximate the deferability of an admission, we follow a procedure suggested by
Card et al. (2009). They exploit the fact that hospitals typically schedule planned admis-
sions for “deferrable” conditions on weekdays, when more staff is available. In contrast,
unplanned admissions for “non-deferrable” conditions should have very similar weekend
and weekday admission rates. Following this logic, the fraction of weekend admissions in
the case of absolutely “non-deferrable” conditions should be close to 2/7. We compute
the fraction of weekend admissions at the diagnosis-level using data in the period between
1982 and 1992.18 This gives us a distribution of fractions of weekend admissions rates
18
We do not use data from the years 1993 and 1994, since many observations have missing diagnosis
codes. This is probably related to the introduction of the National Health Insurance in March 1995 (see
footnote11. In the course of this, Taiwan has changed its classification system of diagnostic codes (from
so-called ‘A-codes’) to ICD-9. We speculate that in the two years prior to NHI some hospitals already
14across all diagnosis, reflecting a decreasing degree of “deferability” as one moves from the
left to the right tail. We then compute quartiles for fraction of weekend admissions and
split the diagnosis codes into four groups.
In Table 7 we present results on the effect of the Ghost Month on the daily number
of hospital admissions with surgeries in these four sub-samples of diagnosis with varying
degree of “deferability”. A comparison of estimated coefficients across columns, clearly
shows that the effect of the Ghost Month increases with the “deferability” of conditions.
In the case of the “most-deferrable” conditions, the number of admissions decreases during
the Ghost Month on average by almost 20 percent. This highlights how widespread the
adaptions due to superstitious beliefs are. In contrast, for the category of the “least-
deferrable” conditions, we observe a comparable small reduction of 4 percent. Coefficient
estimates on the period before and after the Ghost Month illustrate that the patients
defer surgeries, but do not have them early.
4.2.1 Treatment Effect Heterogeneity
We check again for heterogenous effects across different parts of the population. The
Inpatient Hospitalization Records allow us to split the sample by sex, age and location.
We focus here on the number of admissions with surgery (see Figure 4). We do not
find any statistically significant differences across age groups or regions. In contrast, our
analysis reveals a significant differences across sexes. Women are much more likely (about
12 percent) to postpone surgeries as compared to men (about 4 percent). This gradient
is in line with our survey-based evidence suggesting that women are on average more
superstitious and are more likely to believe in ghosts (plus 10 percentage points).
4.2.2 Health Consequences due to Adaptions in Health-care Utilization
So far, we have evidence that a significant number of patients — in particular among those
with “deferrable” conditions — avoid surgeries during the Ghost Month. We now test the
hypothesis whether this adaption due to superstitious beliefs has consequences for health.
There are two potential causal mechanism. First, the post-ponement per se may have a
negative impact on health. Second, the higher level of hospital occupancy right before or
after the Ghost Month may decrease the quality of health-care services.
Our estimation strategy to gauge health consequences is examining subsequent mor-
bidity and mortality of pre- and post-Ghost Month hospital admissions. Our measure for
morbidity is the 30-day re-admission rate. We estimate again a model as described by
eq. (2), but mainly focus on the parameters τ pre and τ post . Methodologically, we face here
the challenge that we cannot identify the patients, who defer their surgery due to the
Ghost Month, on an individual-level. We only know that a certain share of patients, who
switched to the ICD-9 codes, which resulted in missing information on A-codes.
15are admitted to the hospital just before, and in particular, just after the Ghost Month
adapted the timing of their surgery. Put differently, our sample comprises two types of
patients in this period. First, those who have a surgery in this period, because they
re-scheduled it in order to avoid a surgery during the Ghost Month. Second, there are
patients who have their surgery in this period according to a regular (supposedly optimal)
timing. Thus, if we test whether patients admitted during this period have different sub-
sequent morbidity and mortality outcomes, we have a measurement error in our treatment
of interest “adapted timing of surgery”. This leads to an attenuation bias and we have a
higher risk of making a Type-II error.
Morbidity To examine morbidity, we construct an individual-level dataset tracking the
full hospitalization records of all patients, who were admitted to a hospital between 1982
and 1992. This dataset comprises 861,591 admissions. For each admission we define
a binary variable equal to one if the patient readmits to hospital within 30 days after
hospitalization. We obtain an average readmission rate of 0.085. Based on findings in the
previous section, we are particularly interested in the morbidity of patients, who either
pre- or postpone their hospital admissions due to the Ghost Month. We here follow
our previous estimation strategy, but include control variables for patients’ sex, age, and
diagnosis at the initial admission. Our results provide no evidence for significant changes
in the probability of readmission of post-Ghost Month admissions (i.e., the coefficient
on gm+5 ). This holds for cases with and without surgery during their initial admission,
as well as in sub-samples of initial diagnosis with a varying degree of “deferability” (see
Appendix Table A.3). In contrast, we find evidence for a higher likelihood of readmission
for pre-Ghost Month admissions (i.e., the coefficient on gm−5 ). The estimated effect of
0.3 percentage points is equivalent to an increase by 6 percent.
Mortality In a final step, we consider an effect from shifting hospital admissions due to
Ghost Month on subsequent mortality. Therefore, we use a match between the Inpatient
Hospitalization Records of all admissions with surgeries in the period between 1982 and
1992 and Death Certificates. For each admission we define a binary variable equal to one
if a patient dies within 30 days after hospitalization. The estimation strategy is equiva-
lent to the case of readmissions. Our results show no discernible evidence of a different
30-day mortality rate for pre- or post-Ghost Month admissions (see Appendix Table A.4).
This holds for all cases with surgery (during their initial admission), as well as for initial
admissions with different degrees of “deferability”.
In sum, we find some evidence for adverse health consequences due to preponing surg-
eries. In contrast, there is no discernible evidence in the case of postponing surgeries.
The coefficients on post-Ghost Month admissions are all precisely estimated zero effects.
16However, since this set of results likely suffers from attenuation bias, the latter finding
has to be interpreted with caution.
4.3 Fertility
Our results on the effect on fertility are summarized in Table 8. In column (1) the outcome
variable is the number of daily live births. We find that the number of newborns decreases
significantly during the Ghost Month. The effect varies somewhat over the course of the
Ghost Month with reductions between 2.4 and 4.7 percent. In contrast, shortly before
and after the Ghost Month the number of newborns increases by about 5 percent. This
U-shaped pattern suggests that a significant number parents adjust the timing of birth in
order to avoid a delivery during the Ghost Month.
There are two potential adjustment mechanism: parents could either manipulate the
date of birth or the date of conception. The former mechanism would mean that women
with an expected due date during the Ghost Month decide to deliver either early or
late. The latter mechanism requires forward looking parents, who create a particular
seasonality in conception; with a lower rate of conceptions in the period corresponding
with expected due dates during the Ghost Month, and with higher conception rates in
periods with expected due dates shortly before and after the Ghost Month.
There are several ways to assess the relative importance of the two adjustment mech-
anism. First, we contrast the scope of planning births with the U-shaped pattern. Re-
sponsible obstetricians would not plan a delivery in the absence of medical reasons that
is very far away from the due date. By contrast we observe reductions in live births also
in the middle of the Ghost Month, which would require a shift of up to 14 days. Second,
postponing birth is harder than inducing it. Therefore, we should see a larger peak before
as compared to after the Ghost Month. Our estimates, however, show equally sized peaks.
Third, the manipulation of the date of birth, would alter gestational length. In column
(2), we use individual-level data and examine gestational length. This estimation indeed
shows a statistically significant shorter (longer) gestational length for children born right
before (after) the Ghost Month; however the estimates are quantitatively very small. The
observed changes of about 0.2 days (≈ 0.0007 × 39.2 × 7), remain small even if we take
into account that only about 5 percent of births in this period have manipulated date of
births. In a final step, we provide direct evidence on the manipulation of conception dates.
Therefore, we use individual-level information on the date of birth and gestational length
to approximate the date of conception. We then calculate for each case the expected due
date assuming a regular gestational length of 40 weeks. We then generate a data set on
the daily number of births, which would have been observed in case all newborns, would
have been born on their expected due date. The estimates summarized in column (3) show
a comparable U-shaped pattern albeit with a lower magnitude. This is direct evidence
17for a manipulation in conception dates. In sum, this evidence suggest that both types
of manipulation take place. The dominant form are forward looking parents avoiding a
delivery during the Ghost Month by timing the conception right.
4.3.1 Treatment Effect Heterogeneity
The individual-level information included in the Birth Certificates allows us to check for
several dimensions of heterogeneity. In Figure 5, we summarize estimation results by
selected mother (age, educational attainment, place of birth) and child (sex and parity)
characteristics. For most sub-groups we find very comparable effects. Maternal age
is the exception. While we see the same qualitative pattern across all age-groups, the
magnitude increases significantly with age. The sample-splits by other characteristics,
which are correlated with age (parity and education) do not show an equivalent pattern.
We conclude that this heterogeneity reflects a “true” age effect. One possible explanation
is that older women are more forward looking in their conception behavior.
4.3.2 Birth outcomes
Lastly, we consider an effect on children’s health at birth.19 Manipulations of the date of
birth may have direct consequences for birth outcomes; however, given our evidence that
this type of manipulation is less prevalent and rather mild, we expect this channel to be
of minor importance. In contrast, manipulations of the date of conception should have
no health consequences. Children may also be affected by fluctuations in the number of
admissions to maternity units or to the hospital in general. Children delivered shortly
before or after the Ghost Month could be negatively affected by the higher number of
hospital admission during these periods. Conversely, children delivered during the Ghost
Month could benefit from the hospitals’ reduced work-load. A final channel could be
the maternal behavior. Children born towards the end of the Ghost Month (or shortly
thereafeter) could benefit, from a reduction in maternal activity related to stress. Thus, for
deliveries shortly before the Ghost Month we expect (either due to a manipulation of birth
dates or high levels of hospital occupancy) negative effects. For deliveries shortly after
the Ghost Month the effect is unclear. Both, behavioral adaptions by mothers during the
Ghost Month and the post-ponement of births (such as later scheduled caesarean sections)
may be positive. In contrast, the hospital occupancy should be negative if at all.
Our results are summarized in Table 9. We use the available information on gestational
age and birthweight to define binary variables capturing a preterm birth (below 37 weeks),
19
A recent paper using Taiwanese data is interested in the causal effects of shortened gestation on birth
outcomes. Chiang et al. (2017) aim to exploit manipulations in the date of birth due to the Ghost month
within an instrumental variable (IV) approach. Their binary IV is defined as an expected due date during
the Ghost Month, which increases the likelihood of an induced birth with a shortened gestation. For this
IV to be valid, the authors have to assume that parents do not account for the Ghost Month in their
conception behavior. Our estimation results challenge this identifying assumption.
18You can also read