IMPACT OF PRODUCT INFORMATION ON CONSUMERS CHOICE FOR DOG FOOD - Yuanxin Huang Tekst
←
→
Page content transcription
If your browser does not render page correctly, please read the page content below
Norwegian University of Life Sciences
                          Department of Animal and Aquaculture
                          Sciences                                Tekst
                                     Tekst

                 Tekst

                                                      Tekst
Master Thesis
        Tekst 2014                        Tekst
30 credits
     Tekst

IMPACT OF PRODUCT
INFORMATION ON
CONSUMERS´ CHOICE FOR
DOG FOOD

                         Tekst

                                                       Tekst

                Tekst
             Tekst
Yuanxin Huang
          Tekst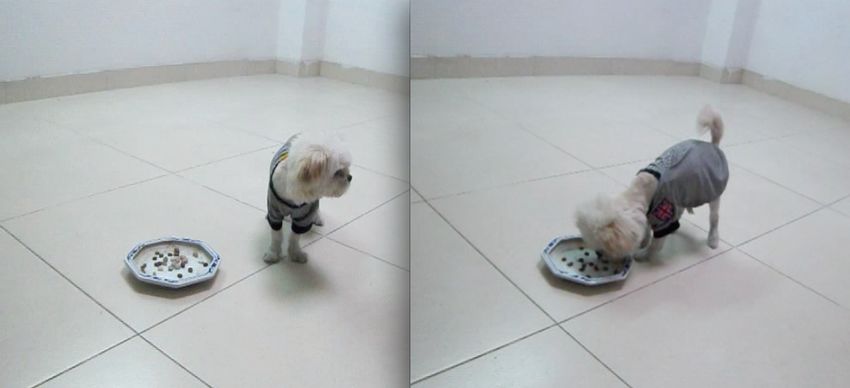
IMPACT OF PRODUCT INFORMATION ON CONSUMERS´ CHOICE FOR DOG FOOD

                                       BY

                               YUANXIN HUANG

               Presented in partial fulfillment of the requirements

                                For the degree of

                               Master of Science

                     Norwegian University of life Sciences

                                      2014

                                  Ås, Norway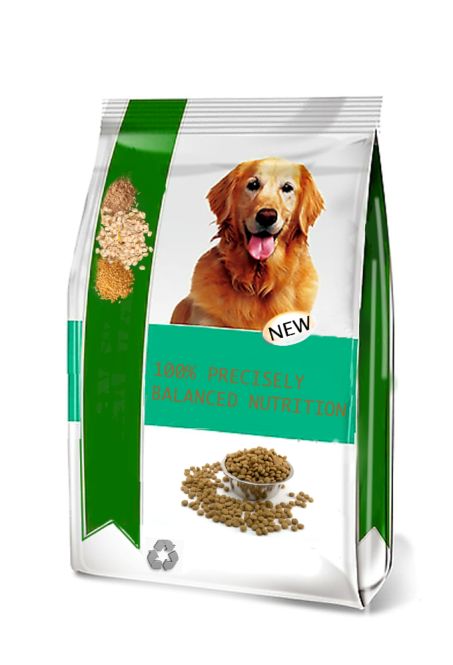
Abstract

      This paper provides a unique insight into the key role of the impact of product information
      factors and the their interaction. Through a factorial design the impact of dog food aroma
      (natural/artificial) in combination with claim (health/taste) on dog food experience was ex-
      plored in Experiment 1. Another experiment examined the impacts of factors combinations
      (dog’s response /claim) on consumers’ choice. Using rating data on dependent variables, a
      Mixed-effects model was performed. The results show that: 1) Expected liking was found to
      be significant among 4 products in Experiment 2; and 2) Claims are suggested to moderate
      the impact of factors aroma and dog reaction videos, in terms of willingness to pay.

Keywords: Consumer study; Sensory; Health Claims; Dog food

                                                                                                     i
Acknowledgements
This thesis concludes my Master of Science degree in Feed Manufacturing Technology at the Nor-
wegian University of Life Sciences (NMBU). It has been written during the period: February 2014
-- November 2014.

This project was made possible through the assistance and support of many individuals. I give spe-
cial thanks to Professor Bjørg Egelandsdal, Dr. Marije Oostindjer and Qing Wang. Their
knowledge provided me with a lot of new information and deeper insight into this thesis. As an
employee in FôrTek research center, Qasim Niazi also graciously provided additional support in the
form of providing experiment materials, therefor I am also want to thank him here.

My sincerest appreciation goes also to my friends Jiajia Ye, Jone Haugland and Qasim Niazi. I
could never have done this without your support. I am also grateful to all the other professors who
shared their knowledge through the excellence of their classrooms, including Dejan Miladinovic,
Trond Storebakken, Birger Svihus and Jan Øystein Ahlstrøm.

Finally, I would like to give my deepest appreciation to family members, specially my mother and
grandma. Thank you for lifting me up when I was down, and for holding steady beside me through
all the rest!

Ås, Norway,

November 2014

Yuanxin Huang

                                                                                                 ii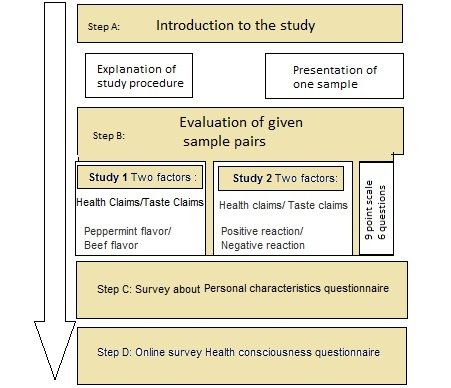
iii
ABBREVIATIONS

NHC, Nutrition and health claims

TC, Taste claims

FP, Food package

EU, European Union

GLM, General linear model

WTP, willingness to pay

DV, Dependent variable

IV, Independent variable!

                                   iv
Table of Contents
I. General part .............................................................................................................. 7
1. Introduction .............................................................................................................................. 7
1.1 Research background ................................................................................................... 7
1.2 Aims of this thesis ....................................................................................................... 7
1.3 Literature review of pet food choices .......................................................................... 8
1.4 Conceptual model Development.................................................................................. 8
1.5 Definitions of concepts ................................................................................................ 9
2. Research variables selection .................................................................................................. 11
2.1 Packaging and health claims ...................................................................................... 11
2.3 Aroma and dog food choice ....................................................................................... 13
2.4 The reaction of dogs .................................................................................................. 13
3. Research methods .................................................................................................................. 14
3.1 Research design ......................................................................................................... 14
3.2 Statistics modeling and presentation of the hypothesis ............................................. 15
II. Experimental part................................................................................................. 18
4. Experimental overview .......................................................................................................... 18
4.1.Experimental materials .............................................................................................. 18
4.2 Preparation Process .................................................................................................... 18
4.3 Procedure of Consumer Study ................................................................................... 21
4.4 Recruitment and Consumer panels ............................................................................ 23
4.5 Questionnaire construction2 ...................................................................................... 23
5. Data Analysis .......................................................................................................................... 25
5.1 Preparation of Collected Data .................................................................................... 25
5.2 Method Problems ....................................................................................................... 26
5.3 Respondent profile and Descriptive statistics ............................................................ 27
5.4 Results and Finding ................................................................................................... 29
6. Discussion ................................................................................................................................ 33
6.1 Conclusion and implications...................................................................................... 33
6.2 Suggestions for future research ................................................................................. 34
Appendices.................................................................................................................. 35
Appendix A.1 - Repeated Measure Data for Analysis ................................................................. 35
Appendix A.2 - Pairs of claims selected for package design ....................................................... 36
Appendix A.3 - Personal Characteristics Questionnaire .............................................................. 37
Appendix A.4 - Measurement Questionnaire .............................................................................. 39
Appendix A.5 - Statements on the Health consciousness Questionnaire .................................... 41
References ................................................................................................................... 42
6I. General part
1. Introduction
In this chapter, the research background is stated in section 1.1. Section 1.2 clarifies the selection of
the research topic and the added value of this research. Literature reviews of pet owner preferences,
including the conceptual design, are described in Section 1.3. In section 1.4, concepts are defined in
order to help clarify the purpose of this thesis.
1.1 Research background
The sale of pet food has recorded solid growth in the recent years. Norway ranks at the top of all
the European countries when it comes to monthly spending on dog food (Norway ranks as... 2012).
According to this survey, people in Norway spend the equivalent of US$639 per dog each year on
pet food. Another recent survey (Taylor 2013) indicated nearly one-third of consumers “preferred to
shop at pet product retailers that offer the best products available, even if they are more expensive”.
Norwegians are also suggested to purchase expensive organic and functional dog foods, which
sometimes also come in small meal-size packages instead of larger bags (Norway ranks as... 2012).
Pet food is not designed merely for humans. Pet food differs from food for humans in that pet own-
er will not directly consume these products. For those pet food products that can be experienced
only by watching, touching and smelling, factors such as brand, health claims and aroma can influ-
ence the consumer in the selection process and their willingness to pay (WTP) (Cuellar 2013.)
Moreover, pet food is also a commercial food, which all have a feature in common: they are using
packaging and branding to attract the attention of the potential buyers of the products. Text infor-
mation on the package with either health promoting attributes or taste promoting attributes conveys
different information for choosing a particular food, such as indicating natural or healthy ingredi-
ents.
1.2 Aims of this thesis
The goal of this thesis is to investigate the potential impact of such factors on the dog owners’ pref-
erences. More specifically, this thesis aims to explain how the claims on the packaging, in some giv-
7en situations (combine with smell/video), have impact on the dog owners’ liking preferences, ex-
pected health and taste perception and willingness to buy.
The measurement assessed the consumers’ preferences of dog food (whether preference is modulat-
ed by presenting of different conditions), and whether any such preferences are correlated by the
background information of the consumer (e.g., geographical or dog-cohesion).
1.3 Literature review of pet food choices
The literature review was conducted to develop a deeper understanding into which factors can in-
fluence dog food choice. After looking over the scientific literature databases, the research on the
pet food sector seems to be limited. A variety of product information, including odors of humans’
food products, textual elements of package (D.G. Liem 2012) and video stimuli, has been sugge-
sted to affect consumers’ perception. Empirical evidence of cross-modal association within dog
food-related stimuli is difficult to locate. A few consumer studies reported in the literature have
been conducted with different pet foods (Case 2011) and cat foods (Pickering 2009) to find out the
important factors affecting consumers´ perception. The authors found sensory and health considera-
tion to be the most important factors affecting dog food choice. A few studies have been conducted
with pet food (e.g. Di Donfrancesco et al, 2012). Di Donfrancesco applied human sensory analysis
method with dry dog food in the US market. In his study, he suggests that varying sensory proper-
ties such as aroma, flavor and texture sensory might have some impact on consumer choice when
brand and packaging information are removed. Pet owners interact with pet food when feeding
their pet and they like to watch dog when they were eating (Di Donfrancesco et al, 2012). Given
this situation, it is therefore considered to be of great academic interest to discover the impact of
dog reaction on dog food choice.
1.4 Conceptual model Development
The ways in which people feed farm animals and pets are different. Farm animals are bred in order
to produce meat or other products, while pets are raised for their own sake. Thus the buyers of food
for farm animals will mainly look for food that enhances the quality of the product to be sold. In
contrast, the buyers of pet food might focus more on qualities of the food that would make the ani-
mal happy and healthy than the weight gains of the animal. Pet foods are uniquely positioned, as
the pet foods are products sold to humans, but which are designed with the pets in mind.
To sum up these findings on pet food purchase behavior, the general trend seems to be that if a per-
8son is going to buy a certain pet food, he must first have an actual liking of the food, and high ex-
pectation of both health and taste benefits. Second, he must be closely connected to this pet, and
then he will be motivated to pay a certain amount of money for this dog food. Respondents may
believe that the dog foods are good in general. But since some of them are dog owners themselves,
they might not be willing to pay as high a price for it as actual dog owners would. Thus, the reac-
tion a dog makes when being exposed to the food, which itself is not an attribute of the dog food
product, can actually change the purchasing behavior. As a result of this, dog owners might be will-
ing to pay a higher price for the foods if they believe that their dogs like to eat, even if such foods
might be less healthy than other foods. Other factors such as age and gender are also suggested to
contribute to the consumers´ willingness to pay. A conceptual model has been developed theorizing
the causal relationships determining pet food purchase behavior. This model is shown in Figure.
(Fig.1)
Figure 1: A conceptual model adapted from Garmt (Garmt 2004)
1.5 Definitions of concepts
Below are definitions of various concepts used in this study. These definitions are derived from ear-
lier work in the field.
Label - Any tag, brand, mark, pictorial or other descriptive matter, written, printed, stenciled,
marked, embossed, impressed on, or attached to a package or container of feed. (R. 767/2009, Art.
3.2)
9Claim - Any labeling or presentation which draws particular attention to the presence or the ab-
sence of a substance in the feed, to a specific nutritional characteristic or process or to a specific
function related to any of these. (R. 767/2009, Art. 13)
HNC - Health and Nutrition claims are claiming that it will prevent, treat or cure a disease or
claiming that it has particular nutritional purpose, but is not included in the list of PARNUTS in
accordance with Article 10 of regulation (R. 767/2009, Art. 13, Art. 14)
Purchase - In the present study, it means the action of acquiring a product against a monetary com-
pensation.
Purchase decision - The choice that a consumer makes in relation to a purchase. It includes prod-
uct, package, store, method of purchase etc.
Factors - In this study, the factors refer to the variables that may have an impact on dog food
choice, which were given to experimental units under control.
Buying Behavior/Purchase behavior - In this paper, these terms mean the decision processes for
buying behavior and acts of people involved in buying these products.
Purchaser - People involved in acquiring a product against a monetary compensation.
Consumers - This term means specially that the person who is not eating the pet food, but buying
the pet food.
Dog cohesion - This term here has been defined as “the emotional bonding that person and her/his
dog”.
Stimulus - Throughout this paper, the term “stimulus” refers to a product aspect that stimulates a
single factor.
Dry dog food - Dog food products that are in Norwegian stores can be grouped into different types;
dry foods, wet foods (canned), semi moist and snacks. While other types have their advantages and
usage, dry foods is best sold and constitute the highest output of all pet food produce (Tran, 2008).
Pet food with moisture content of 10 % or less is called dry pet food (Case et al, 2011). Dry pet
food is suitable for coating as low moisture content (Tran, 2008).
Repeated measures – These measures come from the same subject, as is common in psychological
experiments, so that these measures are repeated.
10Interaction effect - In statistics, the term interaction effect means two or more factors have more (or
less) of an effect than when they are considered individually.
Within-Subject Factor - Same participants are included in all levels of this factor. E.g. IV = Time,
Levels = Time 1, Time 2, Time 3, etc.
Willingness to pay - In the present study, it means the amount of money a consumer wants to pay
for the product.
2. Research variables selection
As defined by Mathis (Mathis et al. 2003), intrinsic characteristics are the ones bundled in the
product and can be said to be the essence of the product. Extrinsic characteristics are those influenc-
ing a consumer´s view of the food, but is not bundled in the product itself. In the case of dog food,
the sensory properties are a key intrinsic characteristic for acceptance of dry dog food. It is therefore
important especially for the repurchase of a product (Koppel, 2014).
In the first experiment, packaging and claims are selected as research independent variables of dog
food given with aroma, which was chosen as intrinsic characteristics of dog food. In the second ex-
periment, two different claims, as well as dog reaction were chosen as research independent varia-
bles.
2.1 Packaging and health claims
According to Kuvykaite (Kuvykaite 2009), the food package is an important means of enabling
communication between manufacturers, distributors and consumers. Thus, academic interest in
packaging has become more pronounced over the past decade. Scholars measured how packaging
information communicated between manufacturers and consumers and how this product infor-
mation had impact on purchase decision (Wells 2007, Garber, Burke, & Jones 2000, Folkes 2004).
Besides this, ethical consumers have shown different preferences towards packaging. In the past
decade, labeling at the front of the package has been used to inform consumers about product origin
and the ingredient of the product, especially content that is related to positive health outcomes.
Nutrition and health claims (NHC) and taste claims (TC) are believed to be important for promo-
tion of food according to the study of Rik (eg. Rik & Michel, 2004) However, some studies note
that health-related information would positively affect the actual taste experiences when it is given
11alongside the presentation of the food product (Verbekea 2009). Other studies indicate that such
health-related information may increase the expect health perception of the product (Dean et al.,
2007, Lyly et al,, 2007, van Kleef et al., 2005 and van Trijp and van der Lans, 2007). But the im-
pact of such kind of information on customers willingness to actually start using the product or and
how it affects their purchase intentions is not clear. Deliza and MacFie (Deliza 1996) claim that
external product cues generate sensory expectation and influence the expectated sensory perception
of human food.
The information given by the food package, particularly when connected with commercial commu-
nications, was proven to have a major impact on consumer behavior (Grunert, 2002; Steenkamp &
Baumgartner, 1998). However, the effect of nutrition and health claims on expected product liking
is likely to depend on the carrier product (Barreiro-Hurlé, Gracia, & De-Magistris, 2010; Grunert
& Wills, 2007).
The commercial pet food label differs from a label directed towards human food in that the infor-
mation is not directed to the final consumer, the animal, but to the purchaser or veterinarian who
decides whether to purchase pet food. Given this situation, it is therefore considered to be of great
academic interest to discover the relationship between health-related claims on pet food packaging
and the consumers’ perception.
2.2 Nutrition and Health claims Regulations for pet food
The regulations governing pet food labeling in Europe are similar to that for human food in many
respects, but deviate significantly in some important ways. The EU Animal Products Regulations
(767/2009) applies primarily to the 25 member states of the EU and Switzerland, but does not cov-
er Norway. FEDIAF, which comprises the national pet food industry associations in the EU, has
published a labeling and marketing guideline. The purpose of the guideline is to improve labeling,
usage of claims, in particular the provisions on the presentation of labeling.
According to the EU Animal Products Regulations (767/2009), the claims made on feed materials
should be:
(i) objective and verifiable;
(ii) well understood by the user of the feed;
(iii) where purchasers are doubt about the claims, or at the request of the competent author-
ity, reference of such claims should be provided to the Commission.
12Health claims for dog food are usually brief. Examples include the terms “optimal growth”, “contain
calcium for strong, healthy bones and teeth” or “contain vitamin E”. Hence, according to Article
(767/2009), “Claims referring to treatment, curing or prevention of a disease are considered to be
medicinal claims and would cause a product to be medicinal by presentation”. Besides, a nutritional
adequacy statement on the information panel must substantiate nutrition claims on the principal
display panel. Claims which contains neither medicinal nor nutritional content, and which are con-
cerned with general well being, are not considered as Nutrition and Health claims (NHC). Taste
claims and general claims on quality are likewise not considered NHC.
2.3 Aroma and dog food choice
Some studies found that autobiographical memories evoked by smells more often reminds the sub-
ject of his/her earlier life event than those evoked by visual stimuli (Chu 2000). Peppermint (Metha
piperita) is increasingly accepted as a dietary supplement for human. For example, a dietary supple-
ment for digestive disorders (Sparks 1995). It has also been noted for its anti-parasitic medical
property, which may be an alternate solution in the treatment of dog’s diseases (Safe Herbs & Spic-
es 2014).
The major components of the peppermint essential oils is menthol, which has been demonstrated as
having an antioxidant effect (Yang S.A. 2010), plus inducing a sensation of freshness (Labbe 2009)
and being a stimulus that excites the trigeminal receptor (Green 2005). Moreover, Labbe suggested
a perceptual association between peppermint aroma and freshness (Labbe 2009). Peppermint and
related products were found in a huge array of catalogues of commercial pet care products like oral
care gel and functional pet food. In the present study, peppermint was chosen to stimulate health
related aroma. On the other hand, since beef aroma is widely accepted to be used both in food and
feed products, it was chosen to present a meaty aroma, in contrast with health related aroma.
2.4 The reaction of dogs
The results from previous studies (e.g. Woods et al. 2011) have showed that an expectation, created
by means of the information provided, has an effect on sweet taste perception. However, to the best
of our knowledge, relatively little research has been carried out on how being exposed to visual
stimuli of dogs reacting to food actually affects dog food buyers´ choice.
In Experiment 2, the reaction of 6 different dogs were recorded on video and later shown to the
participants by video player. Here, the purpose of it is to examine whether the reaction of the dog
13can alter the consumers expectations of the dog food, especially with regards to health and taste, as
well as the estimation of portion size and their willingness-to-pay.
3. Research methods
3.1 Research design
There are three major reasons for adapting within-subjects design for this thesis. First, the primary
interest of the research is to study the interaction effect of experimental factors. Second, more data
might be collected with fewer subjects to test and experiments can better mimic real-time condi-
tions. Third, studying multiple outcomes for each subject allows each subjects to serve as his/her
own control as between-subject variation is excluded from the error.
A typical consumer profiling experiment consists of: 1) a number of products with a set of attrib-
utes; 2) subjects of the experiment, who were considered to be assessors, judge the products using a
set of variables; 3) DVs. By combining systematically each factor and level according to two 22 de-
sign, 4 combinations were created. Samples were profiled in 3 replicates. Therefore 12 products
were presented to each assessor. When the factor combinations (products) have been determined,
there are essentially two possible ways to present them to the consumers. First, all factors combina-
tions are presented to all consumers. Second, different factors combination are presented to differ-
ent groups. The latter usually done in a systematic way using for instance an incomplete block de-
sign. The former of these alternatives is the simplest both to organize and to analyze by ANOVA
technologies. In the current study, the first strategy was used, as the number of products is not too
large. This strategy is also suggested to deal with consumer acceptance data (T. Næs et al. 2010,
Kuznetsova 2013). These types of factorial designs have been also applied to obtain sensory data in
literature (Andrew 2001, Labbe 2011). The overview of factors and the number of levels can be
seen from figure 2:
14Figure 2: Experimental models and factors
3.2 Statistics modeling and presentation of the hypothesis
This chapter will describe statistics models, dependent variables (DVs) and present a hypothesis for
the present study. DVs of Experiment 1 are: expected liking, expected health perception, expected
taste perception, portion size, WTP and acceptance. Whilst the five DVs of Experiment 2 are: ex-
pected liking, expected health perception, expected taste perception, portion size and WTP.
The question of interest in both studies is to see whether there are significant changes in the DVs
over different levels of factors and if the interactions of them influence the changes. The interaction
of this model is defined by Huyng as the average difference between the effects of first factor for the
two levels of the second factor (Huynh 1979). In this thesis the interaction of different levels of fac-
tors are taken in to consideration. For answering the question of interest, the most common method
to investigate this is to use ANOVA based on the mixed-effects model (Næs et al. 2010) Repeated
meausres in GLM package was previously conducted in some researches for dealing mix-effects
model(e.g. Næs et al., 2001).
Yijr = μ +αi + sj+ αsij +eijr (Model 1)
15In this mixed-design model(model 1), Yijr is modeled for dependent variable , αi and sj are two
within-subjects independent variables, and eijr is error term. Data were analyzed with SPSS package
version 22.0, using principles based on William (William 2007). In the present paper, repeated
measure model in GLM package has been conducted to examine dog food-related attitudes. The
mixed model can incorporate the 22 full factorial-design by applying repeated measure model. If we
consider the product as a unit for comparison, a one-way repeated measure model as be suitable.
Consider to measure the interaction effect, two-way or three way mixed model would be suitable.
3.2.1 Hypotheses for Experiment 1
Hypotheses of interest concern effects of dog food smell and claim in Experiment 1:
Hypothesis 1: The dog food aroma influence one’s expected liking, acceptance of smell, willingness-
to-pay, expected health perception and expected taste perception.
Hypothesis 2: The dog food aroma moderates the impact of package information on one’s willing-
ness-to-pay.
Hypothesis 3: The package information influence one’s expected liking, acceptance of smell, will-
ingness-to-pay, expected health perception and expected taste perception.
3.2.2 Hypothese for Experiment 2
Based on the theory mentioned above, the influence of the dog reaction may depend mainly on
connection attribute between dog owner and her/his dog in context of dog cohesion (strong vs.
weak ties).
In this regard, hypotheses of interest concern effects of dog response and claim in Experiment 2 are
stated next:
Hypothesis 1: The four different products are significant different regarding one’s expected liking.
16Hypothesis 2: Dog reaction video has significant impact on one´s expected liking, acceptance of
smell, willingness-to-pay, expected health perception and expected taste perception.
Hypothesis 3: Claim moderates dog reaction impact, regarding one’s expected liking, acceptance of
smell, willingness-to-pay, expected health perception and expected taste perception.
Hypothesis 4: Claim has significant impact on one´s expected liking, acceptance of smell, willing-
ness-to-pay, expected health perception and expected taste perception.
17II. Experimental part
4. Experimental overview
This chapter is dedicated to revealing two experiments by providing the reader with a clear view of
the experiment. Subchapter 4.1 gives the reader an overview of the materials used in this research,
followed by a description of the preparation process and an experimental procedure in subchapter
4.2 and 4.3. Recruitment and consumer panels are introduced in subchapter 4.4, followed by the
explanation of how the questionnaires were constructed in subchapter 4.5.
4.1.Experimental materials
1) Uncoated extruded dried animal food with 8% moisture content were obtained from FôrTek, a
feed research/product center at Norwegian University of Life Sciences.
2) Oksefond med rødvin (Beef fond. Brand name: Touch of Taste, Continental foods, Sweden)
3) Original JHP rödler olje (Peppermint oil, Arco Interpharma AS, Norway)
4) Color-printed package pictures in A4 size.
4.2 Preparation Process
4.2.1. Preparation of dog food samples
Dog food samples were obtained from FôrTek, an animal feed research/product center at
Norwegian University of Life Sciences. Being suitable for the aims of the current study, this
18uncoated dog food had 8% moisture content. Low moisture content increases the aroma absorption,
according to the feed manufacturing technology.
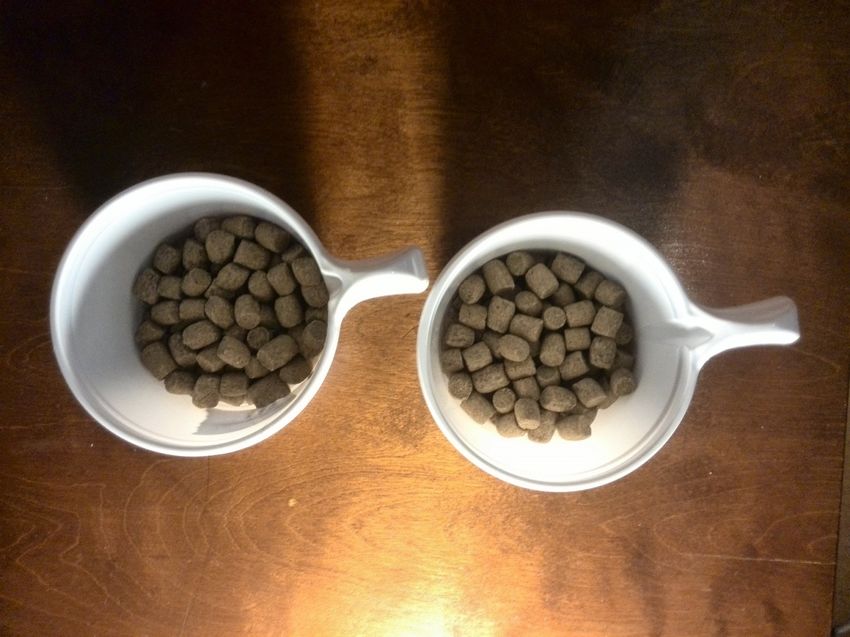
The simulated dog foods were then stored separately in preserver to avoid volatilization. Samples
were presented in plastic cups, containing approximately 100 grams of dog food, encoded with
three-digit numbers(Fig. 3).
Figure 3: Example for dog food samples. Left: dog food with peppermint oil; Right: dog food with
beef fond
4.2.2 Preparation of claims
Six pairs of high-quality color images were designed by Adobe Photoshop CS 6 13.0.1 and Auto-
desk SketchBook Pro 6. For each pair of packages, a label “New”, a recycle sign, an image of a dog,
a photo of the raw ingredients and a bowl of pellet dog food were identically designed. The above-
mentioned package elements were all of the same size and proportion to each other on the package
image. Also on a identical package background, both of the two claims(health-related claims/taste-
related claims) were applied. Such pairings of claims generated 6*2 unique package images in total,
further elaboration of which can be found in Appendix A.2. The package designs were printed on
white paper, which eliminated differences in tactile perception.
19Figure 4: Example for package image in pairs. Left: package with taste-related claim; Right:
package with health-related claim
4.2.3 Preparation of videos
The videos are designed in pairs to illustrate whether dogs accepting the dog food or not. The same
dog and background were presented within the pair (accepting/ not accepting). After videotaping
the dogs, these files were saved as *. wav files and were then placed into folders in random order.
These video files were played using VLC software during Experiment 2.
Figure 5: Screenshots of dog videos. Left: negative response; Right: positive response
204.3 Procedure of Consumer Study
The experiments of the present study were conducted during the period of 2nd – 29th April 2014, in
the Sensory Research Lab at Norwegian University of Life Sciences. To eliminate learning effects, a
two-weeks interval was imposed for participants attending both Experiment 1 and Experiment 2.
As temperature, sounds and lighting of the surroundings might influence the participants and thus
increase the random errors of the experiment, the sensory room used for this experiment was with-
out any disturbing factors such as traffic noise. The evaluations were performed with fluorescent
lights. Prior to the actual experiment, all the participants received the experiment guide beforehand
and were instructed to disregard the price information in Step A, as price might be a driver behind a
decision to purchase a given product (Senauer, 2001).
Paper questionnaires using in the current study were all self-administered. They were informed that
the experiment would take no more then 30 minutes to complete and were encouraged to finish all
the questionnaires. The final section of both experiment contained an online survey about health
consciousness. Upon agreement with respondents, their email addresses were obtained. The link of
the health consciousness questionnaire, which was unique for each respondent, was sent to the par-
ticipants after they finished the main experiments. In subchapter 5.3.1 and 5.3.2, different experi-
ment procedures were presented.
21Figure 6: Procedure of Consumer Study
4.3.1 Experiment 1 of Consumer Study
Each participant was tested individually. As shown in Step B (Fig. 6), each participant was given a
four-digit number, which is identified for both measurement, personal characteristics and health
consciousness questionnaires. A plastic cup with dog food and a package picture were presented
simultaneously before participant gave the assessments. The participants were asked to indicate
which of the 9-point-scale matched the descriptions or questions. To avoid learning effect, short
breaks were held between tests. Participants were allowed to observe and smell the dog food sample
but not allowed to eat.
A prepared test was introduced to the participant to familiarize the testing procedure before giving
samples in Step B. General information of the participant was obtained in Step C. Afterall, partici-
pants were reminded to check their emails for answering a follow-up health consciousness ques-
tionnaire. The health consciousness questionnaire was conducted separately from the main experi-
ment in Step D to avoid participant fatigue (Fig. 6).
22Except for one participant from Experiment 2, all other participants completed their health con-
sciousness questionnaires within two weeks.
4.3.2 Experiment 2 of Consumer Study
Participants were seated facing the laptop monitor while video clips were presented on a laptop
monitor using VLC software. A video clip and a package picture were presented simultaneously.
The experimenter initiated the task with the following instructions: Now we are going to do a test.
Look at the screen (experimenter points to the laptop screen). Later you will see some videos of
dog. Try to answer the questionnaire when you have received package image and watched the vid-
eo. Can you click the “play” button of the video player when you are given another package im-
age?
As can be seen from the Figure 6, participants assessed the trail in similar way of Experiment 1. In
Experiment 2, instead of giving dog food samples, videos were displayed in front of the participants.
The trail order was randomized. To avoid learning effect, participants were given a one-minute
short breaks between trails. Paper questionnaires were self-administered during Step C (Fig. 6). To
maximize response rate, participants were reminded to follow up an online health consciousness
questionnaire. Health consciousness of participant was recorded by completing of questionnaire
concerning their health consciousness in Step D.
4.4 Recruitment and established criteria of consumer panels
Participants (n=50) were recruited from the Akershus country area and were screened by the follow-
ing established criteria: 1) having at least one dog in household; 2) taking personal responsibility for
commercial dried dog food purchases for at least three months; 3) living in Akershus, Norway for
more than 5 years; 4) being older than 17 years and 5) not having any type of nose or eyes disease.
Individuals were recruited via the offline recruitment method (e.g. random walk or street contact
procedures). They were allowed to take part in one or both two experiments. Supervisors approved
the experiment protocol prior to the experiments.
4.5 Questionnaire construction2
4.5.1 Evaluation Questionnaire
When developing a questionnaire, items or questions are generated that require the respondent to
respond to a series of questions or statements. Likert-type questionnaires are the most commonly
used questionnaire measurement within research design to measure levels of agree-
ment/disagreement (Bowling 1997). A Likert-type scale assumes that the strength/intensity of ex-
23perience is linear, i.e. on a continuum from strongly agree, and makes the assumption that attitudes
can be measured. Regarding the advantage of more response categories and potential risk of using
shorter scale, which is found by Park(Park. J.Y. 2007), the measures were assessed on a nine-point
category scales. A six items evaluation questionnaire using simplified English was constructed for
Experiment 1, while for Experiment 2, the items number were reduced to five.
Dependent variables were measured by assessing the agreement/disagreements with regards to each
item.
For Question 1, the lowest extreme 1 indicated “strongly dislike” and the highest extreme 9 indicat-
ed “strongly like”. Similarly, Question 2, 3 and Question 6, were constructed to know the expected
health and taste perceptions and expectations and human acceptance of the respondents. These
questions were assessed by statements: “I think this dog food is very healthy.”, “I think this dog
food is very tasty.” and “This smell would be suitable to use in a similar snack food product for hu-
mans.” To assess the willingness-to-pay variables, Question 4 “What is the maximum price you are
ready to pay for 1 kg of such kind of dog food?’’ was asked. Participants chose the price around 30
krone/kg, which is a typical price for purchase in small bags in Norway. Question 5 assessed the
estimated portion size by “If your dog would take a bowl of this dog food, how many grams in the
bowl would you expect?” (see Appendix A.4).
4.5.2 Personal Characteristics Questionnaire
Personal characteristics questions were developed to investigate demographic background such as
education, gender and age, as well as location of their living area. Gender, age and education are
commonly considered to affect decision-making in previous studies (Hatala 2000, Hawkins 1999).
Considering the samples were collected from three different residential regions, these residential
regions were added to the general information survey.
Nose and eye diseases were assessed with questions screened participant by this established criteri-
on. The study also attempted to classify consumers’ associations with dogs based on whether the
dog is owned by themselves, their family, or others. The life stage of the participants’ dog was also
measured. (Appendix A.4).
244.5.3 Health Consciousness Questionnaire
To measure health related attitudes, all questions adopted come from previous studies (Roininen, K.
2001, Baixauli 2008). Particularly, the survey put emphasis upon the analysis of consumers’ motiva-
tion and health consciousness during their selection of food products. The same personal code was
used in the Evaluation Questionnaire, the Personal Characteristics Questionnaire and the Health
Consciousness Questionnaire for each participant. The Question 5 was a reverse-scoring item, by
asking that . The participants were asked to indicate their agreements with 14 health statements in
an online survey and their answers were written into a .txt document in the server according to the
corresponded personal code. The questionnaire was indicated on a scale of 1-9, with 1 representing
“not agree at all” and 9 representing “totally agree” (Appendix A.5).
5. Data Analysis
This chapter is divided into four subchapters. First subchapter is a brief description of the proce-
dures used to examine and screen the data for hypothesis testing. Second subchapter details the
method problems. Third subchapter aims to clarify the respondents´ profile, followed by the forth
subchapter, which presents the Results of Data Analysis.
5.1 Preparation of Collected Data
During the development of questionnaires, each item of questionnaires was assigned a scale of
measurement and a code. Coding was primary used to facilitate the data analysis procedure.
Furthermore, the data were double-checked for accuracy of data input before the data analysis. For
the interested categorical variables, dummy variables, such as gender, were generated to identify the
nominal variables. Original datasets store repeated observations on a sample of subjects in “one sub-
ject per row” format. Data restructure has been doen to enable they in separate rows before MIXED
Procedure. The person who owns dog was coded as “Owner1” whilst the other two categories had
only several members, they were summed to form a new group “Owner 2”. The scores of reverse-
scoring item in health related survey were recoded before analysis of the data.
After that, assumptions of ANOVA were first verified using Levene´s test. P-Value below 0.05 we-
re considered significant for all analyses conducted. Mixed model of SPSS package can be
appropriate for analysis. Then the interactions pooled across different factors are presented.
25Mauchly’s Test of sphericity can then be enforced (Huynh 1979), but because in this thesis, factors´
levels are no more than two, so the sphericity test is not necessary.
The analysis involves a test of the interaction between two factors. If no interaction was found, the
main effect will be reported. In the situation of interaction found, the plot of interaction was pre-
sented.
5.2 Method Problems
In order to reduce method problems two particular method problems must be considered.
5.2.1 Reliability
According to Robson (2002) there are four threats to the reliability of a research. The first one is
that the participants or subjects´ answers may vary depending on different times when participants
have different moods. To eliminate this, the experiments took place on a time, which fits the partic-
ipant best. The second threat is the subject or participant bias which means that the respondents
may give answers that an examiner wants to hear or give the socially desirable response. To avoid
this, the experiments were conducted anonymously which means that the participant should not be
worried about the other people would recognize them. Phrasing of questions has been taken into
careful consideration during questionnaire development to maximize internal validity.
On the other hand, academics experts reviewed the questionnaires beforehand to ensure clarity in
the questions. In this way, the above-mentioned threats were controlled. The third and fourth
threats are observer bias and observer error.
The author of this paper had made clear rules about the experiment procedure and practiced to give
samples to participants before the experiment conducted. . Cross-validation of the dataset was done
by splitting the data in two subsets and then test on sample. According to Green and Sriniva-
san(1978) this validation can be described as reliability testing of the model.
5.2.2 Validity
According to Saunders, validity implies the degree to which a study correctly shows the particular
theory that the researcher is trying to measure (Saunders,2007). External and internal validity
should be a major concern for researchers. Therefore, all studies attempt to maximize both their
internal and external validity. The most common threat to internal validity is selection bias. By ran-
domly assigning participants to both experiment, selection bias are reduced. In order to strengthen
internal validity, the population of the present study was limited to Akershus area of Norway.
26The result of this thesis can only be used in this situation and specific studies. In other
words, it is necessary not to generalize the out come of the end result. The result of present
study can not be generalize to all pet owners in Norway because the sample is small to rep-
resent all the actual pet food buyers.
5.3 Respondent profile and descriptive statistics
Descriptive statistics, respondent profile and the correlation for all relationships are reported in this
subchapter.
5.3.1 Demographics of the participants
Participant demographics are firstly presented in table bellowed (Table 1). All together, 50 partici-
pants entered both experiment. One participant had missing data over half of the questionnaires.
During data scanning, an outlier was found with one participant in Experiment 1. Another person
in Experiment 2 have missing data on health consciousness questionnaire, leaving N = 24 for Ex-
periment 2.
Table 1: Demographics of the participants in the consumer study: gender, age, education level,
living area, overweight, age of dog owned
Experiment 1 Experiment 2
Gender Total 24 24
Female 16 15
Male 8 9
Education Primary education 1 0
level
Secondary education 6 6
Bachelor education 12 12
Master´s or higher education 5 6
Age of 60 7 7
Living area Ski 4 3
Ås 12 12
27Drøbak 8 9
Over- Yes 2 1
weight
No 18 21
Don’t want to tell 3 2
Dog own- Own dog themselves 11 12
ership
Own by the whole family 8 7
Dogs of other family members 5 5
Age of dog Puppy 8 13
owned
Adult 12 3
Senior 4 8
For Experiment 1, the respondents were mostly female consumers (n=16), compared to male re-
spondents 33.3%. Most of the respondents were from Ås, 50% (n=12). A good percentage of re-
spondents is represented by the category of bachelor education (50%), whereas the percentage of
master education or higher is 20.8% (22). The majority of the participants were over 40 years old
(62.5%). Descriptive analysis by overweight status of participants showed that 75% (38) of the re-
spondents were reported not to be overweight. 45.8% (n=11) of participants owns dog themselves,
followed by 33.3% (8) whose family own dogs. 20.8% of respondents described themselves as their
other family members owned dogs. Most of the dogs were adult dogs, while 33.3% of their dogs
were puppies and 16.7% of them were senior dogs. For experiment 2, 50% of respondents described
themselves as he own dog himself. Most of the respondents were over 40 years old (16). Most of
their dogs were puppies (54.17%), while 12.5% of their dogs were adult dogs and 33.3% of them
were senior dogs.
5.3.2 Health consciousness correlation
Overall, the Cronbach’s alpha was calculated to determine the internal consistency of the statements
of health consciousness. All the items were highly correlated; therefore the participants’ answers to
the statements about health consciousness were averaged.
28In order to assess associations between health consciousness and expected health perception, ex-
pected liking and WTP, Spearman correlations were calculated between the averaged health con-
sciousness scores of each participant and the above-mentioned outcomes.
5.4 Results and Finding
5.4.1Product comparison: expected liking
Therefore, before we perform statistics analysis, aggregate procedure was necessary done for obtain
summary statistics for dependent variables for each product combination. A simple one-way
repeated measure analysis was done for both experiments on expected liking. For Experiment 1, we
observed that one participant rated extremely high score for peppermint aroma samples, which
resulted in normality problem with the dependent variables. According to the five assumptions
before repeated measure analysis, there should be no significant outliers in the related groups. Even
when we have outliers, we have some options to deal with outliers. For example, the score of
extreme this participant was filtered out. To check whether the distributional assumptions of
ANOVA were met, normality was tested using shapiro-wilk test over the aggregated data of all
observed variables under both Experiments. The result shows that distribution of the dependent
variables is not significantly different from normality after the outlier is deleted. Values below 0.05
were considered significant for all analyses conducted. Appendix A.1 shows a part of data after
reconstruction. A simple one-way repeated measure was conducted for both experiments on
expected liking. For Experiment 2, in order to determine which means are significantly different, we
need to instruct SPSS to compare main effects. Result is shown as followed:
Expected liking!
Prod 1!
Prod 2!
Prod 3!
Prod 4!
0! 2! 4! 6! 8!
Figure 7 : Expected liking scores for 4 products in experiment 2. Product 1 (health claims and negative
video); Product 2 (taste claims and possitive video); product 3(taste claims and negative video); product
4(taste claims and possitive video).
29Drivers of expected liking shows that, the most liked sample was the combination of health claims
and beef aroma , whilst the least liked one was sample with health claims and peppermint aroma.
Since the significant probability is less than 0.5, we also run pairwise comparisons among different
products. The result of pair comparison is shown in Table 2.
Table 2. Result of pairwise comparisons
From this table we can see that the product 1 is significantly different from all the other products.
But product combination 2 is not significantly different when comparing with product 4. Mauchly’s
Test of sphericity can then be enforced to chech the sphericity. Since the p value is 0.031, we can-
not assume that the variances between the four sets of scores are equal. F-value were shown as:
30Measure: Expected_liking
Type III Sum Mean Partial Eta
Source of Squares df Square F Sig. Squared
pSphericity As-
184.496 3 61.499 61.579 .000 .728
rsumed
oGreenhouse-
184.496 2.274 81.115 61.579 .000 .728
dGeisser
Huynh-Feldt 184.496 2.537 72.712 61.579 .000 .728
Lower-bound 184.496 1.000 184.496 61.579 .000 .728
ESphericity As-
68.911 69 .999
rsumed
rGreenhouse-
68.911 52.313 1.317
oGeisser
rHuynh-Feldt 68.911 58.359 1.181
(Lower-bound 68.911 23.000 2.996
p
r
o
d
)
Table 3. Tests of Within-Subjects Effects
Simiarly, the result of one-way repeated measure of Experiment 2 shows as followed:
5.4.1 Factors impact on expected liking, taste expectation, health expectation and WTP
Health information is one of the extrinsic factors/cues that has been demonstrated to affect con-
sumer choice. The health claims enhance smell effect on taste expectation of dog food. The claims
of health influence consumers’ health expectation differently between different groups. Smell effects
between different health conscious groups moderates by health claims in terms of Willingness-to-
buy. Suggestions to the dog food retailer can be that the health claims should be placed on the
package to enhance smell, and further enhance sales. In some other studies, it has been suggested
that labels or any information which given with the product will most likely affect consumer´s ex-
pectation of the product(Isen, A. M., 2004; Kihlberg, I.,2005).
Effects Lik- Expected Expected WTP Por- Smell acceptance
ing health taste tion
31P-value Claims 0.861 0.025 0.048 0.512 0.635 0.051 Aromas 0.060 0.033
individual differences between the judges of different smell information than visual information,
which is suggested by some previous food studies (Garmt 2004, Nancy 2004)

6. Discussion

6.1 Conclusion and implications
This research contributes to the understanding of how factors can influence dog food choice. First-
ly, descriptive analysis showed the some tested dog food samples with different combinations (pro-
files) were different from each other. Secondly, the impacts of three design factors were analyzed by
two-way repeated measure ANOVA.

The impacts of these individual products on expected liking are significant for Experiment 1. It is
worth noting that peppermint smell results in lower expected health, and acceptability for human
usage than beef smell. One possible reason for this poor acceptance of smell could be that the dog
food industry have been using animal origin by-product for a long time. The SD of peppermint ac-
ceptance for human usage is larger than the SD of claim information, which agrees with the previ-
ous study of(Di Donfrancesco 2012), which is aroma impact on product experiences. Another rea-
son for low acceptance regarding peppermint aroma could be that it may lead the dog owners to
associate plant smell with nutritionally unbalanced foods given that dogs are carnivorous.

Interestingly, the result suggests that the negative reaction of dog interact with the health claims,
since the consumer may still be interested in buying the product because of the health-related
claims, regardless of the negative reaction of dog. The result also reveal that the consumer consider
beef smell to be healthier than peppermint smell. However, the claims also moderates the impact of
smell on willingness-to-buy, similar to the claims moderates the impact of negative reaction of dog.

The second study indicated that consumer´s liking was most influenced by the dog reactions, when
comparing with health claims. From a marketing perspective, the ability to communicate the health
benefits of dog foods is a key aspect for the success of dog foods marketing. The results reveal a pos-
itive correlation between health awareness and consumer expected health perception. In addition,
the empirical findings suggest that consumers who are guided by the health information are most
likely health conscious consumers (Nancy et al 2004).

One of the key findings of this study is that the claims is suggested as one of the significant factor
that moderates WTP decision making. Peppermint aroma seems to have a negative relation with

                                                  33
pet owner´s liking. This may be related to that dog owners are generally more accepting “meaty
aroma” than healthy aroma, which is consistent with the results from other pet food consumer stud-
ies (Di 2012). But the same was not seen from the result of Experiement 2. In general, peppermint
aroma can also play an important role in expected dog food liking. Interesting, the presence of
health claims seemed to increasing liking by consumers of peppermint aroma. Based on the present
study, dry dog food products will be well liked by consumers if the dog has a positive reaction.
6.2 Suggestions for future research
The paper shows the first empirical evidence about the relationship between dog food packaging
and its impact on purchasing behavior. Because of the sampling criterion, the finding cannot be eas-
ily generalized. Since data collection was limited to Akershus area, our finding may not be applica-
ble to dog owners in different area, with different cultural backgrounds. More research might be
done in mapping the impact on purchasing behavior along multiple groups and locations.
34Appendices
Appendix A.1 - Restructured Data for Analysis: Four case for each subject.
35Appendix A.2 - Pairs of claims selected for package design
!
Pairs of claims selected
“Your dog will love this taste”! “Your dog will be much healthier”!
“Real Taste. Real Excitement”! “For Good Health Of your dog”!!
“100% great taste for your dog”! “100% precisely balanced nutrition”!
“For dogs with an appetite for life”! “Omega-3 fatty acids can improve heart
health”!
“Superior & Tasty”! “Protein & Healthy”!
“So delicious”! “So healthy”!
!
36Appendix A.3 - Personal Characteristics Questionnaire
Personal code: ___________________
This questionnaire deals with the general information of you.
Please complete the questionnaire in its entirety. It should only take a few minutes. To answer,
please indicate your selection by circling. Make only one selection per question. Thank you!
!
1. Please indicate your gender: Male Female
2. Please indicate your education level:
Primary education level or lower.
Secondary education.
Bachelor´s education.
Master’s lever or higher education.
Others: __________________________
3. How old are you?
Younger than 18
Between 19 and 29
Between 30 and 39
Between 40 and 59
Older than 60
4. Where do you live in Norway? You can write down the name of the town or Post code.
Post code(4 digits)
Name of the town ___________________________
5a. Do you have nose conditions or eye diseases? Yes No
37You can also read